Article

Construction of SrTiO3–LaCrO3 Solid Solutions with Consecutive Band Structures for Photocatalytic H2 Evolution under Visible Light Irradiation

1
International Research Center for Renewable Energy (IRCRE), State Key Laboratory of Multiphase Flow in Power Engineering (MFPE), Xi’an Jiaotong University (XJTU), 28 West Xianning Road, Xi’an 710049, China
2
Key Laboratory of Subsurface Hydrology and Ecological Effects in Arid Region, Ministry of Education, School of Water and Environment, Chang’an University, Xi’an 710064, China
3
State Key Laboratory for Physical Chemistry of Solid Surfaces, College of Chemistry and Chemical Engineering, Xiamen University, 422 Siming South Road, Xiamen 361005, China
*
Author to whom correspondence should be addressed.
These authors contributed equally to this work.
Catalysts 2022, 12(10), 1123; https://doi.org/10.3390/catal12101123
Submission received: 15 August 2022 / Revised: 21 September 2022 / Accepted: 23 September 2022 / Published: 27 September 2022
(This article belongs to the Special Issue Photocatalysis for Energy Transformation Reactions)

Abstract

:
SrTiO3–LaCrO3 continuous solid solutions with LaCrO3 content ranging from 0.00 to 1.00 were prepared via a polymerized complex method. The light absorption ability of SrTiO3 was improved by the consecutive tuning of the bandgap upon the introduction of LaCrO3 (up to 570 nm). The solid solutions exhibited significantly enhanced photocatalytic activities for H2 evolution under visible light irradiation, with an optimized H2 evolution rate of 1368 μmol h−1 g−1 obtained when LaCrO3 content was 0.10 (with 1 wt% Pt as cocatalyst), corresponding to an apparent quantum yield of 3.68% at 400 nm. Supported by comprehensive characterization, the improved photocatalytic performance was attributed to the simultaneously adjusted conduction band and valance band originating from the hybridization of Cr 3d, Ti 3d and O 2p orbitals, as well as the accelerated separation and migration of photogenerated charge carriers derived from the distortion of TiO6 octahedra.

1. Introduction

Carbon neutrality has received more and more attention in recent years due to the increment of atmospheric carbon dioxide during the conventional energy utilization process in the past development of human society [1,2,3]. Hydrogen, a carbon-free energy source, has been widely considered as one of the most promising energy carriers for future energy systems. However, the current hydrogen production still relies heavily on the decomposition of fossil fuels, which is detrimental to carbon neutrality. Photocatalytic water splitting for hydrogen production is one of the most ideal approaches to converting inexhaustible renewable solar energy into green hydrogen without carbon emission [4,5,6,7]. Over the past decades, tremendous efforts have been devoted to the development of efficient, stable and low-cost photocatalysts. Although significant advances have been achieved [8,9,10,11,12,13], photocatalytic hydrogen production from water splitting at the current stage is still far from practical large-scale application [14].
SrTiO3 has been considered an ideal candidate for photocatalytic hydrogen production due to its stable ABO3 perovskite structure and suitable band structure for overall water splitting [15,16,17]. Reports have demonstrated highly efficient photocatalytic activity from SrTiO3 under the illumination of the UV region of the solar spectrum [18,19,20]. However, the relatively large bandgap (~3.2 eV) severely restricts its utilization with visible light, which accounts for ~47% of the energy from the solar spectrum. Accordingly, extending the absorption range of SrTiO3 plays a vital role in improving its photocatalytic performance. Doping has proved to be an effective approach for SrTiO3, and the doping effects of Rh, Ru, Ir, Cr, Ni, Er, etc., have been investigated, exhibiting different extents of improvement on visible-light-driven hydrogen production [21,22,23,24,25]. Nevertheless, doping content is generally limited, and the breaking of symmetry on the stable ABO3 structure requires co-doping that, in turn, limits the further extension of visible light utilization [26,27]. Beyond that, dye-sensitized SrTiO3 has also seldom been reported for visible-light-driven hydrogen production [28,29].
The construction of a solid solution has proved to be an effective strategy to extend the absorption range of wide bandgap photocatalysts [30,31,32]. As for SrTiO3, solid solutions constructed with AgNbO3 and BiFeO3, respectively, have been reported to exhibit oxygen production activity under visible light irradiation [33,34], while reports on the construction of SrTiO3-based solid solution photocatalysts for visible-light-driven hydrogen production are quite limited [35,36], and the activities are unsatisfying. Our previous work demonstrated that LaCrO3 could serve as a potential alternative for the construction of a SrTiO3-based solid solution for efficient hydrogen production [37,38,39,40,41].
Herein, a series of continuous SrTiO3–LaCrO3 solid solutions with LaCrO3 content ranging from 0.00 to 1.00 were synthesized via a polymerized complex (PC) method. The as-prepared solid solutions were systematically investigated for their physicochemical properties and photocatalytic performance based on various characterizations. This work could offer further insight between band structure and components of perovskite solid solutions.

2. Results and Discussion

2.1. Structure Characterization

The X-ray diffraction (XRD) patterns of the as-prepared solid solutions are shown in Figure 1a, in which all the samples possessed analogous peaks, demonstrating the successful preparation of continuous SrTiO3–LaCrO3 solid solutions (expressed as SrLaTiCrO-x in later discussion, x refers the content of LaCrO3) without impurities. To be specific, SrTiO3 exhibited a cubic phase perovskite structure (JCPDS No. 01-079-0174), while LaCrO3 possessed an orthorhombic phase perovskite structure (JCPDS No. 01-089-8770). As for the SrTiO3–LaCrO3 solid solutions, the microstructures ranged from cubic perovskite to orthorhombic perovskite structures with increasing LaCrO3 content [38]. Moreover, it was observed in Figure 1b that the detailed XRD patterns of the as-prepared samples around the strongest diffraction peaks corresponded to (121) planes shifted toward higher angles gradually with increasing LaCrO3 content. This was because the ionic radius of La3+ (1.032 Å) is much smaller than that of Sr2+ (1.180 Å) at A site despite the slightly larger ionic radius of Cr3+ (0.615 Å) than that of Ti4+ (0.605 Å) at B site [42]. It should be noted that such a peak shift is a common phenomenon in solid solutions due to the different ionic radiuses at the same sites and could be acknowledged as proof of the successful construction of solid solutions. In addition, the tolerance factor of SrTiO3 (1.0016) was larger than that of LaCrO3 (0.969), demonstrating that the construction of the SrTiO3–LaCrO3 solid solution would induce the distortion of crystal structure, thereby resulting in the peak shift. Notably, the PC method was employed in this work to avoid the leakage of metallic elements and guarantee the successful fabrication of solid solutions with a high content of LaCrO3. The solid solution presented herein was not fabricated using the traditional hydrothermal method because the high concentration of Cr in aqueous solution would have inhibited the growth of crystals and could not be incorporated into the crystals under mild conditions [37].
The morphologies of typical samples were observed by scanning electronic microscopy (SEM), and the images are shown in Figure 2. SrTiO3 was composed of irregular block structures aggregated with polyhedral nanoparticles, and the size ranged from 200~500 nm (Figure 2a). On the contrary, LaCrO3 exhibited relatively larger irregular spherical particles with sizes of 1~3 μm (Figure 2b). The SEM images with higher magnification of pure SrTiO3 and SrTiO3–LaCrO3 solid solution with a LaCrO3 content of 0.10 (labeled as SrLaTiCrO-0.10 in later discussion) are shown in Figure 2c,d, respectively. It was observed that SrLaTiCrO-0.10 exhibited analogous morphologies with that of pure SrTiO3, indicating that the formation of the solid solution had a limited influence on the micro-nanostructure of the SrTiO3 photocatalyst.
In addition, the transmission electron microscopy (TEM) and selected area electron diffraction (SAED) pattern images of the as-prepared samples were obtained to analyze their crystal structure and are shown in Figure S1. As shown in Figure S1b, the sizes of the SrTiLaCrO-0.10 nanoparticles were around several hundred nanometers, which was consistent with the results obtained from the SEM images. In addition, SrTiO3 possessed a lattice spacing with a distance of 0.276 nm, which could be related to its (110) plane [43]. In contrast, the lattice spacing distance for the (110) plane of SrTiLaCrO-0.10 exhibited a slight decrease to 0.274 nm. The decrease in the lattice spacing distance could be attributed to the incorporation of LaCrO3, which was in good agreement with the XRD results that indicated the peak shifted toward a higher angle with the increase in LaCrO3 content. In addition, the SAED pattern of SrLaTiCrO-0.10 was obtained, and the sharp diffraction spots demonstrated its single-crystalline characteristic, even though it exhibited an overlap of different diffraction lattices owing to the irregular block structures aggregated with polyhedral nanoparticles.

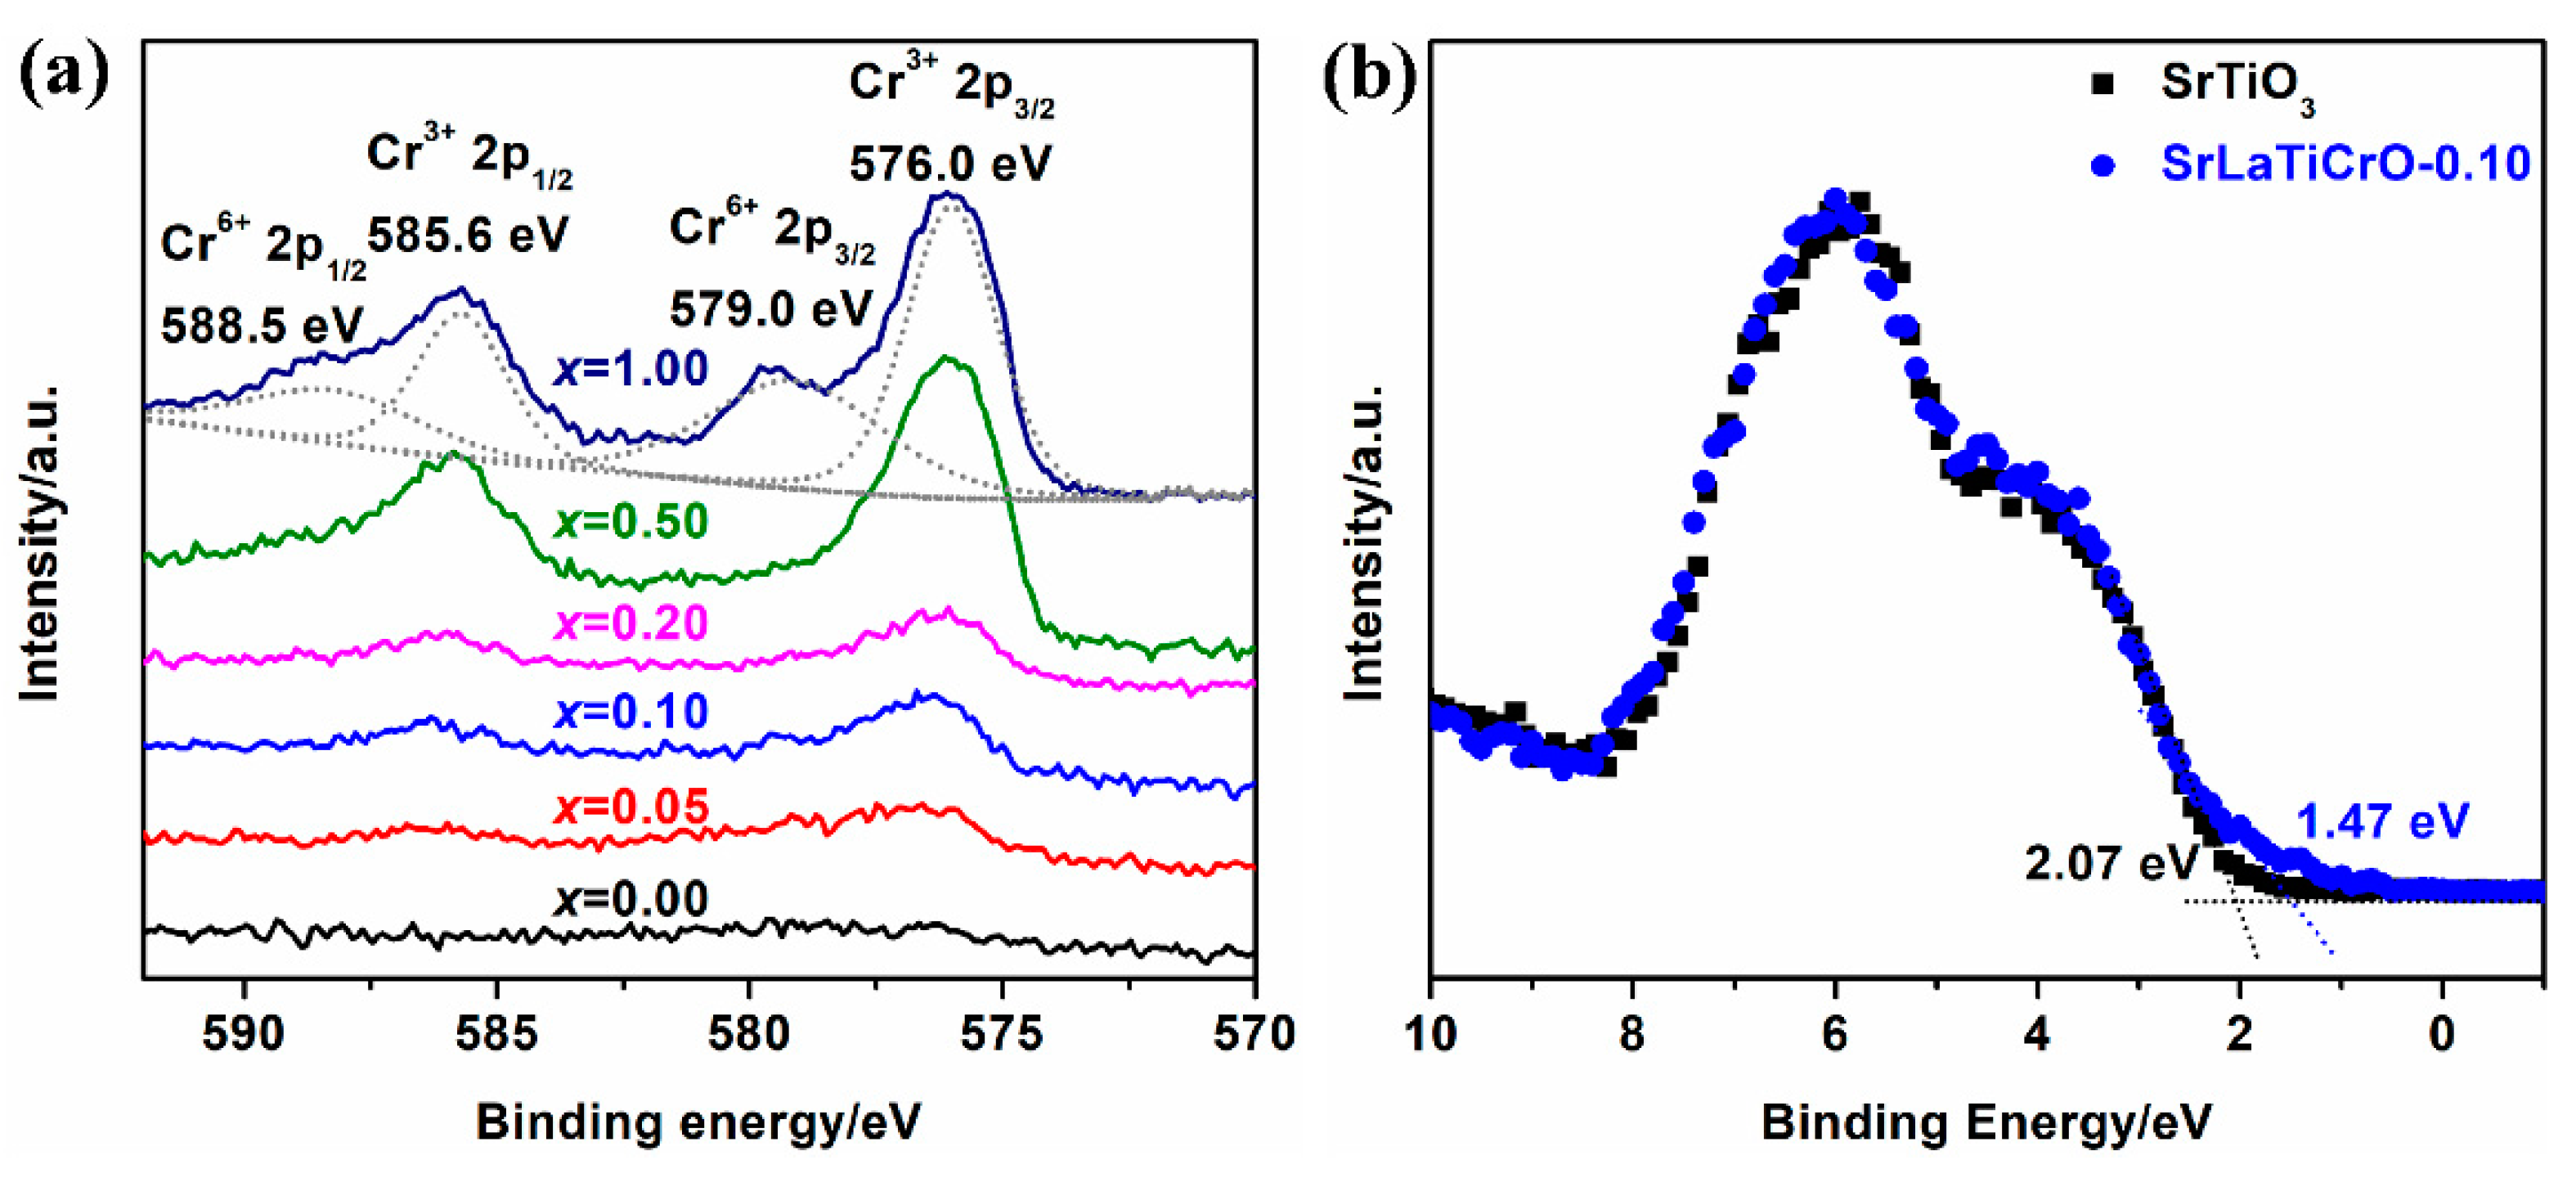
2.2. Chemical Composition and State

To investigate the surface chemical compositions and states of the as-prepared samples, X-ray photoelectron spectroscopy (XPS) measurements were carried out, and the results are shown in Figure 3. It is widely acknowledged that the Cr element plays a vital role in the broadening of the visible light response [44]. To disclose the contents and chemical states of Cr in SrTiO3–LaCrO3 solid solutions, high-resolution XPS spectra of Cr 2p orbitals were collected and are shown in Figure 3a. No signal of the Cr element was observed in pure SrTiO3, while the Cr orbitals of LaCrO3 were divided into four components at 576.0, 585.6, 579.0, and 588.5 eV corresponding to the 2p3/2 and 2p1/2 orbital of Cr3+ and Cr6+, respectively [45]. Generally, the Cr6+ species are considered trapping centers for charge carriers, thus resulting in the poor photocatalytic performance of pure LaCrO3 [37]. As for the SrLaTiCrO-x solid solutions, all samples exhibited only two peaks ascribed to Cr3+ orbitals, and the peaks increased with the increment of LaCrO3 contents. The absence of Cr6+ could be attributed to the co-incorporation of La3+ and Cr3+, which was beneficial for the charge balance of perovskite solid solutions.
The XPS valence band (VB) spectra of SrTiO3 and SrLaTiCrO-0.10 are shown in Figure 3b. The intercept of the tangent line on the valence band spectrum in the low binding energy region could reflect the relative energy level of the valence band minimum (VBM). As obtained from the VB curve, the VBM of SrLaTiCrO-0.10 shifted toward a lower energy level by ~0.60 eV, which could be ascribed to the relatively less positive VBM on LaCrO3 content and further demonstrated the successful construction of the SrTiO3–LaCrO3 solid solution.

2.3. Optical Properties and Band Structure

The optical properties of the as-prepared samples were measured by UV–Vis spectra, as shown in Figure 4a. SrTiO3 could only absorb the UV light irradiation and possessed an absorption edge at around 380 nm, corresponding to a bandgap of ~3.30 eV, which was well matched with a previous report [46]. Separately, LaCrO3 exhibited two prominent absorption edges at around 450 and 600 nm, as previously reported, which could be ascribed to the transition of O 2p-Cr 3d t2g and Cr 3d t2g-Cr 3d eg, respectively. Compared with the pure SrTiO3, the solid solutions with both SrTiO3 and LaCrO3 contents exhibited gradually red-shifted absorption edges with the increment of LaCrO3, demonstrating the effective extension of light response by the incorporation of LaCrO3 content into the SrTiO3 structure to form new energy bands. It was worth noting that all of the solid solutions exhibited intense band-to-band absorption, again indicating the successful formation of the solid solution instead of La, Cr co-doping. More specially, the light absorption edge for the as-prepared SrLaTiCrO-x exhibited a gradual red-shift up to 570 nm with the increase in LaCrO3 content, indicating that the band structures could be adjusted consecutively by constructing all-component solid solutions. Furthermore, an absorption tail above 700 nm was observed and enhanced gradually with the increase in LaCrO3 content, which could be attributed to the incremental surface states and defect levels [47].
The band structures of the as-prepared samples were analyzed by combining their light absorption properties and electrochemical results. Tauc plots and the Kubelka–Munk method are widely used to calculate the actual bandgap of semiconductors [37,48]. Figure 4b displays the Tauc plots for the bandgap analysis of SrTiO3 and SrLaTiCrO-0.10. Through calculation using the Kubelka–Munk method, the bandgap of SrTiO3 and SrLaTiCrO-0.10 were determined as 3.30 and 2.37 eV, respectively. Figure 4c,d displays the Mott–Schottky (M–S) curves of SrTiO3 and SrLaTiCrO-0.10, from which the flat band potentials of the two samples were determined as −1.22 and −0.90 V, respectively. As for the typical n-type semiconductor, the flat band potential was estimated as 0.1~0.2 V (taking 0.1 herein), which less negative than the conduction band maximum (CBM) and has been widely used to determine its conduction band position [49,50,51]. Therefore, the CBM of SrTiO3 and SrLaTiCrO-0.10 was determined to be −1.32 and −1.00 V, respectively. Given the above results on the bandgaps, the corresponding VBM was determined to be 1.98 and 1.37 V, respectively, for SrTiO3 and SrLaTiCrO-0.10. The difference in the VBM for SrTiO3 and SrLaTiCrO-0.10 (~0.61 V) was almost the same as that obtained from the XPS VB spectra, demonstrating the feasibility of both characterization techniques. Therefore, both the conduction band and valence band of SrTiO3 were modulated by the introduction of LaCrO3 content, demonstrating the effect of solid solution construction.

2.4. Photocatalytic Performance

The photocatalytic activities of the as-prepared solid solution samples were evaluated, and the results are shown in Figure 5. No H2 was detected in the absence of either photocatalyst or light irradiation, thereby excluding the possibility of photolysis as well as non-photocatalytic effect (e.g., mechanocatalysis). Due to the wide bandgap, SrTiO3 was incapable of utilizing visible light and showed negligible H2 evolution under visible light irradiation. On the other hand, owing to the weak driving force for reducing H2O to H2 originating from the relatively low CB level, LaCrO3 showed only a trace amount of H2 evolution, although it was able to absorb visible light up to 600 nm. In contrast, the as-prepared SrTiO3–LaCrO3 solid solutions with both members exhibited noteworthy H2 evolution under visible light irradiation, and when the LaCrO3 content was 0.10, an optimized H2 evolution rate of 1368 μmol h−1 g1 was obtained. On the basis of the photocatalytic H2 evolution test, the construction of the solid solutions between SrTiO3 and LaCrO3 was demonstrated to be an effective strategy to exploit novel visible-light-driven photocatalysts for H2 evolution.
In addition, the apparent quantum yields (AQYs) of the SrLaTiCrO-0.10 sample for H2 evolution were evaluated at different wavelengths. It was observed that the AQY profile at 400 and 420 nm was consistent with the optical absorption, indicating that the photocatalytic H2 evolution reaction was indeed driven by the incident photons. As for the AQYs at or above 450 nm, the AQY profile was slightly lower than the UV–Vis absorption spectrum of SrLaTiCrO-0.10, which could be attributed to the relative lower energies of long-wavelength photons and the easy recombination of corresponding charge carriers from bulk to surface of the photocatalyst. Moreover, the UV–Vis spectrum for the SrLaTiCrO-0.10 sample after the photocatalytic H2 evolution test was also obtained, and a slight absorption increase was observed, which could be ascribed to the photodeposition of the Pt cocatalyst onto the surface of the photocatalyst, thus resulting in the grey color of the sample [52].
To evaluate the photocatalytic stability of the as-prepared solid solutions, cyclic tests were carried out. As shown in Figure 5c, the H2 evolution rates of SrLaTiCrO-0.10 exhibited an insignificant decrease after three cyclic tests, implying the excellent photocatalytic stability of the SrTiO3–LaCrO3 solid solutions prepared by the PC method. In addition, the XRD patterns for SrLaTiCrO-0.10 before and after photocatalytic H2 evolution remained identical (Figure 5d), which also demonstrates the stability of the as-prepared solid solutions.
It should be noted that 1 wt% Pt was loaded in situ on the surface of the photocatalyst via a photoreduction method and applied as a cocatalyst. To figure out the exact amount of Pt loaded, energy dispersive X-ray spectroscopy (EDS) analysis of the as-prepared SrTiLaCrO-0.10 sample after H2 evolution was conducted. As shown in Table S1, the molar ratio of Pt:Sr was about 0.99%, and the corresponding weight ratio for Pt:SrTiLaCrO-0.10 was calculated to be ~0.92%, slightly lower than 1 wt% as fed, which could be ascribed to the insufficient photodeposition of Pt atoms.

2.5. Photocatalytic Mechanism

As indicated by the results of the UV–Vis spectra and M–S tests, pure SrTiO3 possessed a bandgap of ~3.3 eV, with CBM and VBM levels located at −1.32 and 1.98 V, respectively. Although the band structure of SrTiO3 fulfills the requirement of both H2 and O2 evolution from water, the relatively large bandgap makes SrTiO3 unable to be excited by visible light irradiation. As for the SrTiO3–LaCrO3 solid solutions, taking SrLaTiCrO-0.10, for instance, the CBM and VBM levels were located at −1.00 and 1.37 V, respectively. The bandgap of ~2.37 eV enables visible light absorption and sufficient energy levels for H2 evolution. The band positions of SrTiO3 and SrLaTiCrO-0.10 are depicted in Figure 6a for clearer illustration. In addition, electrochemical impedance spectroscopy (EIS) was conducted to probe the separation and migration of charge carriers, and the results are shown in Figure 6b. It was observed that SrLaTiCrO-0.10 exhibited a smaller arc radius than pure SrTiO3, indicating that the solid solutions possessed reduced charge-transfer resistance and a higher separation and migration efficiency of charge carriers. The enhancement could be ascribed to the distortion of the BO6 octahedra of the ABO3 perovskite structure, that is, the incorporation of La3+ and Cr3+ with a different cation radius could induce stronger dipole moments, and thus generate a stronger local internal field for charge separation. It should be noted that this phenomenon has also been convincingly demonstrated in other perovskite photocatalysts with tailored compositions [53,54].

3. Materials and Methods

3.1. Synthesis of Photocatalysts

All the reagents were of analytical reagent (AR) grade and used as received from Sinopharm Chemical Reagent Co., Ltd. (Shanghai, China). The water used in the experiments was deionized water with a resistivity of 18.25 MΩ cm.
The (SrTiO3)1−x(LaCrO3)x (x = 0.00, 0.05, 0.10, 0.20, 0.50 and 1.00) solid solutions were fabricated via a simple PC method according to our previous work [37] and the detailed synthesis process is supplied in the Supplementary Material.

3.2. Characterization

X-ray diffraction (XRD) patterns were recorded using a PANalytical X’Pert Pro MPD diffractometer (Malvern, UK) with Ni-filtered Cu Kα irradiation (λ = 1.5406 Å, 40 KV, 40 mA) and a scan rate of 10° min−1 in the 2θ range from 10 to 80°. The UV–Vis spectra were measured by an Agilent Cary 5000 (Santa Clara, CA, USA) under diffuse-reflectance mode using BaSO4 as a reference. Field-emission scanning electron microscopy (FESEM) images and energy dispersive X-ray spectroscopy (EDS) data were obtained by a JEOL JSM-7800F instrument (Tokyo, Japan). Transmission electron microscopy (TEM) and selected area electron diffraction (SAED) pattern images were obtained by an FEI Tecnai G2 F30 S-Twin transmission electron microscope (GA, USA) with an accelerating voltage of 300 kV. X-ray photoelectron spectroscopy (XPS) data were collected from a Kratos Axis Ultra DLD instrument (Manchester, UK) with a monochromatized Al Kα line source (150 W), and all binding energies were referenced to the adventitious C 1s peak at 284.8 eV.

3.3. Electrochemical Measurements

Electrode preparation: the as-prepared sample (2 mg) was ultrasonically dispersed in a mixture containing deionized water (500 μL), ethanol (500 μL) and Nafion solution (DuPont D1020, 10 wt%, 20 μL) for 30 min. Part of the obtained dispersion (10 μL) was transferred onto the surface of a glassy carbon electrode (3 mm diameter) via a drop casting approach and then dried at 25 °C for 24 h, thus obtaining an electrode for use as the working electrode.
Electrochemical measurements were carried out on a CHI 600D electrochemical workstation (Chenhua Instruments, Co., Shanghai, China) in a three-electrode system using Ag/AgCl electrode as the reference electrode and Pt foil as the counter electrode. Na2SO4 aqueous solution (0.5 M, pH = 6.8) was chosen as the electrolyte. Linear sweep voltammetry (LSV) curves were obtained at a scan rate of 1 mV s−1, and the current densities were normalized comparatively by geometrical surface area. Electrochemical impedance spectroscopy (EIS) was measured at an applied potential of +0.6 V (vs. Ag/AgCl) in darkness. The frequency ranged from 100 kHz to 1 Hz with a 5 mV AC dither. The transformation of potentials vs. Ag/AgCl and RHE was calculated as follows:
ERHE = EAg/AgCl + 0.059 × pH + E0Ag/AgCl (E0Ag/AgCl = 0.1976 V at 25 °C)

3.4. Photocatalytic Measurements

The photocatalytic H2 evolution test for the as-prepared samples was conducted in a Pyrex glass cell. An amount of 50 mg of the photocatalyst was dispersed into an HCOOH solution (10 vol%, 200 mL), in which HCOOH served as a sacrificial reagent. Pt (1 wt%) was in situ loaded on the samples by a photoreduction method as a cocatalyst. Before irradiation, the dispersion was purged with N2 for 10 min to eliminate residual air. Then the dispersion was irradiated by a 300 W Xe arc lamp with a UV-cutoff filter (λ > 400 nm) at 35 °C under constant stirring. The evolved H2 was analyzed by gas chromatography with a TDX-01 column, a thermal conductivity detector and Ar as the carrier gas. The AQYs for the photocatalytic H2 evolution were measured under different wavelengths, and the detailed information is supplied in the Supplementary Material.

4. Conclusions

Continuous solid solutions of a perovskite structure photocatalyst were designed and prepared via a polymerized complex method with SrTiO3 and LaCrO3, in which the LaCrO3 content was tuned from 0.00 to 1.00. Based on the successful construction of the solid solutions, the light absorption of the SrTiO3 photocatalyst was extended from 380 nm to 570 nm and beyond, which enabled visible-light-driven hydrogen production. Furthermore, the incorporation of LaCrO3 content also induced accelerated charge separation through the distortion of the TiO6 octahedra, hence the improved activity of photocatalytic production. The optimized H2 evolution rate was obtained when LaCrO3 content was 0.1, exhibiting excellent stability and an apparent quantum yield of 3.68% at 400 nm. This work provides useful guidance on the construction of novel photocatalytic systems with extended utilization of the solar spectrum.

Supplementary Materials

The following supporting information can be downloaded at: https://www.mdpi.com/article/10.3390/catal12101123/s1, Experimental section: details on the preparation of (SrTiO3)1-x(LaCrO3)x solid solutions and AQY measurements; Figure S1: (HR)TEM and SAED pattern images of SrTiO3 and SrLaTiCrO-0.10; Figure S2: Tauc plot of LaCrO3; Table S1: EDS results for SrTiLaCrO-0.10 after loading 1 wt% Pt.

Author Contributions

Conceptualization, X.G.; methodology, X.G. and S.Z.; validation, X.G., S.Z. and L.T.; formal analysis, X.G. and S.Z.; investigation, X.G., S.Z. and L.T.; resources, X.G.; data curation, X.G. and S.Z.; writing—original draft preparation, X.G. and S.Z.; writing—review and editing, X.G., S.Z., L.T., Y.Z. and J.S.; supervision, X.G.; project administration, X.G.; funding acquisition, X.G. All authors have read and agreed to the published version of the manuscript.

Funding

This research was funded by the Natural Science Basic Research Program of Shaanxi Province (No. 2019JCW-10), the National Natural Science Foundation of China (No. 22002126), the China Postdoctoral Science Foundation (No. 2020M673386 and 2020T130503), and the “Fundamental Research Funds for the Central Universities”.

Data Availability Statement

The data used to support the study are included in the article.

Conflicts of Interest

The authors declare no conflict of interest.

References

  1. Chen, J.M. Carbon neutrality: Toward a sustainable future. Innovation 2021, 2, 100127. [Google Scholar] [CrossRef] [PubMed]
  2. Wei, Y.-M.; Chen, K.; Kang, J.-N.; Chen, W.; Wang, X.-Y.; Zhang, X. Policy and management of carbon peaking and carbon neutrality: A literature review. Engineering 2022, 14, 52–63. [Google Scholar] [CrossRef]
  3. He, M.; Sun, Y.; Han, B. Green carbon science: Efficient carbon resource processing, utilization, and recycling towards carbon neutrality. Angew. Chem. Int. Ed. 2022, 61, e202112835. [Google Scholar] [CrossRef]
  4. Lewis, N.S.; Nocera, D.G. Powering the planet: Chemical challenges in solar energy utilization. Proc. Natl. Acad. Sci. USA 2006, 103, 15729–15735. [Google Scholar] [CrossRef]
  5. Tachibana, Y.; Vayssieres, L.; Durrant, J.R. Artificial photosynthesis for solar water-splitting. Nat. Photonics 2012, 6, 511–518. [Google Scholar] [CrossRef]
  6. Chen, X.; Shen, S.; Guo, L.; Mao, S.S. Semiconductor-based Photocatalytic Hydrogen Generation. Chem. Rev. 2010, 110, 6503–6570. [Google Scholar] [CrossRef]
  7. Wang, Q.; Domen, K. Particulate photocatalysts for light-driven water splitting: Mechanisms, challenges, and design strategies. Chem. Rev. 2020, 120, 919–985. [Google Scholar] [CrossRef]
  8. Takata, T.; Jiang, J.; Sakata, Y.; Nakabayashi, M.; Shibata, N.; Nandal, V.; Seki, K.; Hisatomi, T.; Domen, K. Photocatalytic water splitting with a quantum efficiency of almost unity. Nature 2020, 581, 411–414. [Google Scholar] [CrossRef]
  9. Qi, Y.; Zhang, J.; Kong, Y.; Zhao, Y.; Chen, S.; Li, D.; Liu, W.; Chen, Y.; Xie, T.; Cui, J.; et al. Unraveling of cocatalysts photodeposited selectively on facets of BiVO4 to boost solar water splitting. Nat. Commun. 2022, 13, 484. [Google Scholar] [CrossRef]
  10. Zhao, D.; Wang, Y.; Dong, C.-L.; Huang, Y.-C.; Chen, J.; Xue, F.; Shen, S.; Guo, L. Boron-doped nitrogen-deficient carbon nitride-based Z-scheme heterostructures for photocatalytic overall water splitting. Nat. Energy 2021, 6, 388–397. [Google Scholar] [CrossRef]
  11. Wang, Q.; Hisatomi, T.; Jia, Q.; Tokudome, H.; Zhong, M.; Wang, C.; Pan, Z.; Takata, T.; Nakabayashi, M.; Shibata, N.; et al. Scalable water splitting on particulate photocatalyst sheets with a solar-to-hydrogen energy conversion efficiency exceeding 1%. Nat. Mater. 2016, 15, 611–615. [Google Scholar] [CrossRef] [PubMed]
  12. Liu, J.; Liu, Y.; Liu, N.; Han, Y.; Zhang, X.; Huang, H.; Lifshitz, Y.; Lee, S.-T.; Zhong, J.; Kang, Z. Metal-free efficient photocatalyst for stable visible water splitting via a two-electron pathway. Science 2015, 347, 970–974. [Google Scholar] [CrossRef] [PubMed]
  13. Guan, X.; Chowdhury, F.A.; Wang, Y.; Pant, N.; Vanka, S.; Trudeau, M.L.; Guo, L.; Vayssieres, L.; Mi, Z. Making of an industry-friendly artificial photosynthesis device. ACS Energy Lett. 2018, 3, 2230–2231. [Google Scholar] [CrossRef]
  14. Guo, L.; Chen, Y.; Su, J.; Liu, M.; Liu, Y. Obstacles of solar-powered photocatalytic water splitting for hydrogen production: A perspective from energy flow and mass flow. Energy 2019, 172, 1079–1086. [Google Scholar] [CrossRef]
  15. Shi, J.; Guo, L. ABO3-based photocatalysts for water splitting. Prog. Nat. Sci. 2012, 22, 592–615. [Google Scholar] [CrossRef]
  16. Phoon, B.L.; Lai, C.W.; Juan, J.C.; Show, P.-L.; Chen, W.-H. A review of synthesis and morphology of SrTiO3 for energy and other applications. Int. J. Energy Res. 2019, 43, 5151–5174. [Google Scholar] [CrossRef]
  17. Patial, S.; Hasija, V.; Raizada, P.; Singh, P.; Singh, A.A.P.K.; Asiri, A.M. Tunable photocatalytic activity of SrTiO3 for water splitting: Strategies and future scenario. J. Environ. Chem. Eng. 2020, 8, 103791. [Google Scholar] [CrossRef]
  18. Goto, Y.; Hisatomi, T.; Wang, Q.; Higashi, T.; Ishikiriyama, K.; Maeda, T.; Sakata, Y.; Okunaka, S.; Tokudome, H.; Katayama, M.; et al. A particulate photocatalyst water-splitting panel for large-scale solar hydrogen generation. Joule 2018, 2, 509–520. [Google Scholar] [CrossRef]
  19. Wang, B.; Shen, S.; Guo, L. SrTiO3 single crystals enclosed with high-indexed {023} facets and {001} facets for photocatalytic hydrogen and oxygen evolution. Appl. Catal. B-Environ. 2015, 166–167, 320–326. [Google Scholar] [CrossRef]
  20. Townsend, T.K.; Browning, N.D.; Osterloh, F.E. Overall photocatalytic water splitting with NiOx-SrTiO3—A revised mechanism. Energy Environ. Sci. 2012, 5, 9543–9550. [Google Scholar] [CrossRef]
  21. Konta, R.; Ishii, T.; Kato, H.; Kudo, A. Photocatalytic activities of noble metal ion doped SrTiO3 under visible light irradiation. J. Phys. Chem. B 2004, 108, 8992–8995. [Google Scholar] [CrossRef]
  22. Kato, H.; Sasaki, Y.; Shirakura, N.; Kudo, A. Synthesis of highly active rhodium-doped SrTiO3 powders in Z-scheme systems for visible-light-driven photocatalytic overall water splitting. J. Mater. Chem. A 2013, 1, 12327–12333. [Google Scholar] [CrossRef]
  23. Wang, D.; Ye, J.; Kako, T.; Kimura, T. Photophysical and Photocatalytic Properties of SrTiO3 Doped with Cr Cations on Different Sites. J. Phys. Chem. B 2006, 110, 15824–15830. [Google Scholar] [CrossRef] [PubMed]
  24. Kang, H.W.; Lim, S.N.; Park, S.B. Co-doping schemes to enhance H2 evolution under visible light irradiation over SrTiO3:Ni/M (M = La or Ta) prepared by spray pyrolysis. Int. J. Hydrogen Energy 2012, 37, 5540–5549. [Google Scholar] [CrossRef]
  25. Shi, J.; Ye, J.; Ma, L.; Ouyang, S.; Jing, D.; Guo, L. Site-selected doping of upconversion luminescent Er3+ into SrTiO3 for visible-light-driven photocatalytic H2 or O2 evolution. Chem.-Eur. J. 2012, 18, 7543–7551. [Google Scholar] [CrossRef] [PubMed]
  26. Chen, H.-C.; Huang, C.-W.; Wu, J.C.S.; Lin, S.-T. Theoretical Investigation of the Metal-Doped SrTiO3 Photocatalysts for Water Splitting. J. Phys. Chem. C 2012, 116, 7897–7903. [Google Scholar] [CrossRef]
  27. Reunchan, P.; Ouyang, S.; Umezawa, N.; Xu, H.; Zhang, Y.; Ye, J. Theoretical design of highly active SrTiO3-based photocatalysts by a codoping scheme towards solar energy utilization for hydrogen production. J. Mater. Chem. A 2013, 1, 4221–4227. [Google Scholar] [CrossRef]
  28. Guan, X.; Zong, S.; Tian, L.; Liu, M. Efficient photocatalytic hydrogen production under visible-light irradiation on SrTiO3 without noble metal: Dye-sensitization and earth-abundant cocatalyst modification. Mater. Today Chem. 2022, 26, 101018. [Google Scholar] [CrossRef]
  29. Zhao, Y.; Guo, Y.; Li, J.; Li, P. Efficient hydrogen evolution with ZnO/SrTiO3 S-scheme heterojunction photocatalyst sensitized by Eosin Y. Int. J. Hydrogen Energy 2021, 46, 18922–18935. [Google Scholar] [CrossRef]
  30. Liu, M.; Wang, L.; Lu, G.; Yao, X.; Guo, L. Twins in Cd1−xZnxS solid solution: Highly efficient photocatalyst for hydrogen generation from water. Energy Environ. Sci. 2011, 4, 1372–1378. [Google Scholar] [CrossRef]
  31. Maeda, K.; Takata, T.; Hara, M.; Saito, N.; Inoue, Y.; Kobayashi, H.; Domen, K. GaN:ZnO solid solution as a photocatalyst for visible-light-driven overall water splitting. J. Am. Chem. Soc. 2005, 127, 8286–8287. [Google Scholar] [CrossRef] [PubMed]
  32. Guan, X.; Chowdhury, F.A.; Pant, N.; Guo, L.; Vayssieres, L.; Mi, Z. Efficient unassisted overall photocatalytic seawater splitting on GaN-based nanowire arrays. J. Phys. Chem. C 2018, 122, 13797–13802. [Google Scholar] [CrossRef]
  33. Wang, D.; Kako, T.; Ye, J. New series of solid-solution semiconductors (AgNbO3)1−x(SrTiO3)x with modulated band structure and enhanced visible-light photocatalytic activity. J. Phys. Chem. C 2009, 113, 3785–3792. [Google Scholar] [CrossRef]
  34. Cho, S.; Jang, J.-W.; Zhang, W.; Suwardi, A.; Wang, H.; Wang, D.J.L. Single-crystalline thin films for studying intrinsic properties of BiFeO3–SrTiO3 solid solution photoelectrodes in solar energy conversion. Chem. Mater. 2015, 27, 6635–6641. [Google Scholar] [CrossRef]
  35. Lu, L.; Lv, M.; Liu, G.; Xu, X. Photocatalytic hydrogen production over solid solutions between BiFeO3 and SrTiO3. Appl. Surf. Sci. 2017, 391, 535–541. [Google Scholar] [CrossRef]
  36. Yu, J.; Zhang, L.; Qian, J.; Zhu, Z.; Ni, S.; Liu, G.; Xu, X. In situ exsolution of silver nanoparticles on AgTaO3-SrTiO3 solid solutions as efficient plasmonic photocatalysts for water splitting. Appl. Catal. B-Environ. 2019, 256, 117818. [Google Scholar] [CrossRef]
  37. Shi, J.; Zong, S.; Hu, Y.; Guan, X.; Luo, J.; Shang, Y.; Li, G.; Liu, D.; Wang, X.; Guo, P. Continuous solid solutions of Na0.5La0.5TiO3-LaCrO3 for photocatalytic H2 evolution under visible-light irradiation. RSC Adv. 2016, 6, 51801–51806. [Google Scholar] [CrossRef]
  38. Li, G.; Kuang, X.; Tian, S.; Liao, F.; Jing, X.; Uesu, Y.; Kohn, K. Structure and conductivity of perovskites Sr1−xLaxTi1−xCrxO3. J. Solid State Chem. 2002, 165, 381–392. [Google Scholar] [CrossRef]
  39. Chen, H.; Umezawa, N. Effect of cation arrangement on the electronic structures of the perovskite solid solutions (SrTiO3)1−x(LaCrO3)x from first principles. Phys. Rev. B 2014, 90, 045119. [Google Scholar] [CrossRef]
  40. Sudrajat, H.; Zhou, Y.; Sasaki, T.; Ichikuni, N.; Onishi, H. The atomic-scale structure of LaCrO3–NaTaO3 solid solution photocatalysts with enhanced electron population. Phys. Chem. Chem. Phys. 2019, 21, 5148–5157. [Google Scholar] [CrossRef]
  41. Yi, Z.; Ye, J. Band gap tuning of Na1−xLaxTa1−xCrxO3 for H2 generation from water under visible light irradiation. J. Appl. Phys. 2009, 106, 074910. [Google Scholar] [CrossRef]
  42. Ouyang, S.; Tong, H.; Umezawa, N.; Cao, J.; Li, P.; Bi, Y.; Zhang, Y.; Ye, J. Surface-alkalinization-induced enhancement of photocatalytic H2 evolution over SrTiO3-based photocatalysts. J. Am. Chem. Soc. 2012, 134, 1974–1977. [Google Scholar] [CrossRef] [PubMed]
  43. Wang, L.; Li, Y.; Wu, C.; Li, X.; Shao, G.; Zhang, P. Tracking charge transfer pathways in SrTiO3/CoP/Mo2C nanofibers for enhanced photocatalytic solar fuel production. Chin. J. Catal. 2022, 43, 507–518. [Google Scholar] [CrossRef]
  44. Liu, J.W.; Chen, G.; Li, Z.H.; Zhang, Z.G. Electronic structure and visible light photocatalysis water splitting property of chromium-doped SrTiO3. J. Solid State Chem. 2006, 179, 3704–3708. [Google Scholar] [CrossRef]
  45. Kumar, P.; Singh, R.K.; Sinha, A.S.K.; Singh, P. Effect of isovalent ion substitution on electrical and dielectric properties of LaCrO3. J. Alloys Compd. 2013, 576, 154–160. [Google Scholar] [CrossRef]
  46. Guan, X.; Guo, L. Cocatalytic Effect of SrTiO3 on Ag3PO4 toward enhanced photocatalytic water oxidation. ACS Catal. 2014, 4, 3020–3026. [Google Scholar] [CrossRef]
  47. Shi, J.; Ye, J.; Li, Q.; Zhou, Z.; Tong, H.; Xi, G.; Guo, L. Single-crystal nanosheet-based hierarchical AgSbO3 with exposed {001} facets: Topotactic synthesis and enhanced photocatalytic activity. Chem.-Eur. J. 2012, 18, 3157–3162. [Google Scholar] [CrossRef]
  48. Nashim, A.; Parida, K. n-La2Ti2O7/p-LaCrO3: A novel heterojunction based composite photocatalyst with enhanced photoactivity towards hydrogen production. J. Mater. Chem. A 2014, 2, 18405–18412. [Google Scholar] [CrossRef]
  49. Cardon, F.; Gomes, W.P. On the determination of the flat-band potential of a semiconductor in contact with a metal or an electrolyte from the Mott-Schottky plot. J. Phys. D Appl. Phys. 1978, 11, L63–L67. [Google Scholar] [CrossRef]
  50. Ueda, K.; Kato, H.; Kobayashi, M.; Hara, M.; Kakihana, M. Control of valence band potential and photocatalytic properties of NaxLa1−xTaO1+2xN2−2x oxynitride solid solutions. J. Mater. Chem. A 2013, 1, 3667–3674. [Google Scholar] [CrossRef]
  51. Maeda, K.; Hirayama, N.; Nakata, H.; Wakayama, H.; Oka, K. Oxyfluoride Pb2Ti4O9F2 as a stable anode material for photoelectrochemical water oxidation. J. Phys. Chem. C 2019, 124, 1844–1850. [Google Scholar] [CrossRef]
  52. Murcia, J.J.; Hidalgo, M.C.; Navío, J.A.; Araña, J.; Doña-Rodríguez, J.M. Study of the phenol photocatalytic degradation over TiO2 modified by sulfation, fluorination, and platinum nanoparticles photodeposition. Appl. Catal. B-Environ. 2015, 179, 305–312. [Google Scholar] [CrossRef]
  53. Hu, C.-C.; Lee, Y.-L.; Teng, H. Efficient water splitting over Na1−xKxTaO3 photocatalysts with cubic perovskite structure. J. Mater. Chem. 2011, 21, 3824–3830. [Google Scholar] [CrossRef]
  54. Malik, J.; Kumar, S.; Srivastava, P.; Bag, M.; Mandal, T.K. Cation disorder and octahedral distortion control of internal electric field, band bending and carrier lifetime in Aurivillius perovskite solid solutions for enhanced photocatalytic activity. Mater. Adv. 2021, 2, 4832–4842. [Google Scholar] [CrossRef]
Figure 1. (a) XRD patterns of the SrLaTiCrO-x samples with x equal to 0.00, 0.05, 0.10, 0.20, 0.50 and 1.00. (b) Detailed XRD patterns around the strongest diffraction peaks (121) in the 2θ range from 31.75 to 33.25o.
Catalysts 12 01123 g001
Figure 2. SEM images of (a) SrTiO3 and (b) LaCrO3. High-magnification SEM images of (c) SrTiO3 and (d) SrLaTiCrO-0.10.
Catalysts 12 01123 g002
Figure 3. (a) High-resolution XPS spectra of Cr 2p orbitals of the SrLaTiCrO-x samples with x equal to 0.00, 0.05, 0.10, 0.20, 0.50 and 1.00. (b) VB spectra of SrTiO3 and SrLaTiCrO-0.10.
Catalysts 12 01123 g003
Figure 4. (a) UV–Vis spectra of the as-prepared SrLaTiCrO-x samples with x equal to 0.00, 0.05, 0.10, 0.20, 0.50 and 1.00. (b) Tauc plots of SrTiO3 and SrLaTiCrO-0.10. M–S curves of (c) SrTiO3 and (d) SrLaTiCrO-0.10.
Catalysts 12 01123 g004
Figure 5. (a) Photocatalytic H2 evolution of the as-prepared SrLaTiCrO-x samples with x equal to 0.00, 0.05, 0.10, 0.20, 0.50 and 1.00 under visible light irradiation. (b) Wavelength-dependent AQY and UV–Vis spectra of the as-prepared SrLaTiCrO-0.10 before and after photocatalytic H2 evolution. (c) Cyclic tests for SrLaTiCrO-0.10. (d) XRD patterns of SrLaTiCrO-0.10 before and after photocatalytic H2 evolution.
Catalysts 12 01123 g005
Figure 6. (a) Schematic illustration of the band structure of SrTiO3 and SrLaTiCrO-0.10 with respect to photocatalytic hydrogen production under visible light irradiation. (b) EIS spectra of SrTiO3 and SrLaTiCrO-0.10 photocatalysts.
Catalysts 12 01123 g006
Publisher’s Note: MDPI stays neutral with regard to jurisdictional claims in published maps and institutional affiliations.

