Article

Effect of Light and Heavy Rare Earth Doping on the Physical Structure of Bi2O2CO3 and Their Performance in Photocatalytic Degradation of Dimethyl Phthalate

1
Key Laboratory of Petrochemical Pollution Control of Guangdong Higher Education Institutes, Guangdong Provincial Key Laboratory of Petrochemical Pollution Process and Control, School of Chemical Engineering, Guangdong University of Petrochemical Technology, Maoming 525000, China
2
School of Environmental Science and Engineering, Key Laboratory of Estuarine Ecological Security and Environmental Health, Xiamen University Tan Kah Kee College, Zhangzhou 363105, China
3
School of Chemistry and Chemical Engineering, South China University of Technology, Guangzhou 510000, China
*
Authors to whom correspondence should be addressed.
These authors contributed equally to this work.
Catalysts 2022, 12(11), 1295; https://doi.org/10.3390/catal12111295
Submission received: 15 September 2022 / Revised: 13 October 2022 / Accepted: 19 October 2022 / Published: 22 October 2022

Abstract

:
In order to solve the problem of environmental health hazards caused by phthalate esters, a series of pure Bi2O2CO3 and light (La, Ce, Pr, Nd, Sm and Eu) and heavy (Gd, Tb, Dy, Ho, Er, Tm, Yb and Lu) rare earth-doped Bi2O2CO3 samples were prepared by hydrothermal method. The crystalline phase composition and physical structure of the samples calcined at 300 °C were studied, and we found that the rare earth ion doping promoted the transformation of Bi2O2CO3 to β-Bi2O3 crystalline phase, thus obtaining a mixed crystal phase photocatalyst constituted by rare earth-ion-doped Bi2O2CO3/β-Bi2O3. The Bi2O3/Bi2O2CO3 heterostructure had a lower band gap and more efficient charge transfer. The fabricated samples were applied to the photocatalytic degradation of dimethyl phthalate (DMP) under a 300 W tungsten lamp, and it was found that the rare earth ion doping enhanced the photocatalytic degradation activity of DMP, in which the heavy rare earth of Er-doped sample reached 78% degradation for DMP at 150 min of light illumination. In addition, the doping of rare earths resulted in a larger specific surface area and a stronger absorption of visible light. At the same time, the formation of Bi2O2CO3/β-Bi2O3 heterogeneous junction enhanced the separation efficiency of photogenerated electrons and holes.

1. Introduction

Phthalate esters (PAEs) are widely used as plasticizers which can change polyvinyl chloride from a hard plastic to an elastic plastic. In recent years, the environmental health hazards caused by such compounds as phthalates have attracted widespread attention from the environmental and health communities. Numerous studies have shown that phthalates are human endocrine disruptors with reproductive and developmental toxicity and carcinogenicity. In 2017, the World Health Organization’s International Agency for Research on Cancer classified di (2-ethylhexyl) phthalate as a Group 2B carcinogen. PAEs, also known as environmental hormone pollutants, are among the most significant trace organic pollutants in the water environment. Therefore, it is important to develop effective methods to remove PAEs from water bodies.
Currently, the main methods for the removal of PAEs-like compounds in the aqueous environment are adsorption separation, biodegradation and advanced oxidation [1]. The adsorption method is highly adaptable, but because of the limited capacity of the adsorbent, it requires frequent replacement of the adsorbent and therefore consumes a lot of time and human resources. The adsorption method has strong adaptability, but due to the limited capacity of the adsorbent, the adsorbent needs to be replaced frequently, which consumes a lot of manpower and material resources. Biodegradation has the advantages of low treatment cost and stable metabolites, but its disadvantage is that the removal rate is not high, is time-consuming, and sometimes there is incomplete degradation. Photocatalytic oxidation is a promising method for the treatment of organic pollutants in water bodies that has been rapidly developed in recent years, with the advantages of using natural sunlight, fast degradation rate and mild reaction conditions [2]. Currently, the studied photocatalysts for PAEs removal mainly focus on TiO2 photocatalysts with the diethyl phthalate degradation efficiency of 44.5–67.4% [3,4,5], Fe, Ag-ZnO with the dibutyl phthalate reduction efficiency of 95% [6], V2O5/MoO3 with the methylene blue degradation efficiency of 89.23% [7], ZrOx/ZnO with the dimethyl phthalate (DMP) degradation half-life time of shortening 45% [8], α-Fe2O3 with the dibutyl phthalate degradation efficiency 93% [9], g-C3N4/Bi2O3 with the dibutyl phthalate degradation efficiency of 60% [10], BiVO4 with bisphenol A degradation efficiency 99% [11] and other photocatalytic materials.
Bismuth-based semiconductors are characterized by environmental friendliness, easy availability of raw materials and easily tunable optical properties, but are less used in photocatalytic removal of PAEs. In addition, the photocatalytic oxidative removal performance of bismuth-based semiconductors can be enhanced by physical structure modulation such as crystal morphology, crystal phase, and dimensionality. On the other hand, rare earth elements have a unique 4f sublayer electronic structure, large atomic magnetic moments, strong spin–orbit coupling and variable coordination numbers. Doping of rare earth atoms into semiconductors can modulate the semiconductor photocatalyst lattice, energy level structure and surface adsorption properties, thus improving the optical absorption capacity, the migration and separation rate of photogenerated carriers and the adsorption capacity of the reactants [12]. In addition, lanthanides have well-defined 4f→4f leap electron orbitals as well as high photochemical stability with distinct luminescence spectra in the ultraviolet(UV)-visible near-infrared region [13]. Therefore, rare earth elements are often used in the synthesis of fluorescent/phosphorescent materials and up-conversion photocatalytic materials [14,15,16,17,18,19].
Our investigations show that rare earth doping has a better modulating effect on the phase transition, crystal and crystal plane growth of bismuth-based semiconductors, which can create unique microstructures such as heterogeneous junctions. For example, Gd3+-doped Bi2MoO6 photocatalysts were prepared by hydrothermal-roasting method, in which Gd3+ was doped into Bi2MoO6 lattice to replace part of Bi3+, inducing distortion of Bi2MoO6 lattice, adjusting the energy band structure of Bi2MoO6, reducing the forbidden band width of Bi2MoO6, improving the separation of photogenerated electrons and holes and thus significantly boosting the photocatalytic activity [20]. The incorporation of Sm3+ into Bi2WO6 can cause lattice contraction, increase specific surface groups and surface hydroxyl groups, and generate more oxygen vacancies, resulting in the increased activity and stability of Bi2WO6 [21]. Eu3+ can induce BiVO4 crystal morphology from nanoparticles to microspheres, and make its crystalline transformation from monoclinic to orthorhombic crystal system to form heterogeneous phase junction [22]. Yb3+ and Er3+ co-doping can modulate the WO3-0.33H2O and W18O49 crystalline phase composition and form Z-type heterogeneous phase junctions to enhance the separation and up-conversion efficiency of photogenerated electrons and holes [23]. Highly dispersed Er atoms doped with n-type oxygen vacancy-containing NiO (Er/NiO1−x) crystals can change the symmetry of the crystal, enhance the polarization and internal electric field and greatly strengthen the effective separation of photogenerated carriers, thus improving the CO2 adsorption and activation and excellent photocatalytic reduction performance [24].
In this paper, a series of rare earth-doped Bi2O2CO3 samples were prepared by hydrothermal method, and under the calcination condition at 300 °C, the effects of light and heavy rare earth doping on the physical structures of Bi2O2CO3 such as crystalline phase transformation, specific surface area, grain morphology and light absorption were investigated. The effect of different rare earth doping on the degradation activity of the catalyst was also investigated by using visible light photocatalytic degradation of DMP, and the reasons for the enhancement of photocatalytic performance caused by rare earth doping were analyzed.

2. Results and Discussion

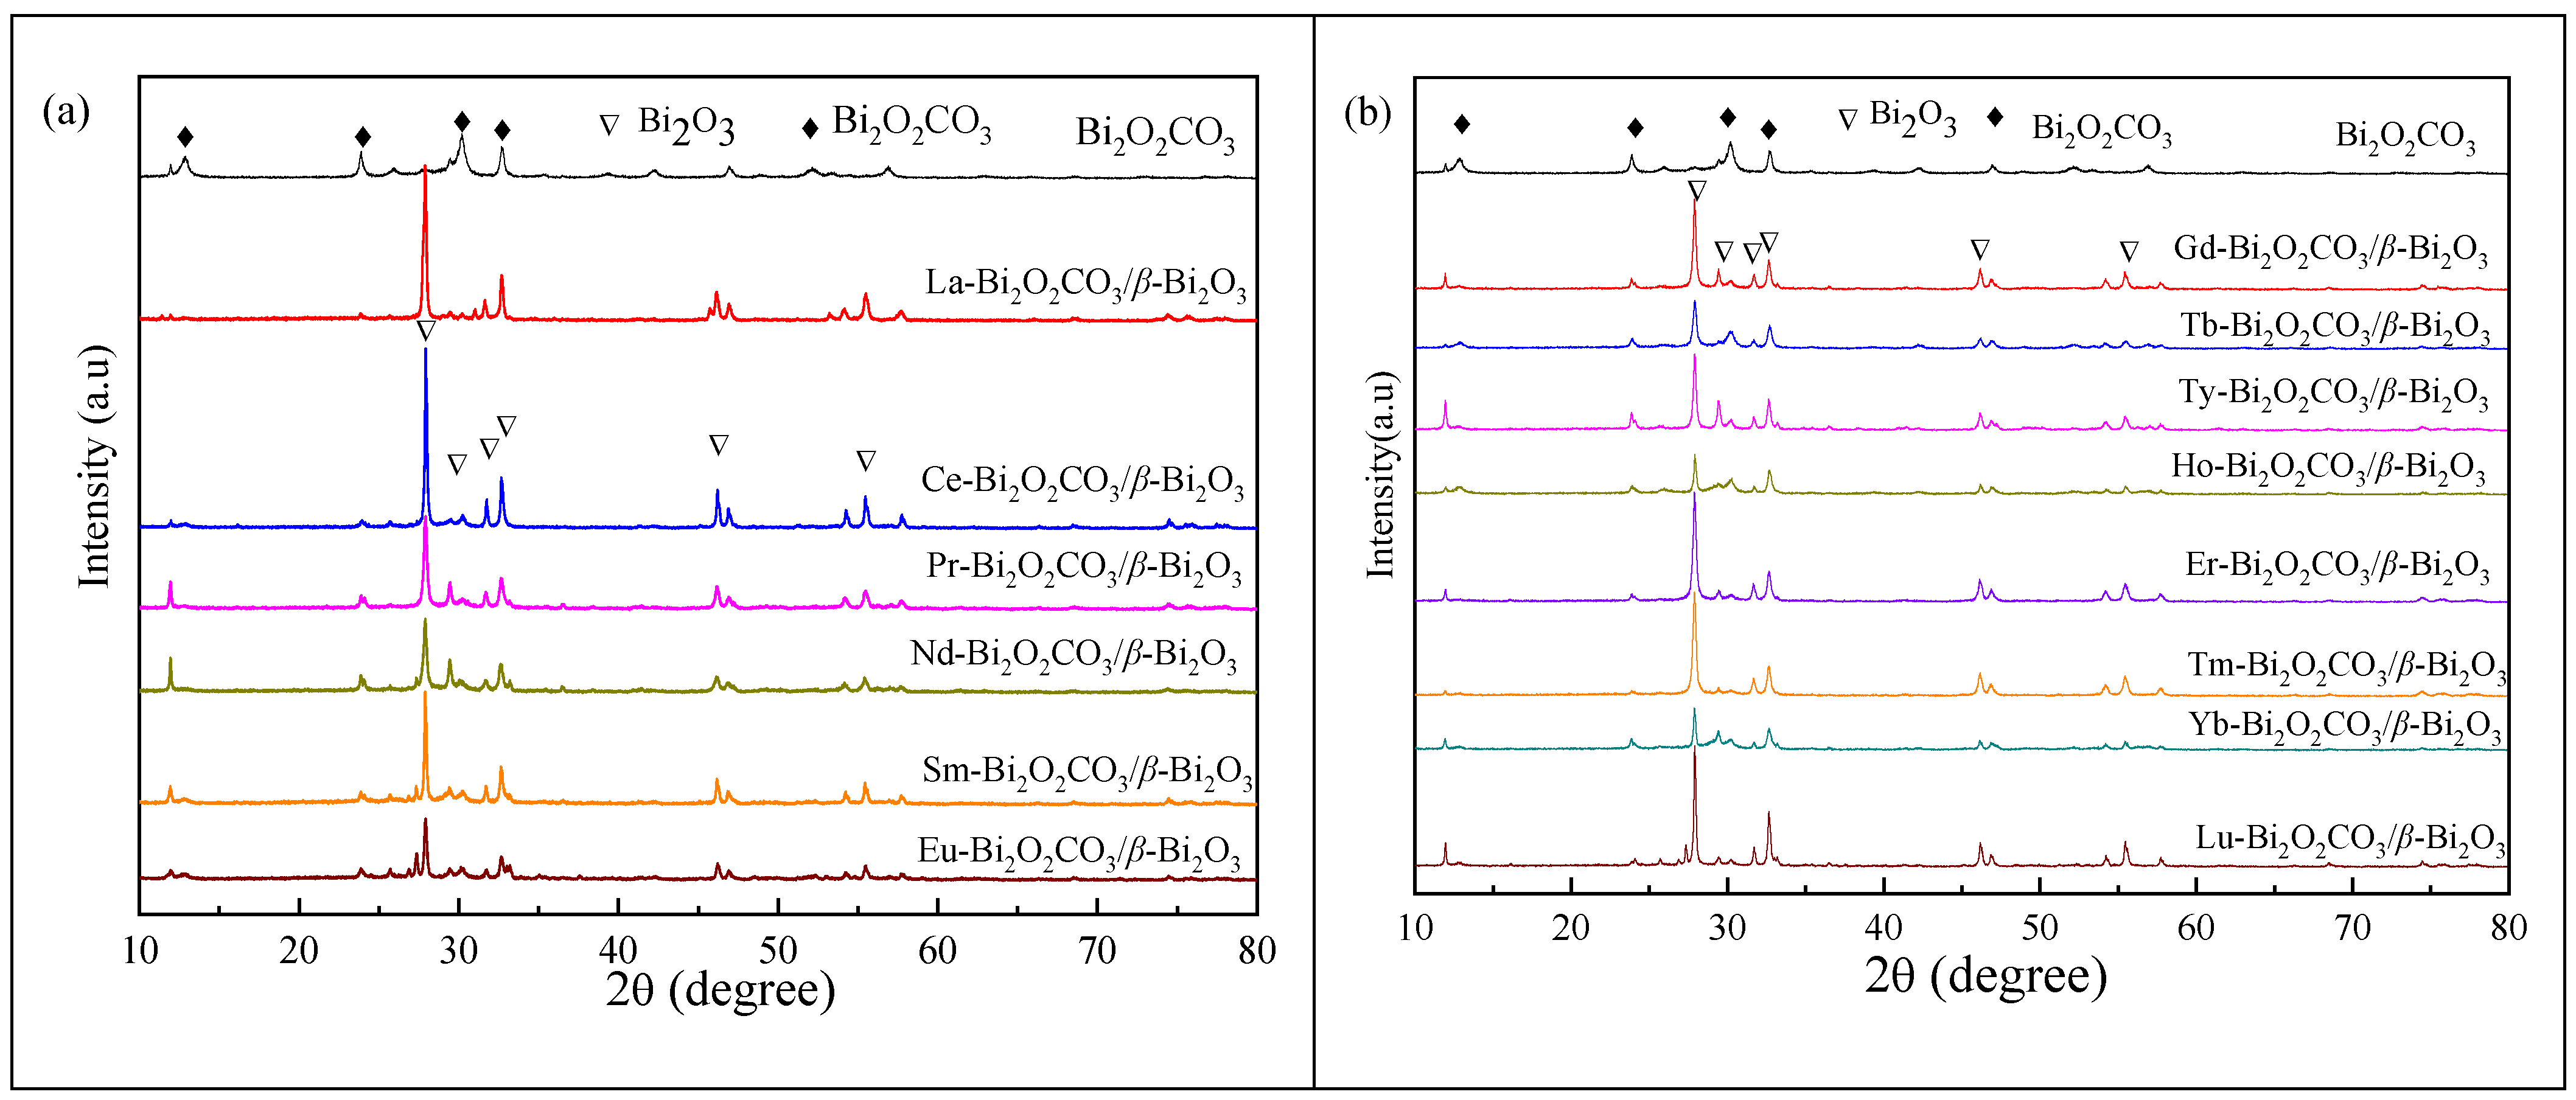
2.1. X-ray Powder Diffraction (XRD) Analysis

XRD was used to study the effect of doping with different rare earths on the crystallinity and crystalline phase of the samples. Figure 1 show the XRD patterns of the pure and doped samples after calcination at 300 °C. The main characteristic diffraction peaks of the pure samples appear at 2θ = 12.9°, 23.9°, 30.3° and 32.7°, indicating that the synthesized samples belong to the tetragonal system Bi2O2CO3 (JCPDS [00-025-1464]). After doping with different rare earth ions, a clear change in the diffraction peaks of the doped samples can be clearly observed when compared with the pure samples heat-treated at the same temperature. New diffraction peaks appear at 2θ = 27.9°, 31.7° and 46.2°, corresponding to the characteristic diffraction peaks on the (201), (002) and (222) crystal planes of the tetragonal crystal system β-Bi2O3 (JCPDS [00-027-0050]), which indicates that the rare earth-doped samples are mostly transformed into β-Bi2O3. According to the relevant literature, it is known that β-Bi2O3 is generated before α-Bi2O3 when Bi2O2CO3 is heat-treated at lower temperatures, while β-Bi2O3 is also slowly converted to α-Bi2O3 during the cooling down process [25]. However, the presence of doped samples mainly in the form of β-Bi2O3 indicates that proper rare earth doping inhibits the phase transition from β-Bi2O3 to α-Bi2O3, thus improving the stability of β-Bi2O3 at low temperatures. It may also be due to the fact that the ion of Bi3+ is 103 pm, which is similar to the radius of rare earth ions, and rare earth ions can easily enter the Bi2O3 lattice to replace part of Bi3+ and form a rare earth bismuth complex oxide, which further forms a heterogeneous structure with the rare earth ions uniformly dispersed in the β-Bi2O3 crystal [26]. Furthermore, the aggregation of Bi2O3 grains was hindered, thus reducing the energy of the system to a certain extent, and the resulting β-Bi2O3 has not enough energy to cross the phase transition potential barrier, and thus eventually β-Bi2O3 can be stable at room temperature. In addition, the β-Bi2O3 that can be stabilized with the small amount of Bi2O2CO3 present in the system can also form Bi2O2CO3/β-Bi2O3 heterojunctions. Additionally, in the absence of rare earths, β-Bi2O3 can easily phase into α-Bi2O3 with strong adsorption capacity during the cooling process, which can reabsorb CO2 in the air into Bi2O2CO3.

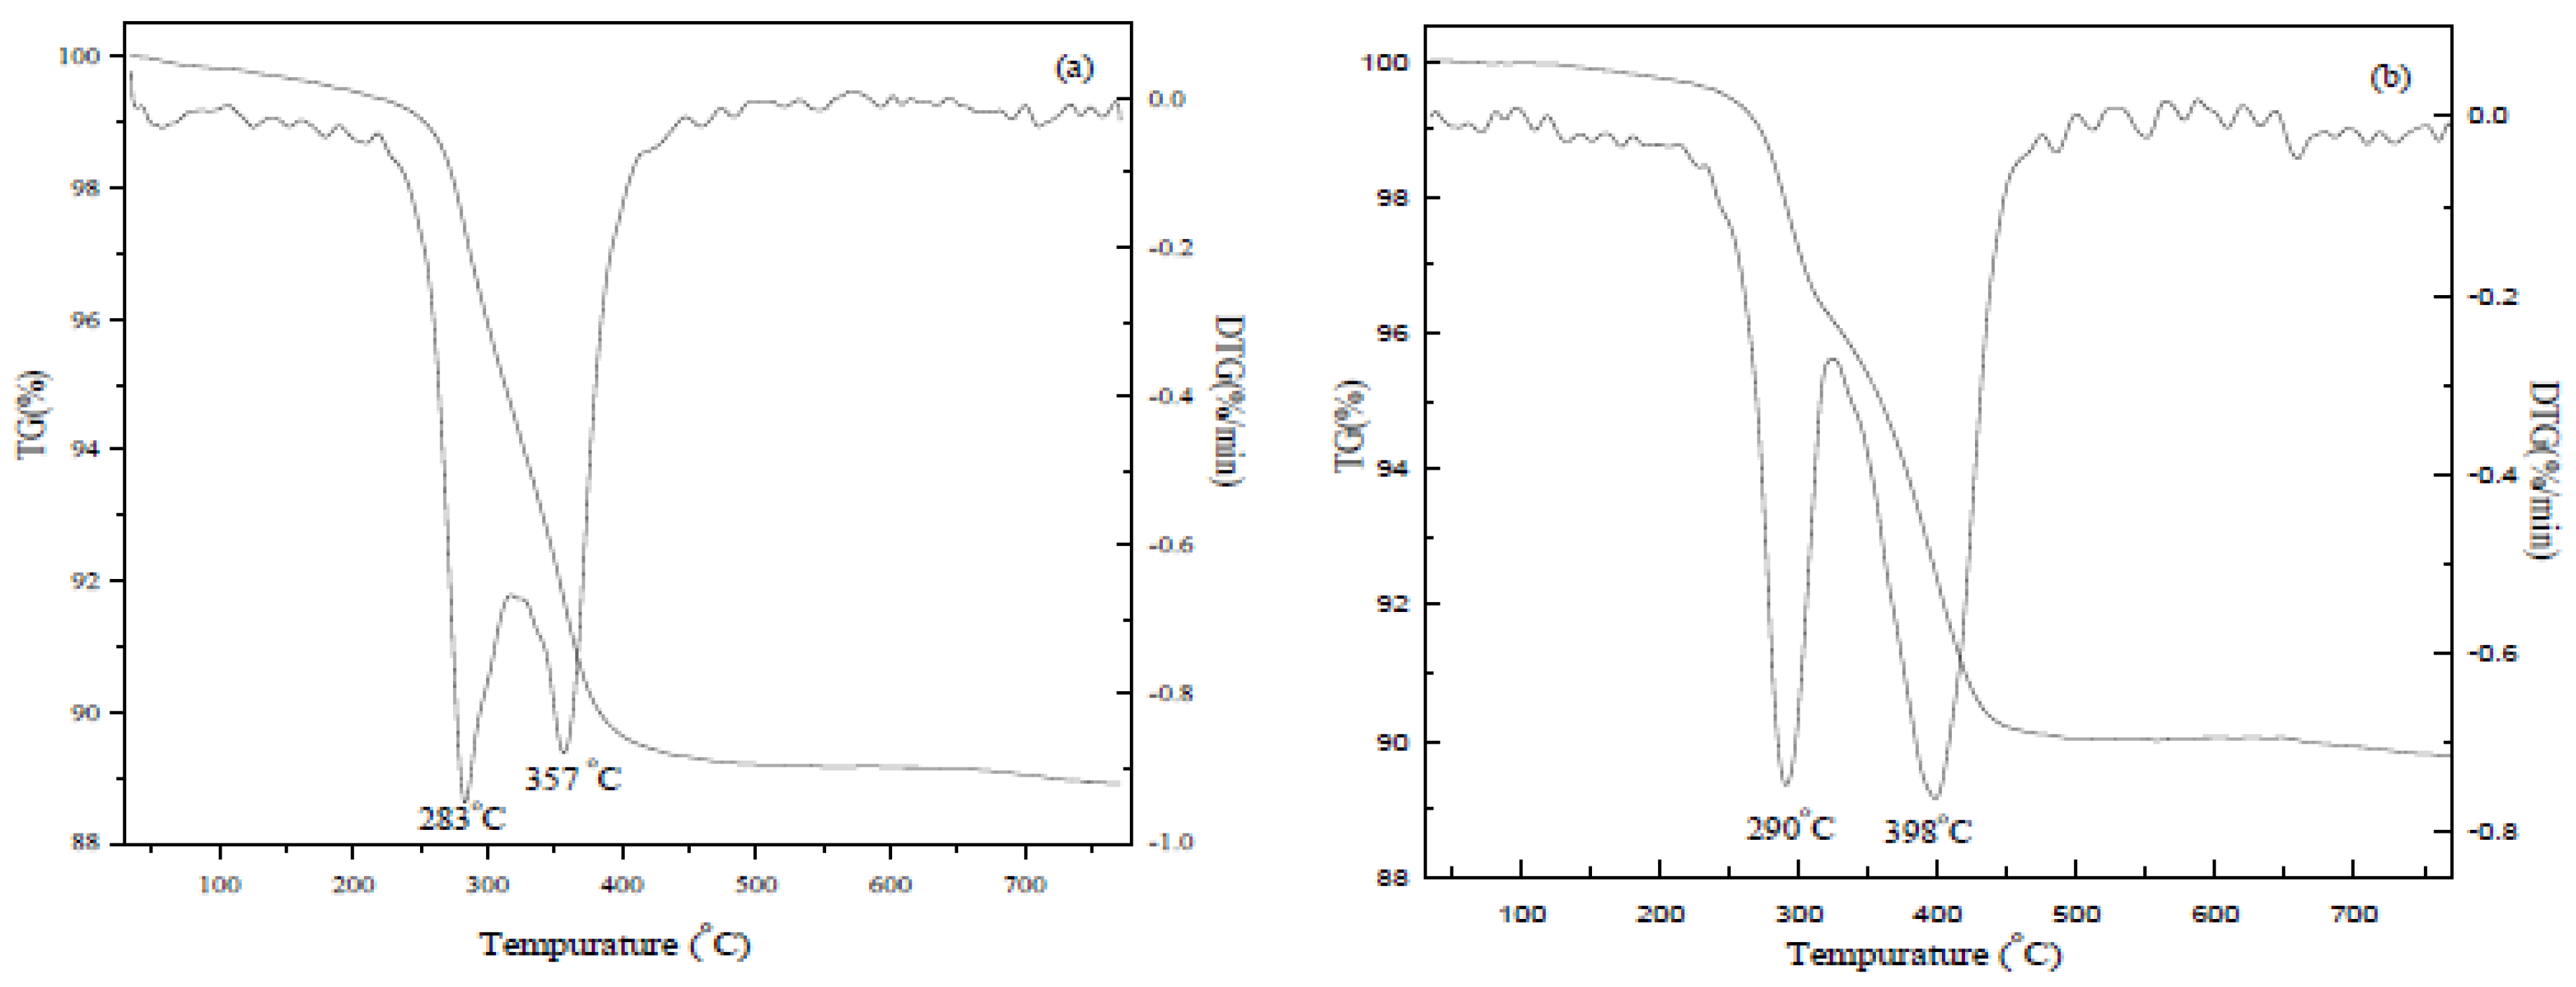
2.2. Thermogravimetric (TG) Analysis

The undoped samples and Nd-doped samples were analyzed under air atmosphere using thermogravimetry. Figure 2 shows the TG−DTG curves of the undoped sample and Nd-doped samples, respectively. In the whole process, the total weight loss of the pure sample and Nd-doped samples were 11.1% and 10.18%, respectively. Additionally, the theoretical weight loss of Bi2O2CO3→Bi2O3 + CO2 in Bi2O2CO3 decomposition reaction is 8.6%. So there is also a part of weight loss caused by water adsorbed on the catalyst surface [27]. All DTG curves have two peaks, indicating that the samples decompose in two stages throughout the heating process. In the first stage, the weight loss is mainly caused by the loss of water molecules adsorbed on the catalyst surface, and in the second stage, a chemical inversion occurs: Bi2O2CO3→Bi2O3 + CO2. Combined with XRD analysis, the pure sample at 300 ℃ is still Bi2O2CO3 crystal phase; the reason may be that although the phase has changed to β-Bi2O3 during calcination at 300 °C, the pure sample β-Bi2O3 will be transformed to α-Bi2O3 during cooling. α-Bi2O3 has good adsorption and adsorbs CO2 in the air to further form Bi2O2CO3.

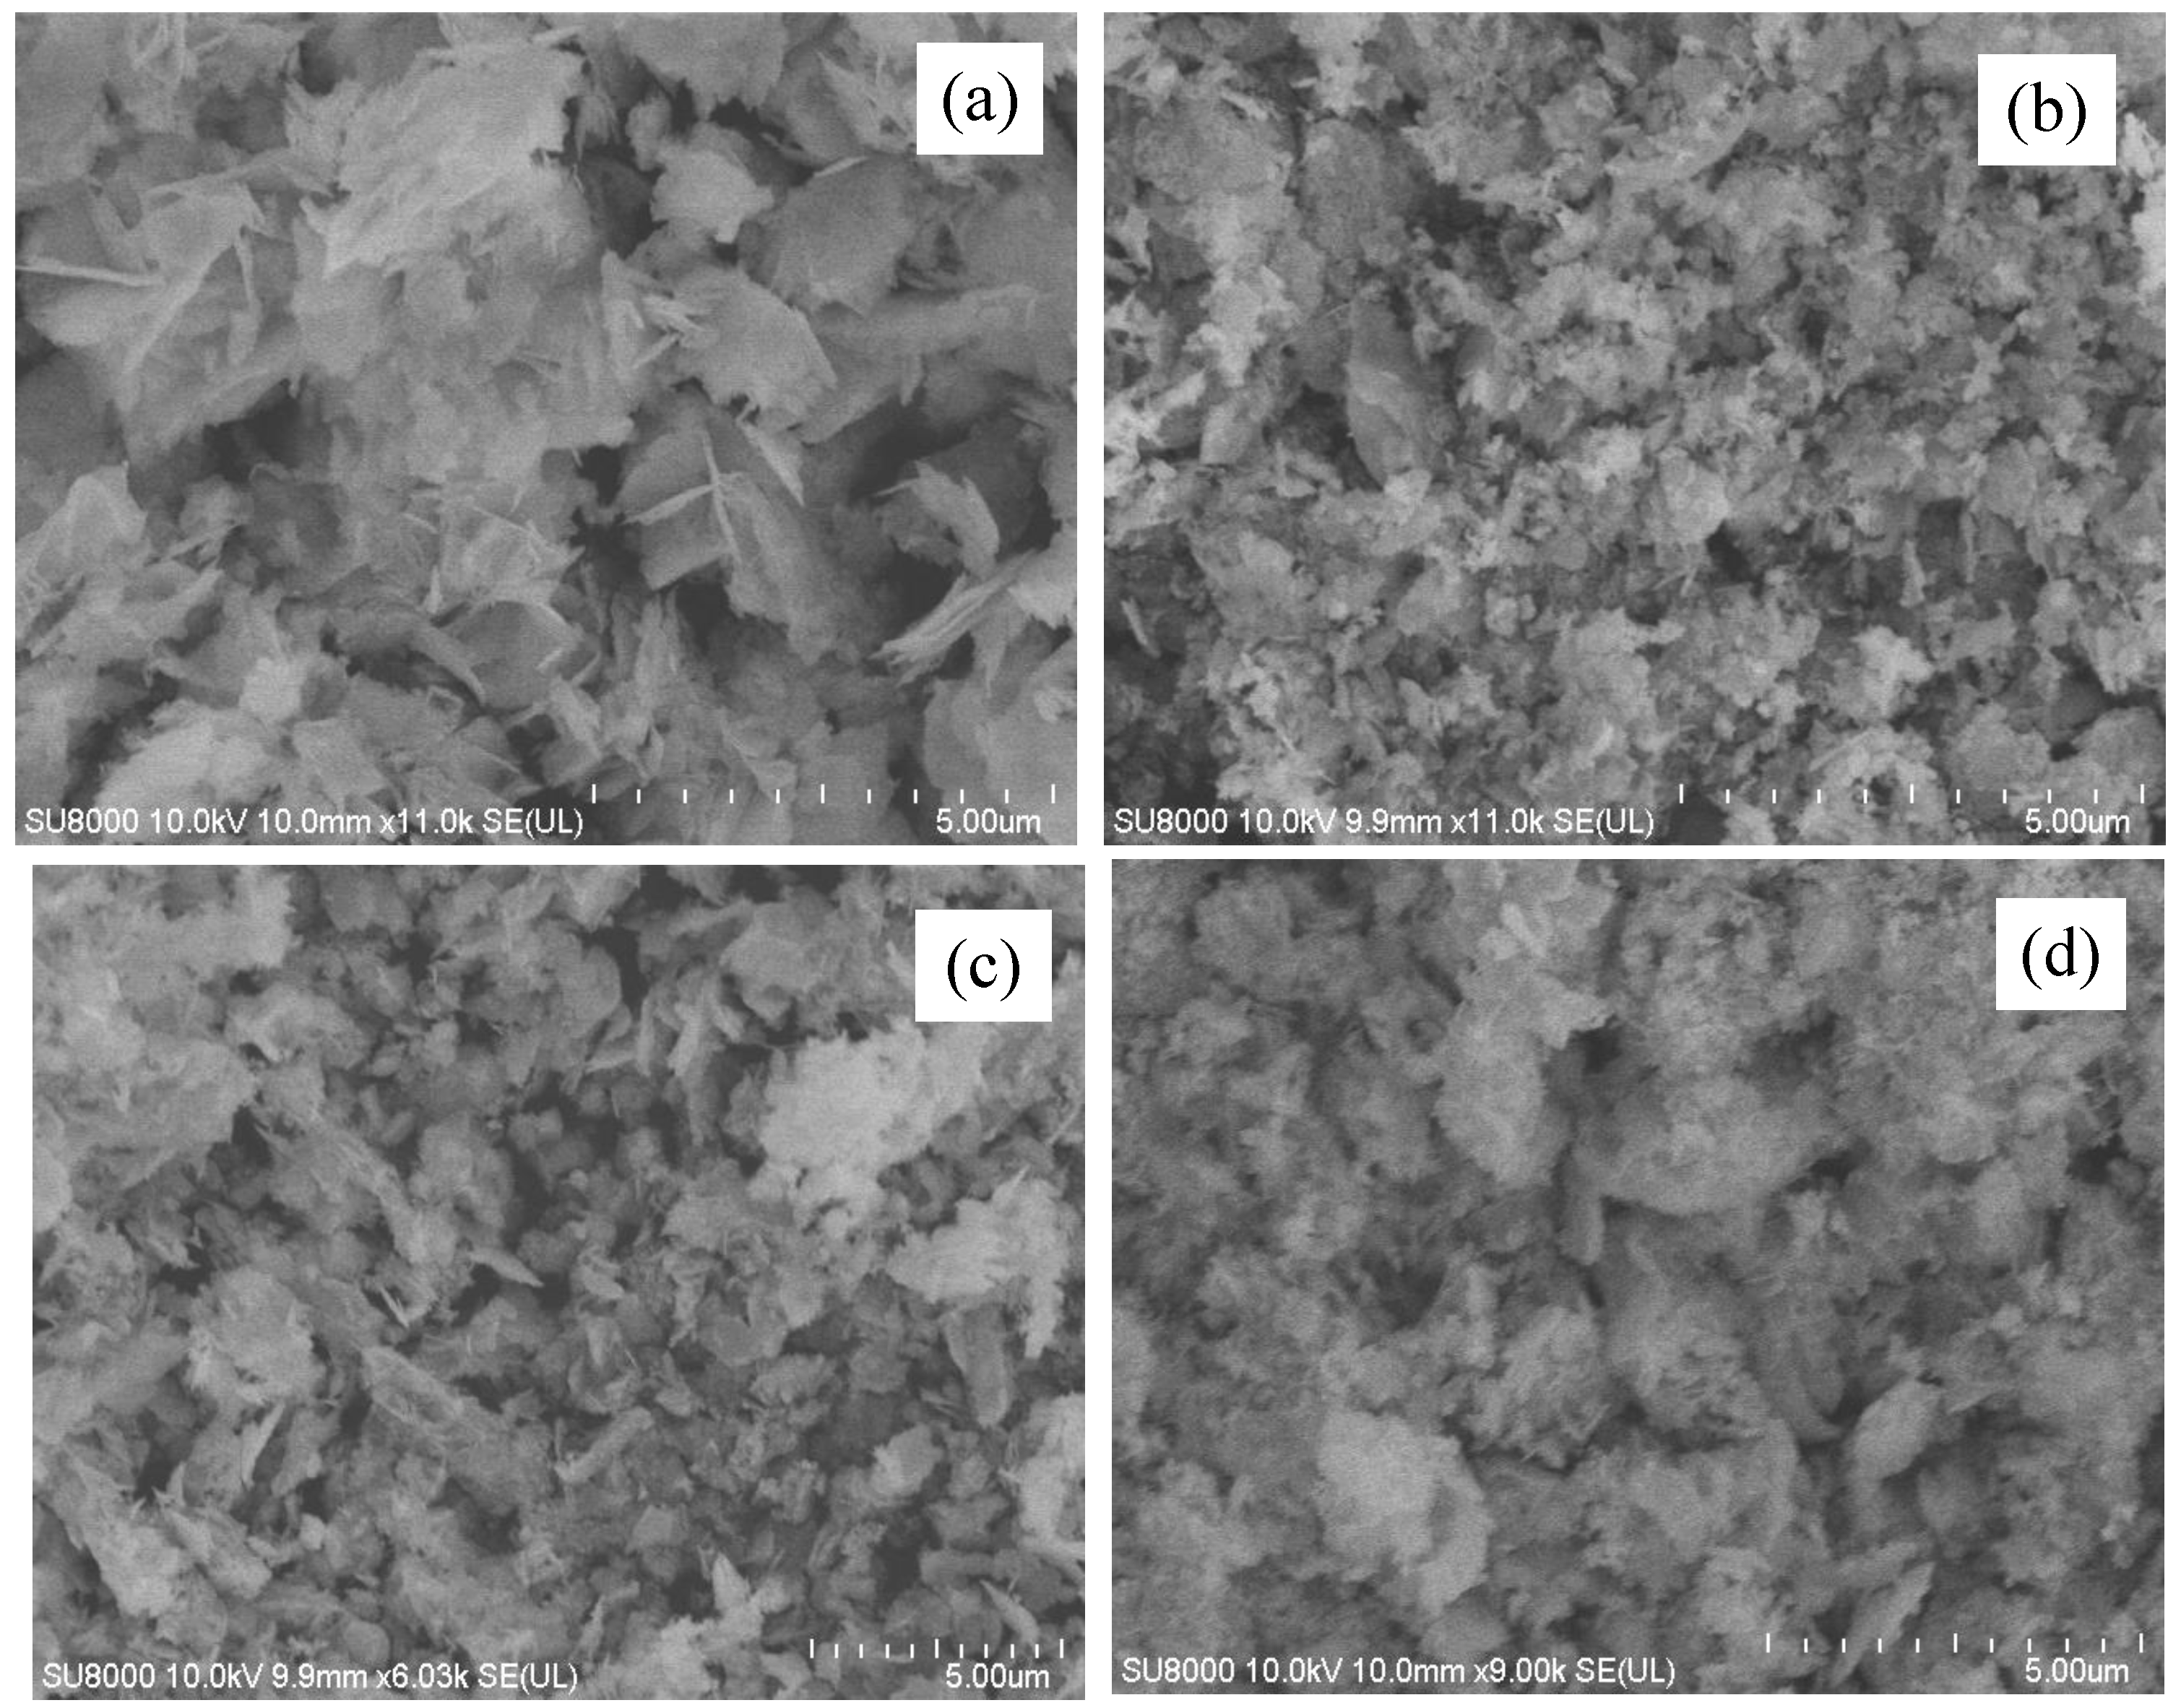
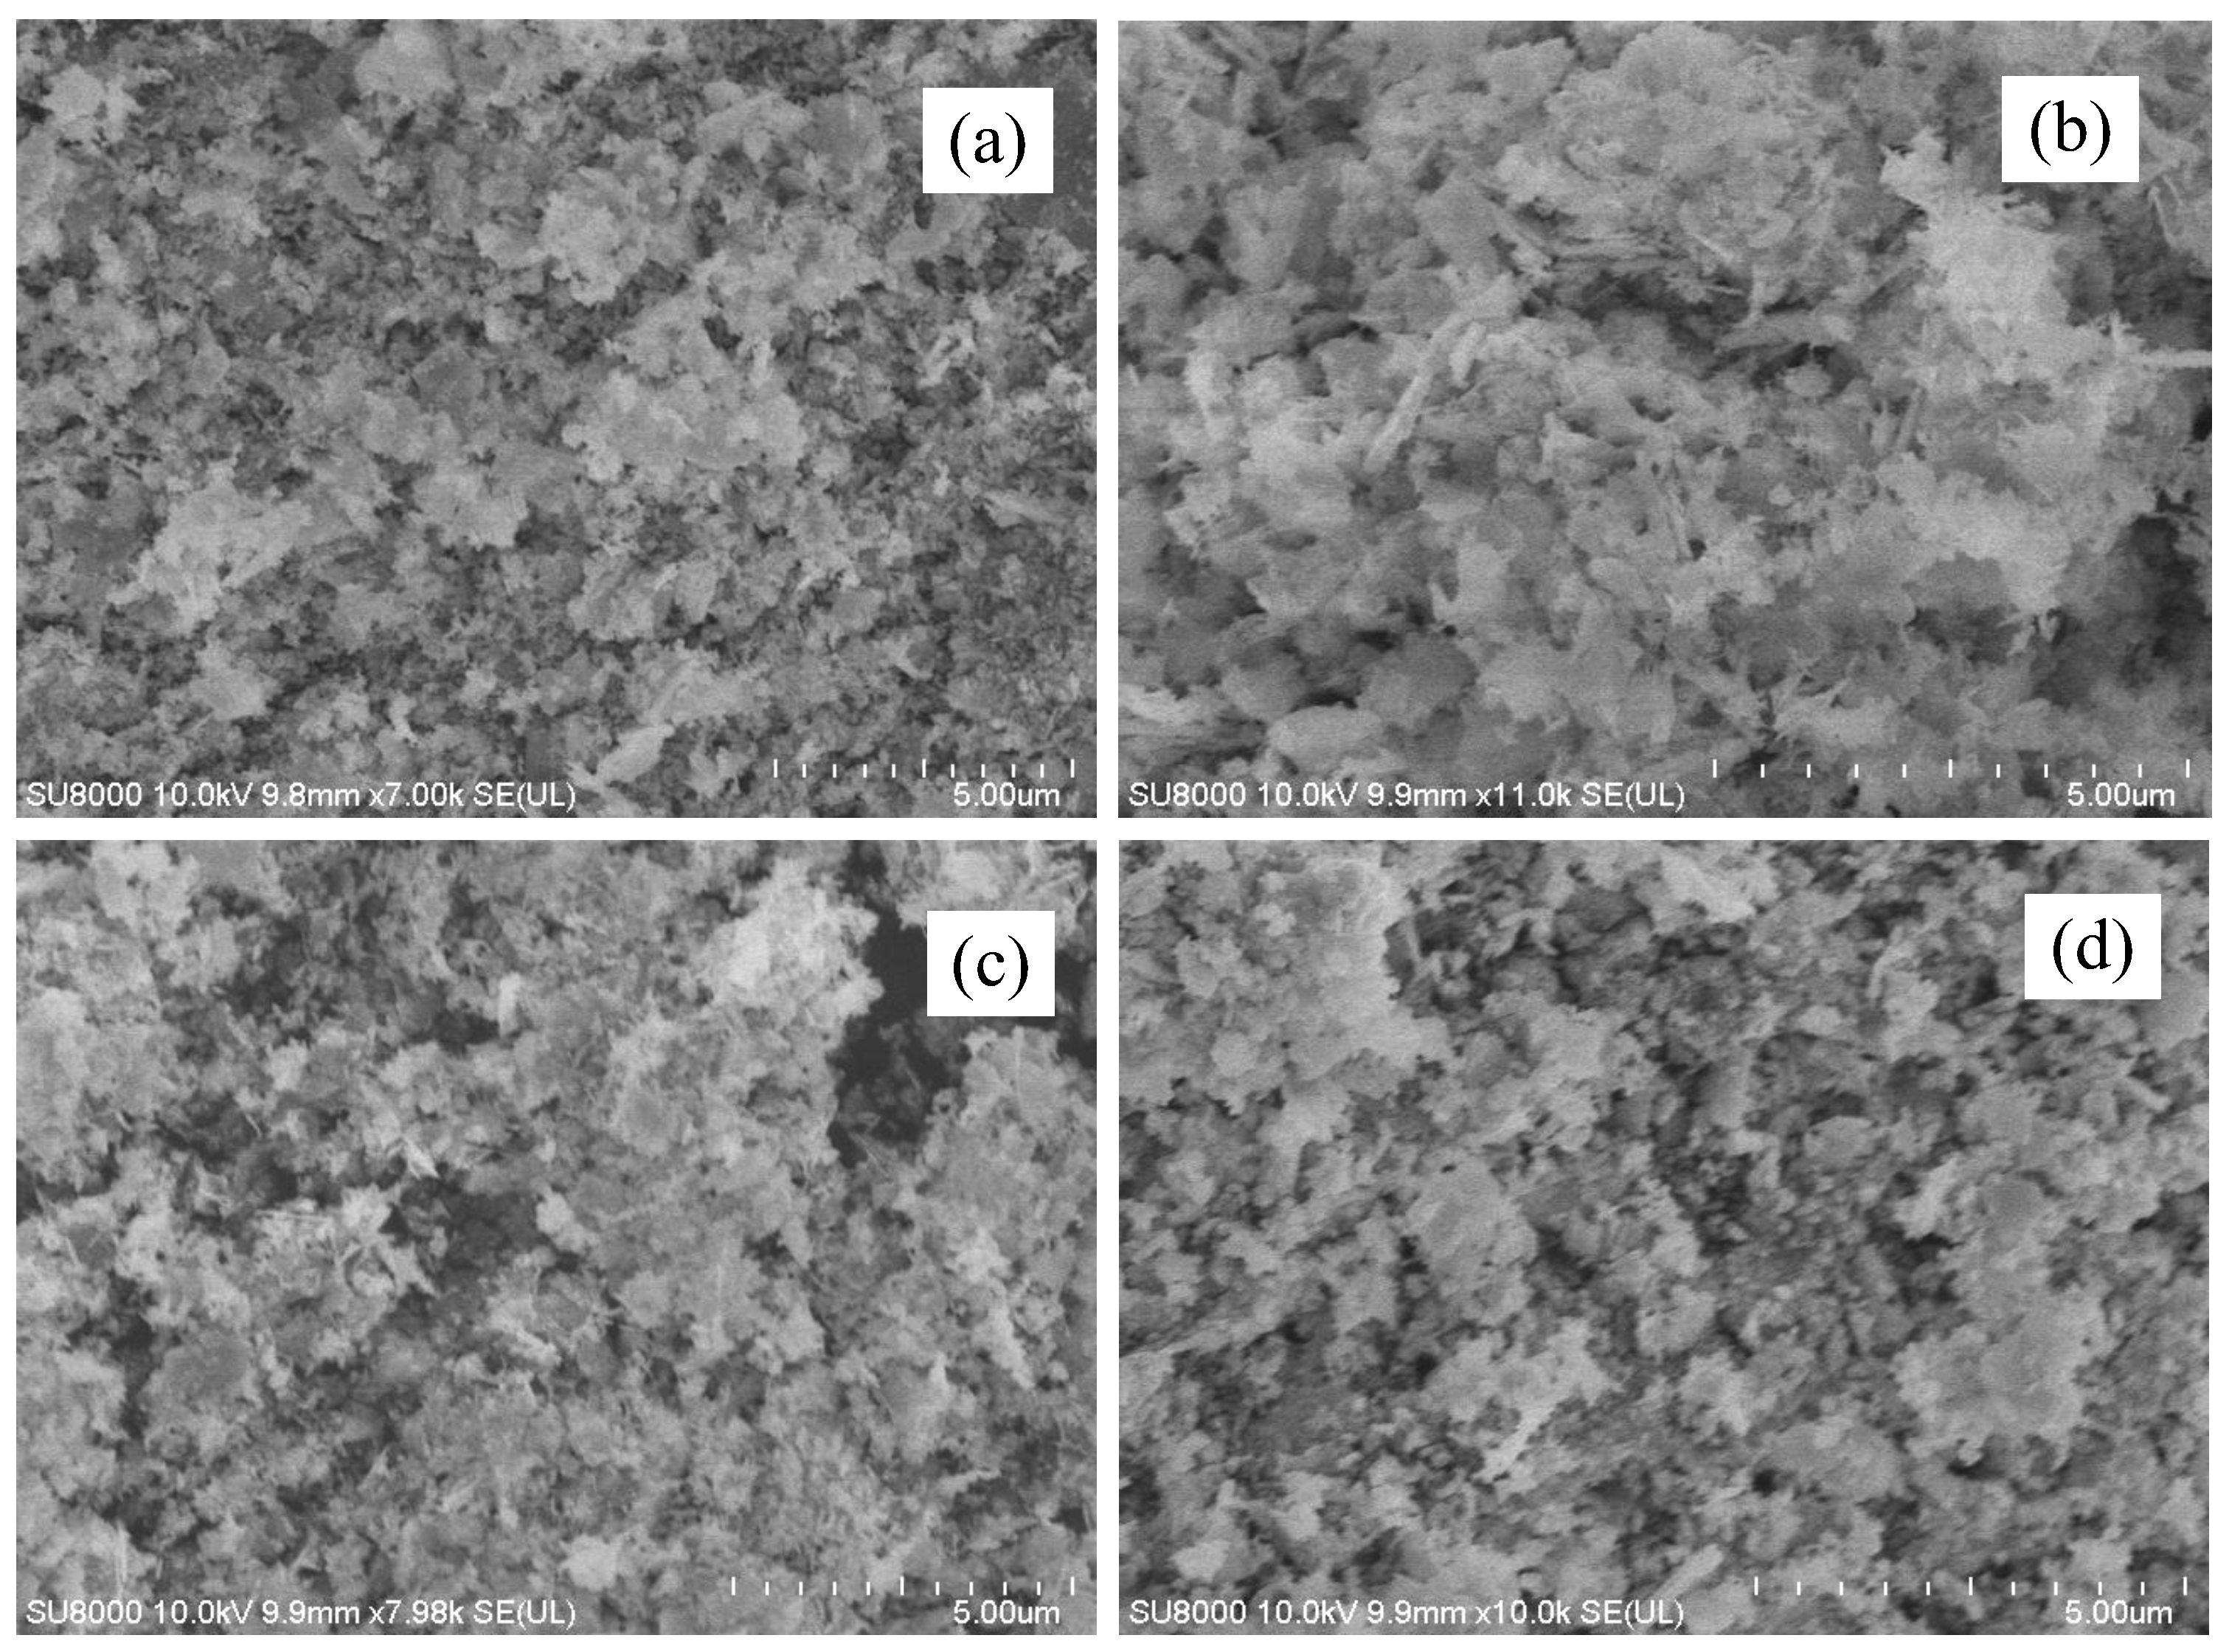
2.3. Scanning Electron Microscope (SEM) Analysis

In order to investigate whether the doped rare earth has an effect on the morphology of the samples, we carried out SEM characterization analysis of the undoped and doped samples after heat treatment at 300 °C. Figure 3 and Figure 4 show the SEM images of pure samples, light rare earth- and heavy rare earth-doped samples at the same magnification. As shown in Figure 3a, the pure sample heat-treated at 300 °C is a smooth surface lamellar structure. However, as shown in Figure 3b–d and Figure 4, after heat treatment at the same temperature, the integrity of the nanosheet structure of the sample is destroyed to a certain extent by rare earth doping. It can be seen from the photos in Figure 3b–d that although the nanosheet structure is slightly damaged due to the doping of a small amount of light rare earth, it is not difficult to find that the particles doped with light rare earth are refined and the particle size distribution of the sample is narrowed. As can be seen from the photographs of Figure 4, the heavy rare earth doping also has an effect on the phase morphology compared to the nanosheet structure of the pure sample. And these morphological changes caused by rare earth doping could facilitate the adsorption of the catalyst to the substrate molecules, thus enhancing its photocatalytic activity.

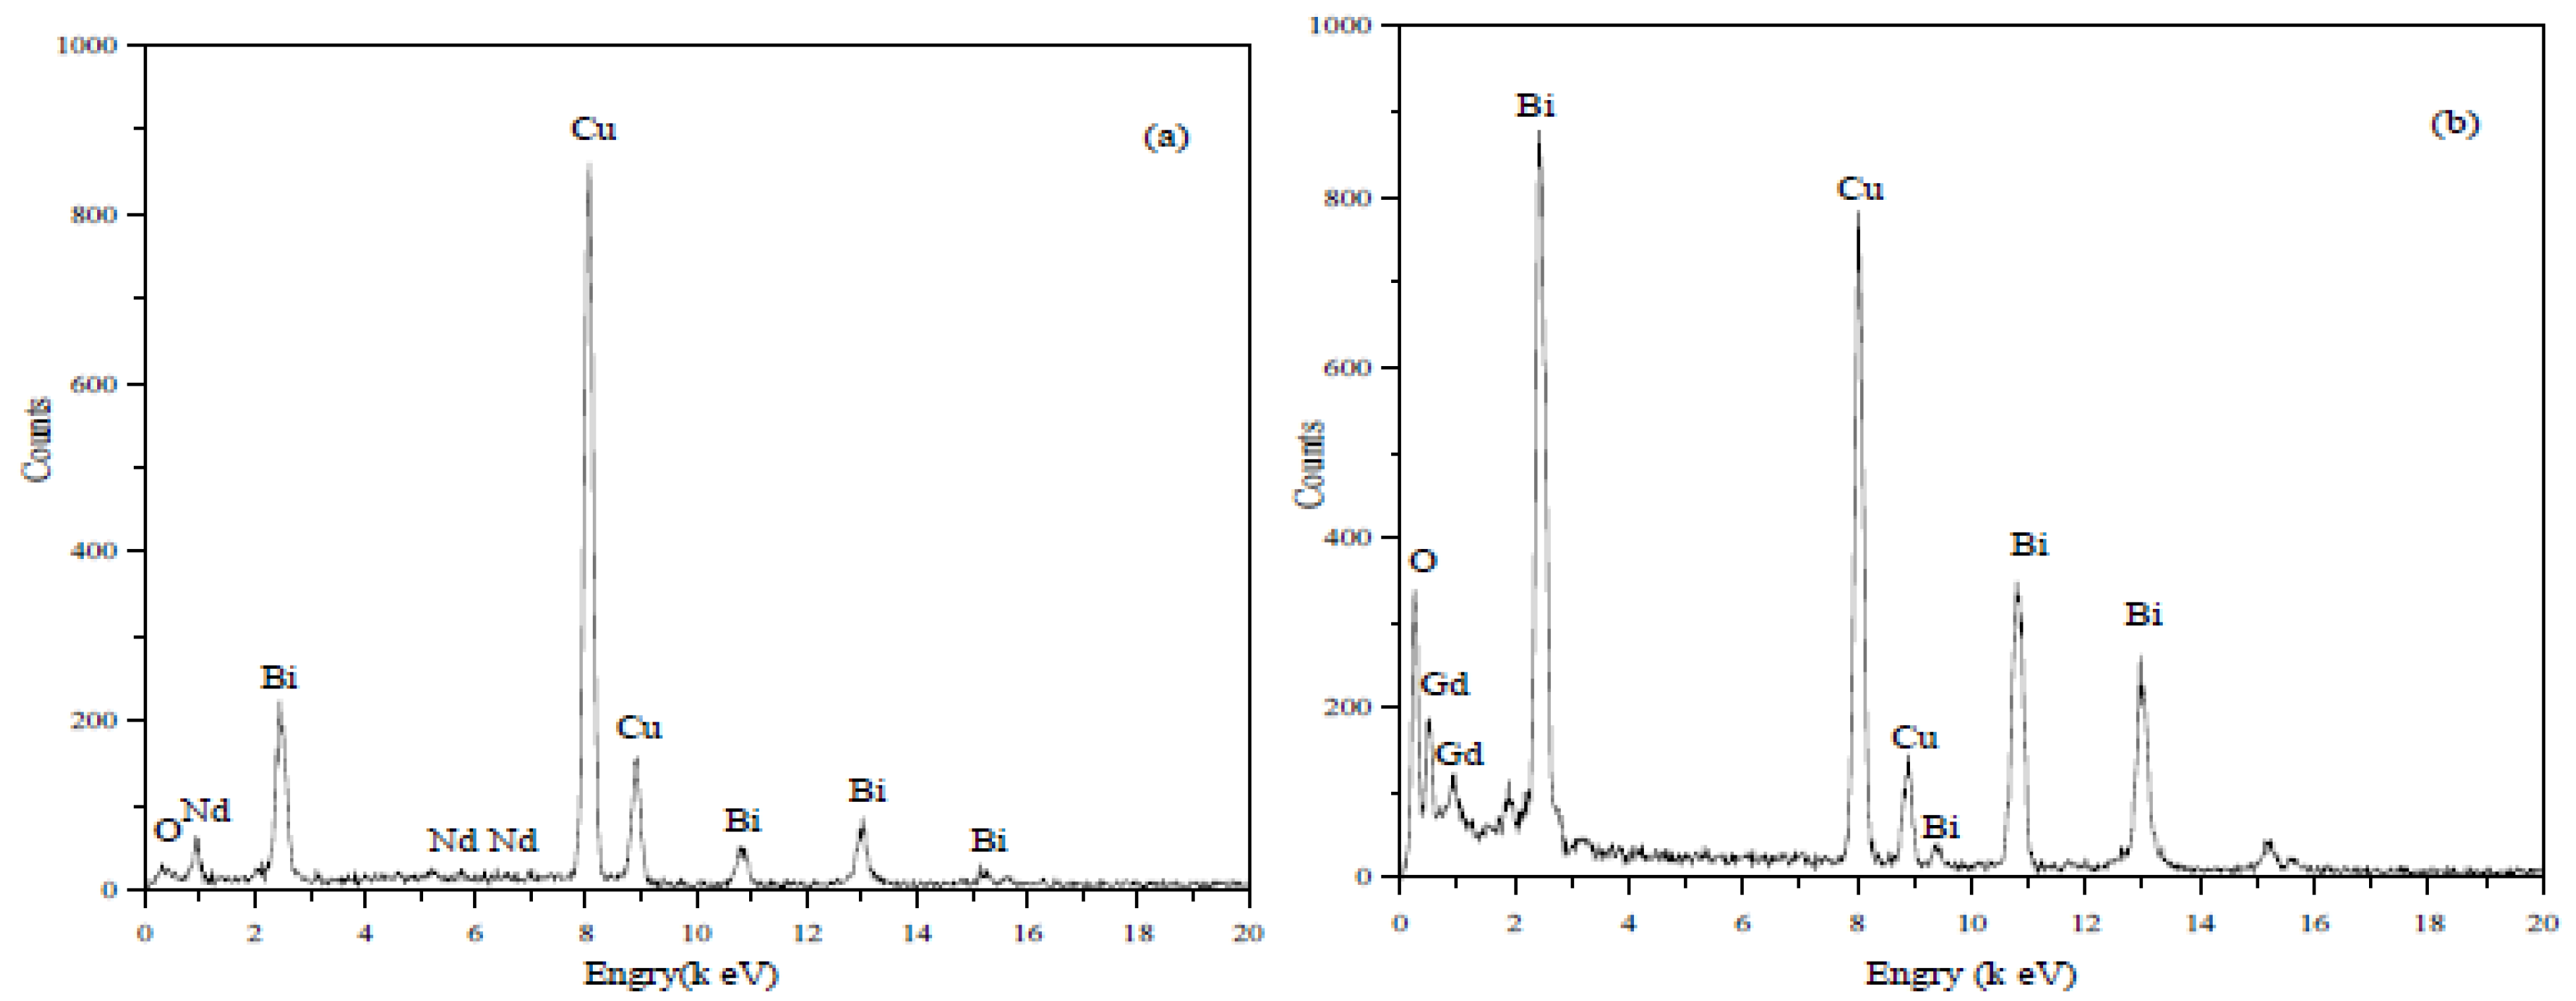
2.4. TEM and EDX Analysis

The TEM photographs of the light rare earth Nd- and heavy rare earth Gd-doped samples under heat treatment at 300 °C are given in Figure 5, and it can be found that the catalysts are composed of irregular nanosheets. The (2 1 0) crystal plane lattice spacing of Bi2O3 after Nd and Gd doping are indicated in Figure 5b,d, respectively, where the (2 1 0) lattice spacing is 0.336 nm for Nd doping and 0.338 nm for Gd doping. Compared to the (2 1 0) lattice spacing (0.346 nm) in JCPDS Standard Card 00-027-0050 for bare Bi2O3, the lattice shrinks in doped samples is due to the substitution of large Bi3+ ion by small Nd3+ and Gd3+ ion [28]. To explore the elemental composition of the irregular nanosheets, EDX selected area elemental analysis was performed. Figure 6 shows the EDX spectra of Nd- and Gd-doped catalysts, respectively. Figure 6a contains three elements of Nd, Bi and O and Figure 6b contains three elements of Gd, Bi and O, indicating that the rare earth-ion-doped samples synthesized by hydrothermal method do have the presence of rare earth ions.

2.5. Light Absorption and Specific Surface Area Analysis

The UV-Vis diffuse reflectance spectroscopy was used to analyze the light absorption ability of the samples. It can be seen from Figure 7 that the light absorption of the Bi2O2CO3 sample after calcination at 300 °C is mainly concentrated in the UV region with an absorption edge of 435 nm. After doping with different rare earth ions, the light absorption of the samples shows a significant red shift in the visible region, which is mainly due to the presence of earth ions. In addition, the introduced rare earth ions have strong electron capture ability, which can adjust the energy band structure of β-Bi2O3 and reduce its forbidden bandwidth. From Figure 7a, it can be found that the light response range of the light rare earth-doped samples is mainly concentrated in 539~546 nm. From Figure 7b, it can be seen that the light response range of the heavy rare earth-doped samples is mainly concentrated in 536~548 nm.
The band gap energy of the sample was calculated by drawing the Tauc plots as shown in Figure 8. Here, this linear region to the horizontal axis yields the energy of the optical band gap of the material.
The calculated band gap energy is shown in Table 1. The band gap energy of Bi2O2CO3 is 3.18 eV, and the effect of light rare earth and heavy rare earth doping on band gap energy is not much different. The band gap energy of doped Bi2O2CO3/β-Bi2O3 is 2.42~2.57 eV. The specific surface area of the sample was measured by N2 physical adsorption–desorption, and the results are shown in Table 1. From the table, it can be seen that the specific surface area of the Bi2O2CO3 sample is very small, only 5.4 m2/g, which is consistent with the previous SEM image analysis that the sample has a flake structure with a smooth surface. The specific surface area of the light rare earth- and heavy rare earth-doped samples has a significant increase, where the specific surface area of the light rare earth-doped Bi2O3/β-Bi2O3 increases to 10.9~14.5 m2/g, and the heavy rare earth-doped increases the specific surface area more significantly, with the specific surface area increasing to 13.9~17.3 m2/g. With the conclusion of the previous SEM analysis, it is concluded that rare earth doping makes the distribution of the sample particles narrower, with particle refinement and increased dispersion, thus causing an increase in specific surface area.

2.6. Fourier Transform Infrared Spectroscopy (FT-IR) Analysis

The FI−IR spectra of the pure sample and the light and heavy rare earth-doped samples are shown in Figure 9. The broad absorption peak near 3440 cm−1 is attributed to the OH-stretching vibration peak of the hydroxyl functional group on the sample surface, while the absorption peak at 1600 cm−1 corresponds to the bending vibration peak of H-O-H of physically adsorbed water on the catalyst surface. The absorption peak near 1390 cm−1 for the pure sample corresponds to the C-O stretching vibration peak in CO32−. The composite rare earth samples also have C-O absorption peaks near 1390 cm−1 due to the small amount of Bi2O2CO3 contained in the samples, but a significant decrease in the intensity of C-O absorption peaks can be observed before and after doping. The absorption peaks in the range of 400–700 cm−1 are attributed to Bi-O bonds and the absorption peaks near 835 cm−1 are Bi-O-Bi bonds. Comparing with the IR spectra of each sample, it can be found that the rare earth doping causes the stretching vibration peak at 835 cm−1 to be significantly weakened. Combined with the XRD characterization results, it is clear that the introduction of different rare earths promotes the stable existence of β-Bi2O3 at room temperature, and RE3+ may replace part of Bi3+ in the Bi2O3 lattice and form Bi-O-RE bond, thus making the Bi-O-Bi bond vibration peak at 835 cm−1 weakened. In addition, the formation of Bi-O-RE caused a change in the peak shape in the range of 400–700 cm−1.

2.7. Photocatalytic Activity

The photocatalytic activity of the samples was carried out by degrading 15 mg•L−1 DMP under light irradiation. As can be seen in Figure 10a, DMP is hardly degraded under light irradiation in the absence of a catalyst, which indicates that photolysis can be neglected. Figure 10a,b show the comparison of the degradation rate of DMP over catalysts doped with light rare earth and heavy rare earth, where C is the concentration of DMP after irradiation for t time and C0 is the initial concentration before light illumination. As seen from Figure 10, the degradation activity of Bi2O2CO3 for DMP was poor, with a degradation rate of only 17% at 150 min, mainly due to the large forbidden bandwidth of Bi2O2CO3 (3.18 eV) with poor absorption of visible light. The performance of the catalyst is greatly improved by doping rare earth, but the effect of each rare earth on the improvement of catalytic activity is quite different. Some of the rare earths showed distinct enhancement of photocatalytic activity, among which the light rare earths were Nd, Pr and Sm, and the heavy rare earths were Gd, Er and Yb. Among the light rare earths, Nd has the most obvious improvement in photocatalytic performance, and the degradation rate of DMP reaches 72% for 150 min of photoreaction, followed by Pr, with a degradation rate of 66%. Among the heavy rare earths, Er showed the most significant increase in photocatalytic activity, with 78% degradation rate, followed by Gd with 69% degradation rate.
In order to study the final mineralization efficiency of DMP in photocatalytic degradation, the total organic carbon (TOC) content during the reaction was tested and analyzed. The results of TOC removal rate are shown in Table 2, which shows that DMP can be basically degraded and mineralized into inorganic small molecules such as CO32−, CO2 and H2O in the photocatalytic reaction, resulting in a high removal rate of TOC. The enhancement effect of light rare earth and heavy rare earth doping on the TOC removal rate of DMP is basically the same.
Usually, the active species involved in the photocatalytic degradation of organic pollutants are O2•−, h, and •OH radicals. Here, we selected p-benzoquinone (BZQ), disodium EDTA (Na2-EDTA) and isopropanol as the quenchers for O2•−, hole and •OH, respectively. Figure 11a shows that with the addition of BZQ or Na2-EDTA, a fast deactivation of Nd-Bi2O2CO3/β-Bi2O3 was observed, indicating that both O2•− and holes are the main active species for DMP degradation. However, the role of •OH radicals in DMP degradation could be ignored. The stability of the as-prepared Nd-Bi2O2CO3/β-Bi2O3 was evaluated by cyclic utilization under the same reaction conditions. As shown in Figure 11b, the degradation rate of DMP after 150 min visible light irradiation was 74% in the first run, and the degradation rate value was ~64% in the fourth run, indicating its good stability.
Photogenerated charge transfer kinetics is studied using electrochemical impedance spectroscopy (EIS). As shown in Figure 12a, the sample doped with light and heavy rare earth ions has a much smaller arc than that of pure Bi2O2CO3, which indicates that the doping ions accelerate the photogenerated electron–hole pair separation and carrier migration at the electrode/electrolyte interface. The separation efficiency of the photogenerated charge carriers was detected using the transient photocurrent response. It is also shown in Figure 12b that the composites have higher photocurrent density after doping with ions and exhibit better separation efficiency of photogenerated charge carriers.
We used Mott–Schottky (MS) curves to reveal the energy band positions of β-Bi2O3 and Bi2O2CO3. Since the slopes of both curves are positive, we assume that β-Bi2O3 and Bi2O2CO3 are n-type semiconductors. From Figure 13a,b, we know that the flat-band potentials of β-Bi2O3 and Bi2O2CO3 are −0.026 V and 0.15 V, respectively (vs. Ag/AgCl, pH = 7). In addition, the conduction band (CB) of general n-type semiconductor is more negative than the flat potential (about 0.1 V). Therefore, the CB potentials of β-Bi2O3 and Bi2O2CO3 are about −0.126 V and 0.05 V, respectively, which are equivalent to 0.114 V and 0.29 V compared to the normal hydrogen electrode (NHE, pH = 7). We have known the band gap values of β-Bi2O3 and Bi2O2CO3 by Formula:
ECB = EVBEg
We can calculate the β-Bi2O3 and Bi2O2CO3 valence band (VB) potentials, which are 2.33 V and 3.28 V (vs. NHE, pH = 7), respectively.
The VB edge positions of Bi2O2CO3 and α-Bi2O3 were estimated according to the electronegativity. The CB and VB potentials of the two semiconductors at the point of zero charge can be calculated by the following equation:
EVB = XEe + 0.5 Eg
where X is the absolute electronegativity of the semiconductor, which is defined as the geometric mean of the absolute electronegativity of the constituent atoms; Ee is the energy of free electrons on the hydrogen scale (ca. 4.5 eV); EVB is the VB edge potential; and Eg is the band gap of the semiconductor obtained from the UV-visible diffuse reflectance absorption. Therefore, the band gaps of Bi2O2CO3 and α-Bi2O3 are 3.28 and 2.22 eV, respectively. The CB position can be deduced from the equation ECB = EVBEg. The X values for Bi2O2CO3 and α-Bi2O3 are 6.47 and 5.77 eV respectively. On the basis of the above equations, the top of the VB and the bottom of the CB of Bi2O2CO3 are calculated to be 3.56 and 0.28 eV, respectively. Accordingly, the VB and CB of α-Bi2O3 are estimated to be 2.33 and 0.11 eV, respectively.
The main reason for the enhanced photocatalytic degradation efficiency of DMP by doped light and heavy rare earth samples is that the rare earth-doped samples calcined at 300 °C produced a mixed crystalline phase of Bi2O2CO3 and β-Bi2O3. The forbidden bandwidth of β-Bi2O3 is smaller (2.22 eV), so the absorption of visible light by the samples is enhanced. The Bi2O2CO3/β-Bi2O3 heterogeneous phase junction formed by the simultaneous mixing of crystalline phases can enhance the separation efficiency of photogenerated electrons and holes [28]. Secondly, the doping of rare earths changes the grain size and morphology of the samples, and the rare earth-doped samples have finer grains and a larger specific surface area, which improves the adsorption capacity of the molecules of the degradation target DMP. Finally, the doped rare earth ions (RE3+) can trap photogenerated electrons and further promote the separation of photogenerated holes [29,30], which generates more holes to participate in the degradation reaction of DMP and enhances the photocatalytic degradation ability. The reaction mechanism of DMP degradation by Bi2O2CO3/β-Bi2O3 doped with rare earth elements is shown in Figure 14. The difference in the photocatalytic performance of Bi2O3 caused by different rare earth ion doping may be related to the filled state of the electronic structure of the 4f layer of rare earth elements [31].

3. Experimental

3.1. Materials

Bismuth nitrate pentahydrate (Bi(NO3)3·5H2O, 99.99%), acetate (CH3CO2H, ≥99.8%), lanthanum nitrate hexahydrate (La(NO3)3·6H2O, 99.99%), cerium nitrate hexahydrate (Ce(NO3)3·6H2O, 99.99%), praseodymium nitrate hexahydrate (Pr(NO3)3·6H2O, 99.99%), neodymium nitrate hexahydrate (Nd(NO3)3·6H2O, 99.99%), samarium (III) nitrate hexahydrate (Sm(NO3)3·6H2O, 99.99%), europium nitrate hexahydrate (Eu(NO3)3·6H2O, 99.99%), gadolinium (III) nitrate hexahydrate (Gd(NO3)3·6H2O, 99.99%), terbium (III) nitrate hexahydrate (Te(NO3)3·6H2O, 99.9%), dysprosium nitrate hexahydrate (Dy(NO3)3·6H2O, 99.99%), holmium (III) nitrate hexahydrate (Ho(NO3)3·6H2O, 99.99%), erbium nitrate hexahydrate (Er(NO3)3·6H2O, 99.99%), thulium (III) nitrate hexahydrate (Tm(NO3)3·6H2O, 99.99%), ytterbium nitrate hexahydrate (Yb(NO3)3·6H2O, 99.99%), lutetium nitrate hexahydrate (Lu(NO3)3·6H2O, 99.99%), sodium sulfate (Na2SO4, 99.99%), potassium ferrocyanide trihydrate (K4FeC6N6·3H2O, 99.99%), p-Benzoquinone (C6H4O2, 99%), ethylenediaminetetraacetic acid disodium salt dihydrate (C10H14N2Na2O8·2H2O, 99.99%) and isopropyl alcohol (C3H8O, 99%) were purchased from Aladdin. All chemicals were used directly without further purifications.

3.2. Sample Synthesis

First, 2.3 g Bi(NO3)3·5H2O was weighed and dissolved in a mixed solution of 3 mL of glacial acetic acid and 20 mL of deionized water. Under magnetic stirring, after the Bi(NO3)3·5H2O was completely dissolved, an appropriate amount of RE(NO3)3·6H2O (RE = La, Ce, Pr, Nd, Sm, Eu, Gd, Tb, Dy Ho, Er, Tm, Yb, Lu) was added, and the molar ratio of RE3+:Bi3+ ions was controlled to be 4%. Then, 1 mol·L−1 NaOH solution was added drop by drop to adjust the pH of the solution to 6–7. Vigorously stirring for 1 h, it was put into a 100 mL polytetrafluoroethylene liner, heated at 140 °C for 14 h, and cooled to room temperature to obtain a precipitate which was washed several times with deionized water, dried in a constant temperature drying oven at 60 °C for 6 h. Finally, the prepared precursor was calcined in a muffle furnace at 300 °C for 4 h (the heating rate was controlled at 3 °C/min) to obtain a yellow powder. The preparation of pure Bi2O2CO3 is prepared as shown above, except that no additional RE(NO3)3-6H2O needs to be added.

3.3. Characterization

The sample crystal phase structure was analyzed by Bruker D8 Advance type XRD instrument. The copper target was Cu Kα with λ = 0.15 nm, the operating voltage was 40 kV and the current was 40 mA. Scanning electron microscope (SEM) is an XL30 SEM produced by Philips in the Netherlands, which can be used to observe the apparent morphology and particle size distribution of the photocatalyst samples. The shape, size, dispersion and particle size distribution of the nanoparticles were observed with a Philips CM-120 TEM from the Netherlands. The FT−IR spectra were measured on a Nicolet-470 infrared spectrometer. The UV-visible diffuse reflectance spectra were measured on a Shimadzu 2550 UV-visible spectrophotometer with a large integrating sphere solid powder diffuse reflectance attachment, using BaSO4 as the standard reference material, and the scanning range of 200–600 nm. Thermogravimetric and differential thermal analyses of the samples were performed on a Perkin Elmer TGA7 thermogravimetric-differential thermal analyzer (air atmosphere and reference alumina). The temperature rise range was 30 ℃~600 ℃, and the temperature rise rate was 10 ℃/min.

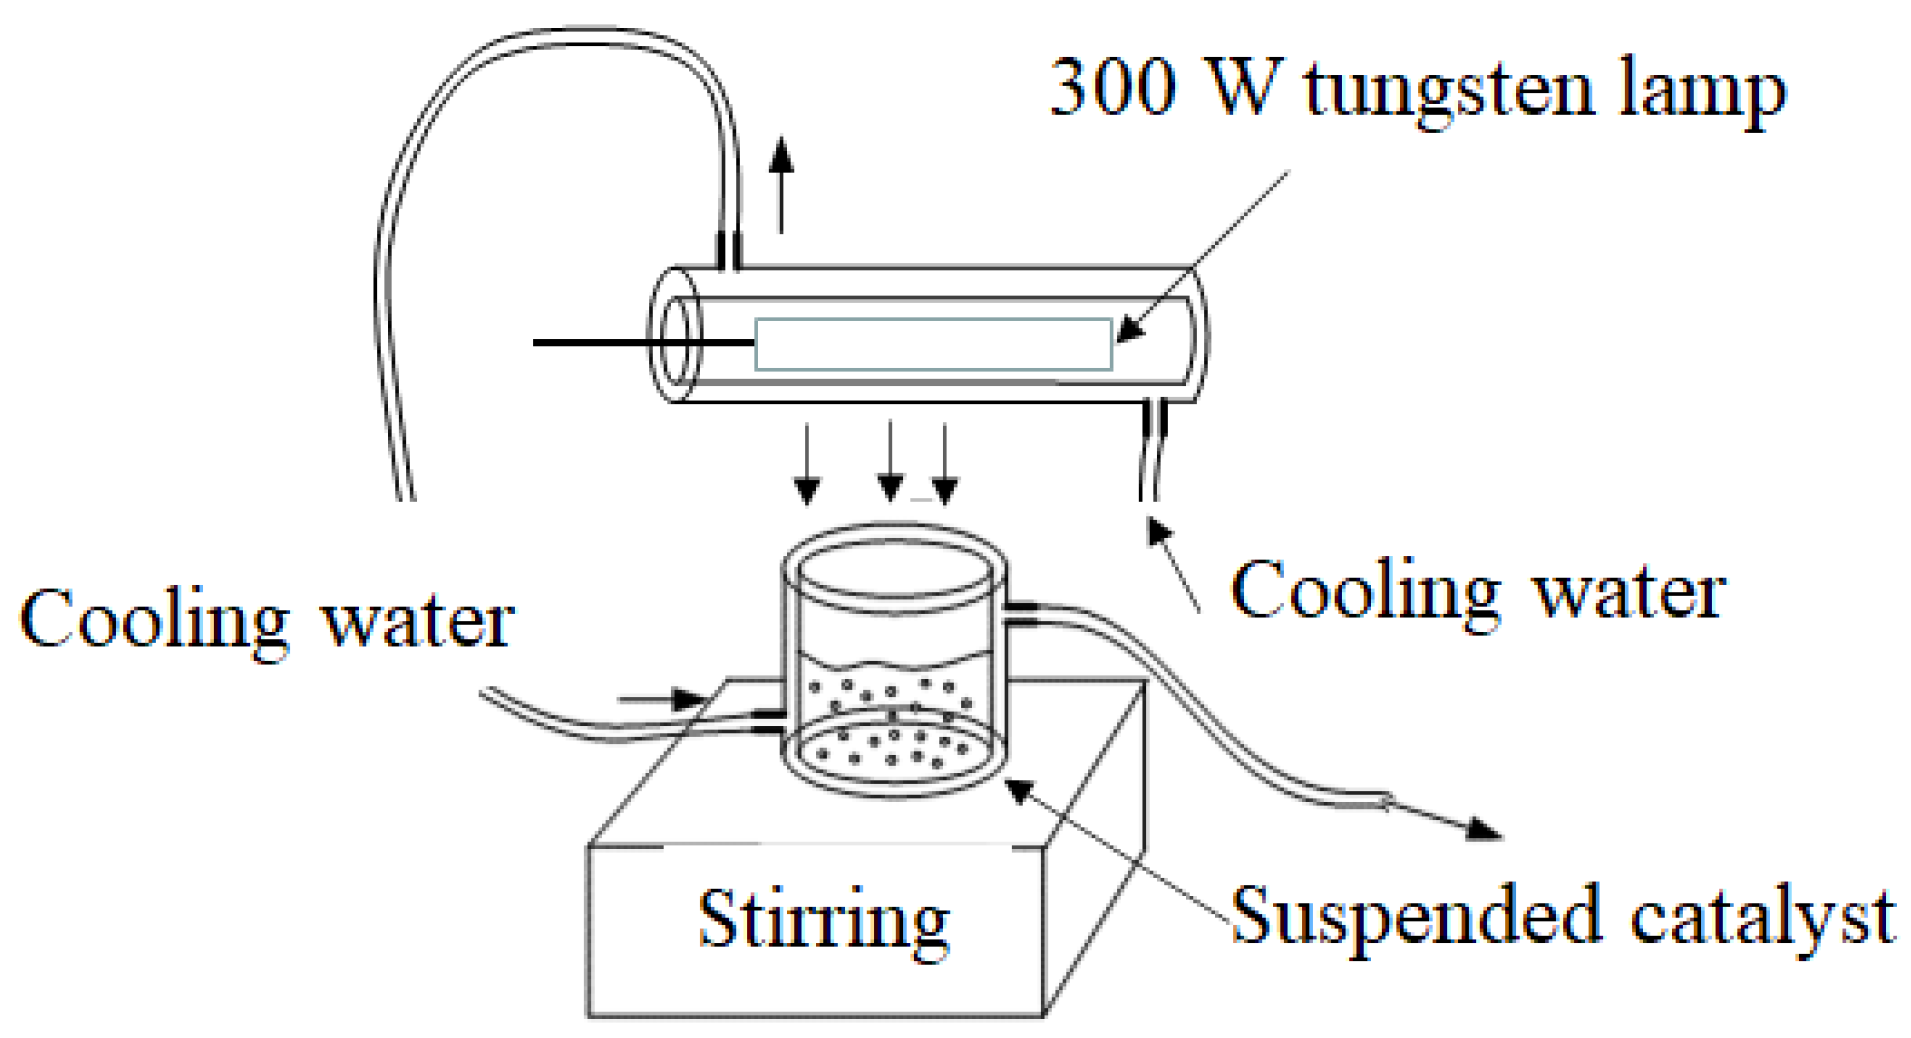
3.4. Photocatalytic Activity Evaluation

The photocatalytic activity of the prepared samples was tested by the degradation of DMP in aqueous solution under tungsten lamp (300 W) irradiation. The experimental setup is shown in Figure 15. The tungsten lamp was placed in a cylindrical Pyrex vessel surrounded by a circulating cooling water jacket. A 0.05 g photocatalyst was suspended in 80 mL aqueous solution of DMP (C0 = 0.015 g/L). Before the lamp was turned on, the suspension was stirred in the dark for 40 min to reach the physical adsorption–desorption equilibrium of DMP over photocatalyst. The pH value of the suspension is around 7. The suspension was vigorously stirred during reaction, and its temperature was maintained at 22 ± 2 °C by circulation of water through an external cooling coil. The role of the cooling jacket is to cool the suspension liquid. The trapping test was performed by adding BZQ as an O2− quencher, Na2-EDTA as a cavity quencher, and isopropanol as an -OH quencher to the above containers.
At given intervals, 4 mL solution was sampled and centrifuged by high speed to remove catalyst particles. The concentration of DMP was determined by high-performance liquid chromatography (HPLC, Agilent 1200, Palo Alto, CA, USA) using a system with a UV detector. The TOC content in the solution was monitored by a TOC analyzer (Aurora 1030C, OI Analytical, College Station, TX, USA).

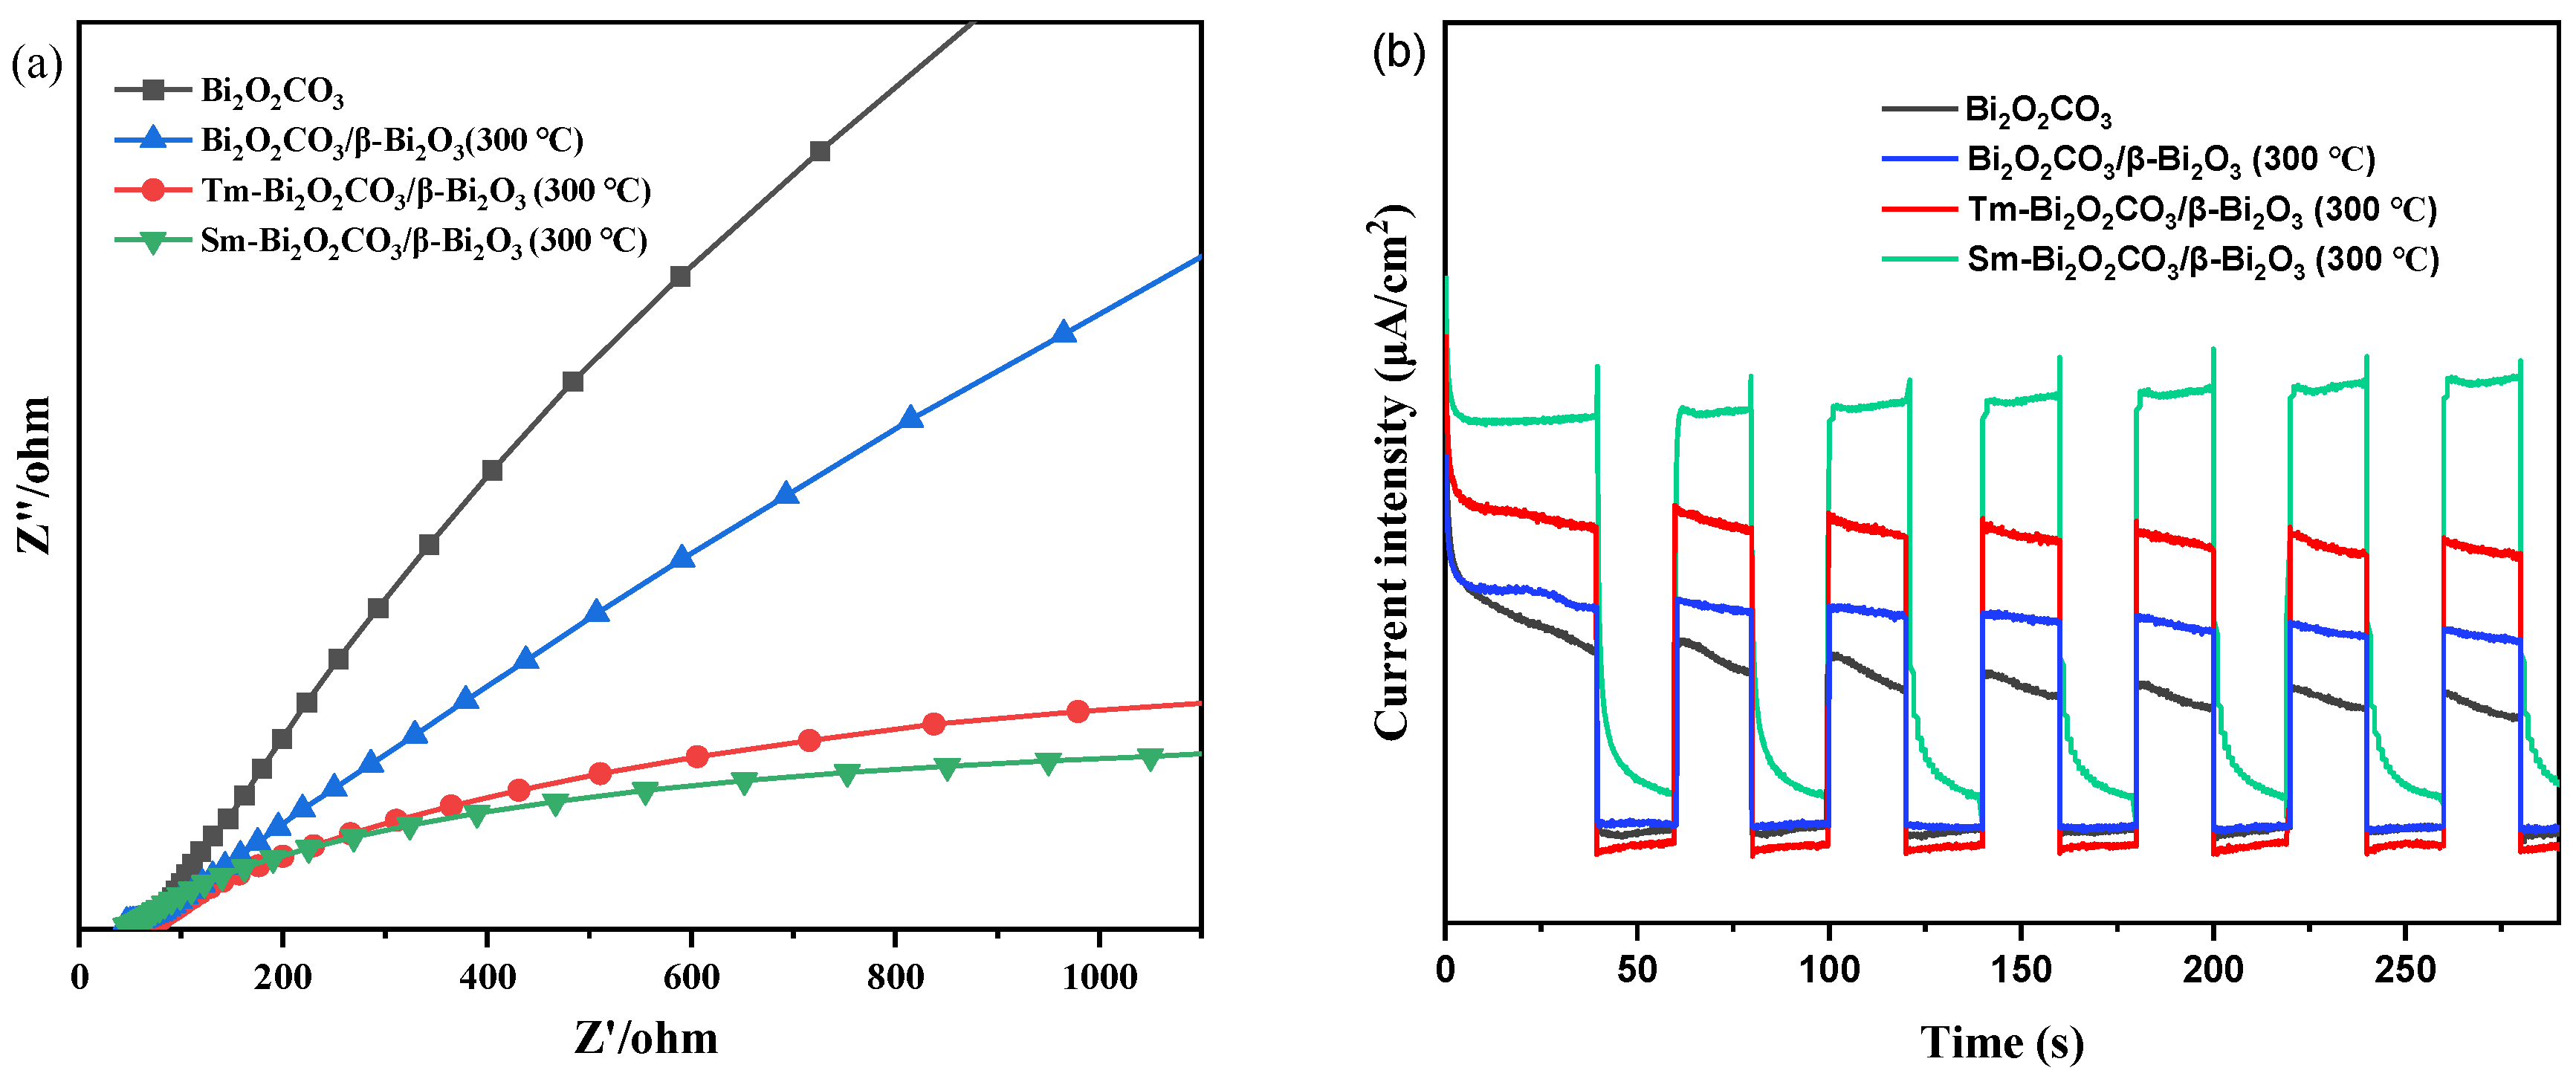
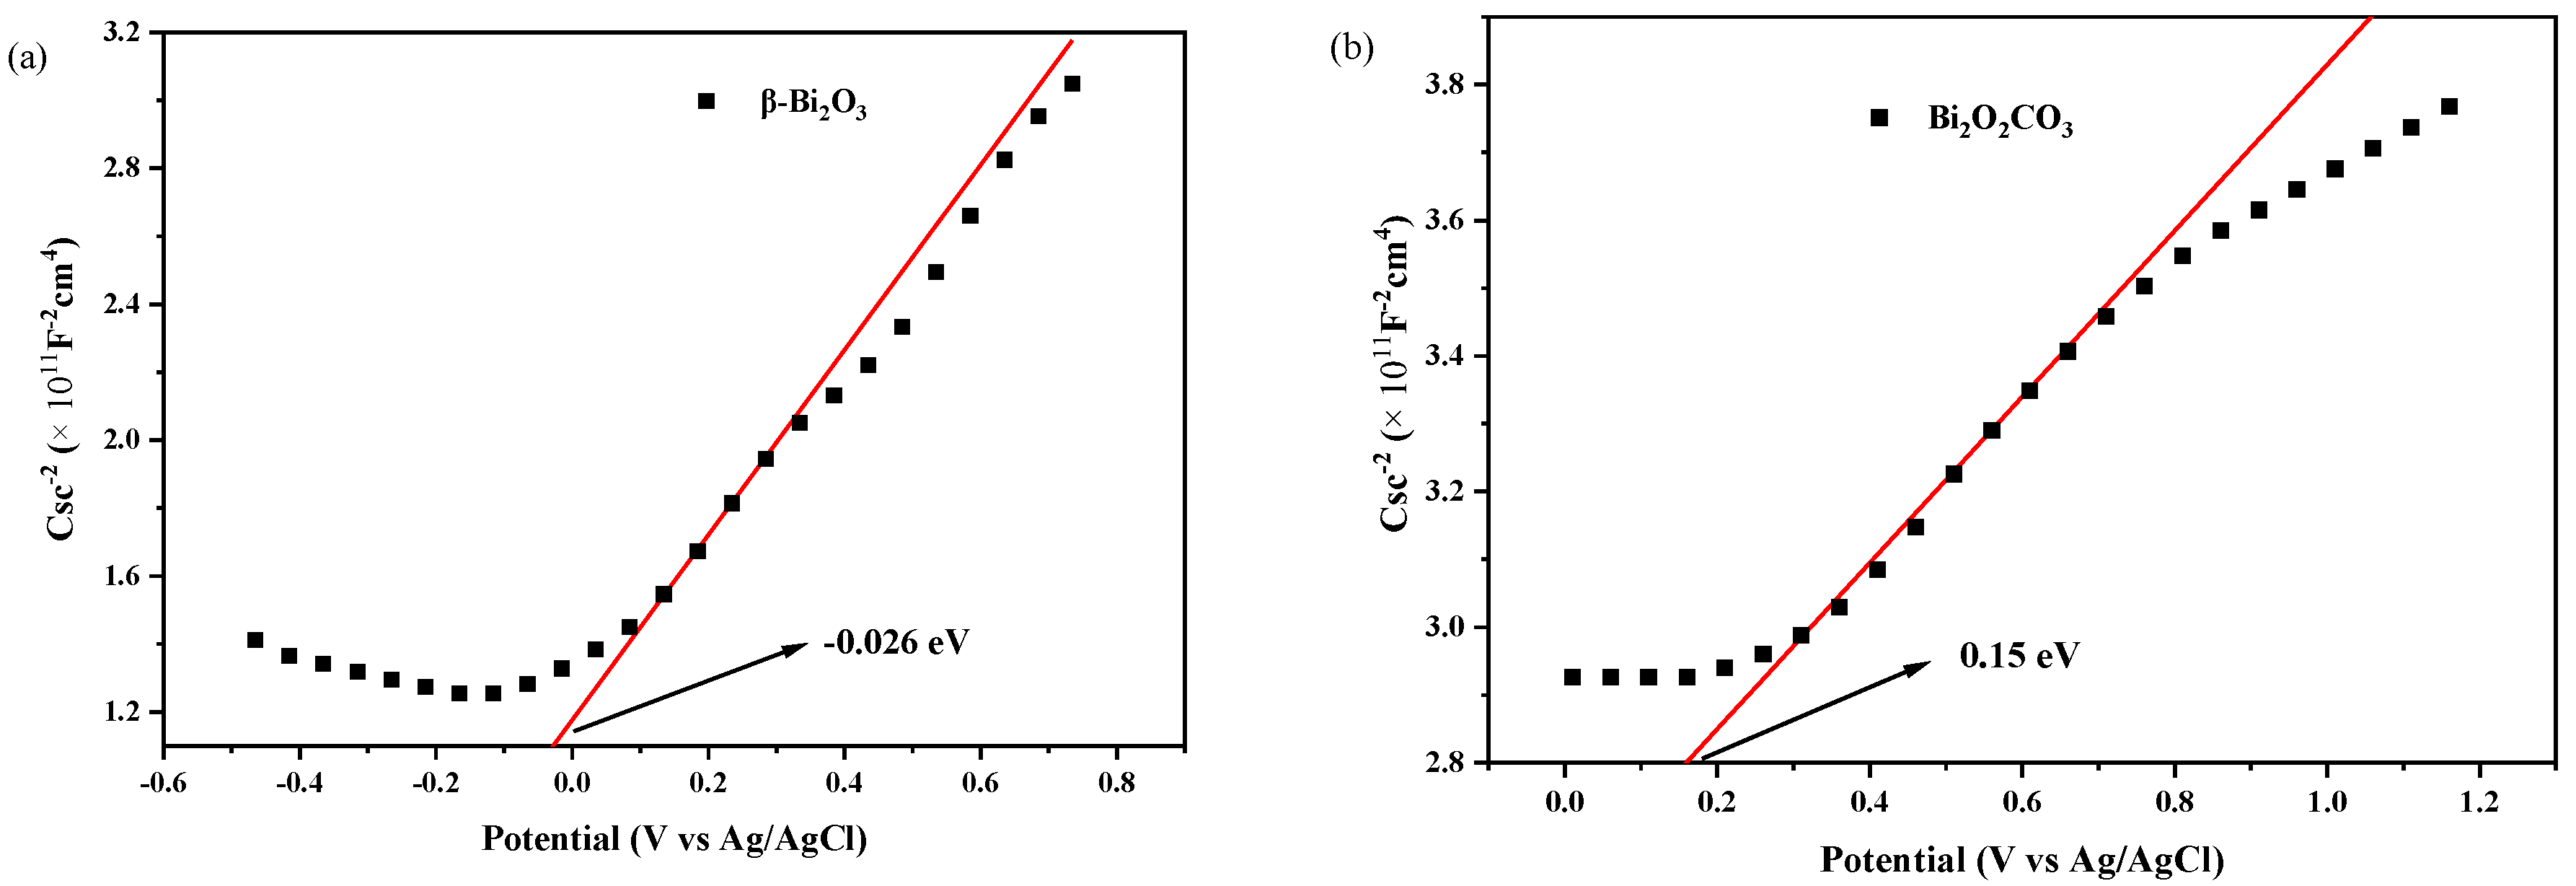
3.5. Photoelectrochemical Measurements

The photocurrent (IT) response of the catalyst, EIS analysis and MS were measured in a three-electrode system on an electrochemical analyzer (CHI660E) with platinum wire as the counter electrode, Ag/AgCl as the reference electrode and fluorine-doped tin oxide (FTO) glass coated with photocatalyst as the working electrode. A 1.5 mL centrifuge tube containing 5 mg of photocatalyst was added to 0.5 mL of ethanol and sonicated for 30 min to disperse the catalyst in the ethanol, then 10 uL of Nafion 117 perfluorinated resin was added to the solution and shaken well. A 1 cm × 1 cm FTO conductive glass sheet was then painted with the solution prepared above and the FTO conductive glass was allowed to dry with the solution and nail polish was brushed around it. Finally, the FTO conductive glass was dried in an oven at 60 °C for 2 h. IT, EIS analysis and MS were performed in electrolyte solutions of 0.1 M Na2SO4, 0.1 M K4[Fe(CN)6] and 0.5 M Na2SO4, respectively.

4. Conclusions

A series of pure Bi2O2CO3 and light and heavy rare earth-doped Bi2O2CO3 samples were prepared by hydrothermal method. The changes of crystalline phase composition and physical structure of the samples after calcination at 300 °C were investigated, and it was found that the samples without rare earth doping were basically Bi2O2CO3 crystalline phase after calcination. Under the calcination condition, the rare earth doping promoted the transformation of Bi2O2CO3 to β-Bi2O3 crystalline phase to obtain the rare earth-doped Bi2O2CO3/β-Bi2O3 mixed crystalline phase photocatalyst. The photocatalytic degradation of phthalates showed that rare earth doping exhibited a good enhancement of the photocatalytic degradation activity of DMP. Nd, Pr, and Sm in light rare earths and Gd, Er and Yb in heavy rare earths display the most obvious effect. The rare earth doping made the obtained samples have a strong absorption of visible light. Moreover, the formation of Bi2O2CO3/β-Bi2O3 heterogeneous phase junction enhanced the separation of photogenerated electrons and holes. In addition, the rare earth-doped samples had larger specific surface area and better adsorption ability to the molecules of the degradation target DMP, which could promote the photocatalytic degradation ability.

Author Contributions

Conceptualization, C.Y. and X.L.; methodology, C.Y. and X.L.; software, Q.H.; validation, Q.H., X.L., F.L. (Feng Li), F.L. (Fang Li) and L.T.; formal analysis, X.L.; investigation, Q.H.; resources, C.Y.; data curation, Q.H.; writing—original draft preparation, Q.H.; writing—review and editing, Q.H.; visualization, C.Y.; supervision, C.Y.; project administration, C.Y.; funding acquisition, C.Y.; All authors have read and agreed to the published version of the manuscript.

Funding

This research was funded by National Natural Science Foundation of China (22272034, 22078072), Guangdong Province Universities and Colleges Pearl River Scholar Funded Scheme (2019), Guangdong Basic and Applied Basic Research Foundation (2021A1515010305, 2022A1515011900), Environment and Energy Green Catalysis Innovation Team of Colleges and Universities of Guangdong Province (2022KCXTD019), Science and Technology Project of Maoming (2020KJZX035, 2020578), the Featured Innovation Project of Guangdong Education Department (2021ZDZX4060), Scientific Research Fund of Natural Science Foundation of Guangdong University of Petrochemical Technology (2019rc019). And the APC was funded by Yu, C.

Conflicts of Interest

The authors declare no conflict of interest.

References

  1. Wang, J.P.; Yang, Y.; Li, D.L. Research progress of DEHP pollution in water environment and its removal. Chem. Prog. 2014, 33, 498–504. (In Chinese) [Google Scholar]
  2. Pang, X.Z.; Skillen, N.; Gunaratne, N.; Rooney, D.W.; Robertson, P.K.J. Removal of phthalates from aqueous solution by semiconductor photocatalysis: A review. J. Hazard. Mater. 2021, 402, 123461–123481. [Google Scholar] [CrossRef]
  3. Ki, S.J.; Park, Y.-K.; Kim, J.-S.; Lee, W.-J.; Lee, H.; Jung, S.-C. Facile preparation of tungsten oxide doped TiO2 photocatalysts using liquid phase plasma process for enhanced degradation of diethyl phthalate. Chem. Eng. J. 2019, 377, 120087–120093. [Google Scholar] [CrossRef]
  4. Hung, C.-H.; Yuan, C.; Li, H.-W. Photodegradation of diethyl phthalate with PANi/CNT/TiO2 immobilized on glass plate irradiated with visible light and simulated sunlight—Effect of synthesized method and pH. J. Hazard. Mater. 2017, 322, 243–253. [Google Scholar] [CrossRef]
  5. He, G.Y.; Zhang, J.H.; Hu, Y.; Bai, Z.G.; Wei, C.H. Dual-template synthesis of mesoporous TiO2 nanotubes with structure-enhanced functional photocatalytic performance. Appl. Catal. B Environ. 2019, 250, 301–312. [Google Scholar] [CrossRef]
  6. Akbari-Adergani, B.; Saghi, M.H.; Eslami, A.; Mohseni-Bandpei, A.; Rabbani, M. Removal of dibutyl phthalate from aqueous environments using a nanophotocatalytic Fe, Ag-ZnO/VIS-LED system: Modeling and optimization. Environ. Technol. 2018, 39, 1566–1576. [Google Scholar] [CrossRef] [PubMed]
  7. Chuai, H.Y.; Zhou, D.F.; Zhu, X.F.; Li, Z.H.; Huang, W.P. Characterization of V2O5/MoO3 composite photocatalysts prepared via electrospinning and their photodegradation activity for dimethyl phthalate. Chin. J. Catal. 2015, 36, 2194–2202. [Google Scholar] [CrossRef]
  8. Liao, W.C.; Zheng, T.; Wang, P.; Tu, S.S.; Pan, W.Q. Efficient microwave-assisted photocatalytic degradation of endocrine disruptor dimethyl phthalate over composite catalyst ZrOx/ZnO. J. Environ. Sci. 2010, 22, 1800–1806. [Google Scholar] [CrossRef]
  9. Liu, Y.; Sun, N.; Hu, J.S.; Li, S.; Qin, G.W. Photocatalytic degradation properties of α-Fe2O3 nanoparticles for dibutyl phthalate in aqueous solution system. Roy. Soc. Open Sci. 2018, 5, 172196–172204. [Google Scholar] [CrossRef] [Green Version]
  10. Shan, W.J.; Hu, Y.; Bai, Z.G.; Zheng, M.M.; Wei, C.H. In situ preparation of g-C3N4/bismuth-based oxide nanocomposites with enhanced photocatalytic activity. Appl. Cataly. B Environ. 2016, 188, 1–12. [Google Scholar] [CrossRef]
  11. Zhang, X.; Ma, Y.H.; Xi, L.L.; Zhu, G.F.; Li, X.; Shi, D.Y.; Fan, J. Highly efficient photocatalytic removal of multiple refractory organic pollutants by BiVO4/CH3COO(BiO) heterostructured nanocomposite. Sci. Total. Environ. 2019, 647, 245–254. [Google Scholar] [CrossRef] [PubMed]
  12. Karmakar, A.; Samanta, P.; Dutta, S.; Ghosh, S.K. Fluorescent “Turn-on” Sensing Based on Metal-Organic Frameworks (MOFs). Chem. Asian J. 2019, 14, 4506–4519. [Google Scholar] [CrossRef] [PubMed]
  13. Chen, F.; Wang, Y.-M.; Guo, W.W.; Yin, X.-B. Color-tunable lanthanide metal–organic framework gels. Chem. Sci. 2019, 10, 1644–1650. [Google Scholar] [CrossRef] [Green Version]
  14. Chen, P.; Lei, B.; Dong, X.; Wang, H.; Sheng, J.P.; Cui, W.; Li, J.Y.; Sun, Y.J.; Wang, Z.M.; Dong, F. Rare-Earth Single-Atom La–N Charge-Transfer Bridge on Carbon Nitride for Highly Efficient and Selective Photocatalytic CO2 Reduction. ACS Nano 2020, 14, 15841–15852. [Google Scholar] [CrossRef]
  15. Du, J.M.; Zhao, G.Y.; Pang, H.; Qian, Y.T.; Liu, H.Q.; Kang, D.J. A template method for synthesis of porous Sn-doped TiO2 monolith and its enhanced photocatalytic activity. Mater. Lett. 2013, 93, 419–422. [Google Scholar] [CrossRef]
  16. Li, Y.R.; Kong, T.T.; Shen, S.H. Artificial Photosynthesis with Polymeric Carbon Nitride: When Meeting Metal Nanoparticles, Single Atoms, and Molecular Complexes. Small 2019, 15, 1900772–1900789. [Google Scholar] [CrossRef]
  17. Tang, T.; Yin, Z.L.; Chen, J.R.; Zhang, S.; Sheng, W.C.; Wei, W.X.; Xiao, Y.G.; Shi, Q.Y.; Cao, S.S. Novel p-n heterojunction Bi2O3/Ti3+-TiO2 photocatalyst enables the complete removal of tetracyclines under visible light. Chem. Eng. J. 2021, 417, 128058. [Google Scholar] [CrossRef]
  18. Zeng, Z.C.; Xu, Y.S.; Zhang, Z.S.; Gao, Z.S.; Luo, M.; Yin, Z.Y.; Zhang, C.; Xu, J.; Huang, B.L.; Luo, F.; et al. Rare-earth-containing perovskite nanomaterials: Design, synthesis, properties and applications. Chem. Soc. Rev. 2020, 49, 1109–1143. [Google Scholar] [CrossRef]
  19. Yan, X.-H.; Fang, M.-F.; Qian, Z.-Q.; Liu, Z.-L.; Wang, M.-L.; Tian, C.-P.; Du, M.-H.; Li, Y.-J.; Li, Z.-H.; Zhao, G.-F. Isolation and characterization of polymorphic microsatellites in the perennial herb Euphorbia kansui using paired-end Illumina shotgun sequencing. Conserv. Genet. Resour. 2014, 6, 841–843. [Google Scholar] [CrossRef]
  20. Yu, C.L.; Wu, Z.; Liu, R.Y.; He, H.B.; Fan, W.H.; Xue, S.S. The effects of Gd3+ doping on the physical structure and photocatalytic performance of Bi2MoO6 nanoplate crystals. J. Phys. Chem. Solids 2016, 93, 7–13. [Google Scholar] [CrossRef]
  21. Liu, Z.; Liu, X.Q.; Wei, L.F.; Yu, C.L.; Yi, J.H.; Ji, H.B. Regulate the crystal and optoelectronic properties of Bi2WO6 nanosheet crystals by Sm3+ doping for superior visible-light-driven photocatalytic performance. Appl. Surf. Sci. 2020, 508, 145309–145318. [Google Scholar] [CrossRef]
  22. Fan, Q.Z.; Chen, X.; Chen, F.Y.; Tian, J.; Yu, C.L.; Liao, C.F. Regulating the stability and bandgap structure of BiOBr during thermo-transformation via La doping. Appl. Surf. Sci. 2019, 481, 564–575. [Google Scholar] [CrossRef]
  23. Xue, S.S.; He, H.B.; Wu, Z.; Yu, C.L.; Fan, Q.Z.; Peng, G.M.; Yang, K. An interesting Eu,F-codoped BiVO4 microsphere with enhanced photocatalytic performance. J. Alloys Compd. 2017, 694, 989–997. [Google Scholar] [CrossRef]
  24. Yu, Z.Z.; Yang, K.; Yu, C.L.; Lu, K.Q.; Huang, W.Y.; Xu, L.; Zou, L.X.; Wang, S.B.; Chen, Z.; Hu, J.; et al. Steering Unit Cell Dipole and Internal Electric Field by Highly Dispersed Er atoms Embedded into NiO for Efficient CO2 Photoreduction. Adv. Funct. Mater. 2022, 32, 2111999–2112008. [Google Scholar] [CrossRef]
  25. Wang, Y.; Wen, Y.Y.; Ding, H.M.; Shan, Y.K. Improved structural stability of titanium-doped β-Bi2O3 during visible-light-activated photocatalytic processes. J. Mater. Sci. 2009, 45, 1385–1392. [Google Scholar] [CrossRef]
  26. Zeng, Y.F.; Qin, Y.Z.; Zhou, Z. Preparation of Y2O3-Bi2O3 Catalyst and Its Visible Light Catalytic Degradation of 2,4-Dichlorophenol. Chem. World 2011, 52, 257–261. (In Chinese) [Google Scholar]
  27. Muruganandham, M.; Amutha, R.; Lee, G.J.; Hsieh, S.H.; Wu, J.J.; Sillanpää, M. Facile Fabrication of Tunable Bi2O3 Self-Assembly and Its Visible Light Photocatalytic Activity. J. Phys. Chem. C 2012, 116, 12906–12915. [Google Scholar] [CrossRef]
  28. Liu, X.Q.; Fan, Q.Z.; Li, F.; Wei, L.F.; Yu, C.L. Nd3+-doped β-Bi2O3/Bi2O2CO3 composite nanoplates fabricated via phase transformation and their superior visible light photocatalytic performance for removing phenols and dyes. J. Nanopart. Res. 2021, 23, 233–248. [Google Scholar] [CrossRef]
  29. Xu, J.J.; Ao, Y.H.; Fu, D.G.; Yuan, C.W. A simple route for the preparation of Eu, N-codoped TiO2 nanoparticles with enhanced visible light-induced photocatalytic activity. J. Colloid Interface Sci. 2008, 328, 447–451. [Google Scholar] [CrossRef]
  30. Wu, X.H.; Qin, W.; Ding, X.B.; Wen, Y.Y.; Liu, H.L.; Jiang, Z.H. Photocatalytic activity of Eu-doped TiO2 ceramic films prepared by microplasma oxidation method. J. Phys. Chem. Solids 2007, 68, 2387–2393. [Google Scholar]
  31. Miao, Y.C.; Pan, G.F.; Huo, Y.N.; Li, H.X. In situ rare earth modified Bi2MoO6 efficient visible light catalyst. Acta Inorg. Chem. 2014, 30, 1587–1592. (In Chinese) [Google Scholar]
Figure 1. (a) XRD patterns of Bi2O2CO3 and light rare earth-doped Bi2O2CO3/β-Bi2O3. (b) XRD patterns of Bi2O2CO3 and heavy rare earth-doped Bi2O2CO3/β-Bi2O3.
Catalysts 12 01295 g001
Figure 2. TG−DTG curves of (a) Bi2O2CO3 and (b) Nd- Bi2O2CO3/β-Bi2O3.
Catalysts 12 01295 g002
Figure 3. SEM photographs of (a) Bi2O2CO3, (b) Ce- Bi2O2CO3/β-Bi2O3, (c) Nd- Bi2O2CO3/β-Bi2O3 and (d) Pr-Bi2O2CO3/β-Bi2O3.
Catalysts 12 01295 g003
Figure 4. SEM photographs of (a) Gd- Bi2O2CO3/β-Bi2O3, (b) Dy Bi2O2CO3/β-Bi2O3, (c) Er- Bi2O2CO3/β-Bi2O3 and (d) Lu-Bi2O2CO3/β-Bi2O3.
Catalysts 12 01295 g004
Figure 5. TEM of light rare earth Nd (a,b) and heavy rare earth Gd (c,d) doped Bi2O2CO3/β-Bi2O3.
Catalysts 12 01295 g005
Figure 6. EDX spectra of light rare earth Nd (a) and heavy rare earth Gd (b) doped Bi2O2CO3/β-Bi2O3.
Catalysts 12 01295 g006
Figure 7. UV-Vis spectra of Bi2O2CO3 and Bi2O2CO3/β-Bi2O3 doped with (a) light rare earth ion and (b) heavy rare earth ion.
Catalysts 12 01295 g007
Figure 8. Tauc plots of of Bi2O2CO3 and Bi2O2CO3/β-Bi2O3 doped with (a) light rare earth ion and (b) heavy rare earth ion.
Catalysts 12 01295 g008
Figure 9. FT−IR spectra of (a) light rare earth-doped and (b) heavy rare earth-doped samples.
Catalysts 12 01295 g009
Figure 10. Comparative spectra of Bi2O2CO3 and (a) light rare earth-doped and (b) heavy rare earth-doped Bi2O2CO3/β-Bi2O3 in photocatalytic degradation of DMP.
Catalysts 12 01295 g010
Figure 11. (a) Effects of quenchers addition (2 mM) on the photocatalytic activity in degradation of DMP over Nd-Bi2O2CO3/β-Bi2O3 under light irradiation; (b) Cyclic runs of in-degradation of DMP over Nd-Bi2O2CO3/β-Bi2O3 under light irradiation.
Catalysts 12 01295 g011
Figure 12. (a) EIS plots and (b) photocurrent responses of Bi2O2CO3, Bi2O2CO3/β-Bi2O3(300 °C), Tm-Bi2O2CO3/β-Bi2O3 (300 °C), Sm-Bi2O2CO3/β-Bi2O3 (300 °C).
Catalysts 12 01295 g012
Figure 13. MS plots of (a) β-Bi2O3 and (b) Bi2O2CO3.
Catalysts 12 01295 g013
Figure 14. Mechanism of photocatalytic degradation of DMP by rare earth-doped Bi2O2CO3/β-Bi2O3.
Catalysts 12 01295 g014
Figure 15. Schematic diagram of the experimental setup of the activity test under tungsten lamp irradiation.
Catalysts 12 01295 g015
Table 1. Band gap energy and specific surface area of Bi2O2CO3 and rare earth-doped Bi2O2CO3/β-Bi2O3.
SampleEg
(eV)
SBET
(m2/g)
SampleEg
(eV)
SBET
(m2/g)
Bi2O2CO33.185.4Gd-Bi2O2CO3/β-Bi2O32.4916.1
La-Bi2O2CO3/β-Bi2O32.5311.2Tb-Bi2O2CO3/β-Bi2O32.5215.2
Ce-Bi2O2CO3/β-Bi2O32.4210.9Dy-Bi2O2CO3/β-Bi2O32.5016.8
Pr-Bi2O2CO3/β-Bi2O32.4811.1Ho-Bi2O2CO3/β-Bi2O32.5617.3
Nd-Bi2O2CO3/β-Bi2O32.5714.2Er-Bi2O2CO3/β-Bi2O32.5414.6
Sm-Bi2O2CO3/β-Bi2O32.4213.6Tm-Bi2O2CO3/β-Bi2O32.4815.3
Eu-Bi2O2CO3/β-Bi2O32.5714.5Yb-Bi2O2CO3/β-Bi2O32.4714.9
Lu-Bi2O2CO3/β-Bi2O32.4413.9
Table 2. Degradation (D%) and TOC removal (R%) of DMP by Bi2O2CO3 and different rare earth-doped Bi2O2CO3/β-Bi2O3.
SampleD
(%)
R
(%)
SampleD
(%)
R
(%)
Bi2O2CO31714Gd-Bi2O2CO3/β-Bi2O36962
La-Bi2O2CO3/β-Bi2O33530Tb-Bi2O2CO3/β-Bi2O34034
Ce-Bi2O2CO3/β-Bi2O33834Dy-Bi2O2CO3/β-Bi2O35247
Pr-Bi2O2CO3/β-Bi2O36659Ho-Bi2O2CO3/β-Bi2O33532
Nd-Bi2O2CO3/β-Bi2O37267Er-Bi2O2CO3/β-Bi2O37869
Sm-Bi2O2CO3/β-Bi2O35348Tm-Bi2O2CO3/β-Bi2O34641
Eu-Bi2O2CO3/β-Bi2O34031Yb-Bi2O2CO3/β-Bi2O35749
Lu-Bi2O2CO3/β-Bi2O33026
Publisher’s Note: MDPI stays neutral with regard to jurisdictional claims in published maps and institutional affiliations.

