Article

The Activity of Ultrafine Cu Clusters Encapsulated in Nano-Zeolite for Selective Hydrogenation of CO2 to Methanol

1
The ZeoMat Group, Qingdao Institute of Bioenergy and Bioprocess Technology, CAS, Laoshan District, Qingdao 266101, China
2
Laboratoire Catalyse et Spectrochimie, ENSICAEN, UNICAEN, CNRS, Normandie University, 14050 Caen, France
*
Authors to whom correspondence should be addressed.
Catalysts 2022, 12(11), 1296; https://doi.org/10.3390/catal12111296
Submission received: 20 September 2022 / Revised: 18 October 2022 / Accepted: 18 October 2022 / Published: 23 October 2022
(This article belongs to the Special Issue Catalysis on Zeolites and Zeolite-Like Materials II)

Abstract

:
Narrowly dispersed ultrafine Cu clusters of sizes smaller than 2.0 nm have been encapsulated in nanosized silicalite-1 zeolite through direct crystallization in the presence of Cu(en)22+ complex ions as the metal precursor. The growing silicalite-1 crystals are rich in vacancy defects and connectivity defects on the grain boundaries, where the terminating silanols promote the decomposition of Cu(en)22+, thus the deposition of ultrafine Cu species. The obtained composite material as a model catalyst is active for CO2 activation and hydrogenation to methanol. The preliminary in situ FTIR study recognizes a series of surface-adsorbed carbonyl, formyl, carbonate, and formate species when the material is exposed to CO2 and H2. Among others, the adsorbed formate decays most rapidly upon cofeeding CO2 and H2, implying that the most probable pathway toward methanol formation over this material is via the formate-mediated mechanism.

Graphical Abstract

1. Introduction

Regarding the current energy transition from fossil fuels to renewables, resource-utilization of captured CO2 is indispensable in its remediation. Catalytic hydrogenation of CO2 to methanol combines CO2 and H2 into a liquid form. When H2 is made through water electrolysis using the erratic renewable energy, e.g., solar or wind, the process stores this energy in CO2. The produced methanol is called “liquid sunshine” [1,2]. The technology using Cu-based catalysts for the CO2-to-methanol process has been intensively studied [3,4,5,6,7] and demonstrated in large scales for a fairly long period [8], and it is closing in on the maturity of widespread exploitations.
Taking the George Olah CO2-to-methanol plant of CRI in Iceland as an example, running at the scale >4000 MT/year since 2012, it provides sound data to demonstrate that over 90% CO2 emission is saved per unit energy product. However, economically, the technology cannot yet compete with the traditional syngas-to-methanol process because the space-time yield is insufficient due to thermodynamic limitations. Furthermore, the 1 mol equivalent water produced in the CO2 hydrogenation reaction poses as a “poison” that sinters Cu and related active species, raising the operation costs [8]. Therefore, new catalysts of higher activities that are able to establish the reaction equilibrium at a higher space velocity, as well as better stabilities that can resist water poisoning, are highly demanded.
Reducing the size of metal particles is a way to enhance their catalytic activities by exposing larger fractions of atomic structures to the surfaces [9,10]. For a fundamental study of Cu-based catalysts for CO2 hydrogenation, we propose to isolate the question on Cu particle size from other parameters, such as the interface of Cu/ZnO, the alloying of Cu/Zn, and the metal–support interactions [11,12], and to study at first the adsorption and activation of CO2 on ultrafine Cu clusters. For this purpose, we have prepared a model catalyst with Cu clusters of sizes smaller than 2 nm entrapped in a nanosized pure-silica MFI-type zeolite (silicalite-1), which is denoted Cu@NS, by a direct crystallization method using a soluble Cu2+ precursor. Employing the microporous structure of zeolites as a scaffold to confine the metal allows ultrafine clusters and nanoparticles to be protected from sintering [13,14], which poses a common reason for deactivation of metal catalysts [15]. Furthermore, the microporous environments may provide further functions such as molecular-level microreactors, shape-selectivity, etc., in addition to the fixation effects [16,17,18].
Specifically for CO2 hydrogenation, enhanced activity of Cu clusters with reduced sizes has been proven experimentally and through model simulations. For example, the researchers at Argonne Laboratory prepared Cu3, Cu4, and Cu20 clusters deposited on an amorphous Al2O3 support using a particular cluster-mass selection method and demonstrated that Cu4/Al2O3 has significantly higher activity in the CO2-to-methanol reaction than the other two clusters [19]. Zhang et al. modeled Cu clusters from Cu13 through Cu79 to bigger nanoparticles and computed the binding strengths of reactants and reaction intermediates, as well as the activation barriers for the elementary reaction steps of CO2 hydrogenation. They concluded that the Cu19 cluster exhibits the highest CO2 hydrogenation activity, which can be ascribed to moderate CO2 coverage and a low CO2 dissociation barrier [20]. The obvious discrepancy between the experiments and the theoretical calculations implies that the cluster size effect must be separated from other experimental variables such as cluster morphologies, surface structures, electronic charges, and metal–support charge transfers. Further explorations from both sides are required to approach an agreement on the most efficient size of Cu particles.
As for Cu-containing zeolite materials, Cu2+ ion-exchanged SSZ-13 (CHA-type) catalysts have been commercialized for selective catalytic reduction of NOx pollutants (SCR-DeNOx) from diesel engine exhausts [21]. Cu2+-exchanged SSZ-13, ZSM-5, and mordenite zeolites are also studied for the catalytic activity for methane oxidation-to-methanol in aqueous solutions [22,23]. Unlike the fact that Cu2+ ions that can be readily introduced into zeolite via ion exchange, the encapsulation of Cu nanoparticles and clusters in the intracrystalline micropores is challenging. The traditional impregnation method usually yields metal particles in a larger nanometer range (>2 nm) both inside the crystals on defective voids and outside on the external surfaces [16,17,24]. Ding et al. developed a procedure to grow Na-Beta zeolite using CuO-impregnated nanosized Beta as seeds and obtained entrapped Cu particles of 2–5 nm in Cu@Beta. They demonstrated that those Cu nanoparticles in the confined environment in the micropores have a higher ethanol selectivity because the desorption of C1 intermediates is retarded [25]. Cui et al. used a bimetallic MOF material, CuZn-HKUST-1 nanoparticles, as sacrificial Cu and Zn source in the synthesis of ZSM-5 zeolite and obtained Cu/ZnO nanoparticles of ca. 2 nm entrapped in the zeolite, Cu/ZnO@ZSM-5, which has significantly higher activity than the impregnated reference materials [26].
A rather generally applicable strategy for the encapsulation of smaller metal clusters in zeolite micropores was introduced by Iglesia and coworkers [27,28]. Zeolites of various framework topologies were directly crystallized in the hydrogels with an additional metal precursor, which is in the form of an amino- or organoamino-metal ion or cationic metal complex with other types of ligands. Other researchers have widely adopted the method, and ultrafine noble metal clusters of sizes smaller than 2 nm confined in zeolites of SOD, LTA, *BEA, MFI, and other framework types have been synthesized [13,29].
The critical point in this procedure is that the speed of the metal-precursor hydrolysis has to be synchronized with the speed of the zeolite crystallization so that the precipitated metal-hydroxy-oxide clusters are entrapped in the zeolite micropores, rather than them growing into separated and bigger particles. Still, applying this method to create a zeolite-encapsulated Cu cluster is challenging since, at higher pH in aqueous systems where zeolites usually crystallize, oxo-cupric species tend to precipitate much too rapidly. A proper Cu precursor, which exhibits a synchronized decomposition/precipitation speed with the zeolite crystallization, is hard to find.
In the present paper, we chose the pure-silica polymorph silicalite-1 of the MFI-type zeolite instead of its aluminosilicate counterpart ZSM-5 to make a composite material Cu@zeolite. This has the advantage of circling out the contribution of acid sites in the catalytic processes and making the investigation focus on the entrapped Cu clusters. Furthermore, we used the recipe to make the host silicalite-1 material in the format of nanosized spheres, which further eliminates the possible diffusion limitation arising from the zeolite host. As the metal precursor, we chose Cu(en)2(NO3)2. Experiments show that the lifetime of the Cu(en)22+ ions in the zeolite synthesis gel is synchronized with the growing speed of the nano-zeolite, leading to the deposition of Cu species in the crystallized zeolite.
Taking Cu@NS (NS stands for nanosized silicalite-1) as a model catalyst, we attempted to identify the surface-adsorbed carbonyl, formyl, carbonate, and formate species using in situ FTIR, when the material is exposed to CO2 and to the reactive gas mixture with CO2 and three times H2. The proceeding of CO2 activation can follow different pathways, due to its various postures of adsorption on the metal surfaces, and the consecutive polarization and bonding to H atoms. One can distinguish between two major types of reaction pathways leading to the methanol product by recognizing different reaction intermediates, i.e., the formate pathway, when the carbon atom of CO2 bonds to H at first; and the reversed water-gas shift pathway, when one O atom bonds to H at first [11,30,31]. We monitored the accumulations and evolutions of the adsorbed intermediates in flowing CO2 and in the reactive gas mixture at room temperature and at 150 °C. Above the cumulated H2O signals and baseline distortions, we attempted to track down the progress of the reactions along the formate pathway and reversed water-gas shift pathway and figure out which pathway is preferential over Cu@NS. The durability/lifetime of the model catalyst has temporarily not been specifically studied yet in the present paper.

2. Results

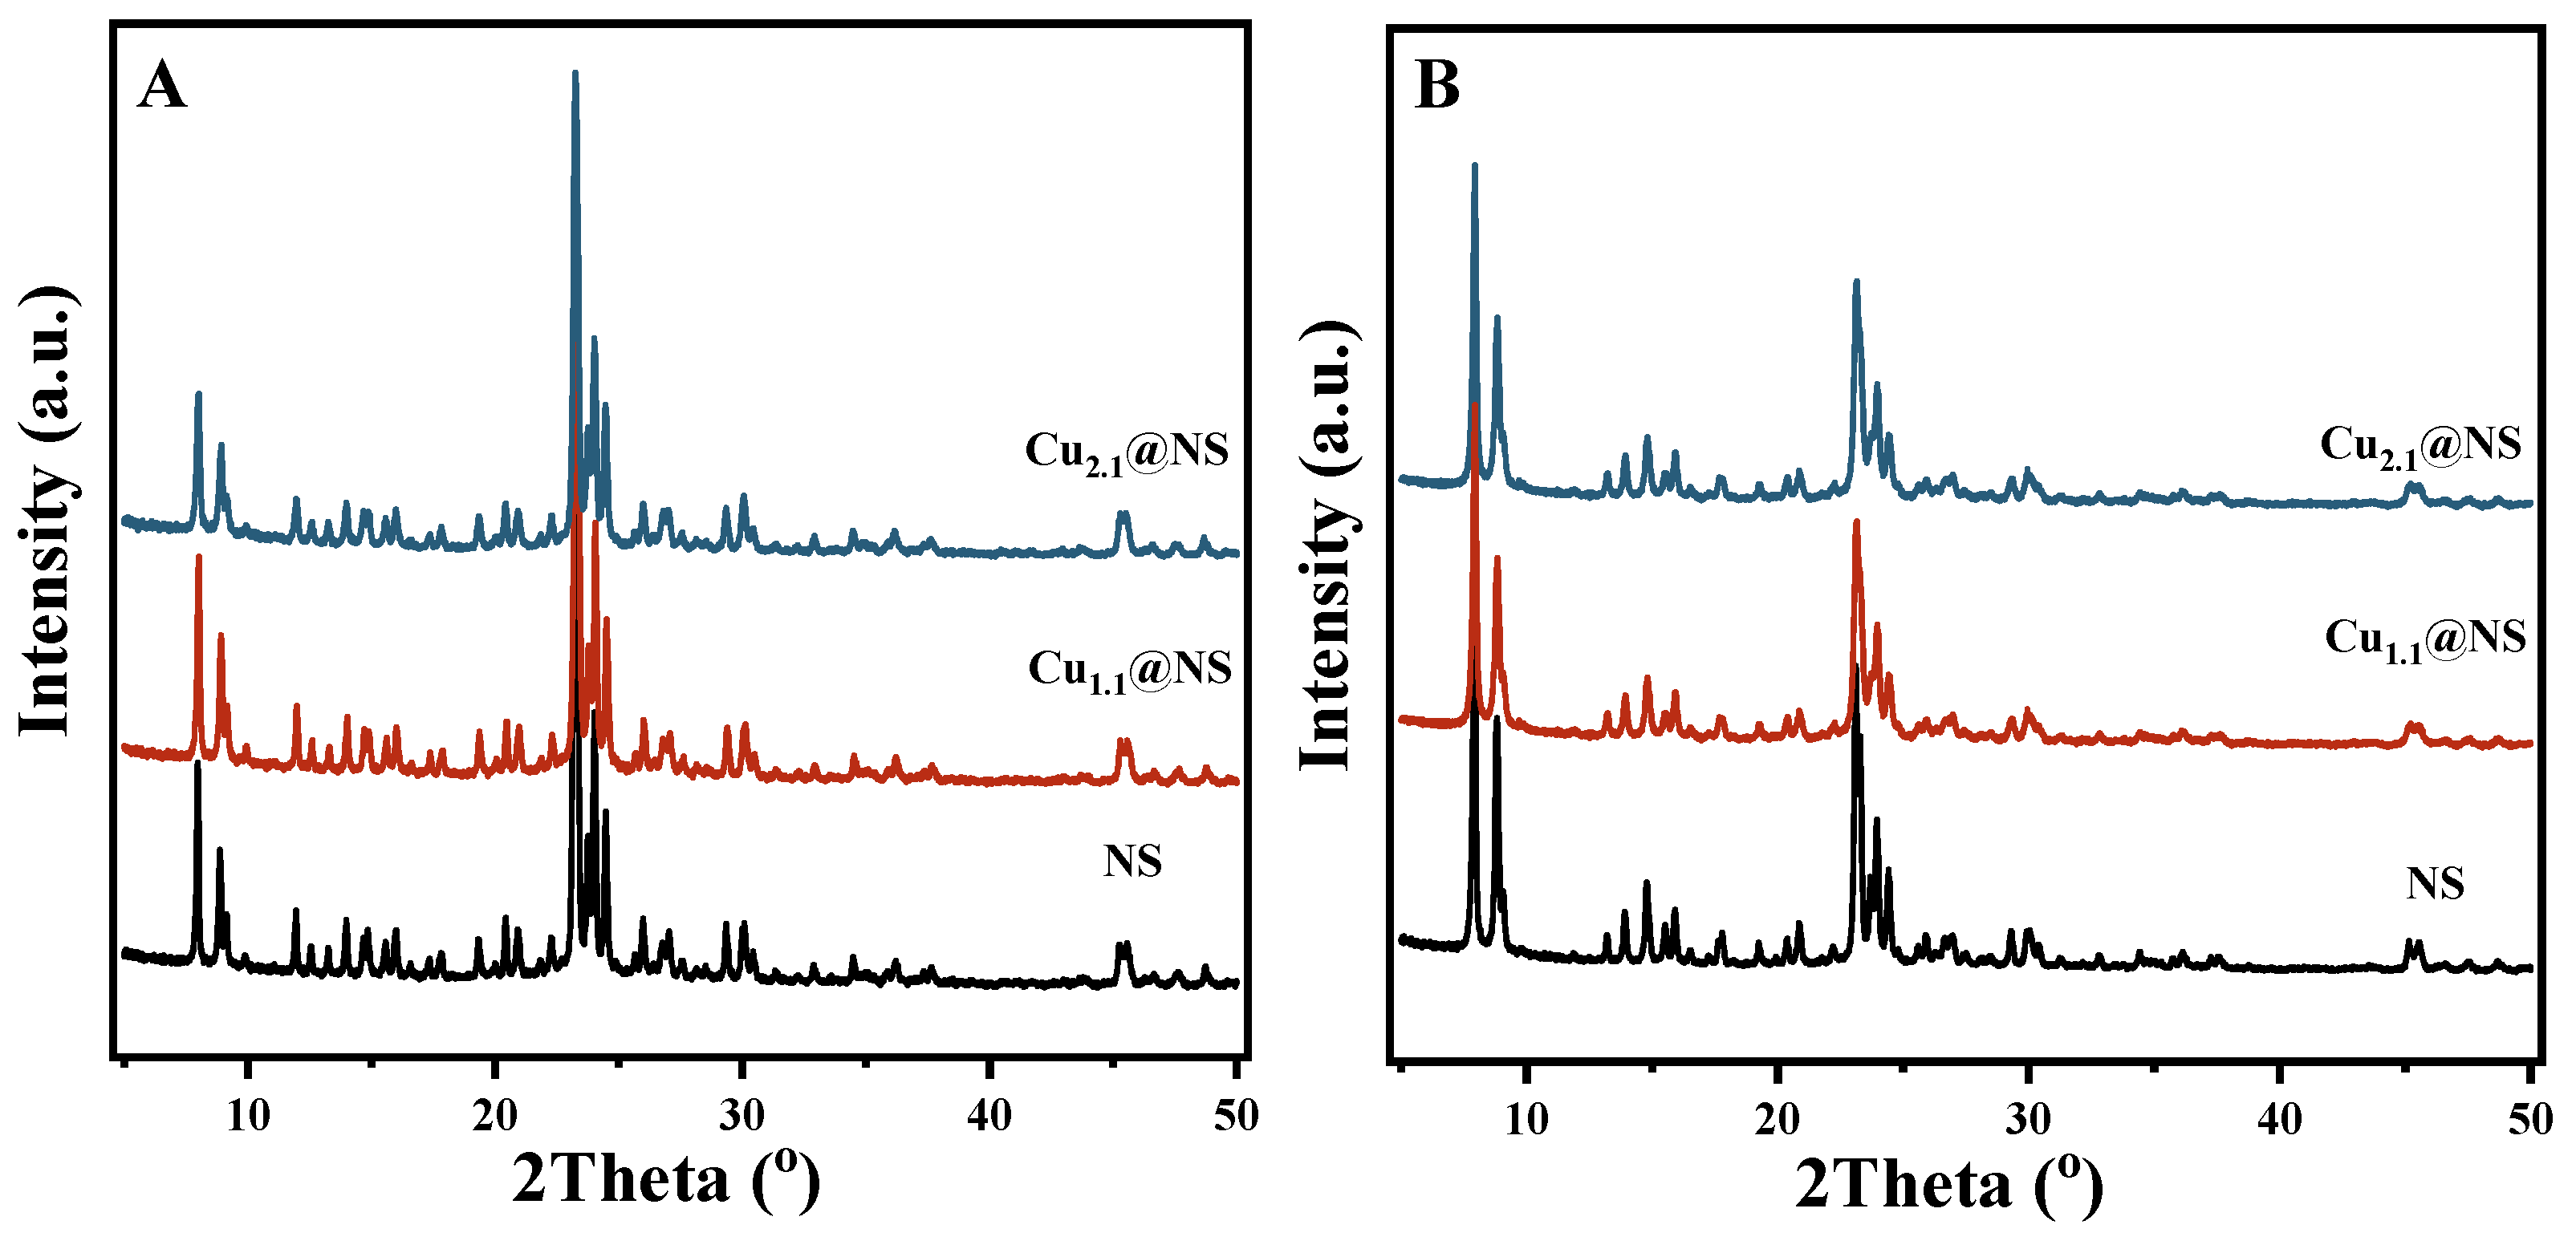
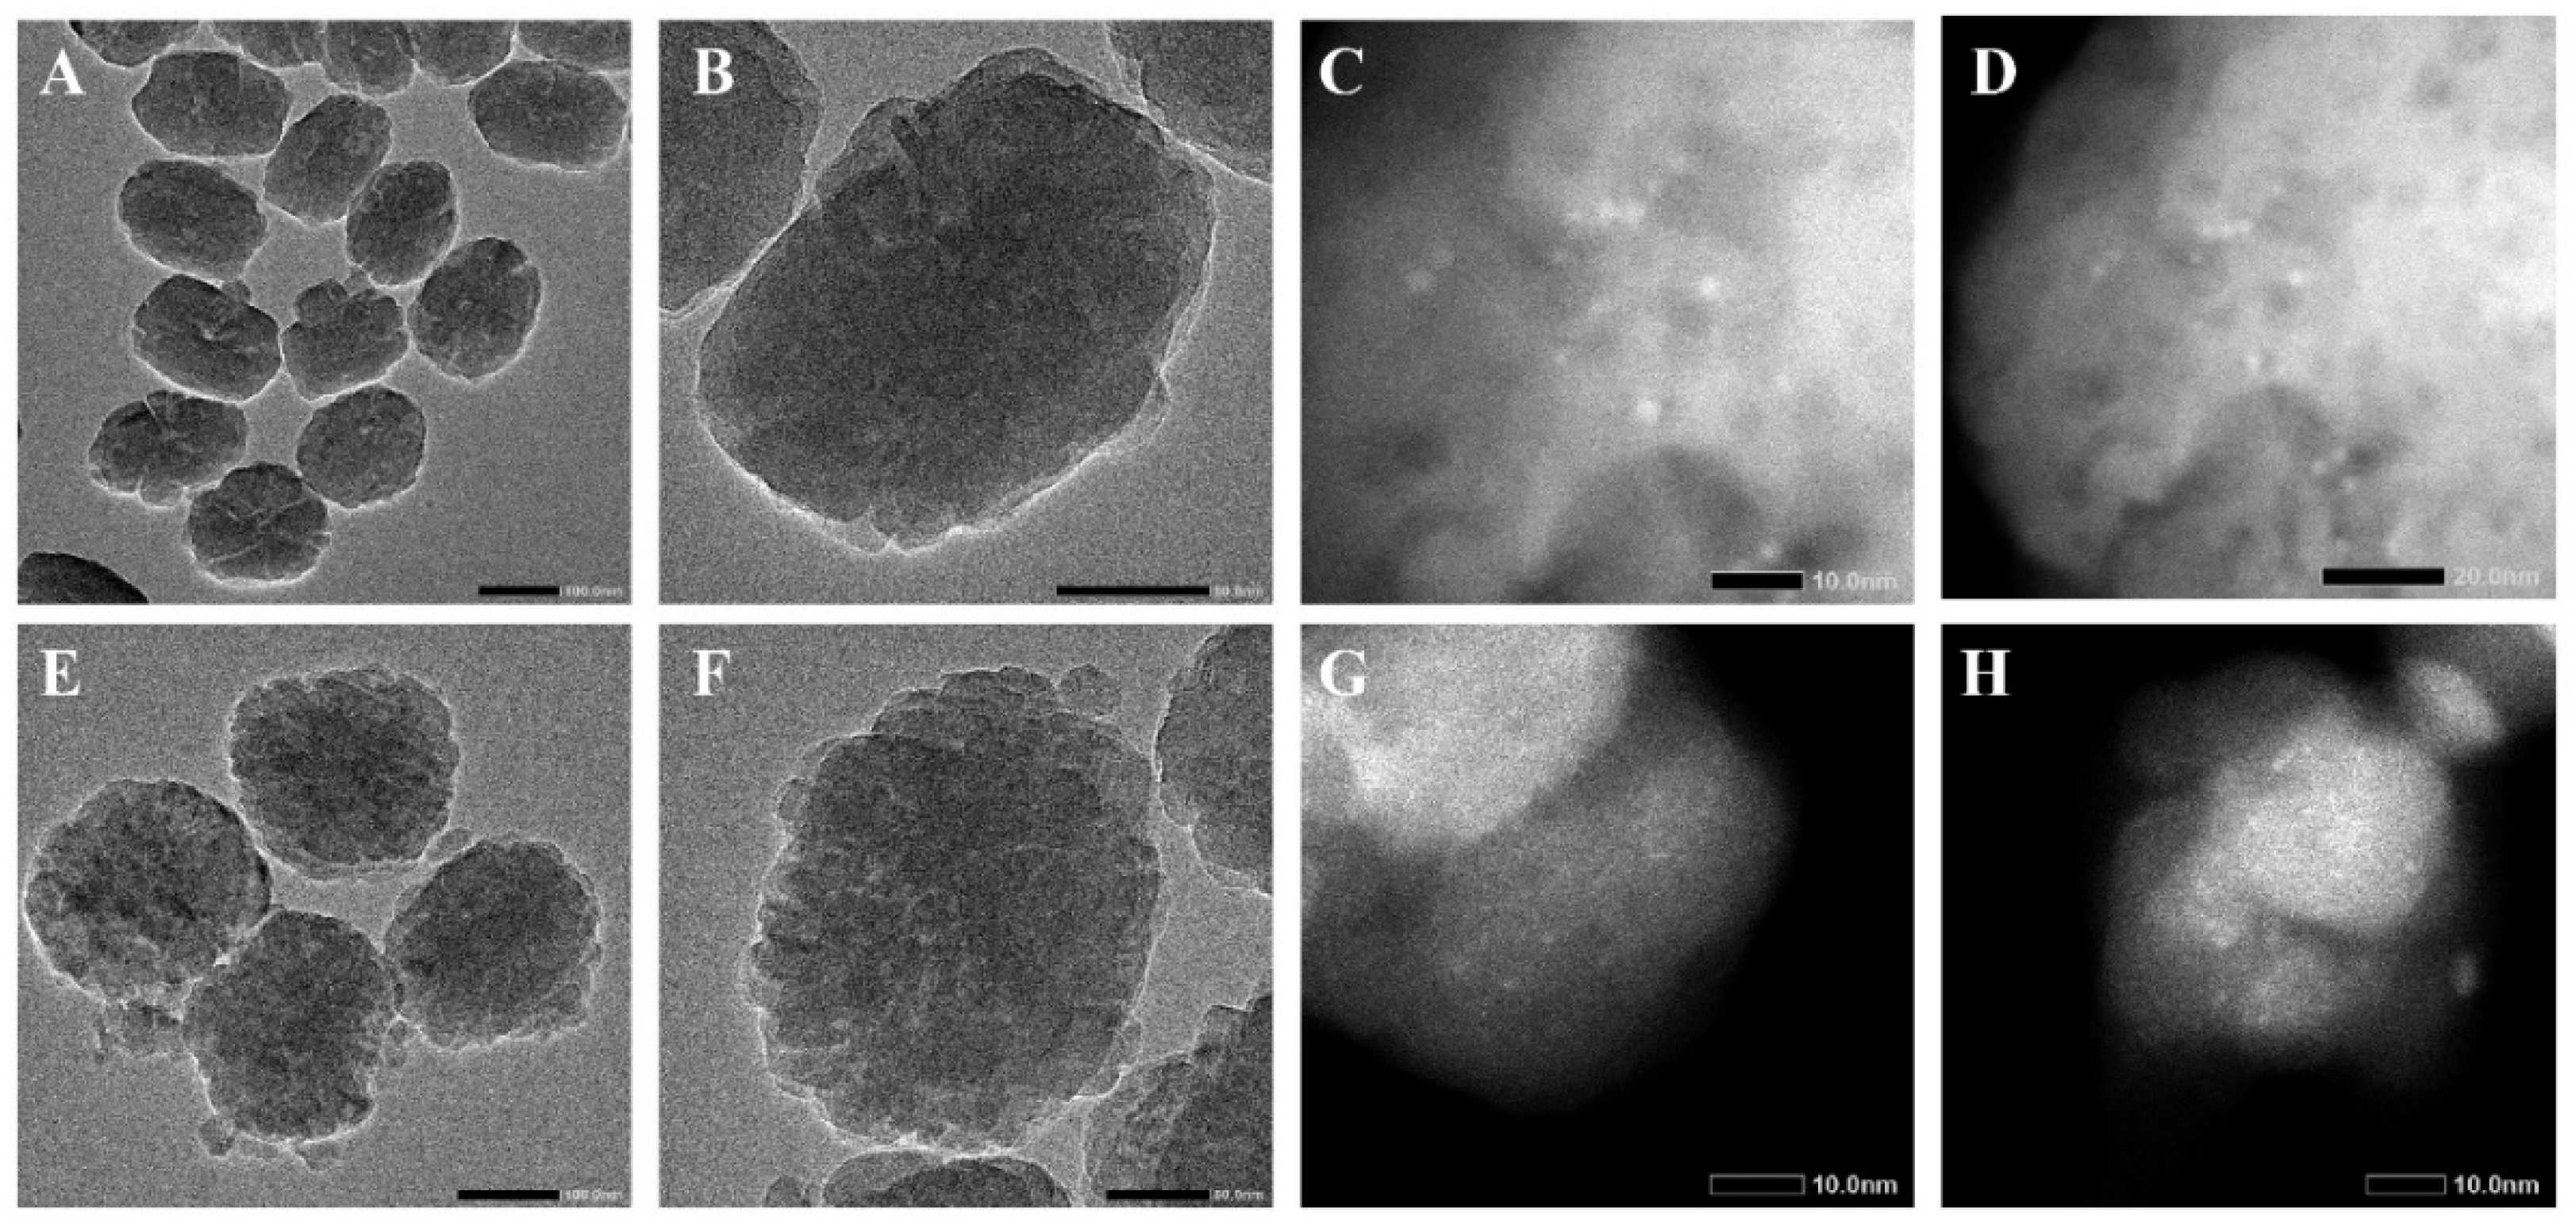
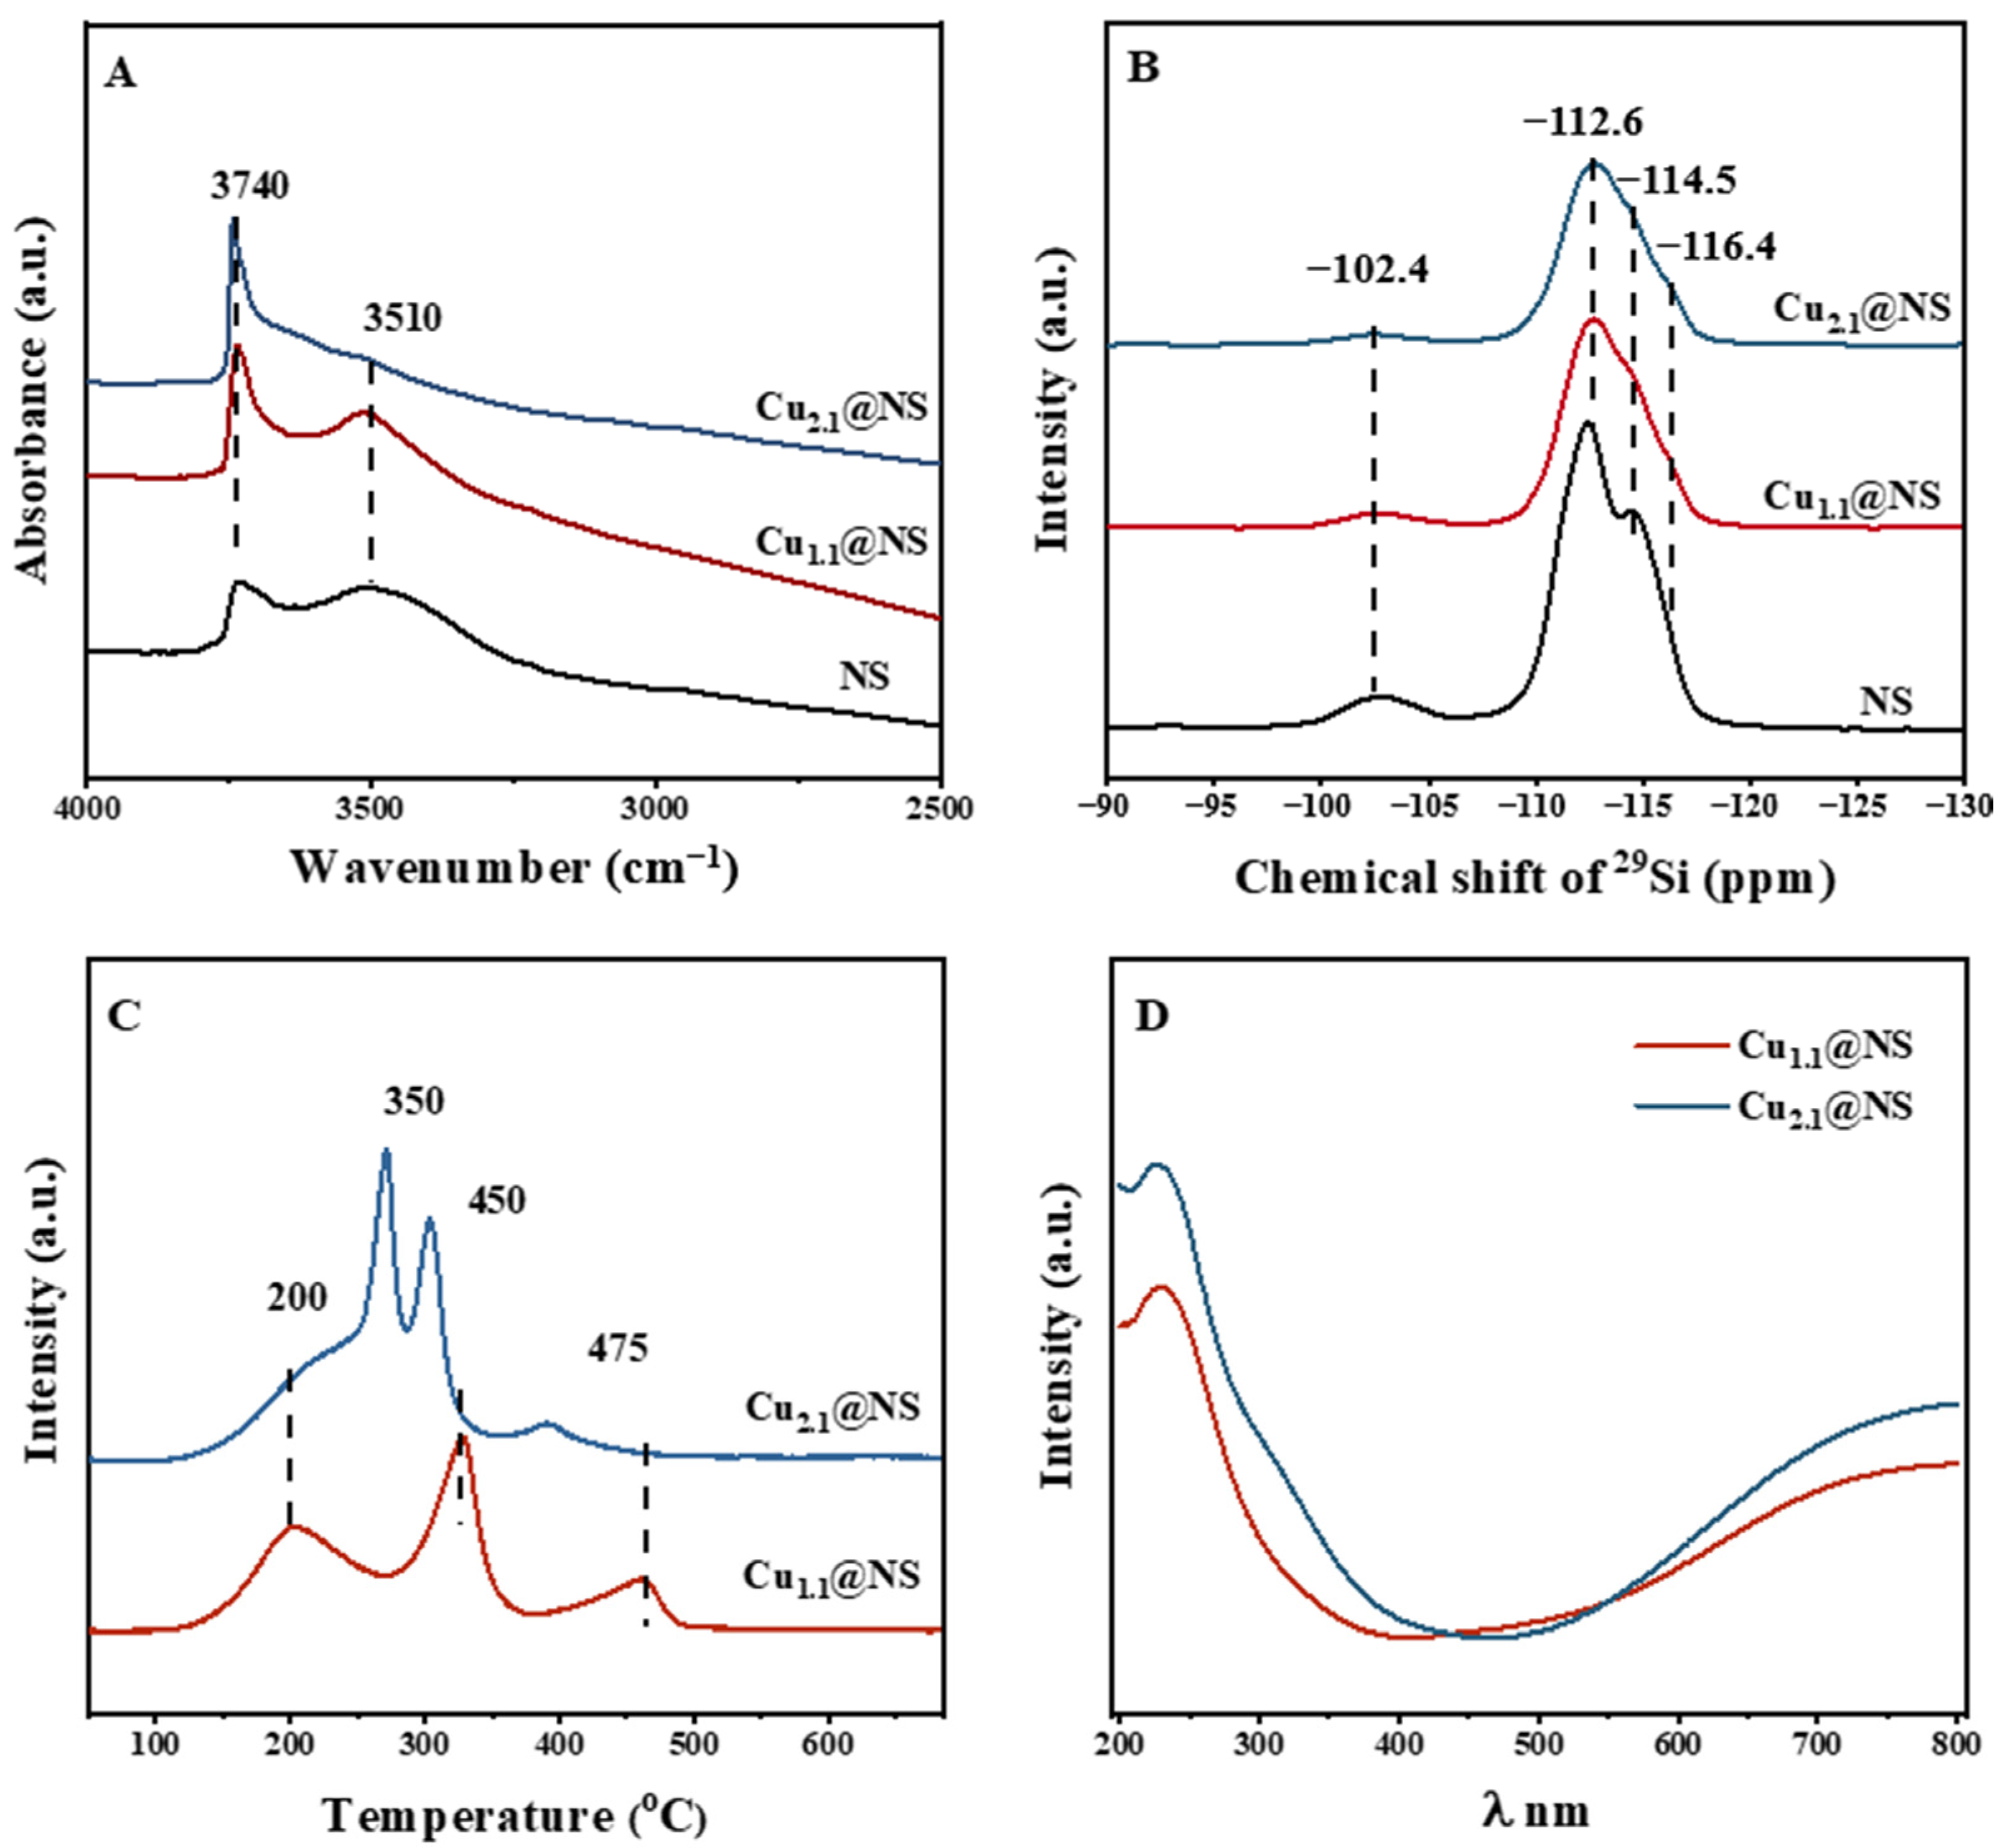
2.1. The Presence of Cu in the Synthesized Cu@NS Crystals

The method of the synthesis of nanosized silicalite-1 was established by Mintova et al. and verified by several research groups. It reliably produces spherical silicalite-1 particles with a narrow size distribution between 90 and 100 nm in diameter [32]. Adding Cu(en)2(NO3)2 in the initial gels (Table 1) and adjusting the crystallization time accordingly, ultrafine Cu clusters of <2 nm are dispersed in the zeolite nanospheres at metal loadings up to 2 wt.%.
The XRD patterns of the as-synthesized nanospheres of silicalite-1 (NS) and Cu@NS in Figure 1A all belong to phase-pure MFI zeolite. There is no trace of any other reflection peaks that can be attributed to Cu compounds. For example, CuO has diffraction peaks at 2θ = 35.6, 38.8, and 48.9°, which are absent in the patterns of Figure 1A. After the calcination at 550 °C in air, the materials remain phase-pure silicalite-1. The XRD patterns in Figure 1B show the usual changes in the relative intensities of the reflections. The material, both before and after the calcination, shows monoclinic symmetry. No new reflections appear. ICP detects that the Cu@NS materials contain around 1.10 and 2.10 wt.% Cu. Copper dispersed across the nanosized silicalite-1 host is present as noncrystalline species since no peaks of a copper phase were observed in the XRD patterns.
Figure 2 shows the SEM images of Cu1.1@NS and Cu2.1@NS. Similar to the pristine silicalite-1 nanospheres of diameters in 90–100 nm [32], the particles of both Cu@NS possess nearly spherical shapes with rough surfaces. The particles seem to be agglomerates of smaller primary crystals. The particles of Cu1.1@NS are slightly ellipsoidal with dimensions of ca. 180 × 60 × 160 nm. Cu2.1@NS are rather spherical with diameters of 240 ± 10 nm. In both cases, the agglomerate particles show nearly uniform sizes and shapes. With increasing amounts of Cu(en)2(NO3)2 precursor added to the initial gels, the time of crystallization has prolonged; consequently, the particles sizes are enlarged.
TEM images of calcined Cu1.1@NS and Cu2.1@NS (Figure 3) confirm that the zeolite nanospheres are indeed agglomerates of smaller crystallites. The sizes of the primary crystallites are in the range of 20–30 nm, with mostly round shapes. It can be envisaged that the grain boundaries are rich in not-fully connected SiO···HOSi linkages and point defects, where the silanols react with Cu(en)22+ and allow the voids to accommodate ultrafine Cu deposits. STEM-HAADF images (Figure 3) of both samples reveal Cu-containing particles distributed across the silicalite-1 nanospheres. The sizes of these particles in the two samples are not identical: in Cu1.1@NS, the mean size is ca. 2 nm; in Cu2.1@NS, it is around 1 nm.
FTIR and 29Si MAS NMR spectra further confirm that the defective framework and associated siloxyl/silanol structures provide the forces for Cu deposition. Figure 4A shows the FTIR spectra in the -OH vibration region of calcined NS and Cu@NS that are outgassed at 350 °C for 1 h. For NS, two bands are resolved at 3740 and 3510 cm−1. The band at 3740 cm−1 belongs to isolated silanol species that locate on the external surfaces of the particles. The broad band at 3510 cm−1 corresponds to H-bonded -OH groups that locate internally in the zeolite at various defect sites, e.g., triad and tetrad silanol nests at point defects, SiO···HOSi clusters, etc. [33,34,35]. In the Cu@NS materials, the intensities of the band at 3510 cm−1 decline with increasing Cu loading. The internal -OH groups are consumed upon Cu loading. It means that these various kinds of internal -OH groups react with Cu(en)22+, causing the decomposition and deposition of Cua(OH)x(H2O)yOz particles. The complexity of the -OH groups has been translated into the different sizes of the deposits.
In 29Si MAS NMR (Figure 4B) of NS the Q4 (Si-(OSi)4), signals are resolvable in two groups at −112.6 and −114.5 ppm. The Q3 (-Si-(OSi)3) peak at −102.4 ppm, which corresponds to the vacancy defects, covers 10.0% of total Si sites. In the spectra of Cu@NS, the Q3 portion decreased with increasing Cu loading: 6.2% for Cu1.1@NS and 5.2% for Cu2.1@NS. The Q4 resolution deteriorates with increasing Cu loading, as well. In both spectra, the −112.6 and −114.5 ppm bands are less resolved, and an additional shoulder at −116.4 ppm becomes detectable. It implies that the vacancy defects are healed to some extent when Cu species squeeze into the voids, and at least a portion of Q3 (-Si-(OSi)3) becomes a new type of Q4 (-Cu-O-Si-(OSi)3) that causes torsions in the framework, thus ruining the Q4 resolution.
The deposited oxo-Cu species are of a complicated nature rather than a defined molecular or atomic form. Figure 4C shows the temperature-programed reduction process of Cu@NS in diluted 10% H2/Ar flow. H2 consumption peaks are observed between 100 to 500 °C, and they are quite different for Cu@NS of different Cu loadings. The deposition of Cua(OH)x(H2O)yOz species to the defective zeolite voids has been a random process, resulting in compounds with very different stoichiometry of diverse sizes. The DR UV-Vis spectra (Figure 4D) of the Cu particles indicate a broad distribution of sizes, from a few atoms (the shoulders of 300–350 nm) to nanoparticles (the broad band from 500 nm upwards in wavelength). The uncontrolled deposition explains why the Cu particle sizes in the two Cu@NS are not identical.

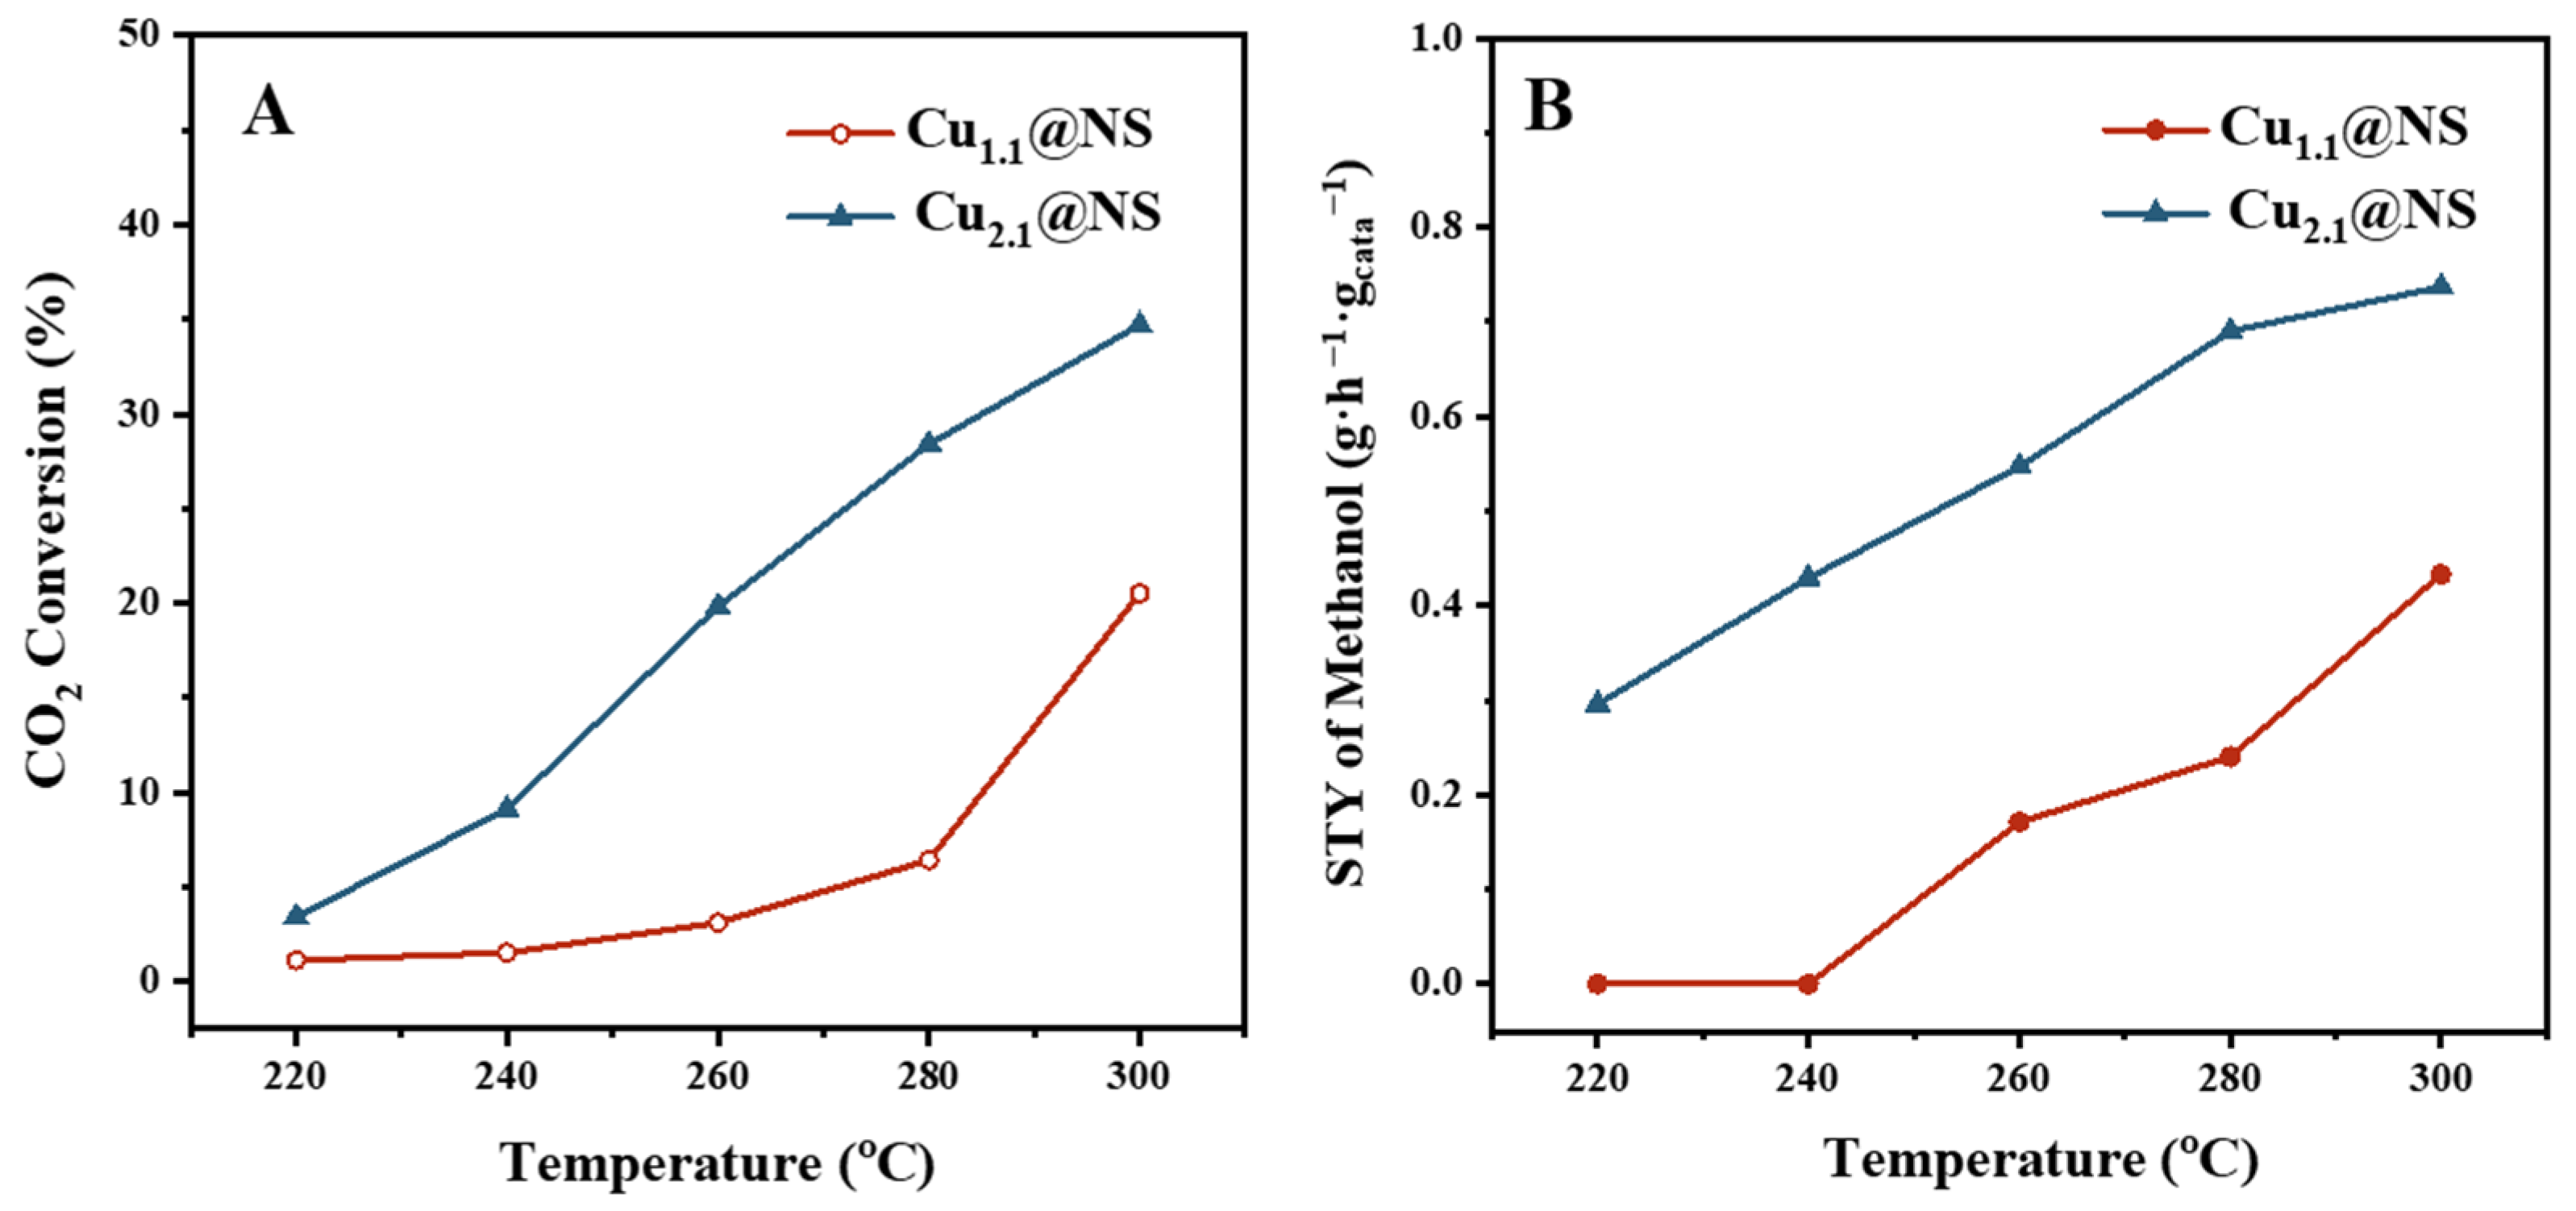
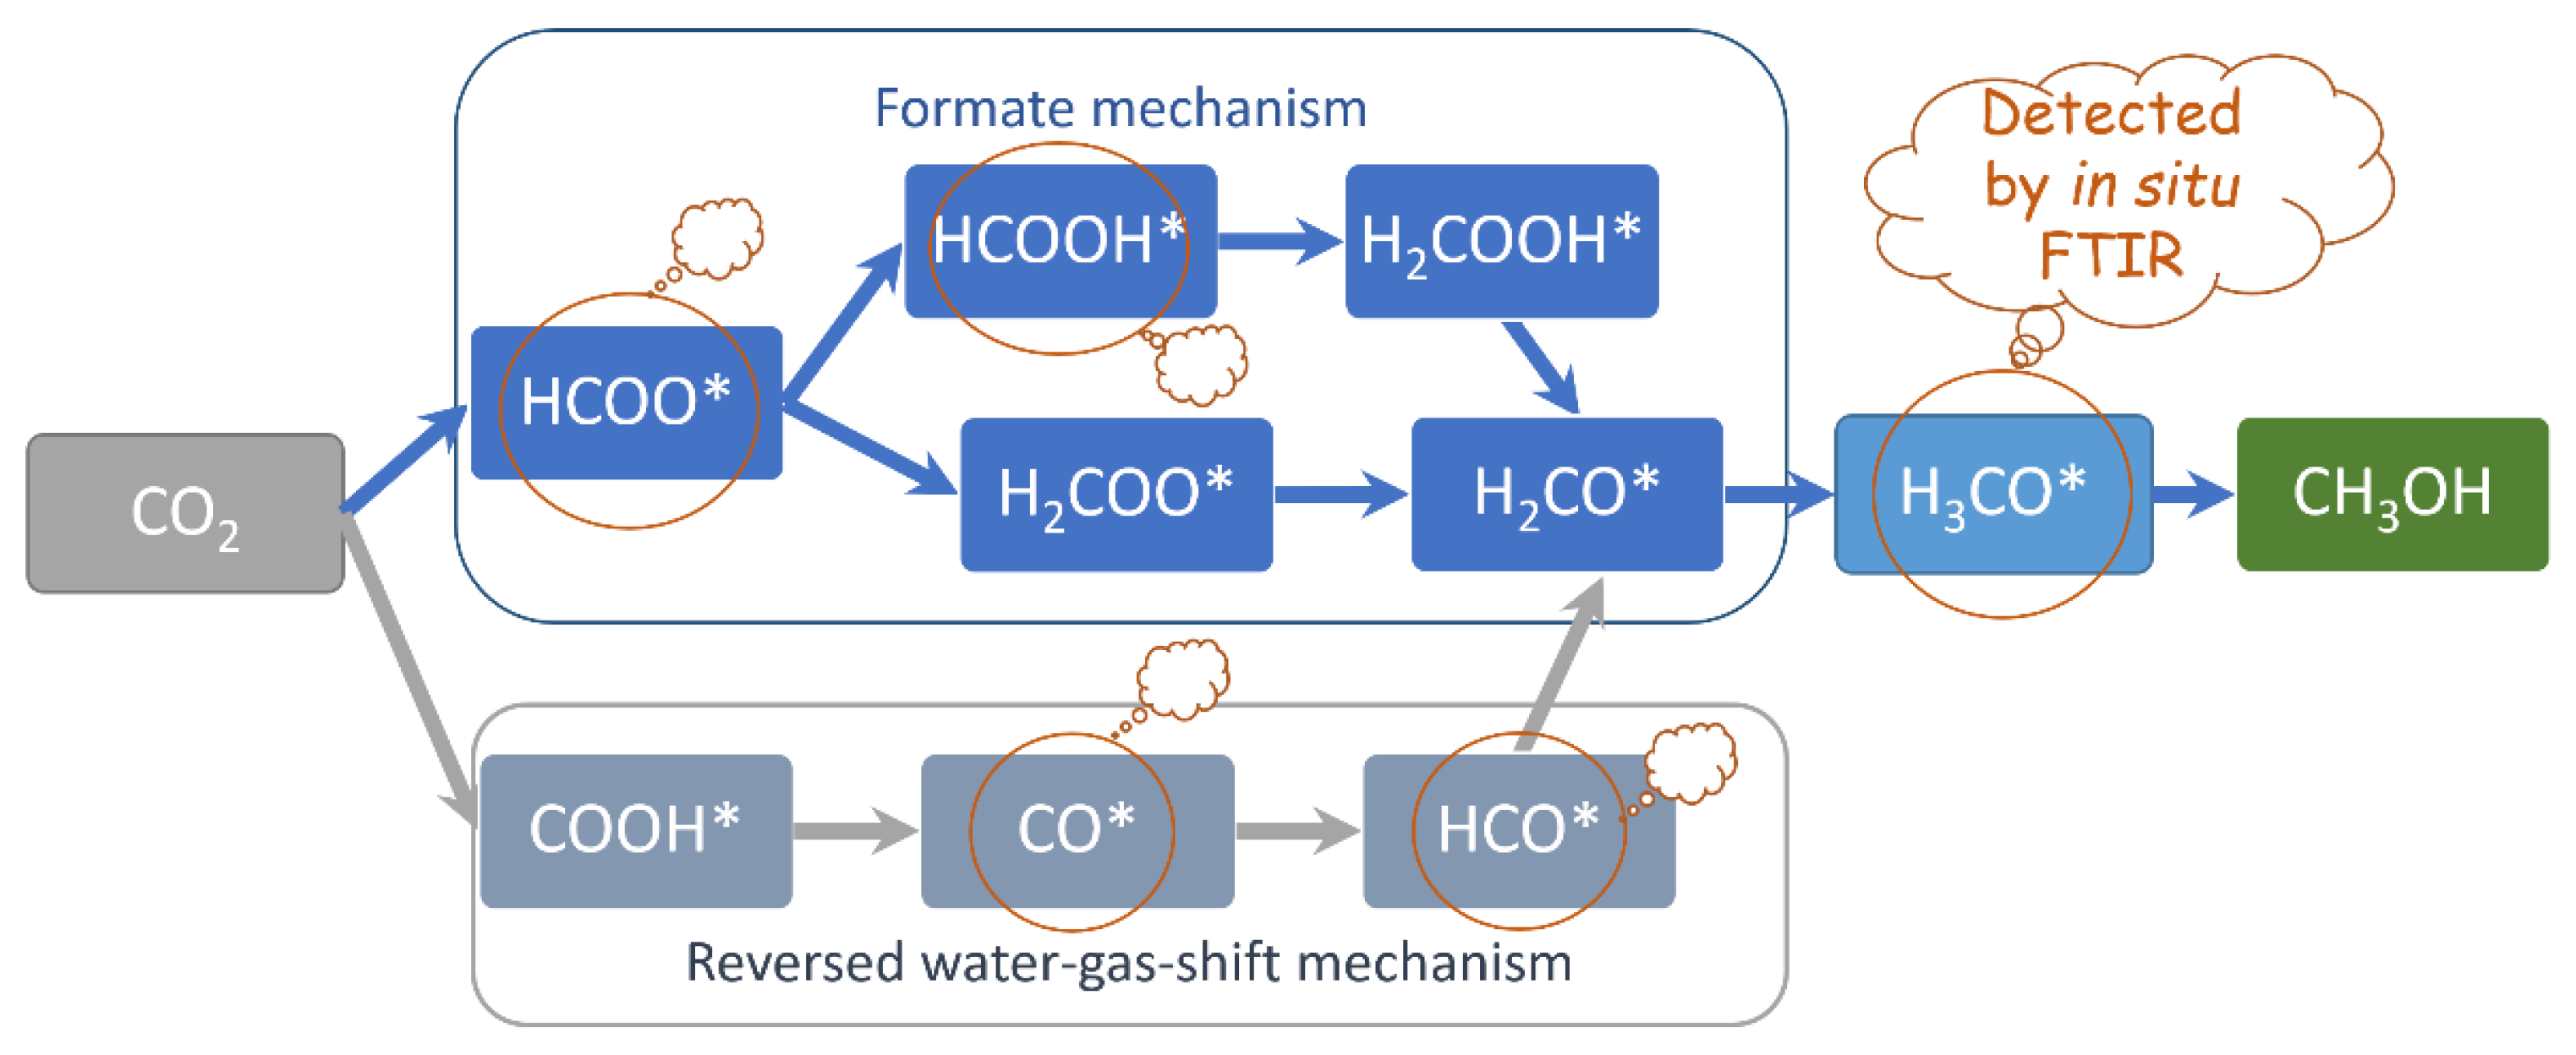
2.2. The Observed CO2 Conversion Intermediates and Their Extinguishments

The results of the catalytic tests in the fixed-bed microreactor are shown in Figure 5. Both Cu@NS samples display CO2 hydrogenation activities. Methanol and CO are the observed hydrogenation products. However, at the tested temperature between 200 and 300 °C and the feed-flow conditions, both Cu@NS could not reach the equilibrium conversion [11] because of the too-low Cu contents in comparison to the Cu/ZnO/Al2O3 catalysts. On the other side, two positive conclusions can still be deducted from the data: (1) Cu2.1@NS that have smaller Cu particles are superior to Cu1.1@NS with a bigger Cu size. Downsizing Cu particles from 2 to 1 nm displays a positive effect in terms of both CO2 conversion and methanol yields. (2) In calculating the space-time yields of methanol, Cu1.1@NS already comes in a range comparable with the benchmark test of the commercial Cu/Zn/Al2O3 catalyst, which spans 0.1–0.8 g·h−1·gcat−1 [4], and Cu2.1@NS behaves in a way better than Cu1.1@NS. With the open possibilities for further improvements, such as introducing further components to boost CO2 conversion, zeolite-encapsulated ultrafine Cu particles are potentially viable catalysts for the CO2-to-methanol processes.
Time-resolved in situ FTIR spectra of CO2 adsorption at room temperature over Cu2.1@NS prereduced at 400 °C (Figure 6A) reveal accumulations of several species: significantly recognized is a band at 1614 cm−1, which may contain the asymmetric stretching of the O-C-O group of adsorbed bidentate CO2 and formate on Cu surfaces, i.e., Cu-O-C-O-Cu and Cu-O-C(H)-O-Cu species [36,37,38], in addition to the bending vibration of H2O molecules [39,40]. In addition, a tiny peak at 1746 cm−1 for the C-O stretching of surface formyl, Cu-C(H)-O [41], is detected. Another peak at 2073 cm−1 is barely detectable for the stretching of surface carbonyl, Cu-C-O [30,36,42]. These absorption bands give hints to the initial reactions with the surface H atoms and the break of one C-O bond:
CO2* + H* -> HCOO* + *
HCOO* + * -> CO* + OH*
CO* + H* -> HCO* + *
The strong bands from 3000 to 3500 cm−1 are the zeolite silanols and the H2O molecules formed in the surface reactions, which form H-bonds in the internal channels of the zeolite. The peak at 3740 cm−1 is the surface silanol, which is gaining intensity with the H2O formation, as well. Due to the intense water signals, as well as the baseline distortions, above-spectral attributions to formate, formyl, and carbonyl are ambiguous. Figure 6B shows the spectra of the same reduced Cu2.1@NS in CO2 flow at 150 °C. At this condition, all signals that can be related with adsorbed species become weaker, while the H-bonded H2O in the zeolite (3000–3500 cm−1) has been significantly removed. Comfortingly, the multicomponent band at 1614 cm−1 (carbonate, formate, and water) still exists, as does the formyl peak at 1746 cm−1; carbonyl at 2073 cm−1 becomes even slightly more recognizable.
Figure 6C shows the reactions further proceed when CO2 and H2 are cofed. The spectral changes observed are quite complex, and the following tentative interpretations are proposed, awaiting further amendments when more data are acquired with related materials. First, the above-detected three intermediates exhibit slight blue shifts and changes of their relative intensities. The bidentate formate and H2O moves to 1638 cm−1 and becomes much weaker in intensity because stronger adsorbed species remain adsorbed, while weaker adsorbed ones are converted. Related to the bidentate formate, the C-H stretching of the formate group at 2856 cm−1 is most intensive [36,41]. At the same time, the formyl shifts to 1753 cm−1 and become even less cumulated in intensity. The carbonyl shifts to 2103 cm−1 and seems to accumulate in larger quantity under the reactive feed flow, i.e., it converts slower than formyl and formate. Second, some other intermediate species become observed: the predominant one is unidentate carbonate, which is seen as the symmetric stretching at 1392 cm−1 and asymmetric stretching at 1475 cm−1 [30,36,41]; the formic acid that appears at 1753 cm−1 exhibits very weak C=O stretching vibrations [30,41]. Third, a number of methoxy-related surface species become significant: they are at 2920 cm−1 for the C-H stretching of the methoxy and at 1450 cm−1 for the C-H bending [30,38,43]. The 1121 cm−1 band belongs to the zeolite framework modification. The negative bands at 3740 and 3000 cm−1 correspond to water desorption during the course of the reaction. At 150 °C (Figure 6D), the formate- and carbonyl-related species are generally weaker but mostly still exist. Furthermore, a siloxyl -Si-OH band grows around 3450 cm−1 due to the continuous formation of H2O. Considering the two major reaction pathways of CO2 to methanol, i.e., the formate mechanism and the reversed water–gas shift mechanism in Scheme 1 [31], adsorbed intermediates of both pathways have been detected in the FTIR spectra, implying that the reaction takes both pathways. However, based on the comparison of accumulation speeds of these species, it is apparent that the formate mechanism predominates at the Cu@NS model catalyst.

3. Materials and Methods

3.1. Materials

Tetraethyl-orthosilicate and ethylenediamine were obtained from Sinopharm Chemical Reagent Co., Ltd., Shanghai, China. Cu(NO3)2·3H2O was obtained from Shanghai Aladdin Biochemical Technology Co., Ltd. Shanghai, China. Tetra-n-propylammonium hydroxide was purchased from Zhejiang Kente Catalytic Materials Co., Ltd. Zhejiang, China.

3.2. Synthesis

Nanosized silicalite-1 and composite materials Cu@silicalite-1 were synthesized via the direct crystallization following the gel recipe, 1 SiO2: 0.3 TPAOH: 0–0.04 Cu(en)2(NO3)2: 19 H2O, a recipe adapted from the established method for the reliable crystallization of nanosized silicalite-1 [32]. The silica source was tetraethyl-orthosilicate (TEOS); TPAOH stands for tetra-n-propylammonium hydroxide. For the preparation of the gels, Cu(NO3)2 was first dissolved in H2O with a great excess amount of ethylenediamine (en), then TPAOH (25% aq.) was mixed. TEOS was then added, and the mixture was stirred at RT overnight to form a blue-colored and transparent gel. Table 1 lists the gel compositions with the various Cu(en)2(NO3)2 contents. The hydrothermal crystallization was performed in Teflon-lined autoclaves at 100 °C for 30–54 h. After the crystallization, the autoclaves were quenched in cold water. Solid products were recovered by filtration and washed with water 3 times. Calcination was performed by heating in air at 1 °C/min to 550 °C, and the end product was kept for 6 h.

3.3. Characterization

Powder X-ray diffraction was performed on a Rigaku Smart Lab 9 KW diffractometer (Tokyo, Japan) using Cu Kα radiation at 40 kV and 150 mA. A 1D detector was used to collect diffraction data in a continuous scan mode in theta–theta geometry. Zeolite powders were pressed on glass plate sample holders.
SEM pictures of powder samples were taken on a JEOL JSM 7900F Scanning Electron Microscope (Tokyo, Japan) equipped with a field emission gun operating at 1–2 kV. The samples were dusted on carbon sheets and inspected without coating.
TEM, STEM images, and corresponding EDS were taken on a JEOL JEM-F200 electron microscope. Before analysis, the samples were suspended in ethanol and dispersed onto ultrathin carbon films supported on 200 mesh Au grids.
ICP element analysis for Cu in Cu@NS was carried out on iCAP Q, Thermo, Waltham, MA, USA.
FTIR spectra were recorded using a Bruker Vertex 70V Spectrometer (Billerica, MA, USA) at a spectral resolution of 4 cm−1. The equipment, including the sample chamber, was evacuated to below 1 hPa. The in situ FTIR studies were performed on self-sustaining pellets of a density of 15 mg/cm2, which are enclosed in a gas-tight and heated cell with CaF2 windows. The samples were purged in 30 mL/min Ar at 350 °C for 1 h prior to spectroscopic recording.
For probing the surfaces with CO2, or CO2 + H2, the sample was reduced at 400 °C in a flow of 4% H2/Ar. After cooling down to room temperature, as well as to 150 °C, background spectra were recorded. Then, a flow of CO2 or CO2/3H2 was introduced into the cell for 30 min, along with spectral recording in 1 min time intervals.
Diffuse reflectance UV-Vis spectra of reduced Cu@NS were taken using a Rigaku UV-Vis spectrometer equipped with a Kubelka-Munk integration sphere. The powder samples were filled in a quartz cuvette and measured against BaSO4.
Temperature-programmed reduction tests of Cu@NS were carried out in a quartz tubular reactor (homemade). All catalysts were pretreated in Ar at 350 °C for 60 min. After cooling to room temperature, the experiment was started in 10% H2/Ar flow with a heating rate of 10 °C/min.

3.4. Catalytic Test

The catalytic performance test was carried out in a stainless steel-armed quartz tube fixed-bed microreactor. An amount of 0.5 g catalyst pellets of 60–100 mesh was packed in the reactor. Prior to a test, the catalyst was prereduced in 100 mL/min mixture of 10% H2/Ar at 400 °C for 2 h. The CO2 hydrogenation reaction was carried out in the temperature range of 220–300 °C, and CO2/3H2 flow at GHSV = 2000 h−1 at 30 bar. The gas effluents were analyzed using an online GC (Agilent 8890, Santa Clara, CA, USA). All postreactor lines and valves were heated to 140 °C to prevent the condensation of the products. All carbon-containing components, including CO2, CO, and methanol, were calibrated and quantified using external standards.

4. Conclusions

Ultrafine Cu clusters of sizes smaller than 2 nm in loading amounts up to ca. 2 wt.% have been encapsulated in the nanospheres of silicalite-1 through direct crystallization using Cu(en)22+ as the metal precursor. The nano-zeolite particles are rich in connectivity defects and vacancy defects on the grain boundaries. The silanols and nested silanols at these defect positions react with Cu(en)22+, promote the decomposition of the Cu precursor and lead to the deposition of the ultrafine cupro-hydroxy-oxides particles at the grain boundaries that can be converted into ultrafine metallic Cu particles. The complexity of the zeolite defects results in different sizes of the deposited Cu cluster.
As a model catalyst, Cu@NS produces methanol and CO in CO2 hydrogenation reactions. The methanol space-time yield is comparable with the benchmark test using a commercial Cu/ZnO/Al2O3 catalyst. Preliminary in situ FTIR has detected adsorbed intermediates of both the formate mechanism and reversed water-gas shift mechanism, implying that the reactions take both pathways. However, based on the different accumulation speeds of these species, it is apparent that the formate mechanism predominates at the Cu@NS model catalyst.

Author Contributions

Conceptualization, X.Y. and V.V.; methodology, G.F. and X.Y.; investigation, R.D., G.F., S.W., Y.Y., Q.L., H.Z. and X.Y.; writing—original draft preparation, G.F. and X.Y.; writing—review and editing, V.V.; supervision, V.V.; funding acquisition, V.V. All authors have read and agreed to the published version of the manuscript.

Funding

This research was funded by Shandong Energy Institute, grant number SEI S202107; Natural Science Foundation of Shandong Province, grant number ZR2022MB053 and ZR2022QB216.

Data Availability Statement

Not applicable.

Acknowledgments

The ZeoMat Group acknowledges the starting grant provided by QIBEBT. V.V. and X.Y. acknowledge the collaboration in the framework of the Sino-French International Research Network “Zeolites”.

Conflicts of Interest

The authors declare no conflict of interest.

References

  1. Zhong, J.; Yang, X.; Wu, Z.; Liang, B.; Huang, Y.; Zhang, T. State of the art and perspectives in heterogeneous catalysis of CO2 hydrogenation to methanol. Chem. Soc. Rev. 2020, 49, 1385–1413. [Google Scholar] [CrossRef] [PubMed]
  2. Shih, C.F.; Zhang, T.; Li, J.; Bai, C. Powering the Future with Liquid Sunshine. Joule 2018, 2, 1925–1949. [Google Scholar] [CrossRef] [Green Version]
  3. Gao, P.; Zhang, L.; Li, S.; Zhou, Z.; Sun, Y. Novel Heterogeneous Catalysts for CO2 Hydrogenation to Liquid Fuels. ACS Cent. Sci. 2020, 6, 1657–1670. [Google Scholar] [CrossRef]
  4. Ruland, H.; Song, H.; Laudenschleger, D.; Stürmer, S.; Schmidt, S.; He, J.; Kähler, K.; Muhler, M.; Schlögl, R. CO2 Hydrogenation with Cu/ZnO/Al2O3: A Benchmark Study. ChemCatChem 2020, 12, 3216–3222. [Google Scholar] [CrossRef]
  5. Liang, B.; Ma, J.; Su, X.; Yang, C.; Duan, H.; Zhou, H.; Deng, S.; Li, L.; Huang, Y. Investigation on Deactivation of Cu/ZnO/Al2O3 Catalyst for CO2 Hydrogenation to Methanol. Ind. Eng. Chem. Res. 2019, 58, 9030–9037. [Google Scholar] [CrossRef] [Green Version]
  6. Huang, C.; Wen, J.; Sun, Y.; Zhang, M.; Bao, Y.; Zhang, Y.; Liang, L.; Fu, M.; Wu, J.; Ye, D.; et al. CO2 hydrogenation to methanol over Cu/ZnO plate model catalyst: Effects of reducing gas induced Cu nanoparticle morphology. Chem. Eng. J. 2019, 374, 221–230. [Google Scholar] [CrossRef]
  7. Toyir, J.; Miloua, R.; Elkadri, N.E.; Nawdali, M.; Toufik, H.; Miloua, F.; Saito, M. Sustainable process for the production of methanol from CO2 and H2 using Cu/ZnO-based multicomponent catalyst. Phys. Procedia 2009, 2, 1075–1079. [Google Scholar] [CrossRef] [Green Version]
  8. George Olah CO2 to Renewable Methanol Plant, Reykjanes, Iceland. Available online: https://www.carbonrecycling.is/ (accessed on 2 September 2022).
  9. Liu, L.; Corma, A. Metal Catalysts for Heterogeneous Catalysis: From Single Atoms to Nanoclusters and Nanoparticles. Chem. Rev. 2018, 118, 4981–5079. [Google Scholar] [CrossRef] [Green Version]
  10. Henry, C.R.; Chapon, C.; Giorgio, S.; Goyhenex, C. Size Effects in Heterogeneous Catalysis. In Chemisorption and Reactivity on Supported Clusters and Thin Films: Towards an Understanding of Microscopic Processes in Catalysis; Lambert, R.M., Pacchioni, G., Eds.; Springer: Dordrecht, The Netherlands, 1997; pp. 117–152. [Google Scholar]
  11. Behrens, M.; Studt, F.; Kasatkin, I.; Kühl, S.; Hävecker, M.; Abild-Pedersen, F.; Zander, S.; Girgsdies, F.; Kurr, P.; Kniep, B.-L.; et al. The Active Site of Methanol Synthesis over Cu/ZnO/Al2O3 Industrial Catalysts. Science 2012, 336, 893–897. [Google Scholar] [CrossRef]
  12. Kattel, S.; Ramírez, P.J.; Chen, J.G.; Rodriguez, J.A.; Liu, P. Active sites for CO2 hydrogenation to methanol on Cu/ZnO catalysts. Science 2017, 355, 1296–1299. [Google Scholar] [CrossRef]
  13. Zhang, J.; Wang, L.; Zhang, B.; Zhao, H.; Kolb, U.; Zhu, Y.; Liu, L.; Han, Y.; Wang, G.; Wang, C.; et al. Sinter-resistant metal nanoparticle catalysts achieved by immobilization within zeolite crystals via seed-directed growth. Nat. Catal. 2018, 1, 540–546. [Google Scholar] [CrossRef]
  14. Kosinov, N.; Liu, C.; Hensen, E.J.M.; Pidko, E.A. Engineering of Transition Metal Catalysts Confined in Zeolites. Chem. Mater. 2018, 30, 3177–3198. [Google Scholar] [CrossRef]
  15. Kim, S.; Tsang, Y.F.; Kwon, E.E.; Lin, K.-Y.A.; Lee, J. Recently developed methods to enhance stability of heterogeneous catalysts for conversion of biomass-derived feedstocks. Korean J. Chem. Eng. 2019, 36, 1–11. [Google Scholar] [CrossRef]
  16. Liu, L.; Corma, A. Confining isolated atoms and clusters in crystalline porous materials for catalysis. Nat. Rev. Mater. 2021, 6, 244–263. [Google Scholar] [CrossRef]
  17. Wang, Y.; Wang, C.; Wang, L.; Wang, L.; Xiao, F.-S. Zeolite Fixed Metal Nanoparticles: New Perspective in Catalysis. Acc. Chem. Res. 2021, 54, 2579–2590. [Google Scholar] [CrossRef]
  18. Yang, X.; Toby, B.H.; Camblor, M.A.; Lee, Y.; Olson, D.H. Propene adsorption sites in zeolite ITQ-12: A combined synchrotron X-ray and neutron diffraction study. J Phys Chem B 2005, 109, 7894–7899. [Google Scholar] [CrossRef] [PubMed]
  19. Yang, B.; Liu, C.; Halder, A.; Tyo, E.C.; Martinson, A.B.F.; Seifert, S.; Zapol, P.; Curtiss, L.A.; Vajda, S. Copper Cluster Size Effect in Methanol Synthesis from CO2. J. Phys. Chem. C 2017, 121, 10406–10412. [Google Scholar] [CrossRef]
  20. Zhang, X.; Liu, J.-X.; Zijlstra, B.; Filot, I.A.W.; Zhou, Z.; Sun, S.; Hensen, E.J.M. Optimum Cu nanoparticle catalysts for CO2 hydrogenation towards methanol. Nano Energy 2018, 43, 200–209. [Google Scholar] [CrossRef]
  21. Borfecchia, E.; Beato, P.; Svelle, S.; Olsbye, U.; Lamberti, C.; Bordiga, S. Cu-CHA—A model system for applied selective redox catalysis. Chem. Soc. Rev. 2018, 47, 8097–8133. [Google Scholar] [CrossRef] [PubMed] [Green Version]
  22. Yang, J.; Du, X.; Qiao, B. Methane oxidation to methanol over copper-containing zeolite. Chem 2021, 7, 2270–2272. [Google Scholar] [CrossRef]
  23. Carter, J.H.; Dummer, N.F.; Chow, Y.K.; Williams, C.; Nasrallah, A.; Willock, D.J.; Hutchings, G.J.; Taylor, S.H. The Selective Oxidation of Methane to Oxygenates Using Heterogeneous Catalysts. In Heterogeneous Catalysis for Sustainable Energy; John Wiley & Sons: Hoboken, NJ, USA, 2022; pp. 183–201. [Google Scholar]
  24. Chai, Y.; Shang, W.; Li, W.; Wu, G.; Dai, W.; Guan, N.; Li, L. Noble Metal Particles Confined in Zeolites: Synthesis, Characterization, and Applications. Adv. Sci. 2019, 6, 1900299. [Google Scholar] [CrossRef] [Green Version]
  25. Ding, L.; Shi, T.; Gu, J.; Cui, Y.; Zhang, Z.; Yang, C.; Chen, T.; Lin, M.; Wang, P.; Xue, N.; et al. CO2 Hydrogenation to Ethanol over Cu@Na-Beta. Chem 2020, 6, 2673–2689. [Google Scholar] [CrossRef]
  26. Cui, W.-G.; Li, Y.-T.; Yu, L.; Zhang, H.; Hu, T.-L. Zeolite-Encapsulated Ultrasmall Cu/ZnOx Nanoparticles for the Hydrogenation of CO2 to Methanol. ACS Appl. Mater. Interfaces 2021, 13, 18693–18703. [Google Scholar] [CrossRef] [PubMed]
  27. Choi, M.; Wu, Z.; Iglesia, E. Mercaptosilane-Assisted Synthesis of Metal Clusters within Zeolites and Catalytic Consequences of Encapsulation. J. Am. Chem. Soc. 2010, 132, 9129–9137. [Google Scholar] [CrossRef] [PubMed]
  28. Goel, S.; Wu, Z.; Zones, S.I.; Iglesia, E. Synthesis and Catalytic Properties of Metal Clusters Encapsulated within Small-Pore (SOD, GIS, ANA) Zeolites. J. Am. Chem. Soc. 2012, 134, 17688–17695. [Google Scholar] [CrossRef] [PubMed]
  29. Wang, N.; Sun, Q.; Bai, R.; Li, X.; Guo, G.; Yu, J. In Situ Confinement of Ultrasmall Pd Clusters within Nanosized Silicalite-1 Zeolite for Highly Efficient Catalysis of Hydrogen Generation. J. Am. Chem. Soc. 2016, 138, 7484–7487. [Google Scholar] [CrossRef] [PubMed]
  30. Schumann, J.; Kröhnert, J.; Frei, E.; Schlögl, R.; Trunschke, A. IR-Spectroscopic Study on the Interface of Cu-Based Methanol Synthesis Catalysts: Evidence for the Formation of a ZnO Overlayer. Top. Catal. 2017, 60, 1735–1743. [Google Scholar] [CrossRef] [Green Version]
  31. Grabow, L.C.; Mavrikakis, M. Mechanism of Methanol Synthesis on Cu through CO2 and CO Hydrogenation. ACS Catal. 2011, 1, 365–384. [Google Scholar] [CrossRef]
  32. Mintova, S.; Olson, N.H.; Senker, J.; Bein, T. Mechanism of the Transformation of Silica Precursor Solutions into Si-MFI Zeolite. Angew. Chem. Int. Ed. 2002, 41, 2558–2561. [Google Scholar] [CrossRef]
  33. Medeiros-Costa, I.C.; Dib, E.; Nesterenko, N.; Dath, J.-P.; Gilson, J.-P.; Mintova, S. Silanol defect engineering and healing in zeolites: Opportunities to fine-tune their properties and performances. Chem. Soc. Rev. 2021, 50, 11156–11179. [Google Scholar] [CrossRef]
  34. Dib, E.; Costa, I.M.; Vayssilov, G.N.; Aleksandrov, H.A.; Mintova, S. Complex H-bonded silanol network in zeolites revealed by IR and NMR spectroscopy combined with DFT calculations. J. Mater. Chem. A 2021, 9, 27347–27352. [Google Scholar] [CrossRef]
  35. Bordiga, S.; Ugliengo, P.; Damin, A.; Lamberti, C.; Spoto, G.; Zecchina, A.; Spanò, G.; Buzzoni, R.; Dalloro, L.; Rivetti, F. Hydroxyls nests in defective silicalites and strained structures derived upon dehydroxylation: Vibrational properties and theoretical modelling. Top. Catal. 2001, 15, 43–52. [Google Scholar] [CrossRef]
  36. Clarke, D.B.; Bell, A.T. An Infrared Study of Methanol Synthesis from CO2 on Clean and Potassium-Promoted Cu/SiO2. J. Catal. 1995, 154, 314–328. [Google Scholar] [CrossRef]
  37. Robbins, J.L.; Marucchi-Soos, E. Evidence for multiple carbon monoxide hydrogenation pathways on platinum alumina. J. Phys. Chem. 1989, 93, 2885–2888. [Google Scholar] [CrossRef]
  38. Baltrusaitis, J.; Jensen, J.H.; Grassian, V.H. FTIR Spectroscopy Combined with Isotope Labeling and Quantum Chemical Calculations to Investigate Adsorbed Bicarbonate Formation Following Reaction of Carbon Dioxide with Surface Hydroxyl Groups on Fe2O3 and Al2O3. J. Phys. Chem. B 2006, 110, 12005–12016. [Google Scholar] [CrossRef]
  39. Meunier, F.C.; Kdhir, R.; Potrzebowska, N.; Perret, N.; Besson, M. Unravelling Platinum–Zirconia Interfacial Sites Using CO Adsorption. Inorg. Chem. 2019, 58, 8021–8029. [Google Scholar] [CrossRef]
  40. Meunier, F.C.; Dansette, I.; Eng, K.; Schuurman, Y. Differentiating the Reactivity of ZrO2-Bound Formates Formed on Cu/ZrO2 during CO2 Hydrogenation. Catalysts 2022, 12, 793. [Google Scholar] [CrossRef]
  41. Bando, K.K.; Sayama, K.; Kusama, H.; Okabe, K.; Arakawa, H. In-situ FT-IR study on CO2 hydrogenation over Cu catalysts supported on SiO2, Al2O3, and TiO2. Appl. Catal. A Gen. 1997, 165, 391–409. [Google Scholar] [CrossRef]
  42. Pritchard, J.; Catterick, T.; Gupta, R.K. Infrared spectroscopy of chemisorbed carbon monoxide on copper. Surf. Sci. 1975, 53, 1–20. [Google Scholar] [CrossRef]
  43. Bahruji, H.; Bowker, M.; Hutchings, G.; Dimitratos, N.; Wells, P.; Gibson, E.; Jones, W.; Brookes, C.; Morgan, D.; Lalev, G. Pd/ZnO catalysts for direct CO2 hydrogenation to methanol. J. Catal. 2016, 343, 133–146. [Google Scholar] [CrossRef]
Figure 1. Powder XRD of as-synthesized (A) and calcined (B) nanospheres of silicalite-1 (NS) and Cu-loaded silicalite-1 (Cu@NS); the numbers in the materials’ names indicate the loading amounts of Cu atoms in weight percentages.
Catalysts 12 01296 g001
Figure 2. SEM images of Cu1.1@NS (A,B), Cu2.1@NS (C,D).
Catalysts 12 01296 g002
Figure 3. TEM and STEM-HAADF images of Cu1.1@NS (AD), Cu2.1@NS (EH).
Catalysts 12 01296 g003
Figure 4. Characterization of Cu1.1@NS and Cu2.1@NS materials: (A) FTIR of dehydrated samples in the -OH vibration region; (B) 29Si MAS NMR; (C) TPR curves of calcined samples in 2% H2/Ar at a heating rate of 10 °C/min; (D) diffuse reflectance UV-Vis spectra of calcined and reduced material.
Catalysts 12 01296 g004
Figure 5. Catalytic test of CO2 hydrogenation in the fixed-bed microreactor in CO2/3H2 flow at GHSV = 2000 h−1 and 3 MPa over Cu1.1@NS and Cu2.1@NS materials: (A) CO2 conversion at various temperature; (B) space–time yield of methanol.
Catalysts 12 01296 g005
Figure 6. In situ FTIR of reduced Cu2.1@NS at room temperature and 150 °C in 20 mL/min. (A,B) CO2 flow; (C,D) CO2+3H2 flow at the atmospheric pressure.
Catalysts 12 01296 g006
Scheme 1. The key reaction intermediates in the formate- and reversed water-gas shift mechanisms of CO2 to methanol (* stands for the intermediates), with the highlighted ones detected over Cu2.1@NS by in situ FTIR.
Catalysts 12 01296 sch001
Table 1. Compositions of the synthetic batches, the crystallization conditions, and Cu contents in the products.
SampleInitial Gel Composition (Molar Ratio)Hydrothermal ConditionProduct Cu Content
SiO2TPAOHCu(NO3)2enH2OTemp (°C)t (h)(wt.%)
NS,
nano-silicalite-1
10.30019100300
Cu1.1@NS10.30.014 0.1319100481.10
Cu2.1@NS10.30.028 0.2519100542.10
Publisher’s Note: MDPI stays neutral with regard to jurisdictional claims in published maps and institutional affiliations.

