Abstract
Catalytic reduction of nitroaromatic compounds (NCs) into corresponding aminoaromatic compounds (ACs) addresses two challenges: enhancing of the manufacture scale of ACs as valuable chemical intermediates and removal of NCs as widespread wastewater pollutants. Among the noble metal catalysts that feature low-temperature activity, chemical stability, and nontoxicity, silver-containing catalysts are attractive as cost-efficient and easily prepared compositions. This paper is devoted to the design and study of efficient and environmentally benign Ag- and CeO2-containing NCs reduction catalysts supported on graphene oxide (GO). The silver- and/or ceria-containing catalysts are synthesized using deposition-precipitation onto GO prepared by oxidative treatment of graphite. The catalysts and support are characterized by XRD, XPS, TGA, N2 sorption, Raman spectroscopy, and UV–VIS spectrometry. The influence of state and the interaction of the active components on catalytic activity is thoroughly estimated in 4-nitrophenol (4-NP) reduction into 4-aminophenol (4-AP) at ambient pressure and room temperature. Nanosized Ag and CeO2 particles with sizes up to 30 and 5 nm, respectively, in the GO structure are obtained. The co-deposition of Ag and CeO2 onto GO promotes the stabilization of silver in the catalyst. The Ag-CeO2/GO catalyst demonstrates superior activity in the synthesized series (kapp of 1.615 and 3.674 min−1 for as-prepared and pre-reduced samples). In addition, the Ag-CeO2/GO catalyst retains good stability and a low leaching degree of the active components that makes these compositions efficient in NCs’ reduction into corresponding ACs.
1. Introduction
Nowadays, nitroaromatic compounds (NCs or nitroarenes) are among the largest and most important groups of industrial chemicals used, whose production capacity is 9% of all benzene derivatives. The NCs are feedstocks for a set of materials: explosives, pesticides, biologically active substances, etc. However, the vast NC amount (>75%) is used in the manufacturing of aminoaromatic compounds (ACs or aminoarenes) [1,2]. A classical and the most widespread method of AC production is NC catalytic reduction, realized by such chemical companies as BASF, Bayer (gas-phase process), and DuPont (liquid-phase process). Copper-containing catalysts, e.g., Cu/SiO2 and Cu/Cr2O3, are favored for the gas-phase process, while noble metal (platinum and palladium)-containing catalysts are preferred for the liquid-phase process [3,4,5]. In turn, ACs are valuable intermediates in the manufacturing of pharmaceuticals, dyes and pigments, plastics (polyurethanes), and agrichemicals, which are also used as curing agents and antioxidants in synthetic rubbers [6]. Thus, NCs’ conversion into corresponding ACs is an important up-to-date chemical process affecting a number of human life aspects.
However, NCs are considered among the most widespread toxic and carcinogenic organic pollutants due to their versatile applications. They can be accumulated in the atmosphere, soil, and water. NCs occur in the environment substantially due to anthropogenic sources (agriculture, industrial wastewaters, storage leaks, fossil fuels combustion, etc.) and less due to natural sources (solar-induced nitration of water-dissolved arenes, vital activity of some microorganisms) [1]. There are a number of ecologically safe methods resolving NC pollution, namely chemical treatment by oxidizers (e.g., ozone [7]), electro- and photocatalytic degradation [8], and bioremediation [2] of dissolved nitroarenes. However, these approaches are destructive, i.e., they cause total decomposition and loss of the compounds, and can be economically costly. At the moment, the NCs’ catalytic reduction to aminoarenes is considered a promising method [9]. This approach allows following the extraction of the substances from a solution using adsorbents or chemical bonding. The obtained aromatic amines can be further recycled into useful feedstocks, which is a more profitable process of removing the NCs from the environment. Therefore, both the growing AC demand and NC removal are urgent challenges in the field of the design of novel catalysts for selective NC reduction.
Particular success in solving these challenges was achieved using noble metal catalysts, i.e., Au, Pt, Pd, and Ag, that demonstrate high catalytic activity under mild conditions, stability, and nontoxicity [10,11]. Silver-containing catalysts are currently used in a number of industrial catalytic processes, such as alcohol oxidation to aldehydes [12], ethylene glycol oxidation to glyoxal, and ethylene epoxidation, with the last one being a process in which Ag-containing catalysts do not have analogues [13]. Unlike platinum-group metals, metallic silver has lower sorption and affinity to hydrogen due to the totally occupied 4d electron shell. This limits silver use in large-scale reduction processes. Nevertheless, Ag-based catalysts are a recent focus of catalytic science [14]. Among the noble metals used in reduction reactions, these are advantageous catalytic systems due to the relatively low cost, facile preparation procedure, and wide opportunities for modification [15]. To the best of our knowledge, the work of Pradhan et al. [16] was one of the earliest thorough research projects devoted to NC reduction with NaBH4 using silver nanoparticles as a catalyst. The reaction is representative of screening the catalytic properties of catalysts used in hydrogenation processes due to a simple instrumental design and methodology and mild reaction conditions [9].
The design of metal-containing catalysts supported on transition metal oxides is a widespread technique for achieving desirable catalytic properties. Cerium (IV) oxide, a transition metal oxide with a cubic fluorite-like lattice, is an attractive compound to prepare supported metal catalysts, which is characterized by the presence of the dynamic Ce4+/Ce3+ redox pair [17]. This fact results in cerium (IV) oxide’s own catalytic activity and surface defects continuum acting as an active site to stabilize metal species in the dispersed state [18]. Ag-CeO2 is a promising composition since the metal–support interaction (MSI) between silver and ceria leads to the cooperative action of the metal and the oxide active sites in catalytic reactions and also to modifying of the state of the components at the Ag-CeO2 interface [19,20]. This causes a synergistic effect in both oxidation [21,22,23] and reduction [24,25,26] reactions, enhancing catalytic activity. However, the Ag-CeO2 system tends to aggregate during the synthesis and catalysis procedure, and there is a demand for primary support to prevent the active surface from decreasing.
In the past few years, carbonaceous and carbon-based nanomaterials have been attracting profound research interest. Graphene is a 2D carbon nanomaterial consisting of a single layer of sp2-hybridized carbon formed in a hexagonal lattice. Although the term “graphene” was introduced in 1986, only in 2004 did Andre Geim and Konstantin Novoselov successfully obtain and study the isolated graphene layer [27]. There has been a dramatic growth in the number of publications devoted to graphene-based materials since 2010, when the authors were awarded the Nobel Prize in Physics. The material has unique physical-chemical properties, such as a high specific surface area (up to 2000 m2/g), thermal conductivity (~5000 W/m·s), intrinsic mobility (~200,000 cm2/V·s), mechanical strength (Young modulus ~1 TPa), chemical stability, and biocompatibility [28]. Graphene-based materials are in focus in numerous scientific areas: from electronics and energy storage/conversion to medicine and environmental applications [29,30]. Graphene derivatives, graphene oxide (GO) and reduced graphene oxide (rGO), are of interest in the field of catalysis science, where they are used as supports for active components [28,31] and adsorbents [32,33]. GO is a nonstoichiometric carbon-based material synthesized by oxidative treatment of graphite, followed by exfoliation, and contains abundant oxygen functional groups: carboxyl, carbonyl, hydroxyl, and epoxy groups. When the obtained material is reduced, an rGO material is obtained with a structure similar to pristine graphene but with certain matrix defects (vacancy, nanopore, Stone–Wales defect) and a few residual oxygenated moieties [34]. The use of GO and rGO as supports for catalysts and adsorbents is due to a number of properties. Apart from a high surface area and chemical stability, the occupation of the GO surface by functional groups makes it hydrophilic, which simplifies its use in an aqueous medium, increases its sorption capacity toward polar substances (including precursors), and also provides opportunities for surface functionalization [30,34]. Moreover, optical activity and semiconductive properties are characterized by a decrease in the band gap value from ~4.3 to ~1.1 eV upon GO-to-rGO reduction, which allows use of these materials as active supports in electro- and photocatalysts [35,36].
Among a variety of graphene-based composites, the Ag-CeO2 catalysts supported on GO or rGO have been studied in the reduction of nitroaromatic compounds [37], the photocatalytic esterification of aldehydes [38], the degradation of organic pollutants [39,40], etc. The authors used consequent loading of the active components onto GO or the use of additional stabilizing agents (PVP, 6-aminohexanoic acid) to synthesize supported Ag-CeO2 catalysts. Unlike the methods described in these papers, the Ag+ and Ce3+ precursors are co-deposited onto GO for an efficient Ag-CeO2 junction via the redox reaction between the precursors during the synthesis [22,24]. In addition, the synthesis was carried out in the absence of additional stabilizers to avoid impurities and gain a chemically defined composition of the catalysts.
Thus, this work focuses on designing and studying efficient and environmentally benign Ag-CeO2/GO catalysts for NC reduction. Special attention is given to the effect of Ag and CeO2 co-deposition onto GO. The influence of state and the interaction of active components on catalytic activity is estimated during 4-nitrophenol’s (4-NP) reduction into 4-aminophenol (4-AP) at ambient pressure and room temperature.
2. Results and Discussion
2.1. Characterization of the Support
2.1.1. N2 Sorption
The textural characteristics of the porous structure of the synthesized support were studied by the method of low-temperature adsorption-desorption of nitrogen. Figure S1 shows the results for milled GO and pristine graphite. The GO sorption isotherm (Figure S1a) refers to type IV isotherms with a H3 hysteresis loop according to the IUPAC classification [41]. This type of isotherm is characterized by a hysteresis loop in the relative pressure range of 0.45–0.99 and a sharp rise in the initial section of the adsorption branch in the range of low pressures (P/Po < 0.05), which indicate a micro-mesoporous layered structure of the obtained material. Unlike the synthesized GO, graphite is a non-porous material. A low value of nitrogen sorption is observed up to a relative pressure of 0.85, above which polymolecular adsorption begins on the surface of the graphite particles. The pore size distribution shows that GO has a narrow distribution of micropores (0.35–0.6 nm in size), with a small contribution of pores with a size of 0.6–0.8 nm (Figure S1b), while mesopores have a continuous descending distribution with the majority of pores being in the range of 1.75–3.5 nm. The bimodal pore size distribution is due to the formation of microporous aggregates of folded turbostratic carbon layers (“stacks”) that are separated by mesopores [41].
Table 1 summarizes the textural characteristics of GO and graphite samples. The synthesized support possesses a surface area of 54.6 m2/g and a pore volume of 0.1 cm3/g, which is much higher than that of the initial graphite. The volume of micropores for GO is 0.02 cm3/g (~20% of the total pore volume). The micropores with an average size of 0.45 nm have a specific surface area of 46 m2/g (~85% of the total surface). Hence, the main contribution to the surface area of the obtained support is caused by micropores.

Table 1.
Textural characteristics of the carbon materials.
2.1.2. XRD
The phase composition of the graphene derivatives was studied by powder X-ray diffraction. Figure 1 shows the XRD patterns of graphite, GO, and rGO. A graphite sample is characterized by reflections, with maxima at 26.5°, 42.5°, 44.6°, and 54.5° 2θ that are attributed to the crystallographic planes of the graphite hexagonal lattice (PDF 00-041-1487): d002 = 3.37 Å, d100 = 2.13 Å, d101 = 2.03 Å, and d004 = 1.68 Å, respectively. The extremely high intensity and small width of the peaks indicate the large size of the crystallites, which in turn leads to a low surface area and porosity observed from the nitrogen sorption results.
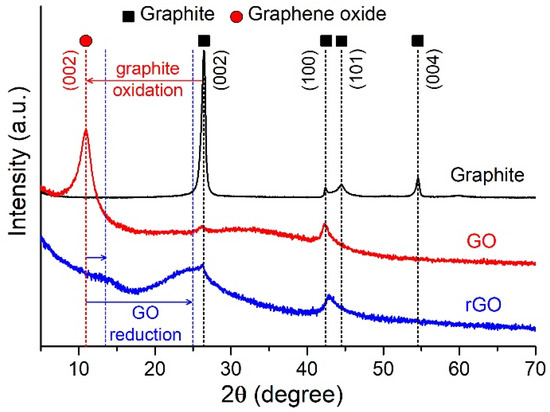
Figure 1.
XRD patterns of graphite, GO, and rGO samples.
For the synthesized GO sample, a shift of the (002) reflection attributed to the interlayer space of the sp2-hybridized carbon is observed at 11.1° 2θ that corresponds to the interplanar distance d002 = 7.98 Å. The increase in the distance between the carbon sheets is due to the intercalation of the oxygenated moieties and adsorbed water into the interlayer space as a result of the oxidative treatment of graphite [42]. The broadening of the interlayer space causes the appearance of microporosity in the sample, which is consistent with the nitrogen sorption data. The high intensity and pointed shape of the (002) reflection at 11.1° 2θ indicate the formation of ordered GO “stacks” with a uniform distribution of the embedded functional groups. The small peak at ~26° 2θ is attributed to the impurity phase of residual graphite.
When GO is reduced to rGO, the interlayer spacing decreases due to the elimination of functional groups, and the (002) reflection shifts to the region of large 2θ values: ~13° (partially reduced GO layers) and ~25° 2θ (reduced GO layers) [42]. These two peaks are observed since rGO does not have a specific distribution of the stable residual oxygenated moieties that cannot be removed without damaging the basal plane [34]. The higher intensity of the peak at ~25° 2θ may indicate a low content of oxygen functional groups in the sample. A wide shape (halo) of the peak in the range of 18°–33° 2θ is associated with the inhomogeneous arrangement of the rGO layers. The absence of graphite reflections at (101) and (004) for GO and rGO is associated with the longitudinal displacement of the carbon layers relative to each other (turbostratic structure). The peak (100) is preserved and almost does not change its position in all samples, since it is formed by diffraction on parallel rows of carbon atoms within one layer.
Therefore, XRD allows identifying graphene derivatives, and the (002) reflection (its position and width) is characteristic for its various forms. Based on the observed decrease in the intensity and broadening of the (002) reflection, the structure order decreases in the graphite–GO–rGO series, which, in turn, is due to the distortion of the mutual arrangement of the carbon layers.
2.1.3. TGA
The thermal properties of graphene derivatives in oxidizing (air) and inert (argon) media were studied by thermogravimetric analysis. Figure 2 shows thermogravimetric curves (a) and corresponding DSC profiles (b). Pristine graphite exhibits the highest thermal stability, and weight loss occurs only in an oxidizing medium at temperatures above 700 °C (combustion process).
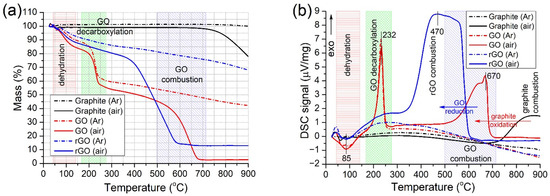
Figure 2.
TG curves (a) and DSC profiles (b) of graphite, GO, and rGO samples in air and argon atmospheres.
The synthesized GO sample is characterized by three stages of weight loss in an air atmosphere. A 10–15 wt.% weight loss below 145 °C with an inflection point at 85 °C is attributed to endothermic dehydration. A further intensive weight loss of ~28 wt.% indicates an exothermic decarboxylation process (removal of labile carboxyl and carbonyl groups) between 165 and 275 °C, with an inflection point at 232 °C [43]. Decarboxylation is a characteristic process for graphene oxide and is retained when the sample is heated in both oxidizing and inert media [44]. The final gradual weight loss stage is an exothermic combustion observed in the range from 500 to 710 °C.
When GO is reduced to rGO, the stage of weight loss associated with the decarboxylation disappears due to the reduction of carboxyl and carbonyl groups. Moreover, the weight loss attributed to dehydration decreases to 7–11 wt.%. These facts denote a more hydrophobic character of rGO due to a much lower number of polar functional groups. The rGO combustion temperature region shifts toward a lower temperature range of 350–600 °C. It is noteworthy that a gradual weak mass decrease above 300 °C accompanied by an endothermic effect is observed in an argon atmosphere for GO and rGO, which may be associated with the removal of stable oxygenated moieties [43].
Thus, TGA, as XRD, is a method of identifying various graphene derivatives by the presence/absence of certain steps of weight loss and their temperature regions. Knowing the thermal properties of certain forms of graphene is also necessary to understand their applicability in various processes in order to avoid material destruction and loss of required properties. A greater shift in the combustion temperature toward lower values occurs in the graphite–GO–rGO series. The revealed pattern is consistent with the XRD results: a decrease in the ordering and a more defective structure of carbon layers favor a more developed contact with the oxidizing medium and a lower temperature of oxidation.
2.2. Characterization of Catalysts
2.2.1. XRD
The phase composition of the silver- and/or ceria-containing catalysts prepared based on GO was studied by powder X-ray diffraction. Figure 3 shows the XRD patterns of the samples in the range of diffraction angles 2θ from 5° to 70°. For Ag/GO and Ag-CeO2/GO catalysts, the reflections with maxima at 38.1°, 44.3°, and 64.4° 2θ correspond to the face-centered cubic (fcc) lattice of the metallic silver phase (PDF 01-071-6549): d111 = 2.36 Å, d200 = 2.04 Å, and d220 = 1.44 Å, respectively. In addition, the CeO2/GO and Ag-CeO2/GO samples feature reflections at 28.5°, 33.0°, 47.3°, and 56.2° 2θ, corresponding to a fluorite-type cubic lattice of the cerium (IV) oxide phase (PDF 01-079-6885): d111 = 3.12 Å, d200 = 2.71 Å, d220 = 1.92 Å, and d311 = 1.63 Å, respectively. The impurity phase of graphite in the catalysts is characterized by the presence of a reflection at 26.4° 2θ. Thus, as a result of the preparation of catalysts, the required phase composition of the active components is achieved.
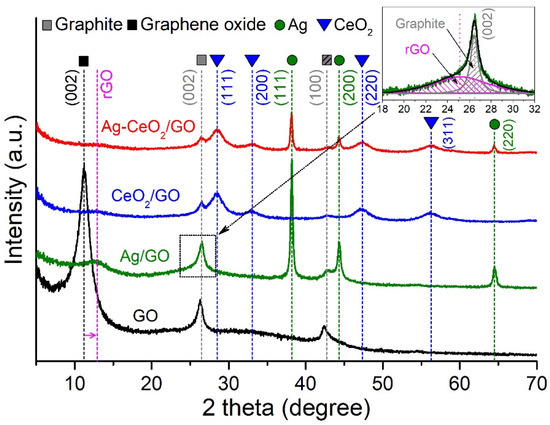
Figure 3.
XRD patterns of the synthesized catalysts.
When Ag and CeO2 are deposited on GO, the characteristic reflection (002) of the latter at ~11° 2θ disappears turning into a weakly intense peak at ~13° 2θ. Deconvolution of the peak at 26.4° 2θ for the Ag/GO catalyst (insertion in Figure 4) also shows the presence of a second low-intensity peak with a maximum at ~25° 2θ. The observed peaks are similar to those for the rGO sample (Figure 1) and belong to the GO layers of different reduction degrees, which, in turn, may indicate the process of GO partial reduction as a result of the synthesis of supported catalysts. Similar peaks are observed in [37] for silver- and/or ceria-containing catalysts. A substantial intensity decrease in these peaks with the active components’ mass increasing is associated with the wedging action of Ag and CeO2 nanoparticles on the carbon layers and their distortion, which leads to greater inhomogeneity of the interlayer space [45].
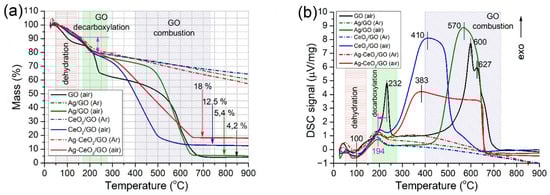
Figure 4.
TG curves (a) and DSC profiles (b) of the GO-based catalysts in air and argon atmospheres.
Table 2 shows the data of particle size calculations for the synthesized support and catalyst samples. Based on the calculation of the (002) reflection for GO, it can be concluded that the carbon layers are organized in “stacks” with an average thickness of 5.0 nm, which is ~6–7 layers of graphene. In the catalysts, CeO2 particles are stabilized in a highly dispersed state in the CeO2/GO and Ag-CeO2/GO samples: 5.0 and 5.3 nm, respectively. In contrast, according to XRD results, the silver particles have an average size of ~30 nm in the Ag-containing catalysts. The larger size of the Ag particles can be due to the weaker adsorption of the silver precursor (Ag+) on the negatively charged deprotonated GO surface than the more charged Ce3+, which leads to nonuniform deposition, low nucleation, and intense crystallite growth. However, the reduction of the silver precursor to the metallic state is possible in the presence of GO at the US treatment stage that also leads to the formation of large particles [46]. At the same time, it is noteworthy that the silver diffraction peaks are broadened at the base, which may indicate the presence of smaller silver particles in the samples. Thus, the presence of small Ag NPs with sizes of a few nanometers in the sample is possible.
Table 2.
Results of XRD calculations for the synthesized samples.
2.2.2. XPS
The elemental composition of the synthesized catalysts and graphene derivatives was investigated by X-ray photoelectron spectroscopy with recording of the survey XPS spectra. The analysis data are summarized in Table 3. GO possesses abundant oxygenated moieties, and the C:O atomic ratio equals 2.75. Deconvolution of the C 1s region high-resolution XPS spectrum of GO (Figure S2a) demonstrates diverse carbon chemical states: basal carbon C=C (284.1 eV) and C–C (284.8 eV), epoxy C–O–C (286.6 eV), carbonyl C=O (288.1 eV), carboxyl O–C=O (288.9 eV) groups, and π → π* satellite (290.9 eV) [47,48]. When the GO material undergoes reduction by NaBH4, the C:O atomic ratio substantially decreases to 6.57 in the obtained rGO. A significant decrease in the total signal of the oxygenated carbon moieties from 61 to 23 at.% (the whole C 1s region signal is 100 at.%) and a corresponding increase in the total signal of the unoxidized carbon species from 36 to 75 at.% are observed in the rGO C 1s region (Figure S2b and Table S1). In addition, the peak maxima of epoxy and carboxyl groups in the rGO sample shift to 286.2 and 288.5 eV, respectively, which is attributed to the carbonyl and hydroxyl groups’ contribution to the signals. These facts indicate reduction of labile functional groups observed by XRD (Figure 1) and TGA (Figure 2) and the retaining of residual oxygenated moieties that cannot be removed without damaging the basal carbon plane. The synthesized catalysts are characterized by a number of C 1s peaks attributed to basal carbon C=C/C–C (284.6 eV), hydroxyl C–OH (285.5 eV), epoxy C–O–C (286.8 eV), carboxyl O–C=O (288.5 eV) groups, and π → π* satellite (291.0 eV) (Figure S2c–e). The total signal of the oxygenated carbon moieties between 34 and 40 at.% (Table S1) certainly indicates an intermediate state of the support between GO and rGO observed by XRD (Figure 3). In addition, the distinguishable signal of hydroxyl groups in the catalysts may be due to the unzipping of epoxy groups and bonding of the formed hydroxyl groups to the deposited active components. In addition, the N 1s signal can be associated with adsorbed or chemically bonded nitrogen species as a result of NH3 (aq.) use as a precipitant during catalyst synthesis.
Table 3.
Elemental composition of the samples according to survey XPS spectra.
The Ce 3d percentage of 0.67 and 0.66 at.% corresponds to ~8.4 and ~8.0 wt.% of the deposited CeO2 in the CeO2/GO and Ag-CeO2/GO catalysts, respectively. The obtained values mostly correlate with the calculated amount of ceria (10 wt.%) in the catalysts. With regard to the Ag 3d percentage, there is a significant difference in the values. The Ag 3d percentage of 0.35 and 0.60 at.% corresponds to ~2.9 and ~4.6 wt.% of the deposited Ag in the Ag/GO and Ag-CeO2/GO catalysts, respectively. The Ag amount in the Ag-CeO2/GO sample mostly correlates with the calculated one (5 wt.%) in contrast to that in the Ag/GO sample. These facts may be due to weaker adsorption of the Ag+ precursor on the GO surface in comparison with Ce3+. This results in a lower Ag amount in the Ag/GO sample and also a larger size of Ag particles than those of CeO2 in the CeO2/GO and Ag-CeO2/GO samples observed by XRD. However, in the presence of CeO2, the silver content in the Ag-CeO2/GO sample is close to the theoretical one. Therefore, CeO2 is a GO-modifying component, and the ceria surface acts as a nucleation center for silver particles upon the co-deposition of Ag and CeO2 precursors. In addition, increased Ag 3d signal can be also associated with presence of Ag species smaller than 30 nm detected by XRD on the Ag-CeO2/GO surface. XPS allows detecting photoelectrons emitted only from thin surface layer of 3–15 nm thick, and core atoms of large Ag particles do not contribute to XPS signal. More dispersed Ag species on the contrary may lead to enhanced and quantitative Ag 3d photoelectron yield.
To distinguish the Ag state in the Ag-containing catalysts, the Ag 3d and Ag MNN Auger regions were analyzed by recording high-resolution XPS spectra (Figure S3). The Auger parameters (AP) were calculated as:
where Ag 3d5/2 BE is the binding energy of the Ag 3d5/2 peak and Ag M5N45N45 KE and Ag M4N45N45 KE are kinetic energies of Auger electrons. The obtained AP values (718.4 and 720.3 eV for Ag/GO, 718.6 and 720.5 eV for Ag-CeO2/GO) and AP’ values (724.3 and 726.0 eV for Ag/GO, 723.4 and 726.3 eV for Ag-CeO2/GO) indicate the presence of both Ag(I) and Ag0 species, respectively [49]. It is noteworthy that the contribution of the Ag0 signal to the Ag MNN Auger region decreases from Ag/GO to Ag-CeO2/GO, which can be associated with a stronger junction between Ag and CeO2 than the one between Ag and GO. The strong junction between Ag and CeO2 is also facilitated by the redox reaction between the co-precipitated Ag+ and Ce3+ precursors at the synthesis stage.
Thus, the structure of the support undergoes changes during the preparation of Ag- and/or CeO2-containing catalysts. Stabilizing properties of ceria were revealed: a quantitative Ag deposition is observed during the co-deposition of silver and cerium oxide due to a stronger interaction with CeO2 than with GO, which contributes to an increase in the active metal surface and particle dispersion and a developed Ag-CeO2 interface.
2.2.3. TGA
The thermal stability of the synthesized catalysts was studied by thermogravimetric analysis. Figure 4 shows the TG (a) and DSC (b) data in the temperature range of 25–900 °C. Unlike the pristine support, the weight loss attributed to the dehydration decreases from 15 to 7–10 wt.% below 145 ℃ for the catalysts. Despite similar drying conditions, the amount of adsorbed water reduces, which indicates a more hydrophobic character of the catalysts. For all catalyst samples (in both oxidizing and inert atmospheres), a weight loss associated with the decarboxylation process is observed from 90 to 80 wt.%, and the maximum of the process shifts from 232 to 194 °C (Figure 4b). First, the smaller weight loss also indicates partial reduction of GO during the synthesis of catalysts observed by XPS (the support has an intermediate state between GO and rGO). The lower number of oxidized moieties is consistent with the decreased amount of adsorbed water in the catalysts in contrast to pristine GO. Second, the wedging action of Ag and CeO2 nanoparticles reduces thermal stability due to the increase in structure defectiveness. These data are consistent with XRD results.
The amount of applied active components can be also estimated by the value of the residual mass in the air environment (Figure 4a). For the CeO2/GO and Ag-CeO2/GO catalysts, the residual masses are 12.5 and 18 wt.%, respectively, which is close to the corresponding calculated values of 10 and 15 wt.% and indicates the quantitative deposition of the active components. A slight increase in the experimental values can be associated with the presence of a graphite phase in the support, which exhibits high thermal stability (even in an oxidizing environment; Figure 2a). For the Ag/GO sample, the residual mass is 5.4 wt.%, which is slightly higher than that for the GO sample (4.2 wt.%). This may indicate that most of the residual mass is the graphite phase, while the silver content is substantially less than the expected 5 wt.%. These data correlate with XPS results.
The ceria-containing catalysts exhibit a significant shift in the combustion region of the support to lower temperatures of up to 250–650 °C (Figure 4b). The catalysis of GO combustion by CeO2 particles is due to the oxidative activity of the lattice oxygen of the cerium oxide structure (due to the Ce4+/Ce3+ redox transition), the high mobility of oxygen vacancies in the re-oxidation cycle of Ce3+ to Ce4+ with a molecular oxygen [17], and the developed contact with GO. A shift in the GO combustion temperature is observed for the Ag/GO catalyst, which also indicates the catalytic role of Ag in graphene oxidation. Thus, the active components contribute to low-temperature GO combustion in an oxidizing medium due to both increased defectiveness of the GO structure and the catalytic role of Ag and CeO2.
2.2.4. Raman Spectroscopy
Raman spectroscopy was performed to study the state of carbon layers of the support in the synthesized samples (Figure S4). All samples exhibit intense G and D bands, with maxima at 1600 and 1355 cm−1 that are attributed to the E2g symmetry stretching vibrations of the graphite-like sp2-hybridized carbon and the A1g symmetry stretching vibrations of carbon layers, respectively [50]. In addition, the samples are characterized by the bands of the second-order (or double resonance) two-phonon vibration modes [51] 2D, D+G, and 2D’ with maxima at 2700, 2930, and 3195 cm−1, respectively.
The D band at ~1350 cm−1 is Raman-inactive for pristine graphene but can be observed where the symmetry is broken by the carbon matrix defects [52]. Therefore, the relative intensity (peak area) of the Raman D and G bands serves for a quantitative assessment of the structure defectiveness of GO in the samples. As can be seen from the intensity ratio ID/IG represented in Figure S4, the samples possess a high degree of structural defects of the graphene layers. The number of defects increases from GO (ID/IG = 1.50) to rGO (ID/IG = 1.57). At the same time, for the supported catalysts, the ID/IG ratio is higher than the one for pristine GO or rGO: ID/IG (Ag/GO) = 1.63, ID/IG (CeO2/GO) = 1.70, ID/IG (Ag-CeO2/GO) = 1.68. Thus, according to Raman results, the increase in the number of defects in the support structure is associated with both the reduction of GO and the bonding of Ag and CeO2 nanoparticles with the support.
2.2.5. UV–VIS Spectrometry
The optical properties of the synthesized catalysts and support were studied by electron (UV–VIS) spectrometry. Figure 5a shows the absorption spectra of aqueous suspensions of silver- and/or ceria-containing catalysts and graphene derivatives (GO and rGO) prepared by the US-mediated suspending of the sample for 15 min (sample concentration in the suspension is 0.75 g/L). The spectrum for the GO suspension is characterized by an intensive absorption peak, with a maximum at 226 nm and a shoulder at 304 nm, which correspond to the π → π* electron transition of the C=C bonds and to the n → π* transition of the C=O bonds, respectively [53]. When GO is reduced to rGO, the maximum of the π → π* transition shifts from 226 to 257 nm, and the band related to the n → π* transition disappears [34]. Hence, a decrease in the GO oxidation state leads to the band gap shrinking (π → π* transition) [35,36].
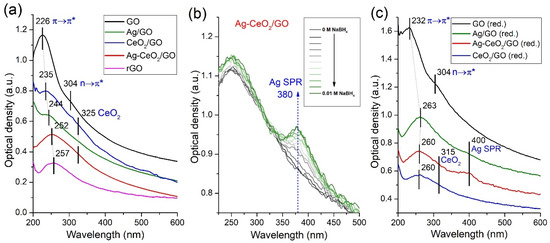
Figure 5.
UV–VIS spectra of aqueous suspensions of graphene derivatives and catalysts (C(sample) = 0.75 g/L) (a); absorption spectra evolution of the Ag-CeO2/GO suspension with increasing NaBH4 concentration (b); and UV–VIS spectra of aqueous suspensions of graphene derivatives and catalysts (C(sample) = 0.15 g/L) pre-reduced in 0.01 M NaBH4 in the presence of US for 15 min (c).
A shift of the π → π* transition maximum to 235, 244, and 252 nm is also observed for CeO2/GO, Ag/GO, and Ag-CeO2/GO, respectively. The maximal values are intermediate between those for GO and rGO, indicating a partial reduction of the support, which is consistent with the XRD, XPS, and TGA results. A slight broadening of the peak with a shoulder at ~325 nm indicates the absorption by CeO2 particles for the CeO2/GO and Ag-CeO2/GO samples [45].
The Ag-CeO2/GO sample was used to study the change in the catalyst state in a reducing medium in which the catalytic experiment took place. The absorption spectra for the Ag-CeO2/GO suspension were recorded with a uniform NaBH4 dosage once every 3 min with constant stirring in the cell (Figure 5b). With an increase in the reducing agent concentration to ~0.01 M, the position of the maximum of the π → π* transition remains almost intact. At the same time, the appearance and intensity growth of the absorption peak with a maximum at ~380 nm is observed, which is attributed to silver surface plasmon resonance absorption (Ag SPR) [26,54]. Hence, in the as-prepared silver-containing samples, there are both the metallic state of silver recorded by XRD and also the surface-oxidized Ag species (AgOx) recorded by XPS, which will be reduced to a metallic state under reductive conditions during the catalytic process.
Optical properties were also studied for the pre-reduced sample suspensions prepared by the optimized pre-reduction procedure (the US-mediated suspending of samples in 0.01 M NaBH4 solution for 15 min; Figure S6). Figure 5c shows the UV–VIS spectra for the pre-reduced suspensions. The pre-reduced suspensions are distinguished by sedimentation stability and high optical density with a lower sample amount in the suspension (C(sample) = 0.15 g/L), which indicates better dispersion under the combined action of US treatment and the reducing agent. Insignificant changes in the GO (red.) spectrum are observed (a small shift of the maximum from 226 to 232 nm) due to the denser carbon structure that is partially accessible for reduction.
The spectra for the catalysts feature a close position of the maxima of the π → π* transition at 260 nm, indicating support reduction in the presence of Ag and CeO2 (reductant spillover) or due to the higher defectiveness that was shown by XRD and TG-DSC. In addition, for the Ag-CeO2/GO (red.) sample, the Ag SPR absorption band is observed at 400 nm, while this band is quite low-intensive for the Ag/GO (red.) sample. This can be caused by a low Ag content in the Ag/GO (red.) catalyst, which is consistent with the XPS and TGA data. The difference in the SPR maxima position for the Ag-CeO2/GO catalyst after reduction (400 nm) and during reduction (380 nm) is due to the fact that the SPR absorption band position is affected by the dielectric constant of the medium. There is intensive sorption of the nucleophilic reducing agent (NaBH4) on the silver particle surface, followed by electron injection on the surface during the reduction of the AgOx species. As a result of enhanced electron density on the Ag particles, a blue shift of SPR absorption occurs [16]. In the spectra obtained after the suspension reduction, the SPR maximum has a characteristic position at 400 nm due to equalization of the excess electron density in the system after the reduction process and consumption of the reducing agent.
Thus, the study of optical properties allows judging on the oxidation state of graphene derivatives as well as the electrically conductive properties of the support by the value of the band gap (the position of the maximum of the π → π* transition). The UV–VIS spectra make it possible to identify the Ag state in the silver-containing catalysts: oxidized Ag species occur and will be reduced to a metallic state during the catalysis process. Moreover, the presence or absence of silver particles in a particular system can be concluded according to the SPR absorption band provided by a sufficient amount of a reducing agent.
2.3. Catalytic Experiment
The catalytic properties of the synthesized silver- and/or ceria-containing catalysts were studied in 4-NP’s reduction to 4-AP with sodium borohydride NaBH4 in an aqueous medium at room temperature and ambient pressure (Figure 6).
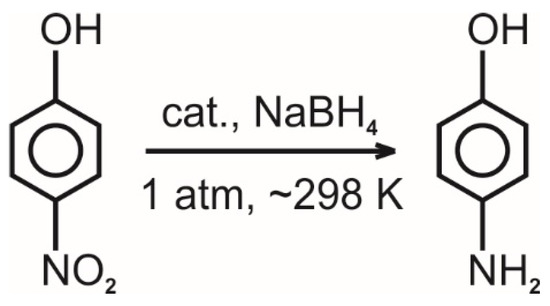
Figure 6.
Schematic representation of the studied catalytic reaction.
The reaction was monitored using the UV-vis spectrometry of the solution in which the reaction proceeds (features of the experiment are presented in the Supplementary Materials). The intensity of the absorption peak of 4-NP at 400 nm decreases and a new peak of 4-AP absorption appears at 300 nm (Figure S5) during the catalytic reaction.
2.3.1. Activity of As-prepared Catalysts
The kinetic curves of 4-NP reduction for the synthesized samples were obtained (Figure 7a). Introducing the catalyst suspension into the solution containing 4-NP and NaBH4 was considered the reaction start. Despite the possibility of the 4-NP reaction with sodium borohydride in terms of thermodynamics (E0(4-NP/4-AP) = −0.76 V, E0(NaBO2/NaBH4) = −1.33 V), the reaction does not proceed in the absence of a catalyst. The extremely high activation barrier is due to the electrostatic repulsion of the 4-nitrophenolate ion and the BH4− anion [55]. The pristine GO support and the CeO2/GO sample show no catalytic activity in this reaction (black and blue curves in Figure 7a, respectively).
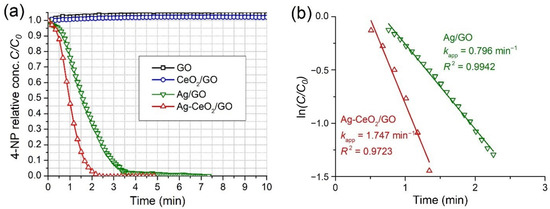
Figure 7.
Kinetic curves of 4-NP reduction over the as-prepared samples (a) and the pseudo-first-order plot of the 4-NP relative concentration logarithm ln(C/C0) versus the reaction time for the Ag/GO and Ag-CeO2/GO catalysts (b). Experimental conditions: C(4-NP) = 7.5 × 10⁻⁵ M, C(NaBH4) = 0.015 M, C(catalyst) = 0.03 g/L, T = 297 K.
Silver-containing samples (Ag/GO and Ag-CeO2/GO) exhibit substantial activity: the complete 4-NP conversion occurs in 4 and 2.5 min, respectively. Thus, the metal particles play a key role in the reduction process. The initial segment of the curves has a smaller slope (induction period) associated with the ongoing reduction of the oxidized silver species by sodium borohydride [16,56,57,58], the presence of which was shown by XPS and UV–VIS spectrometry of the catalyst suspensions (Figure 5b). That is, the surface-oxidized silver species AgOx do not catalyze the reaction, and the active surface for this reaction is the metallic silver surface that gradually increases when the catalyst contacts the reducing medium (the reaction rate increases). The Ag-CeO2/GO catalyst exhibits the highest activity due to the interaction of the co-deposited Ag and CeO2 particles. The stabilization of a larger amount of silver (larger active surface) on the GO support in the presence of CeO2 is consistent with the data on the residual masses in the TGA, XPS, and UV–VIS spectra.
For the Ag/GO and Ag-CeO2/GO samples, the apparent rate constants were calculated within the pseudo-first-order reaction approximation [24] due to the large excess of the reducing agent in the system. The reaction rate depends on the 4-NP concentration according to the equation:
where w is the reaction rate (mol/L·min), kapp is the apparent rate constant (min−1), C is the current 4-NP concentration (mol/L), and C0 is the initial 4-NP concentration (mol/L). The rate constants were determined from the slope on the plot of the 4-NP relative concentration logarithm ln(C/C0) versus the reaction time (Figure 7b). The obtained values of the apparent rate constants are 0.796 and 1.747 min−1 for Ag/GO and Ag-CeO2/GO, respectively. The drafted dependencies have good linear fitting within the framework of this model, which emphasizes the model applicability in this process.
One of the key kinetic parameters characterizing the chemical transformation process is the activation energy value Ea that shows the temperature effect on the reaction rate. To study the temperature effect on the 4-NP reduction rate over the Ag-CeO2/GO catalyst, the catalytic experiments were carried out by varying the temperature from 27 to 40 °C (300–313 K), with other conditions remaining unchanged. Figure 8a shows the plot of the 4-NP relative concentration logarithm ln(C/C0) versus the reaction time at different temperatures. A regular increase in the slope value (pseudo-first-order reaction rate constant) is observed as the temperature increases. The chemical reaction temperature dependence obeys the Arrhenius equation:
where ln(k) is the logarithm of the rate constant, ln(A) is the logarithm of the pre-exponential factor, Ea is the activation energy (kJ/mol), and R is the universal gas constant. The activation energy value was determined from the slope of the Arrhenius plot of (ln(k) versus 1000/T; Figure 8b). The resulting Ea value is 72.9 kJ/mol. For silver-containing catalysts described in the literature, the activation energy of 4-NP reduction varies in the range of 8–42 kJ/mol [59]. However, as shown in [60], the Ea value for this reaction proceeding over the Ag@CeO2 catalyst is 84.7 kJ/mol, which is close to the one obtained in this work. Thus, it can be concluded that the Ea value significantly depends on the composition and structure of the catalysts, and the catalytic reaction proceeding over the Ag-CeO2 system is more sensitive to the temperature changes. In addition, the obtained Ea value is a reliable indicator of the reaction kinetic mode since the diffusion mode has a significantly lower activation energy (or temperature coefficient).
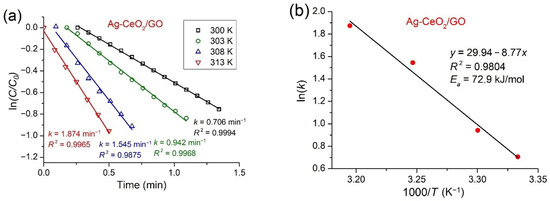
Figure 8.
Plot of the 4-NP relative concentration logarithm ln(C/C0) versus the reaction time at different temperatures (a) and Arrhenius plot of ln(k) versus 1000/T (b) for the Ag-CeO2/GO catalysts. Experimental conditions: C(4-NP) = 7.5 × 10⁻⁵ M, C(NaBH4) = 0.015 M, C(catalyst) = 0.015 g/L.
2.3.2. Pre-Reduced Catalysts
Since the state of the catalyst changes during the reaction (reduction of AgOx surface species), the catalytic properties were also investigated for a series of pre-reduced catalyst samples. The catalyst pre-reduction condition was optimized (see Supplementary Materials) by simultaneous exposure to 0.01 M NaBH4 and ultrasonic (US) treatment for 15 min to obtain catalyst suspensions with superior activity (Figure S6). Catalytic experiments were carried out in a similar manner with the pre-reduced samples. Figure 9a shows kinetic curves for the pre-reduced samples. GO (red.) and CeO2/GO (red.) show no catalytic activity, as well as as-prepared samples. Silver-containing samples (Ag/GO (red.) and Ag-CeO2/GO (red.)) show noticeable activity: complete 4-NP conversion occurs in 2.5 and 1.25 min, respectively. The rate constants were determined from the slope of the pseudo-first-order plot of the 4-NP relative concentration logarithm ln(C/C0) versus the reaction time (Figure 9b). The calculated rate constant values are 1.615 and 3.674 min−1 for Ag/GO (red.) and Ag-CeO2/GO (red.), respectively. Thus, the catalytic activity increases approximately twice for the silver-containing pre-reduced samples in comparison with the as-prepared ones.
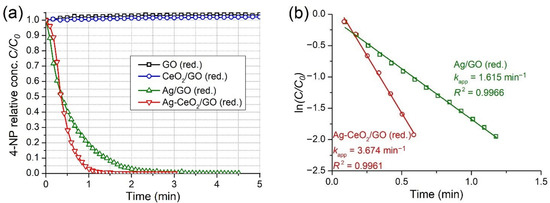
Figure 9.
Kinetic curves of 4-NP reduction over the pre-reduced samples (a) and the pseudo-first-order plot of the 4-NP relative concentration logarithm ln(C/C0) versus the reaction time for the Ag/GO (red.) and Ag-CeO2/GO (red.) catalysts (b). Experimental conditions: C(4-NP) = 7.5 × 10⁻⁵ M, C(NaBH4) = 0.015 M, C(catalyst) = 0.03 g/L, T = 297 K.
The catalyst suspensions feature a high optical density, which was shown by UV–VIS spectrometry (Figure 5c), and sedimentation stability. That is, more efficient catalyst dispersing occurs under the combined action of US treatment and the reducing agent. Hence, the substantial increase in catalytic activity is due to the developed active surface, which is formed with the catalyst particle dispersing: silver particles encapsulated between the GO layers and “stacks” become available for the reagents.
The efficiency of the catalysts obtained in this work was assessed by comparing the activity (reaction rate constants) with the results obtained by other authors for some silver-containing catalysts used in the 4-NP-to-4-AP reduction with NaBH4 under mild conditions (1 atm, ~25 °C). Table 4 summarizes the catalytic data.
Table 4.
Data of catalytic experiments for 4-NP-to-4-AP reduction with NaBH4 at atmospheric pressure and room temperature in an aqueous medium (C(catalyst) is the catalyst concentration in the reaction mixture, and krel is the relative rate constant: krel = kapp/C(catalyst)).
The results show that the synthesized catalysts possess high catalytic activity, which is comparable to that of a number of catalysts for 4-NP reduction and in some cases exceeding it. First, one of the factors of such high activity of Ag-CeO2/GO is the developed active surface accessible for the reaction. In addition, the charged states of the catalyst components at the Ag-CeO2 and Ag-GO interfaces can be favorable for sorption of the 4-nitrophenolate ion and the BH4− anion [55]. Moreover, GO exhibits better sorption properties toward nitroaromatic compounds due to the π–π stacking interaction of the 4-NP aromatic ring with the sp2-hybridized carbon material [37]. In addition, the negative zeta potential of the GO surface promotes the implementation of the “pull-push” mechanism [59]. This implies electrostatic attraction of the electrophilic 4-NP and repulsion of the nucleophilic 4-AP that also affects the more rapid course of the reaction. Therefore, the combination of factors has a positive effect on the Ag-CeO2/GO catalytic activity.
Thus, 4-NP reduction at room temperature and atmospheric pressure in an aqueous medium shows that Ag-CeO2/GO catalysts are promising effective systems in NCs’ reduction into corresponding ACs.
2.3.3. Stability and Leaching Tests
Not only the activity value in a single conversion cycle but also the ability to maintain the required activity over time are important for the practical use of a catalyst. The stability of the as-prepared Ag-CeO2/GO catalyst was evaluated by recording the kinetic data of 4-NP reduction upon a periodic reaction renewal. Figure 10a shows the kinetic curves of the Ag-CeO2/GO sample obtained by dosing the reagents at a certain time interval. The kinetic curves show no inflections at the initial curve segment after the completion of the first conversion cycle, which indicates the reduction of the oxidized silver particle surface. In addition, starting from the fifth cycle, there is a certain increase in the 4-NP complete conversion time up to ~7.5 min for the seventh cycle: the reaction rate slows down from cycle to cycle at conversion values above 50%.
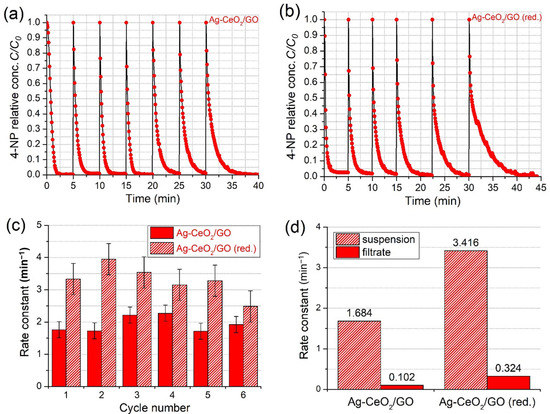
Figure 10.
As-prepared Ag-CeO2/GO (a) and pre-reduced Ag-CeO2/GO (red.) (b) kinetic curves and the corresponding rate constant values of 4-NP reduction consecutive cycles (c); rate constant values of 4-NP reduction with Ag-CeO2/GO and Ag-CeO2/GO (red.) suspensions and their filtrates (d). Experimental conditions: C(4-NP) = 7.5 × 10⁻⁵ M, C(NaBH4) = 0.015 M, C(catalyst) = 0.03 g/L), T = 297 K.
The stability of the pre-reduced Ag-CeO2/GO (red.) catalyst was also studied by recording the kinetic data of 4-NP reduction upon periodic reaction renewal (Figure 10b). Similarly to the as-prepared Ag-CeO2/GO catalyst, there are no inflections at the initial curve segment in each reaction cycle, which indicates complete reduction of the oxidized surface of silver particles in the prepared suspension. Starting from the second cycle, there is a certain increase in the 4-NP complete conversion time up to ~10 min in the sixth cycle. The conversion time increases more dramatically than for the as-prepared Ag-CeO2/GO catalyst from cycle to cycle at conversion values greater than 50%.
The chemical transformation kinetics of NC reduction by NaBH4 proceeds according to the Langmuir–Hinshelwood model [57,58,63]. First, NC and NaBH4 are adsorbed on the active sites of the metallic catalyst surface. NaBH4 undergoes the hydrolysis process in the presence of the catalyst via B–H bond cleavage, followed by adsorbed atomic hydrogen formation and electron injection into the metal particle [76]. Next, the active hydrogen species interact with the nitro group in the NC molecule, and the reaction proceeds until the reduction is completed by 4-AP desorption. The excessive electrons formed on the metal particle can also reduce the nitro group regarding the electron transfer process from the particle to the adsorbed substrate [77]. However, the hydrogen evolution reaction is a competitive process caused by the high coverage of the metal surface with the active hydrogen species and excessive electron density, which proceeds according to either the Heyrovsky or the Tafel model [67]. The hydrogen evolution has a higher rate in contrast to 4-NP reduction, which implies intensive NaBH4 conversion and accumulation of hydrolysis products. As shown in Figure S6, prolonged contact of the catalyst with NaBH4 solution of a high concentration leads to a substantial reaction rate decrease. Hence, the competitive sorption of 4-NP and NaBH4 hydrolysis products deactivates/passivates the catalyst occupying the sorption sites on the active surface. This causes the reaction rate to slow down from cycle to cycle at conversion values greater than 50% and the conversion time to increase for the target reaction. Moreover, since the pre-reduced catalyst possesses higher activity, the NaBH4 conversion and accumulation of hydrolysis products are more intensive. Thus, greater competitive sorption of 4-NP and conversion products and catalyst deactivation/passivation occur, resulting in a dramatic increase in conversion time from cycle to cycle for the pre-reduced catalyst.
Figure 10c shows a bar chart for the apparent rate constants, kapp, obtained in 4-NP reduction cycles on the as-prepared Ag-CeO2/GO and pre-reduced Ag-CeO2/GO (red.) catalysts, which are calculated within the pseudo-first-order approximation at conversion values less than 50%. The catalysts show good stability, maintaining stable activity, i.e., kapp of ~1.7 min−1 over six conversion cycles and kapp of ~3.25 min−1 over five conversion cycles. A slight increase in the rate constants for Ag-CeO2/GO in the third and fourth cycles and Ag-CeO2/GO (red.) in the second cycle may be associated with a deeper reduction of the oxidized silver surface after a certain time, which leads to the active surface and, consequently, the reaction rate increasing.
Since the 4-NP reduction reaction occurs in the solution, active component leaching can take place. The degree of the active component loss can affect catalyst reusage. The leaching of active components was studied, with the 4-NP reduction catalyzed by either freshly prepared Ag-CeO2/GO and Ag-CeO2/GO (red.) suspensions or solutions obtained by the suspension filtration. Figure 10d shows a bar chart of the apparent rate constants kapp for 4-NP reduction catalyzed by both the as-prepared Ag-CeO2/GO and pre-reduced Ag-CeO2/GO (red.) catalyst suspensions and their filtrates. According to the data, only ~6 and 9.5% of the Ag-CeO2/GO and Ag-CeO2/GO (red.) catalyst activities come from the leached species of the active component. Thus, the Ag-CeO2/GO catalysts demonstrate both significant catalytic stability and a low leaching degree of the active components. The Ag-CeO2/GO catalysts are effective systems for NCs’ reduction into corresponding ACs.
3. Materials and Methods
3.1. Synthesis of Graphene Oxide
Graphene oxide (GO) is synthesized by oxidative treatment of graphite according to the modified Hummers method [78]. The features of the GO synthesis are presented in the Supplementary Materials. The final product was dried under vacuum for 48 h at 60 °C to obtain graphene oxide (GO).
Reduced graphene oxide (rGO) was prepared from the synthesized GO and was used as a reference sample. Briefly, 1 g of GO was suspended in 500 mL of water, and 10 g of solid NaBH4 powder was added. The resulting mixture was constantly stirred for 24 h at 100 °C. Next, the mixture was filtered under vacuum, and the precipitate was washed with distilled water. The final product was dried under vacuum for 48 h at 60 °C.
3.2. Synthesis of Catalysts
Silver- and/or ceria-containing catalysts were synthesized by the deposition-precipitation method. To prepare 1 g of the catalyst, a certain mass of GO was introduced into 50 mL of water and subjected to ultrasonic (US) treatment for 10 min at room temperature (frequency = 40 kHz, power = 50 W). A 25% ammonia solution was added dropwise to the resulting suspension to shift the pH from 1 to 4–5. Next, the precursors of active components (m(AgNO3) = 0.0787 g and/or m(Ce(NO3)3·6H2O) = 0.2524 g) were added, and the mixture was stirred for 10 min. After that, a precipitant (25% ammonia solution) was slowly added to a suspension to a pH of ~10. The resulting mixture was hydrothermally treated for 1 h at 95 °C in a Teflon autoclave. Further, the precipitate was dried in an air atmosphere for 4 h at 50 °C and then dried under vacuum for 48 h at 60 °C. The calculated amounts of silver and cerium (IV) oxide in the obtained samples were 5 and 10 wt.%, respectively. The samples were named as Ag/GO (ω(Ag) = 5 wt.%), CeO2/GO (ω(CeO2) = 10 wt.%), and Ag-CeO2/GO (ω(Ag) = 5 wt.%, ω(CeO2) = 10 wt.%).
3.3. Characterization of Samples
The porous structure of the samples was characterized by low-temperature nitrogen adsorption-desorption at –196 °C (77 K) with a 3Flex automatic gas sorption analyzer (Micromeritics, Norcross, GA, USA). The specific surface area was determined using the multipoint BET method by analyzing the adsorption isotherm in the P/Po range from 0.05 to 0.20. To plot the size distribution of mesopores, the BJH-adsorption method was used with the analysis of the adsorption branch of the nitrogen adsorption-desorption isotherms. The Horvath–Kawazoe method was used to construct the size distribution of micropores. Before the measurements, 20–25 mg of the milled samples was degassed under vacuum at 200 °C for 2 h.
The phase composition of the support and catalysts was studied by powder X-ray diffraction (XRD). XRD data were obtained using a MiniFlex 600 diffractometer (Rigaku, Tokyo, Japan) with CuKα radiation (λ = 1.5418 Å) in the 2θ diffraction angle range from 5° to 70° with a recording rate of 2°/min and a step of 0.02°. The particle size was calculated according to the Scherrer equation:
where D is the average particle size, K is the Scherrer constant (0.89), λ is the X-ray radiation wavelength, β is the full width at half maximum (FWHM), and θ is the scattering angle (diffraction peak maximum). From the Scherrer equation, the number of GO layers was calculated using the equation:
where N is the number of GO layers, D002 is the thickness of the GO crystallite, and d002 is the GO interlayer distance.
The elemental composition and surface chemical state of the samples were analyzed by X-ray photoelectron spectroscopy (XPS) using the K-Alpha Nexsa superhigh-vacuum X-ray photoelectron spectrometer (Thermo Fisher Scientific, Waltham, MA, USA). The survey and high-resolution XPS spectra of a 200-μm2 surface region were recorded with AlKα radiation (1486.74 eV) as the X-ray source and a pass energy of 200 (a step of 1 eV) and 50 (a step of 0.1 eV) eV, respectively. The base pressure in the analysis chamber was 10−9 mbar. A flood gun was used for charge compensation. The obtained spectra were analyzed using Avantage Thermo Fisher and Casa XPS software.
The thermal properties of the samples were investigated by thermogravimetric analysis (TGA) in TG-DSC mode with mass spectra detection. The survey was carried out using the STA 449 F1 Jupiter instrument with a QMS 403 D Aeolos mass spectrometer (Netzsch, Selb, Germany) in an oxidizing (air) or an inert (argon) atmosphere in a temperature range from 25 to 900 °C with a heating rate of 10 °C/min.
The structure state of the carbon matrix in the support and catalysts was studied by Raman spectroscopy using an inVia Raman confocal microscope (Renishaw, Wotton-Under-Edge, UK) under standard conditions with monochromatic excitation radiation at a wavelength of 532 nm.
The optical properties of the samples were investigated by electron (UV–VIS) spectrometry. The UV–VIS absorption spectra of the aqueous suspensions of the samples were recorded on a CM 2203 spectrofluorometer (SOLAR, Minsk, Belarus) in an in situ cell equipped with a quartz cuvette (10 mm optical path), a magnetic stirrer, and a thermostat, in a wavelength range of 200–600 nm. The suspensions were prepared by suspending the sample in distilled water using US treatment (frequency = 40 kHz, power = 50 W) for 15 min.
3.4. Catalytic Experiments
The catalytic properties of the synthesized samples were studied in 4-NP-to-4-AP reduction with sodium borohydride NaBH4 at room temperature (~25 °C) and atmospheric pressure in an aqueous medium. The reaction was carried out in an in situ cell of the Solar CM 2203 spectrofluorometer equipped with a quartz cuvette (10 mm optical path), a magnetic stirrer, and a thermostat. Briefly, 1.25 mL of 1.5 × 10⁻⁵ M 4-NP solution and 0.75 mL of freshly prepared 0.05 M NaBH4 solution were sequentially introduced into the cuvette (molar ratio 4-NP:NaBH4 = 1:200). Next, a certain volume of water required to reach a total reaction mixture volume of 2.5 mL and 100 μL of 0.75 g/L catalyst suspension were added to the mixture. The catalyst suspension was prepared by suspending 3.75 mg of the sample in 5 mL of distilled water using US treatment (frequency = 40 kHz, power = 50 W) for 15 min. The final concentrations of the components in the initial reaction mixture were 7.5 × 10⁻⁵ M for 4-NP, 0.015 M for NaBH4, and 0.03 g/L for the catalyst. The reaction was monitored by recording the absorption spectra of the resulting solution in a wavelength range of 200–600 nm. Kinetic data were obtained by spectrophotometric measurement of the optical density of the solution at a wavelength of 400 nm (absorption peak of the 4-nitrophenolate ion) with a frequency of 5 s and with constant stirring at 600 rpm and constant temperature. The catalyst addition into the reaction mixture containing 4-NP and NaBH4 was considered the reaction start. The stability test of the catalysts was carried out by recording kinetic data upon a periodic renewal of the reagents in the solution by dosing 100 μL of a solution containing 2.25 × 10⁻³ M 4-NP and 0.225 M NaBH4 with a certain time interval.
4. Conclusions
To sum up, graphene oxide (GO) was synthesized by the oxidative treatment of graphite according to the modified Hummers method. The synthesized support had a micro-mesoporous structure (pore volume of 0.1 cm3/g) with an average micropore size of 0.45 nm and a mesopore size of 5.23 nm, as well as a developed specific surface area of 54.6 m2/g with the main contribution of micropores (46 m2/g). The structure was represented by microporous aggregates of folded turbostratic carbon layers (“stacks”) 5 nm thick that were separated by mesopores.
The synthesis of silver- and/or ceria-containing catalysts based on GO was carried out by the deposition-precipitation method. The applied synthesis approaches allowed obtaining nanosized Ag and CeO2 particles with sizes up to 30 and 5 nm in the GO structure. The particles were bonded to the carbon matrix and distorted/wedged GO. The GO matrix was partially reduced in the catalysts. The co-deposition of silver and cerium (IV) oxide onto graphene oxide was revealed to promote stabilization of a larger silver amount on the support and/or increase the Ag particle dispersion due to the stronger interaction of silver with CeO2. The ceria surface acted as a nucleation center for Ag particles. The strong bonding of Ag and CeO2 was also facilitated by the redox reaction between the precipitated Ag+ and Ce3+ precursors at the synthesis stage.
The 4-nitrophenol (4-NP)-to-4-aminophenol (4-AP) reduction with sodium borohydride (NaBH4) in an aqueous medium at atmospheric pressure and room temperature was investigated. The reaction was catalyzed by silver particles featuring a metallic surface state. NaBH4 played a double role in this process: the reduction of the oxidized silver species AgOx on the particle surface and 4-NP reduction. The Ag-CeO2/GO catalyst demonstrated the highest activity in the synthesized series of catalysts that was due to the larger active surface in the presence of CeO2 as a modifying agent. The catalytic activity increased for the pre-reduced catalysts prepared by US-mediated reductive treatment due to better dispersion of the catalyst in the suspension and a larger active surface of the freshly reduced metallic silver. The Ag-CeO2/GO catalyst retained good stability in the 4-NP reduction reaction upon periodic reaction renewal and a low leaching degree of active components in the solution.
Thus, the combination of high activity and stability makes Ag-CeO2/GO catalysts effective systems for the reduction of nitroaromatic compounds into their corresponding aromatic amines.
Supplementary Materials
The following supporting information can be downloaded at: https://www.mdpi.com/article/10.3390/catal12111393/s1, the detailed synthesis of graphene oxide [78]; Figure S1: N2 adsorption-desorption isotherms (a) and pore size distribution (b) for graphite and GO samples; Figure S2: C 1s region high-resolution XPS spectra of the synthesized catalysts and graphene derivatives: GO (a), rGO (b), Ag/GO (c), CeO2/GO (d), and Ag-CeO2/GO (e); Figure S3: Ag 3d region high-resolution XPS spectra of the Ag/GO (a) and Ag-CeO2/GO (c) catalysts and the corresponding Ag MNN Auger region spectra of the Ag/GO (b) and Ag-CeO2/GO (d) catalysts; Figure S4: Raman spectra of silver- and/or ceria-containing catalysts and graphene derivatives with an excitation wavelength of 532 nm [51]; Figure S5: 4-NP light absorption peak shift upon NaBH4 addition (a) and UV–VIS spectra evolution of the working solution during the 4-NP reduction reaction (b) [24]; Figure S6: Kinetic curves (a) and the pseudo-first-order plot of the 4-NP relative concentration logarithm ln(C/C0) versus the reaction time (b) for the Ag-CeO2/GO catalyst under various pre-reduction conditions; Table S1: Contribution of carbon chemical states calculated according to the C 1s region high-resolution XPS spectra.
Author Contributions
A.T.: methodology, investigation, writing—original draft preparation, and visualization; E.K.: investigation and visualization; G.M.: conceptualization, methodology, resources, writing—review and editing, supervision, project administration, and funding acquisition. All authors have read and agreed to the published version of the manuscript.
Funding
This research was funded by the Grant of the President of the Russian Federation (grant no. MK-460.2021.1.3).
Data Availability Statement
Not applicable.
Acknowledgments
The authors thank Valery Svetlichnyi (Tomsk State University) for Raman studies and the Central Laboratories of Tomsk Polytechnic University (Analytical Center) for XPS studies. The authors also thank Mikhail Salaev (Tomsk State University) for language review.
Conflicts of Interest
The authors declare no conflict of interest.
References
- Ju, K.-S.; Parales, R.E. Nitroaromatic Compounds, from Synthesis to Biodegradation. Microbiol. Mol. Biol. Rev. 2010, 74, 250–272. [Google Scholar] [CrossRef] [PubMed]
- Singh, D.; Mishra, K.; Ramanthan, G. Bioremediation of Nitroaromatic Compounds. In Wastewater Treatment Engineering; Samer, M., Ed.; IntechOpen: London, UK, 2015; pp. 51–83. [Google Scholar] [CrossRef]
- Králik, M.; Turáková, M.; Mačák, I.; Lehocký, P. Aniline-catalysis and chemical engineering. In Proceedings of the 41st International Conference of Slovak Society of Chemical Engineering, Tatranské Matliare, Slovakia, 26–30 May 2014; pp. 723–733. [Google Scholar]
- Saha, B.; De, S.; Dutta, S. Recent Advancements of Replacing Existing Aniline Production Process with Environmentally Friendly One-Pot Process: An Overview. Crit. Rev. Env. Sci. Technol. 2013, 43, 84–120. [Google Scholar] [CrossRef]
- Couto, C.S.; Madeira, L.M.; Nunes, C.P.; Araújo, P. Commercial Catalysts Screening for Liquid Phase Nitrobenzene Hydrogenation. Appl. Catal. A: Gen. 2016, 522, 152–164. [Google Scholar] [CrossRef]
- Fishbein, L. Aromatic Amines. In Anthropogenic Compounds. The Handbook of Environmental Chemistry; Hutzinger, O., Ed.; Springer: Berlin/Heidelberg, Germany, 1984; Volume 3/3C. [Google Scholar] [CrossRef]
- Samer, M. Biological and Chemical Wastewater Treatment Processes. In Wastewater Treatment Engineering; Samer, M., Ed.; IntechOpen: London, UK, 2015; pp. 1–50. [Google Scholar] [CrossRef]
- Kumar, B. Graphene- and Graphene Oxide-Bounded Metal Nanocomposite for Remediation of Organic Pollutants. In Carbon-Based Material for Environmental Protection and Remediation; Bartoli, M., Frediani, M., Rosi, L., Eds.; IntechOpen: London, UK, 2020. [Google Scholar] [CrossRef]
- Zhang, K.; Suh, J.M.; Choi, J.-W.; Jang, H.W.; Shokouhimehr, M.; Varma, R.S. Recent Advances in the Nanocatalyst-Assisted NaBH4 Reduction of Nitroaromatics in Water. ACS Omega 2019, 4, 483–495. [Google Scholar] [CrossRef] [PubMed]
- Orlandi, M.; Brenna, D.; Harms, R.; Jost, S.; Benaglia, M. Recent Developments in the Reduction of Aromatic and Aliphatic Nitro Compounds to Amines. Org. Process Res. Dev. 2018, 22, 430–445. [Google Scholar] [CrossRef]
- Zang, W.; Li, G.; Wang, L.; Zhang, X. Catalytic hydrogenation by noble-metal nanocrystals with well-defined facets: A review. Catal. Sci. Technol. 2015, 5, 2532–2553. [Google Scholar] [CrossRef]
- Torbina, V.V.; Vodyankin, A.A.; Ten, S.; Mamontov, G.V.; Salaev, M.A.; Sobolev, V.I.; Vodyankina, O.V. Ag-Based Catalysts in Heterogeneous Selective Oxidation of Alcohols: A Review. Catalysts 2018, 8, 447. [Google Scholar] [CrossRef]
- Vodyankina, O.V.; Mamontov, G.V.; Dutov, V.V.; Kharlamova, T.S.; Salaev, M.A. Ag-Containing Nanomaterials in Heterogeneous Catalysis: Advances and Recent Trends. In Advanced Nanomaterials for Catalysis and Energy: Synthesis, Characterization and Applications; Sadykov, V.A., Ed.; Elsevier: Amsterdam, The Netherlands, 2018; pp. 143–175. [Google Scholar] [CrossRef]
- Wen, C.; Yin, A.; Dai, W.-L. Recent advances in silver-based heterogeneous catalysts for green chemistry processes. Appl. Catal. B: Environ. 2014, 160–161, 730–741. [Google Scholar] [CrossRef]
- Liao, G.; Gong, Y.; Zhong, L.; Fang, J.; Zhang, L.; Xu, Z.; Gao, H.; Fang, B. Unlocking the door to highly efficient Ag-based nanoparticles catalysts for NaBH4-assisted nitrophenol reduction. Nano Res. 2019, 12, 2407–2436. [Google Scholar] [CrossRef]
- Pradhan, N.; Pal, A.; Pal, T. Silver nanoparticle catalyzed reduction of aromatic nitro compounds. Colloids Surf. A: Physicochem. Eng. Aspects 2002, 196, 247–257. [Google Scholar] [CrossRef]
- Montini, T.; Melchionna, M.; Monai, M.; Fornasiero, P. Fundamentals and Catalytic Applications of CeO2-Based Materials. Chem. Rev. 2016, 116, 5987–6041. [Google Scholar] [CrossRef] [PubMed]
- Salaev, M.A.; Salaeva, A.A.; Kharlamova, T.S.; Mamontov, G.V. Pt–CeO2-based composites in environmental catalysis: A review. Appl. Catal. B: Environ. 2021, 295, 120286. [Google Scholar] [CrossRef]
- Grabchenko, M.V.; Mamontov, G.V.; Zaikovskii, V.I.; La Parola, V.; Liotta, L.F.; Vodyankina, O.V. The role of metal–support interaction in Ag/CeO2 catalysts for CO and soot oxidation. Appl. Catal. B: Environ. 2020, 260, 118148. [Google Scholar] [CrossRef]
- Kong, D.; Wang, G.; Pan, Y.; Hu, S.; Hou, J.; Pan, H.; Campbell, C.T.; Zhu, J. Growth, Structure, and Stability of Ag on CeO2(111): Synchrotron Radiation Photoemission Studies. J. Phys. Chem. C 2011, 115, 6715–6725. [Google Scholar] [CrossRef]
- Mamontov, G.V.; Grabchenko, M.V.; Sobolev, V.I.; Zaikovskii, V.I.; Vodyankina, O.V. Ethanol dehydrogenation over Ag-CeO2/SiO2 catalyst: Role of Ag-CeO2 interface. Appl. Catal. A: General 2016, 528, 161–167. [Google Scholar] [CrossRef]
- Mikheeva, N.N.; Zaikovskii, V.I.; Larichev, Y.V.; Mamontov, G.V. Toluene abatement on Ag-CeO2/SBA-15 catalysts: Synergistic effect of silver and ceria. Mater. Today Chem. 2021, 21, 100530. [Google Scholar] [CrossRef]
- Ou, C.-C.; Chen, C.-H.; Chan, T.-S.; Chen, C.-S.; Cheng, S. Influence of pretreatment on the catalytic performance of Ag/CeO2 for formaldehyde removal at low temperature. J. Catal. 2019, 380, 43–54. [Google Scholar] [CrossRef]
- Taratayko, A.; Larichev, Y.; Zaikovskii, V.; Mikheeva, N.; Mamontov, G. Ag-CeO2/SBA-15 composite prepared from Pluronic P123@SBA-15 hybrid as catalyst for room-temperature reduction of 4-nitrophenol. Catal. Today 2021, 375, 576–584. [Google Scholar] [CrossRef]
- Qian, X.; Kuwahara, Y.; Mori, K.; Yamashita, H. Silver Nanoparticles Supported on CeO2-SBA-15 by Microwave Irradiation Possess Metal–Support Interactions and Enhanced Catalytic Activity. Chem. Eur. J. 2014, 20, 15746–15752. [Google Scholar] [CrossRef]
- Verma, P.; Kuwahara, Y.; Mori, K.; Yamashita, H. Plasmonic catalysis of Ag nanoparticles deposited on CeO2 modified mesoporous silica for the nitrostyrene reduction under light irradiation conditions. Catal. Today 2019, 324, 83–89. [Google Scholar] [CrossRef]
- Geim, A.K.; Novoselov, K.S. The rise of graphene. Nat. Mater. 2007, 6, 183–191. [Google Scholar] [CrossRef] [PubMed]
- Wang, X.; Chen, S. Graphene-Based Nanocomposites. In Physics and Applications of Graphene–Experiments; Mikhailov, S., Ed.; IntechOpen: London, UK, 2011; pp. 135–168. [Google Scholar] [CrossRef]
- Obodo, R.M.; Ahmad, I.; Ezema, F.I. Introductory Chapter: Graphene and Its Applications. In Graphene and Its Derivatives-Synthesis and Applications; Ahmad, I., Ezema, F.I., Eds.; IntechOpen: London, UK, 2019. [Google Scholar] [CrossRef]
- Yusuf, M.; Kumar, M.; Khan, M.A.; Sillanpa, M.; Arafat, H. A review on exfoliation, characterization, environmental and energy applications of graphene and graphene-based composites. Adv. Colloid Interface Sci. 2019, 273, 102036. [Google Scholar] [CrossRef]
- Prasad, C.; Liu, Q.; Tang, H.; Yuvaraja, G.; Long, J.; Rammohan, A.; Zyryanov, G.V. An overview of graphene oxide supported semiconductors based photocatalysts: Properties, synthesis and photocatalytic applications. J. Mol. Liq. 2020, 297, 111826. [Google Scholar] [CrossRef]
- Shen, Y.; Fang, Q.; Chen, B. Environmental Applications of Three-Dimensional Graphene-Based Macrostructures: Adsorption, Transformation, and Detection. Environ. Sci. Technol. 2014, 49, 67–84. [Google Scholar] [CrossRef]
- Paramasivan, T.; Sivarajasekar, N.; Muthusaravanan, S.; Subashini, R.; Prakashmaran, J.; Sivamani, S.; Ajmal Koya, P. Graphene Family Materials for the Removal of Pesticides from Water. In A New Generation Material Graphene: Applications in Water Technology; Naushad, M., Ed.; Springer: Berlin, Germany, 2019; pp. 309–327. [Google Scholar] [CrossRef]
- Jimenez-Cervantes, E.; López-Barroso, J.; Martínez-Hernández, A.L.; Velasco-Santos, C. Graphene-Based Materials Functionalization with Natural Polymeric Biomolecules. In Recent Advances in Graphene Research; Nayak, P.K., Ed.; IntechOpen: London, UK, 2016; pp. 257–298. [Google Scholar] [CrossRef]
- Gemeay, A.; El-Halwagy, M. Immobilization Impact of Photocatalysts onto Graphene Oxide. In Graphene Oxide-Applications and Opportunities; Kamble, G., Ed.; IntechOpen: London, UK, 2018; pp. 107–126. [Google Scholar] [CrossRef]
- Romero, U.A.M.; Soto, M.Á.V.; Jiménez, L.L.; Quintana, J.Á.; García, S.A.P. Graphene Derivatives: Controlled Properties, Nanocomposites, and Energy Harvesting Applications. In Graphene Materials-Structure, Properties and Modifications; Kyzas, G.Z., Mitropoulos, A., Eds.; IntechOpen: London, UK, 2017; pp. 77–96. [Google Scholar] [CrossRef]
- Ji, Z.; Shen, X.; Yang, J.; Zhu, G.; Chen, K. A novel reduced graphene oxide/Ag/CeO2 ternary nanocomposite: Green synthesis and catalytic properties. Appl. Catal. B: Environ. 2014, 144, 454–461. [Google Scholar] [CrossRef]
- Wang, Y.; Lu, C.; Yin, Z. Reduced graphene oxide decorated with Ag/CeO2 nanocomposite towards room temperature photocatalytic esterification of aldehydes. Mater. Lett. 2020, 270, 127723. [Google Scholar] [CrossRef]
- Tao, X.; Zhou, Y.; Xu, K.; Wu, Y.; Mi, J.; Li, Y.; Liu, Q.; Cheng, X.; Zhao, N.; Shi, H.; et al. Bifunctional Material with Organic Pollutant Removing and Antimicrobial Properties: Graphene Aerogel Decorated with Highly Dispersed Ag and CeO2 Nanoparticles. ACS Sustainable Chem. Eng. 2018, 6, 16907–16919. [Google Scholar] [CrossRef]
- Mardani, C.; Rizal, M.Y.; Saleh, R.; Taufik, A.; Yin, S. Synthesis and characterization of Ag/CeO2/graphene nanocomposites as catalysts for water-pollution treatment. Appl. Surf. Sci. 2020, 530, 147297. [Google Scholar] [CrossRef]
- Thommes, M.; Kaneko, K.; Neimark, A.V.; Olivier, J.P.; Rodriguez-Reinoso, F.; Rouquerol, J.; Sing, K.S.W. Physisorption of gases, with special reference to the evaluation of surface area and pore size distribution (IUPAC Technical Report). Pure Appl. Chem. 2015, 87, 1051–1069. [Google Scholar] [CrossRef]
- Huh, S.H. Thermal Reduction of Graphene Oxide. In Physics and Applications of Graphene–Experiments; Mikhailov, S., Ed.; IntechOpen: London, UK, 2011; pp. 73–90. [Google Scholar] [CrossRef]
- Ossonon, B.D.; Bélanger, D. Synthesis and characterization of sulfophenyl-functionalized reduced graphene oxide sheet. RSC Adv. 2017, 7, 27224–27234. [Google Scholar] [CrossRef]
- He, Y.; Zhang, N.; Wu, F.; Xu, F.; Liu, Y.; Gao, J. Graphene oxide foams and their excellent adsorption ability for acetone gas. Mater. Res. Bull. 2013, 48, 3553–3558. [Google Scholar] [CrossRef]
- Verma, R.; Samdarshi, S.K. In-Situ Decorated Optimized CeO2 on Reduced Graphene Oxide with Enhanced Adsorptivity and Visible Light Photocatalytic Stability and Reusability. J. Phys. Chem. C 2016, 120, 22281–22290. [Google Scholar] [CrossRef]
- Hui, K.S.; Hui, K.N.; Dinh, D.A.; Tsang, C.H.; Cho, Y.R.; Zhou, W.; Hong, X.; Chun, H.-H. Green synthesis of dimension-controlled silver nanoparticle–graphene oxide with in situ ultrasonication. Acta Mater. 2014, 64, 326–332. [Google Scholar] [CrossRef]
- Biesinger, M.C. Accessing the robustness of adventitious carbon for charge referencing (correction) purposes in XPS analysis: Insights from a multi-user facility data review. Appl. Surf. Sci. 2022, 597, 153681. [Google Scholar] [CrossRef]
- Al-Gaashani, R.; Najjar, A.; Zakaria, Y.; Mansour, S.; Atieh, M.A. XPS and structural studies of high quality graphene oxide and reduced graphene oxide prepared by different chemical oxidation methods. Ceram. Int. 2019, 45, 14439–14448. [Google Scholar] [CrossRef]
- Ferraria, A.M.; Carapeto, A.P.; Botelho do Rego, A.M. X-ray photoelectron spectroscopy: Silver salts revisited. Vacuum 2012, 86, 1988–1991. [Google Scholar] [CrossRef]
- Khairy, M.; Mohamed, M.M.; Ibrahem, A. Enhanced the Catalytic activity of reduction of 4-nitrophenol on Ag/RGO nanocomposites. J. Bas. Environ. Sci. 2018, 5, 101–114. [Google Scholar]
- Bîru, E.I.; Iovu, H. Graphene Nanocomposites Studied by Raman Spectroscopy. In Raman Spectroscopy; Do Nascimento, G.M., Ed.; IntechOpen: London, UK, 2018; pp. 179–201. [Google Scholar] [CrossRef]
- Allen, M.J.; Tung, V.C.; Kaner, R.B. Honeycomb Carbon: A Review of Graphene. Chem. Rev. 2010, 110, 132–145. [Google Scholar] [CrossRef]
- Chen, J.; Yao, B.; Li, C.; Shi, G. An improved Hummers method for eco-friendly synthesis of graphene oxide. Carbon 2013, 64, 225–229. [Google Scholar] [CrossRef]
- Wu, X.; Jaatinen, E.; Sarina, S.; Zhu, H.Y. Direct photocatalysis of supported metal nanostructures for organic synthesis. J. Phys. D: Appl. Phys. 2017, 50, 283001. [Google Scholar] [CrossRef]
- Anandkumar, M.; Vinothkumar, G.; Babu, K.S. Synergistic effect of gold supported on redox active cerium oxide nanoparticles for the catalytic hydrogenation of 4-nitrophenol. New J. Chem. 2017, 41, 6720–6729. [Google Scholar] [CrossRef]
- Strachan, J.; Barnett, C.; Masters, A.F.; Maschmeyer, T. 4-Nitrophenol Reduction: Probing the Putative Mechanism of the Model Reaction. ACS Catal. 2020, 10, 5516–5521. [Google Scholar] [CrossRef]
- Karuppusamy, S.; Marken, F.; Kulandainathan, M.A. Role of Dissolved Oxygen in Nitroarene Reduction Catalyzed by a Heterogeneous Silver Textile Catalyst in Water. New J. Chem. 2020, 44, 17780–17790. [Google Scholar] [CrossRef]
- Wunder, S.; Polzer, F.; Lu, Y.; Mei, Y.; Ballauff, M. Kinetic Analysis of Catalytic Reduction of 4-Nitrophenol by Metallic Nanoparticles Immobilized in Spherical Polyelectrolyte Brushes. J. Phys. Chem. C 2010, 114, 8814–8820. [Google Scholar] [CrossRef]
- Jiang, S.; Wang, L.; Duan, Y.; An, J.; Luo, Q.; Zhang, Y.; Tang, Y.; Huang, J.; Zhang, B.; Liu, J.; et al. A novel strategy to construct supported silver nanocomposite as an ultrahigh efficient catalyst. Appl. Catal. B: Environ. 2021, 283, 119592. [Google Scholar] [CrossRef]
- Shi, Y.; Zhang, X.; Zhu, Y.; Tan, H.; Chen, X.; Lu, Z.-H. Core-shell structured nanocomposites Ag@CeO2 as catalyst for hydrogenation of 4-nitrophenol and 2-nitroaniline. RSC Adv. 2016, 6, 47966–47973. [Google Scholar] [CrossRef]
- Chernykh, M.V.; Mikheeva, N.N.; Zaikovskii, V.I.; Mamontov, G.V. Influence of the Ag Content on the Activity of Ag/CeO2 Catalysts in the Reduction of 4-Nitrophenol at Room Temperature and Atmospheric Pressure. Kinet. Catal. 2020, 61, 708–715. [Google Scholar] [CrossRef]
- Kharlamova, T.S.; Salina, M.V.; Svetlichnyi, V.A.; Salaev, M.A.; Stadnichenko, A.I.; Mamontov, G.V. CeO2-supported Pt–Ag bimetallic catalysts for 4-nitrophenol reduction. Catal. Today 2022, 384–386, 12–24. [Google Scholar] [CrossRef]
- Kohantorabi, M.; Gholami, M.R. MxNi100-x (M = Ag, and Co) Nanoparticles Supported on CeO2 Nanorods Derived from Ce-Metal Organic Frameworks as an Effective Catalyst for Reduction of Organic Pollutants: Langmuir-Hinshelwood Kinetics and Mechanism. New J. Chem. 2017, 41, 10948–10958. [Google Scholar] [CrossRef]
- Lei, G.; Ma, J.; Li, Z.; Fan, X.; Peng, W.; Zhang, G.; Zhang, F.; Li, Y. Magnetic Au-Ag-γ-Fe2O3/rGO Nanocomposites as an Efficient Catalyst for the Reduction of 4-Nitrophenol. Nanomaterials 2018, 8, 877. [Google Scholar] [CrossRef]
- Qu, J.; Ren, C.; Dong, Y.; Chang, Y.; Zhou, M.; Chen, X. Facile synthesis of multifunctional graphene oxide/AgNPs-Fe3O4 nanocomposite: A highly integrated catalysts. Chem. Eng. J. 2012, 211–212, 412–420. [Google Scholar] [CrossRef]
- Joshi, M.K.; Pant, H.R.; Kim, H.J.; Kim, J.H.; Kim, C.S. One-pot synthesis of Ag-iron oxide/reduced graphene oxide nanocomposite via hydrothermal treatment. Colloids Surf. A 2014, 446, 102–108. [Google Scholar] [CrossRef]
- Varshney, S.; Bar-Ziv, R.; Zidki, T. On the Remarkable Performance of Silver-based Alloy Nanoparticles in 4-nitrophenol Catalytic Reduction. ChemCatChem 2020, 12, 4680–4688. [Google Scholar] [CrossRef]
- Li, W.; Ge, X.; Zhang, H.; Ding, Q.; Ding, H.; Zhang, Y.; Wang, G.; Zhang, H.; Zhao, H. Hollow Mesoporous SiO2 Spheres Nanoarchitecture with Encapsulated Silver Nanoparticles for Catalytic Reduction of 4-nitrophenol. Inorg. Chem. Front. 2016, 3, 663–670. [Google Scholar] [CrossRef]
- Shi, Y.; Zhang, X.-L.; Feng, G.; Chen, X.; Lu, Z.-H. Ag-SiO2 nanocomposites with plum-pudding structure as catalyst for hydrogenation of 4-nitrophenol. Ceram. Int. 2015, 41, 14660–14667. [Google Scholar] [CrossRef]
- Xiao, Z.-Y.; Huang, S.-X.; Zhai, S.-R.; Zhai, B.; Zhang, F.; An, Q.-D. PMHS-reduced fabrication of hollow Ag–SiO2 composite spheres with developed porosity. J. Sol-Gel Sci. Technol. 2015, 75, 82–89. [Google Scholar] [CrossRef]
- Bano, M.; Ahirwar, D.; Thomas, M.; Naiko, G.A.; Sheikh, M.U.D.; Khan, F. Hierarchical synthesis of silver monoliths and their efficient catalytic activity for the reduction of 4-Nitrophenol to 4-Aminophenol. New J. Chem. 2016, 40, 6787–6795. [Google Scholar] [CrossRef]
- Soysal, F.; Çıplak, Z.; Gökalp, C.; Getiren, B.; Yildiz, N. One-step hydrothermal synthesis of nitrogen doped reduced graphene oxide-silver nanocomposites: Catalytic performance. Appl. Organomet. Chem. 2020, 34, e5621. [Google Scholar] [CrossRef]
- Duan, C.; Liu, C.; Meng, X.; Lu, W.; Ni, Y. Fabrication of carboxymethylated cellulose fibers supporting Ag NPs@MOF-199s nanocatalysts for catalytic reduction of 4-nitrophenol. Appl. Organomet. Chem. 2019, 33, e4865. [Google Scholar] [CrossRef]
- Chang, S.; Liu, C.; Sun, Y.; Yan, Z.; Zhang, X.; Hu, X.; Zhang, H. Fe3O4 Nanoparticles Coated with Ag-Nanoparticle-Embedded Metal−Organic Framework MIL-100(Fe) for the Catalytic Reduction of 4-Nitrophenol. ACS Appl. Nano Mater. 2020, 3, 2302–2309. [Google Scholar] [CrossRef]
- Liu, G.-F.; Qiao, X.-X.; Cai, Y.-L.; Xu, J.-Y.; Yan, Y.; Karadeniz, B.; Lu, J.; Cao, R. Aluminum Metal−Organic Framework−Silver Nanoparticle Composites for Catalytic Reduction of Nitrophenols. ACS Appl. Nano Mater. 2020, 3, 11426–11433. [Google Scholar] [CrossRef]
- Liu, B.H.; Li, Z.P. A review: Hydrogen generation from borohydride hydrolysis reaction. J. Power Sources 2009, 187, 527–534. [Google Scholar] [CrossRef]
- Pinheiro, D.; Devi, K.R.S.; Jose, A.; Karthik, K.; Sugunan, S.; Mohan, M.K. Experimental Design for Optimization of 4-Nitrophenol Reduction by Green Synthesized CeO2/g-C3N4/Ag Catalyst Using Response Surface Methodology. J. Rare Earths 2020, 38, 1171–1177. [Google Scholar] [CrossRef]
- Hummers, W.S.; Offeman, R.E. Preparation of Graphitic Oxide. J. Am. Chem. Soc. 1958, 80, 1339. [Google Scholar] [CrossRef]


Publisher’s Note: MDPI stays neutral with regard to jurisdictional claims in published maps and institutional affiliations. |
© 2022 by the authors. Licensee MDPI, Basel, Switzerland. This article is an open access article distributed under the terms and conditions of the Creative Commons Attribution (CC BY) license (https://creativecommons.org/licenses/by/4.0/).