Article

In Situ Assembly of Well-Defined MoS2 Slabs on Shape-Tailored Anatase TiO2 Nanostructures: Heterojunctions Role in Phenol Photodegradation

Department of Chemistry and NIS (Nanostructured Interfaces and Surfaces) Interdepartmental Centre, University of Torino & INSTM-UdR Torino, Via P. Giuria 7, 10125 Torino, Italy
*
Authors to whom correspondence should be addressed.
Catalysts 2022, 12(11), 1414; https://doi.org/10.3390/catal12111414
Submission received: 6 October 2022 / Revised: 31 October 2022 / Accepted: 7 November 2022 / Published: 11 November 2022

Abstract

:
MoS2/TiO2-based nanostructures have attracted extensive attention due to their high performance in many fields, including photocatalysis. In this contribution, MoS2 nanostructures were prepared via an in situ bottom-up approach at the surface of shape-controlled TiO2 nanoparticles (TiO2 nanosheets and bipyramids). Furthermore, a multi-technique approach by combining electron microscopy and spectroscopic methods was employed. More in detail, the morphology/structure and vibrational/optical properties of MoS2 slabs on TiO2 anatase bipyramidal nanoparticles, mainly exposing {101} facets, and on TiO2 anatase nanosheets exposing both {001} and {101} facets, still covered by MoS2, were compared. It was shown that unlike other widely used methods, the bottom-up approach enabled the atomic-level growth of well-defined MoS2 slabs on TiO2 nanostructures, thus aiming to achieve the most effective chemical interactions. In this regard, two kinds of synergistic heterojunctions, namely, crystal face heterojunctions between anatase TiO2 coexposed {101} and {001} facets and semiconductor heterojunctions between MoS2 and anatase TiO2 nanostructures, were considered to play a role in enhancing the photocatalytic activity, together with a proper ratio of (101), (001) coexposed surfaces.

1. Introduction

In recent years, two-dimensional semiconductor heterojunctions have received wide attention due to their novel properties and challenging applications. Among these, many MoS2/TiO2-based heterostructures of different dimensionality, made by MoS2 microflowers, nanotubes, nanobelts, nanosheets, or quantum dots decorating shape-tailored TiO2 nanoparticles (NPs), have been investigated extensively [1,2,3,4]. They are more effective, with respect to the individual MoS2 and TiO2-based materials, also for photocatalytic performance and stability in the degradation of pollutants and dyes, renewable and clean energy production, as well electrocatalytic hydrogen production [5], photocatalytic CO2 reduction [5], applications in solar cells and supercapacitors, up to biomedical fields [6,7,8,9,10,11,12,13,14,15].
Concerning the photocatalytic activity, MoS2/TiO2-based heterostructures show remarkable properties, including high charge carrier separation and migration efficiencies, together with a wide light harvesting range. Nevertheless, it is well known that TiO2, albeit an excellent photocatalyst, absorbs only a small portion of the solar spectrum in the UV region (3% of the sunlight spectrum) [7]. Moreover, the photoactivity of anatase TiO2 suffers significantly from its wide band gap (3.2 eV), high recombination rate of photogenerated electron–hole pairs, and low rate of separation/migration of photoelectrons, for any practical use.
Recently, many efforts have been directed to the modification of TiO2 in order to obtain photocatalytic activity under visible light, which enables the use of green and renewable-energy-activated processes. Among all the strategies, some approaches consist in the doping/codoping of TiO2 with heteroelements/metals, or in designing 2D heterostructures alone or coupled with other nanomaterials [16,17,18,19,20,21] to enhance the photocatalytic activity.
In this concern, due to its absorption in the UV-visible range, together with its high chemical stability, MoS2 plays a significant role in performing MoS2/TiO2 heterojunctions, made by TiO2 sensitized with MoS2, thus increasing the visible light absorption ability of TiO2-based systems [22,23].
However, the stacking characteristics of MoS2 layered configurations can hinder the active sites on the 2D nanosheets, thus reducing the carrier transfer and, thus, the catalytic activity.
To overcome the limitations of individual materials, the development of MoS2 nanosheet-hybrid structures provided a way to increase the specific surface area and the dispersion of MoS2 nanosheets and, thus, the separation time of photoinduced carriers and the photocatalytic activity [24].
Therefore, in order to face the new challenges and opportunities of advanced applications, a deeper understanding of the heterostructure interface in MoS2/TiO2-based composites, obtained through careful control of the different crystal growth strategies, must be achieved. For this, the role of the interfaces in affecting the charge transport phenomena or the catalytic processes, which depend on the nature of the dominant faces and, thus, on the arrangement and the atomic structure of the active sites, has been extensively highlighted [25,26]. Concerning this point, model systems of controlled morphology have been designed, including heterostructures of different dimensionality, to achieve a good interfacial contact, thus hindering aggregation phenomena. In particular, two-dimensional layered materials such as transition metal dichalcogenides (TMDs, i.e., MoS2 and WS2) have been combined with zero-dimensional (0D) supports, such as plasmonic nanoparticles and quantum dots, or with monodimensional (1D) nanostructures, such as nanotubes, nanowires, and nanoribbons, or also with the two-dimensional ones (2D), to tailor 2D–2D van der Waals hybrid heterostructures [6,13,27,28,29,30,31,32,33,34]. However, to provide a suitable interface contact with supported phases, features such as the surface-to-volume ratio together with the nature of active sites and the extension of the main facets of the support materials have to be considered, as well as the quantum size effects [35,36,37].
Along this line, highly dispersed MoS2 nanostructures have been prepared via an in situ bottom-up approach from a suitable molybdenum oxide precursor in a sulfiding atmosphere on many semiconductors, including differently shaped anatase TiO2 nanostructures [18,38,39,40,41,42]. The bottom-up approach paved the way to the atomic-level growth of well-defined MoS2 slabs on many TiO2 nanostructures, including flattened truncated bipyramids or elongated, rod-shaped up to tetragonal cuboids, aiming to achieve the most effective chemical interactions.
Therefore, extensive literature on all these materials concerns a few aspects, including: (i) the possibility to modify and control the ratio of the major TiO2 facets, (ii) the lattice matching of such TiO2 surfaces (i.e., {001}, {101}, and {010} facets) with 2D MoS2 exposed planes to obtain heterojunctions, and (iii) the tuning of the optical properties of heterostructures for enhancing the photocatalytic activity toward visible light. In this context, two kinds of synergistic heterojunctions have been considered, namely, crystal face heterojunctions between anatase TiO2 coexposed {101} and {001} facets and semiconductor heterojunctions between MoS2 and anatase TiO2 nanostructures. According to many authors, it will be shown that a proper ratio of (101), (001) coexposed facets can affect the enhancement of the photocatalytic activity [3,43,44,45].
However, notwithstanding the great interest in MoS2/TiO2 systems, there is a limited number of studies concerning the in situ growth of MoS2 on different shape-tailored anatase TiO2 nanostructures.
The aim of this study is to highlight the role played by the morphology and electronic properties of TiO2-based heterostructures in enabling higher efficiency of photocatalysts used in photodegradation processes. In this regard, the relationship between the morphology/structure and vibrational/optical properties of TiO2 anatase bipyramidal nanoparticles, mainly exposing {101} facets, decorated with MoS2 slabs, is discussed and the obtained results are compared with the previously published ones on TiO2 anatase nanosheets exposing both {001} and {101} facets, covered by MoS2 [6]. In addition, the role of the different facets in affecting the distribution and the dispersion of MoS2 slabs, together with the investigation of the surface sites on the main exposed faces, is highlighted. It is further confirmed that on samples obtained by the in situ strategy, the MoS2/surface interaction, that is, the formation of highly dispersed and strongly anchored MoS2 nanosheets on TiO2 surfaces, prevents self-aggregation phenomena from occurring. This is shown from FTIR spectra of CO adsorption on MoS2/TiO2-combined heterostructures, with the CO molecule being a highly sensitive probe to the nature and the activity of the exposed sites on both nanosheets and bipyramidal TiO2 anatase nanoparticles. On this matter, it has been reported, from IR spectra of CO adsorbed on pure TiO2 anatase nanoparticles, that the Lewis acidity and, thus, the activity of Ti4+ sites on (1 × 4) reconstructed {001} facets of calcined TiO2 nanosheets are weaker than those of cationic centers on {101} facets of bipyramidal TiO2 anatase nanoparticles [46].
A comparison between the MoS2/TiO2-combined heterostructures in phenol photodegradation highlights the role of the different shapes/facets together with certain features including the surface hydration, the hydroxylation, and the Lewis acidity on the photocatalytic activity.

2. Results and Discussion

2.1. Structure and Morphology of the MoS2/TiO2 Nanoparticles by XRD, HRTEM, and Raman Analyses

The crystal structures of MoS2/TiO2 n-sh and MoS2/TiO2 bipy, obtained via in situ methods, were investigated by X-ray diffraction analysis, and also compared with XRD patterns of MoS2 bulk (Fluka Chemie AG, Buchs, Switzerland), native TiO2 n-sh, and TiO2 bipy powders, used as reference materials. The XRD patterns of the reference materials, already discussed in [46], are summarized and compared with those of MoS2/TiO2 n-sh and MoS2/TiO2 bipy materials in Figure 1.
In this figure, the MoS2 XRD pattern shows three main peaks at 2θ = 14.4°, 32.7°, and at 39.5°, which correspond to the (002), (100), and (103) diffraction planes of hexagonal bulk MoS2.
XRD diffraction peaks at 2θ = 25.2°, 37.0°, 37.8°, 38.6°, 48.0°, 53.9°, and 55.1° corresponding to (101), (103), (004), (112), (200), (105), and (211) diffraction planes of anatase (PDF card #21-1272) also match well with both the native TiO2 n-sh and native TiO2 bipy XRD peaks. Likewise, both in situ-obtained MoS2/TiO2 n-sh and MoS2/TiO2 bipy are quite similar as no MoS2 XRD diffraction features can be highlighted. By now, it could be hypothesized that, despite a 3 wt.% Mo content, after reaction with H2S, only a small amount of highly dispersed MoS2 particles, very small in size (smaller than a few nm), is formed.
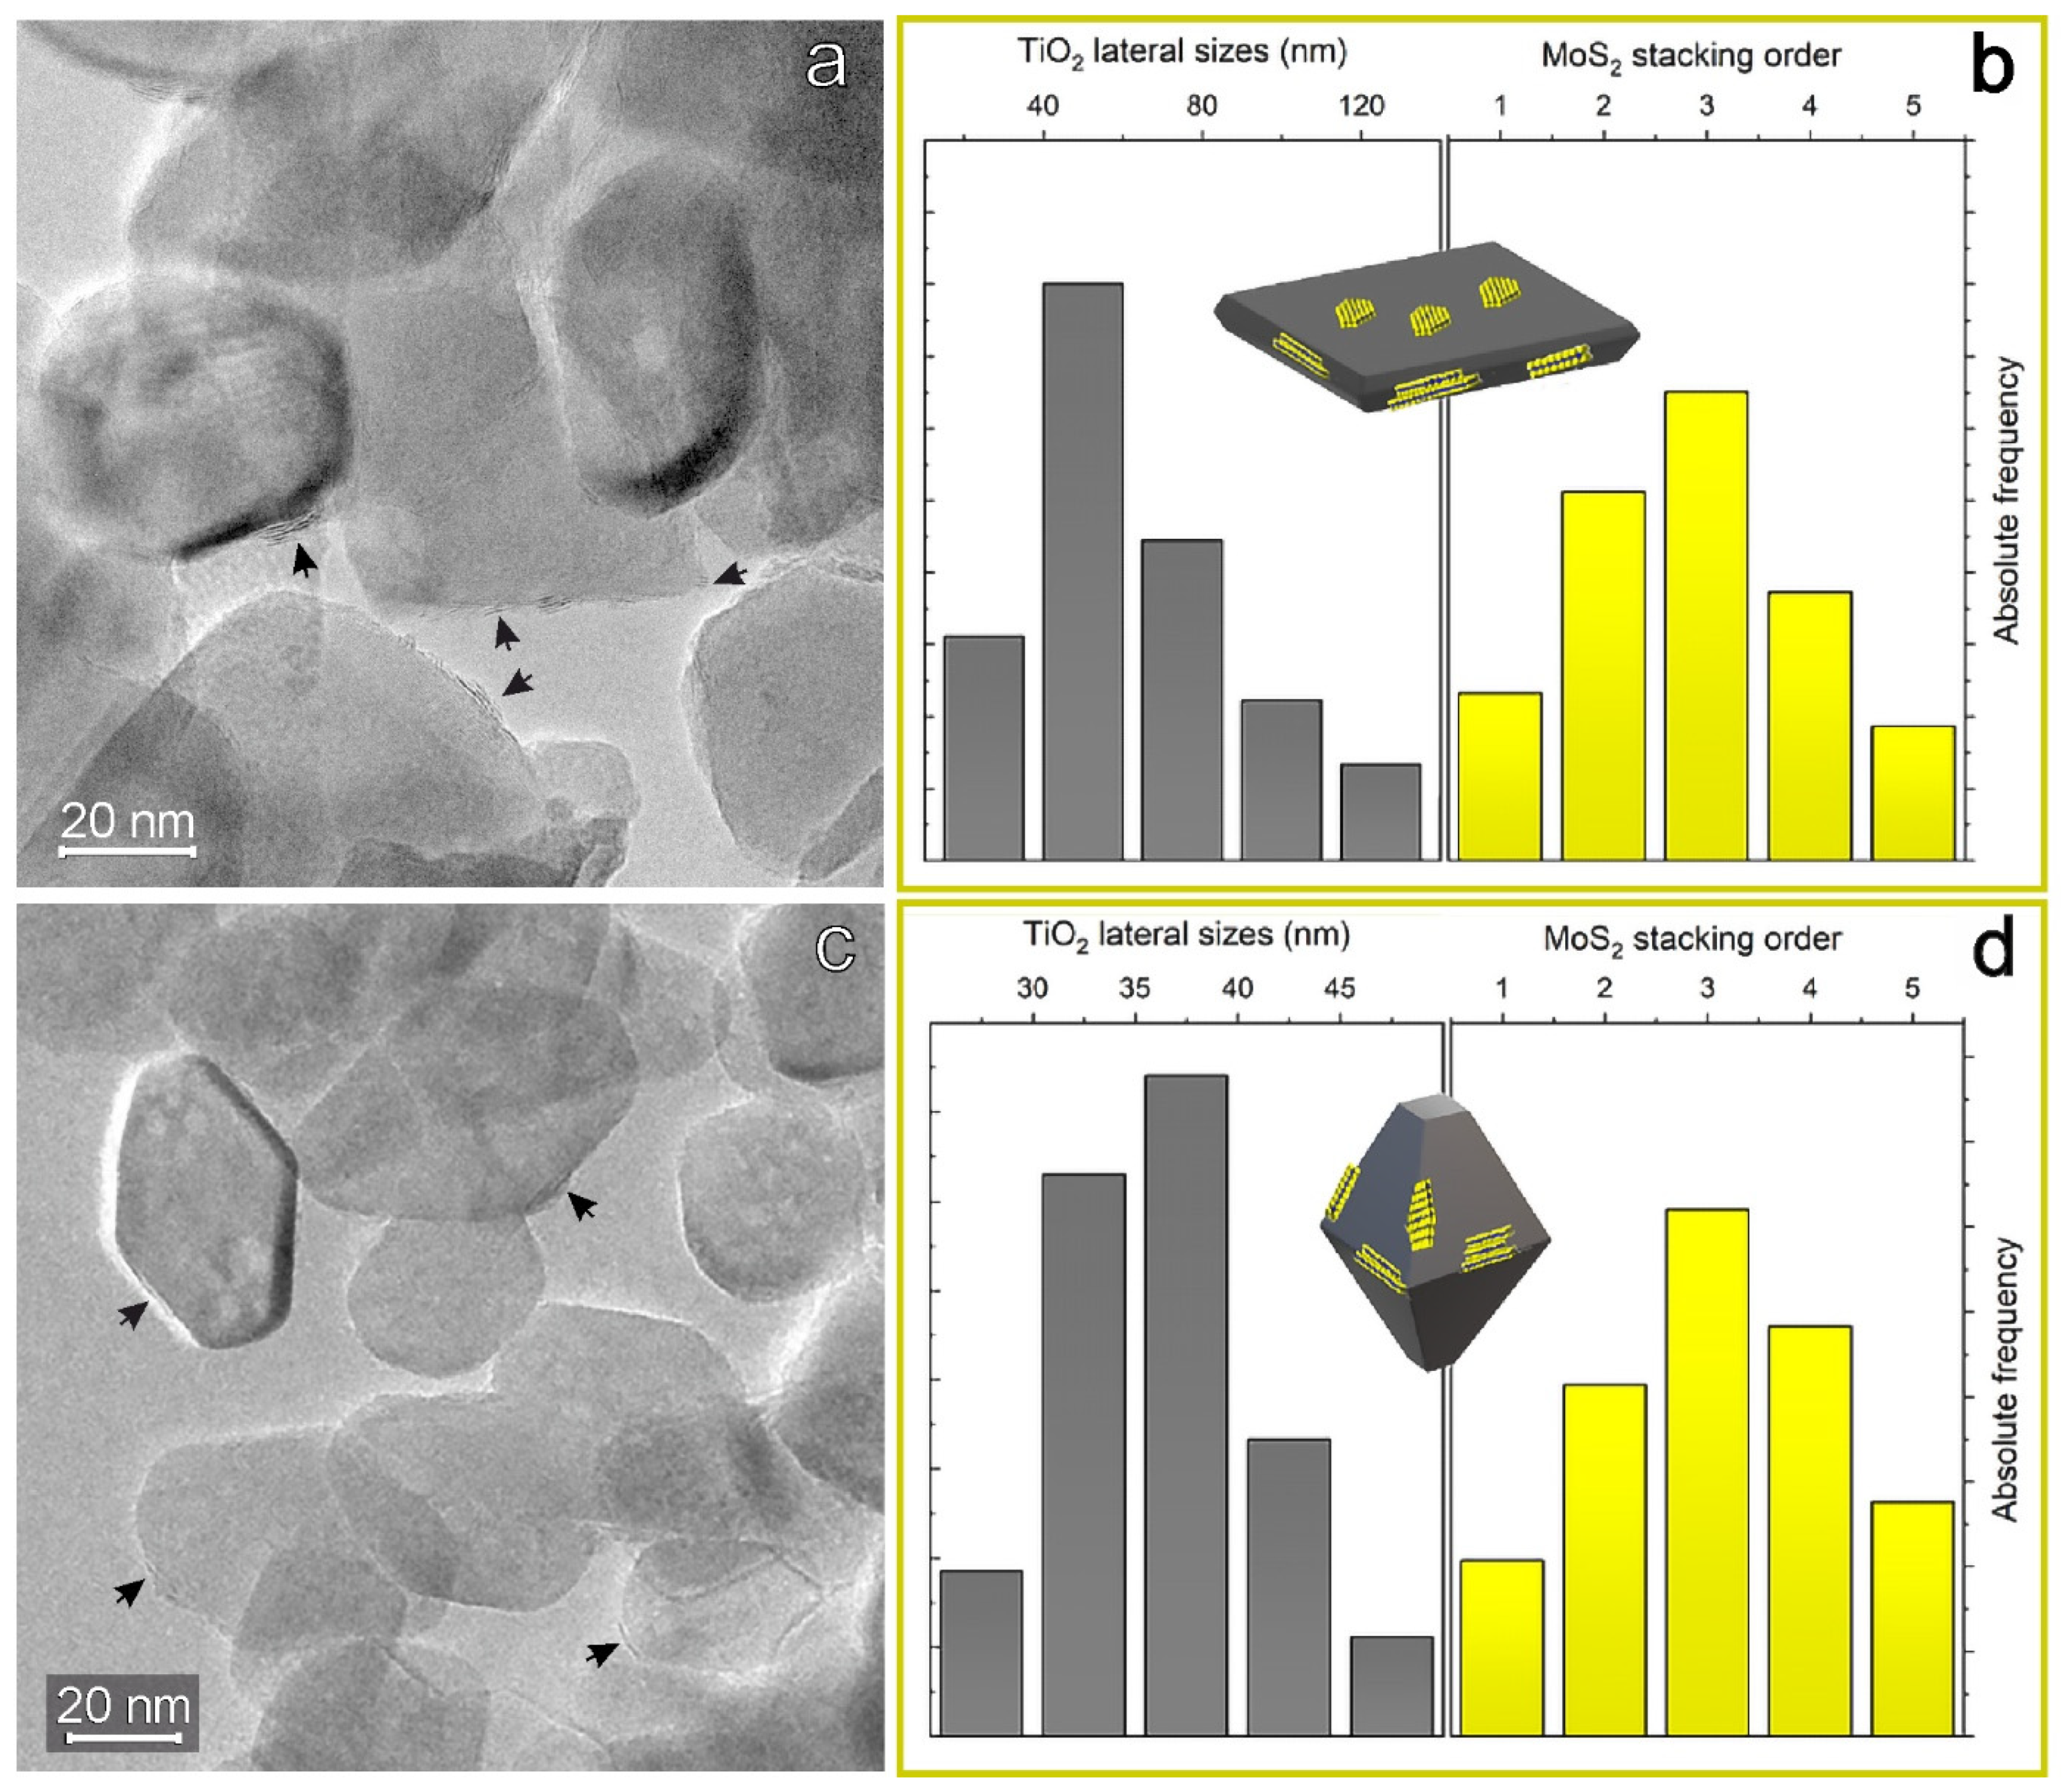
The morphology of the differently oriented MoS2/TiO2 n-sh and of MoS2/TiO2 bipy particles is TEM-imaged in Figure 2a,c, with the corresponding analyses of the lateral sizes of the shape-tailored TiO2 structures, together with the MoS2 particles stacking order (Figure 2b,d).
Owing to the different orientations with respect to the copper grid, the particles show different contours, due to the random arrangement of the nanocrystals, characterized by prevailing basal (001) faces (Figure 2a) or lateral (101) faces (Figure 2c and Figure S1).
From the TEM image in Figure 2a, MoS2/TiO2 n-sh expose basal faces in the 30–100 nm range, with thicknesses of about 20–30 nm, as obtained from the image contrast.
As far as MoS2/TiO2 bipy nanoparticles are concerned, TEM images are shown in Figure 2c. In this figure, truncated bipyramids are 10 nm wide in the basal plane and in the 25–45 nm range along the elongation direction. From particle size analysis, information on the lateral sizes of the TiO2 n-sh (20–100 nm wide) and TiO2 bipy (25–45 nm wide) can be obtained at first (gray histograms in Figure 2b,d), in agreement with the TEM images (Figure 2a,c). Some more MoS2 stacking orders of 3 ± 2 layers come from both systems (yellow histograms in Figure 2b,d), which confirms the effectiveness of the in situ growth in obtaining thinner but even more defective MoS2 slabs (see later in Figure 3a,b), as compared to other synthesis methods [46]. Despite the low magnification of the TEM images shown in Figure 2a,c, a few curved features decorating the anatase-shaped structures can be noticed (black arrows in figures). Highlighted also in the following HRTEM images (Figure 3a,b), we can ascribe the observed features to interference fringes of MoS2 layers or dots covering the TiO2 n-sh and TiO2 bipy facets.
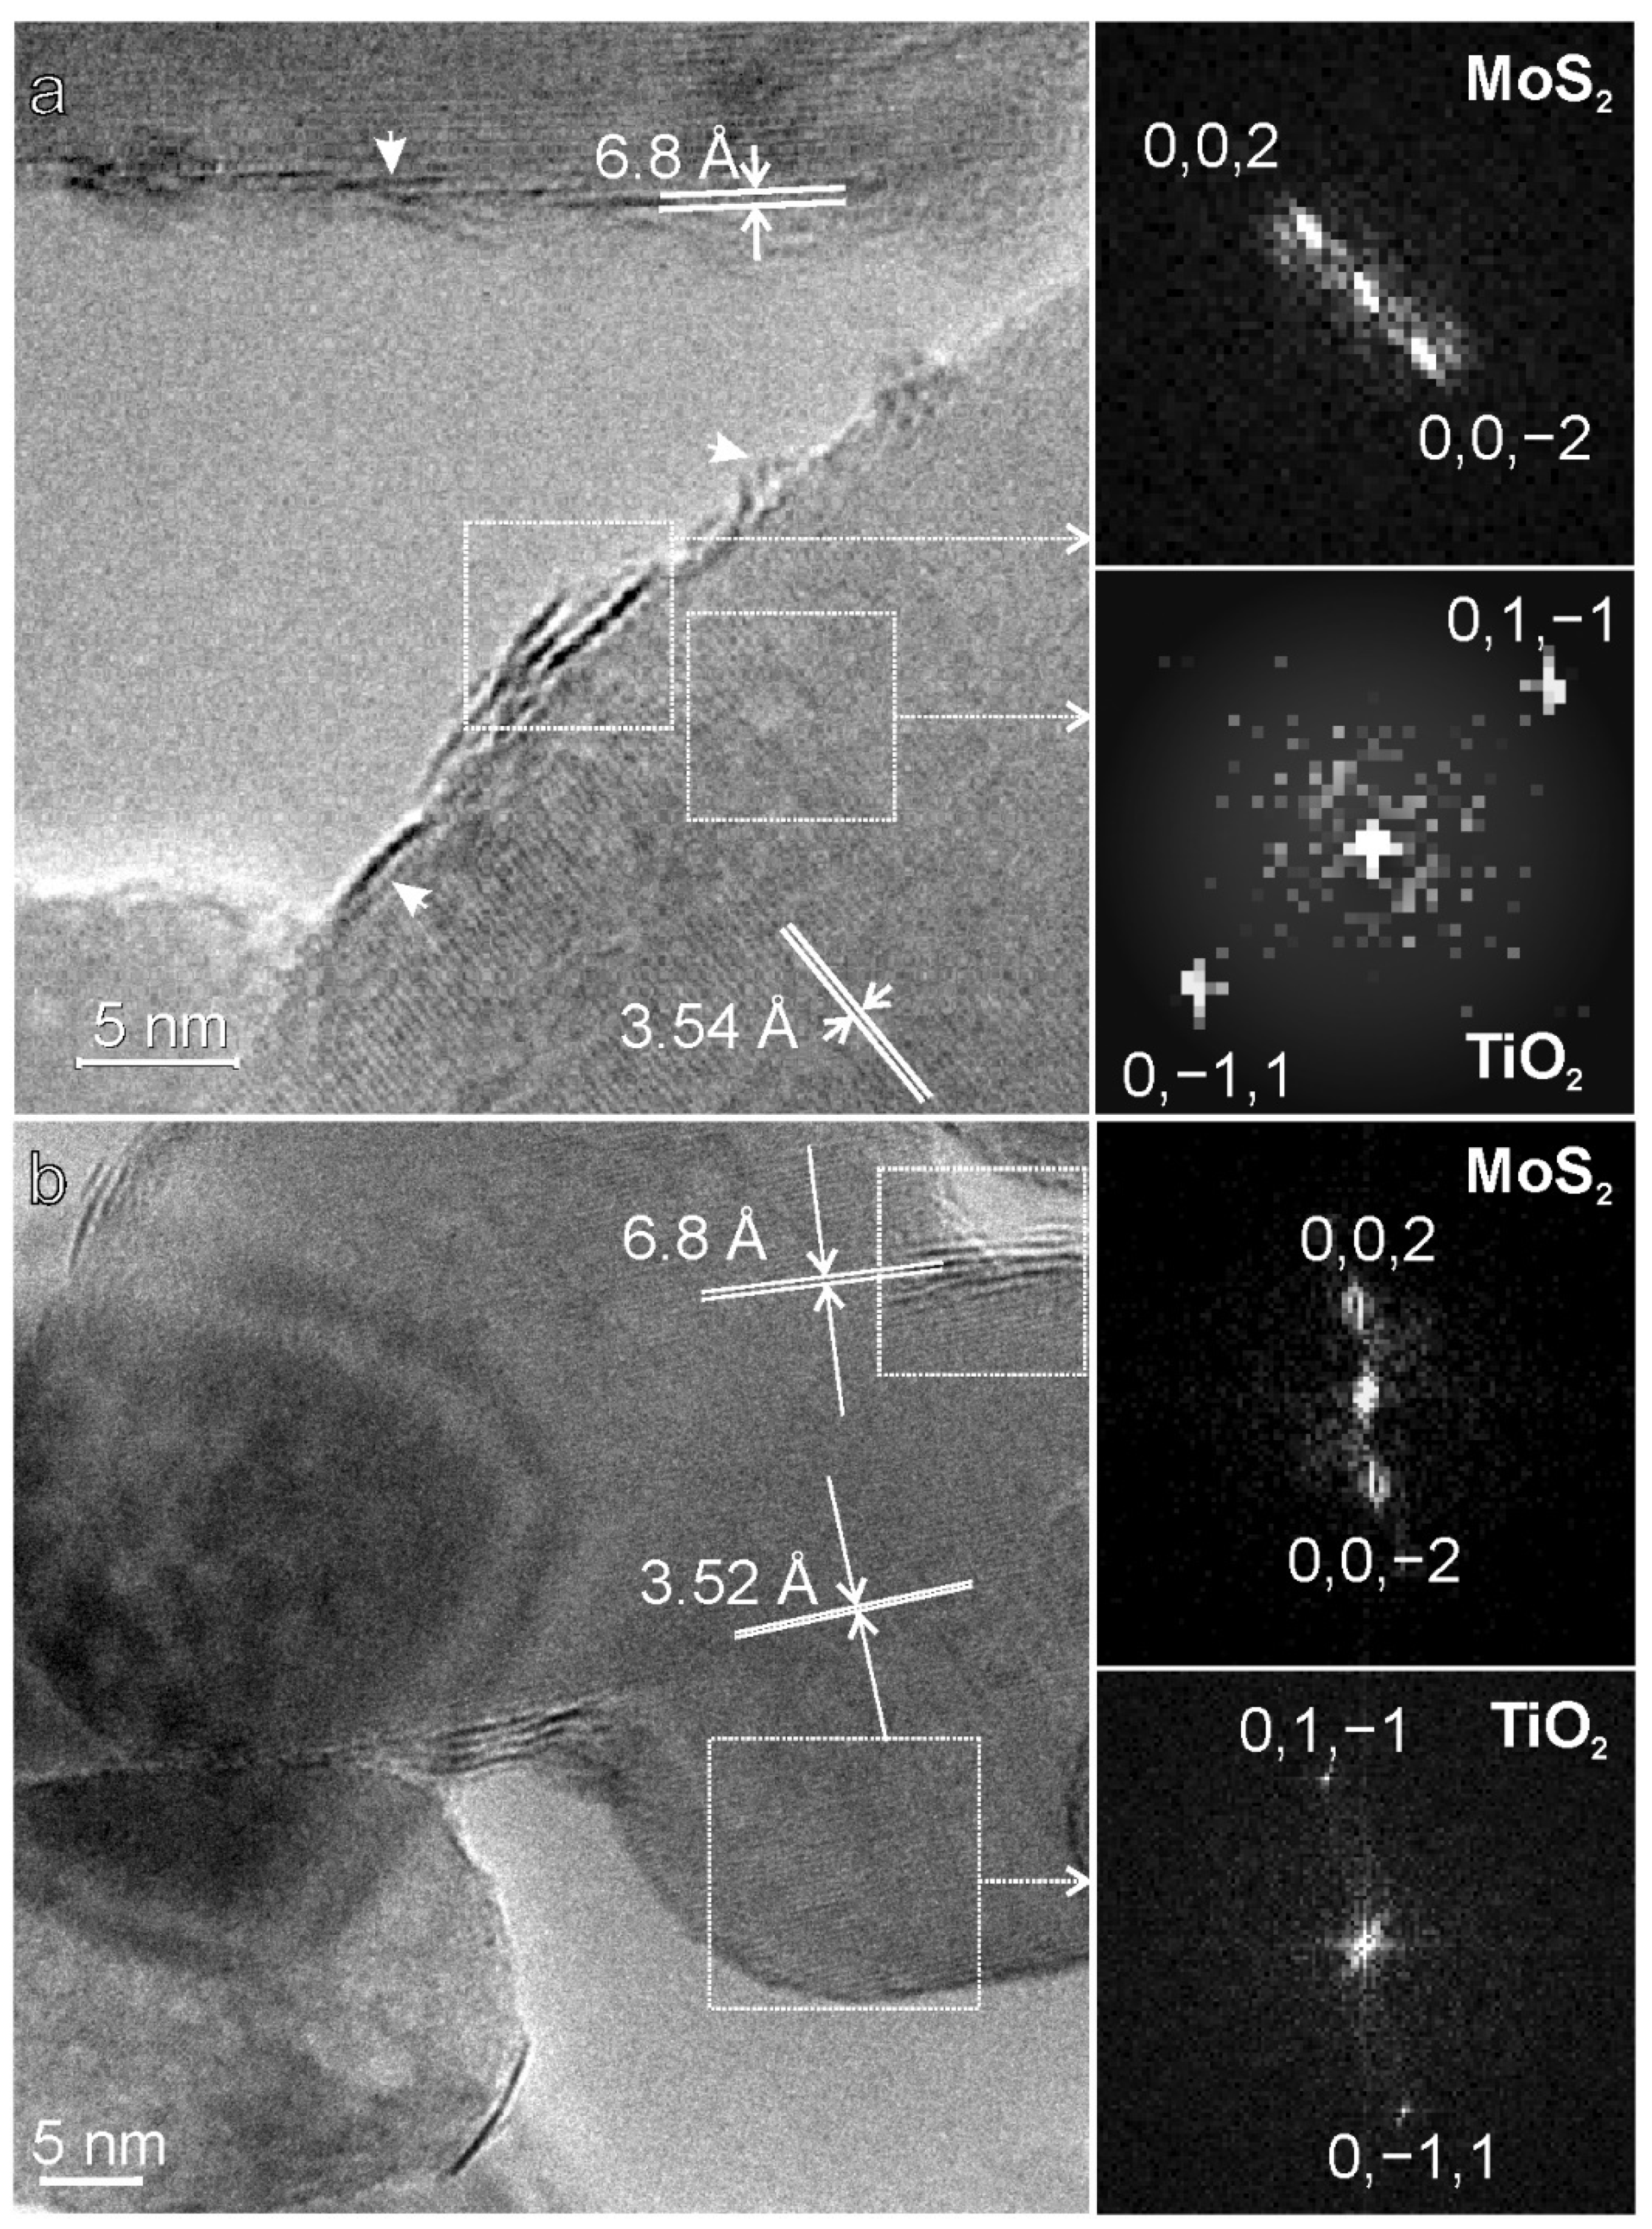
In particular, from the HRTEM image on a selected region of MoS2/TiO2 n-sh nanoparticles (Figure 3a), interference fringes, 3.54 Å apart, that reproduce the crystal planes intersecting the more spaced fringes at the crystal surface are assigned to the (101) planes of anatase. It is expected that the observed interference fringes are parallel to the lateral boundaries of the nanoparticle, confirming that they are the edges between (101) faces, delimiting the more extended basal faces. Interestingly, more irregular fringes, about 6.8 Å spaced, that can be assigned to thin MoS2, decorate the edges of TiO2 n-sh, although their presence on basal ones cannot be ruled out [6].
As for MoS2/TiO2 bipy, square bidimensional projections of truncated bipyramids with well-defined boundaries are HRTEM-imaged in Figure 3b. The presence of regular interference fringes corresponding to (101) planes of anatase is also observed, together with more irregular fringes, 6.8 Å spaced, assigned to thin MoS2 slabs, which are anchored either on the extended faces and on the edges.
It is noteworthy that the curved structure of MoS2 interference fringes, decorating the nanoanatase facets, is indicative of defective situations, including planes and boundaries interruptions, indicating the presence of coordinatively unsaturated atomic sites or reconstruction phenomena [18,22,37,38].
The related fast-Fourier-transform (FFT) images on the right side of Figure 3a,b confirm that the imaged facets correspond to {002} {00−2} {01−1} {0−11} facets on both samples.
Raman spectra of MoS2/TiO2 systems, recorded with the 514 nm and 442 nm laser lines, are compared with TiO2 n-sh, TiO2 bipy, and MoS2, used as reference materials, and are shown in Figure 4a,b.
Considering, at first, the Raman spectra recorded with the 514 nm laser line, in the 700–100 cm−1 range and in the 430–360 cm−1 enlarged view range, the typical anatase TiO2 fingerprints can be recognized for both bipyramids and nanosheets structures (Figure 4a). In this concern, the four bands at 638, 515, 396, and 144 cm−1 on TiO2 bipy and at 638, 515, 395, and 143 cm−1 on TiO2 n-sh are due to the Eg, A1g, B1g, and Eg Raman active modes, respectively, of the anatase phase, as described in the literature [17,47]. It is worth mentioning that the intense Eg Raman mode slightly blueshifts from 143 cm−1 to 144 cm−1, moving from anatase nanosheets to bipyramids structures, on more detailed observation. This shift can be explained with phonon confinement effects, due to the decrease in grain size [48].
As for MoS2/TiO2 heterostructures, Raman spectra are compared with those of bare MoS2 (Figure 4a, enlarged view on the right side). Features centered at 395–396 cm−1 observed for MoS2/TiO2 n-sh and MoS2/TiO2 bipy are due to the TiO2 anatase phase. Such a fingerprint splits into two components at 406 and 386 cm−1 (red spectrum, Figure 4a), and at 405 and 386 cm−1 (blue spectrum, Figure 4a), which can be ascribed to MoS2 A1g and E12g first-order Raman active modes, respectively. It is worth noting that in the bulk MoS2 spectrum, the positions of the A1g and E12g peaks are at 408 and 383 cm−1, respectively.
It is known that the A1g mode is explained with the out-of-plane vibrations of only S atoms in opposite directions, i.e., with a vibration along the stacking of MoS2, while the in-plane E12g mode results from the opposite vibration of two S atoms with respect to the Mo atom, and it is related to the lateral extension of the MoS2 sheets [49]. The asymmetry of both signals is indicative of a variety of sites located on small and differently sized MoS2 particles. From Figure 4a (enlarged view on the right side), a difference in the frequency values between the A1g and E12g modes of ≅20 cm−1 for MoS2/TiO2 bipy, of ≅19 cm−1 for MoS2/TiO2 n-sh, and of ≅25 cm−1 for the reference bare MoS2 can be calculated. Based on literature data [38,39,49,50], a relationship between the position of the A1g and E12g vibrational modes and the number of layers in the MoS2 particles, i.e., indicative of the slab thickness, can be established. Notably, the A1g frequency increases, while the E12g frequency decreases with the thickness, which provides insight into the evolution of the material dimensionality from 2D to 3D structures. Therefore, in order to explain the opposite direction of the frequency shifts, not only van der Waals interlayer coupling, which results in higher force constants and, thus, higher frequency values, but also the presence of long-range Coulombic interlayer interactions together with stacking-induced changes in intralayer bonding are considered [50].
However, by applying the known relationships [49] to MoS2/TiO2 bipy and MoS2/TiO2 n-sh frequency values (Figure 4a), a similar average stacking order of 2 ± 1 layers per particle can be estimated, in agreement with XRD and HRTEM analyses.
It is worth noting that in the case of highly dispersed supported MoS2, the particle roughness and curvature together with the growth of peculiar crystal faces and surface defects of the support may affect the shape and positions of the MoS2 Raman bands, thus meaning that the A1g and E12g mode frequencies cannot provide a clear indication of the MoS2 stacking order.
Lastly, on both MoS2/TiO2 bipy (red line) and MoS2/TiO2 n-sh (blue line), a small feature at about 200 cm−1 can be observed, due to LA phonons at the M point [51]. According to the authors, the intensity ratio between the LA(M) peak and each of the first-order peaks allows to quantify defects in single-layer MoS2, which states an analogy between the LA(M) peak in MoS2 and the D peak in graphene.
Moving to the Raman spectra recorded with the 442 nm laser line, in the 700–100 cm−1 range and in the 430–360 cm−1 enlarged view range, the typical anatase TiO2 fingerprints can also be recognized for both bipyramids and nanosheets (light red and light blue lines, respectively), although at lower frequency values due to plausible calibration effects (Figure 4b). However, it is noteworthy that the expected peak at 144–143 cm−1 of anatase is absent here, because a filter is used in the experimental setup [39]. From Figure 4b (enlarged view on the right side), a difference in the frequency values between the A1g and E12g modes of ≅21 cm−1 for MoS2/TiO2 bipy, of ≅20 cm−1 for MoS2/TiO2 n-sh, and of ≅25 cm−1 for the reference bare MoS2 (grey line) can be calculated. However, by applying even the aforementioned relationships [49] to MoS2/TiO2 bipy and MoS2/TiO2 n-sh (Figure 4b), an average stacking order of 2 ± 1 layers per particle can be proved, which is close to that obtained with the 514 nm laser line and in agreement with XRD and HRTEM analyses too. It is noteworthy that the intensity ratio between TiO2 and MoS2 peaks changes, moving from nanosheets to bipyramids particles, thus suggesting a larger amount of MoS2 domains on the TiO2 bipy surfaces (vide infra).

2.2. Optical Properties by UV-Vis Spectroscopy

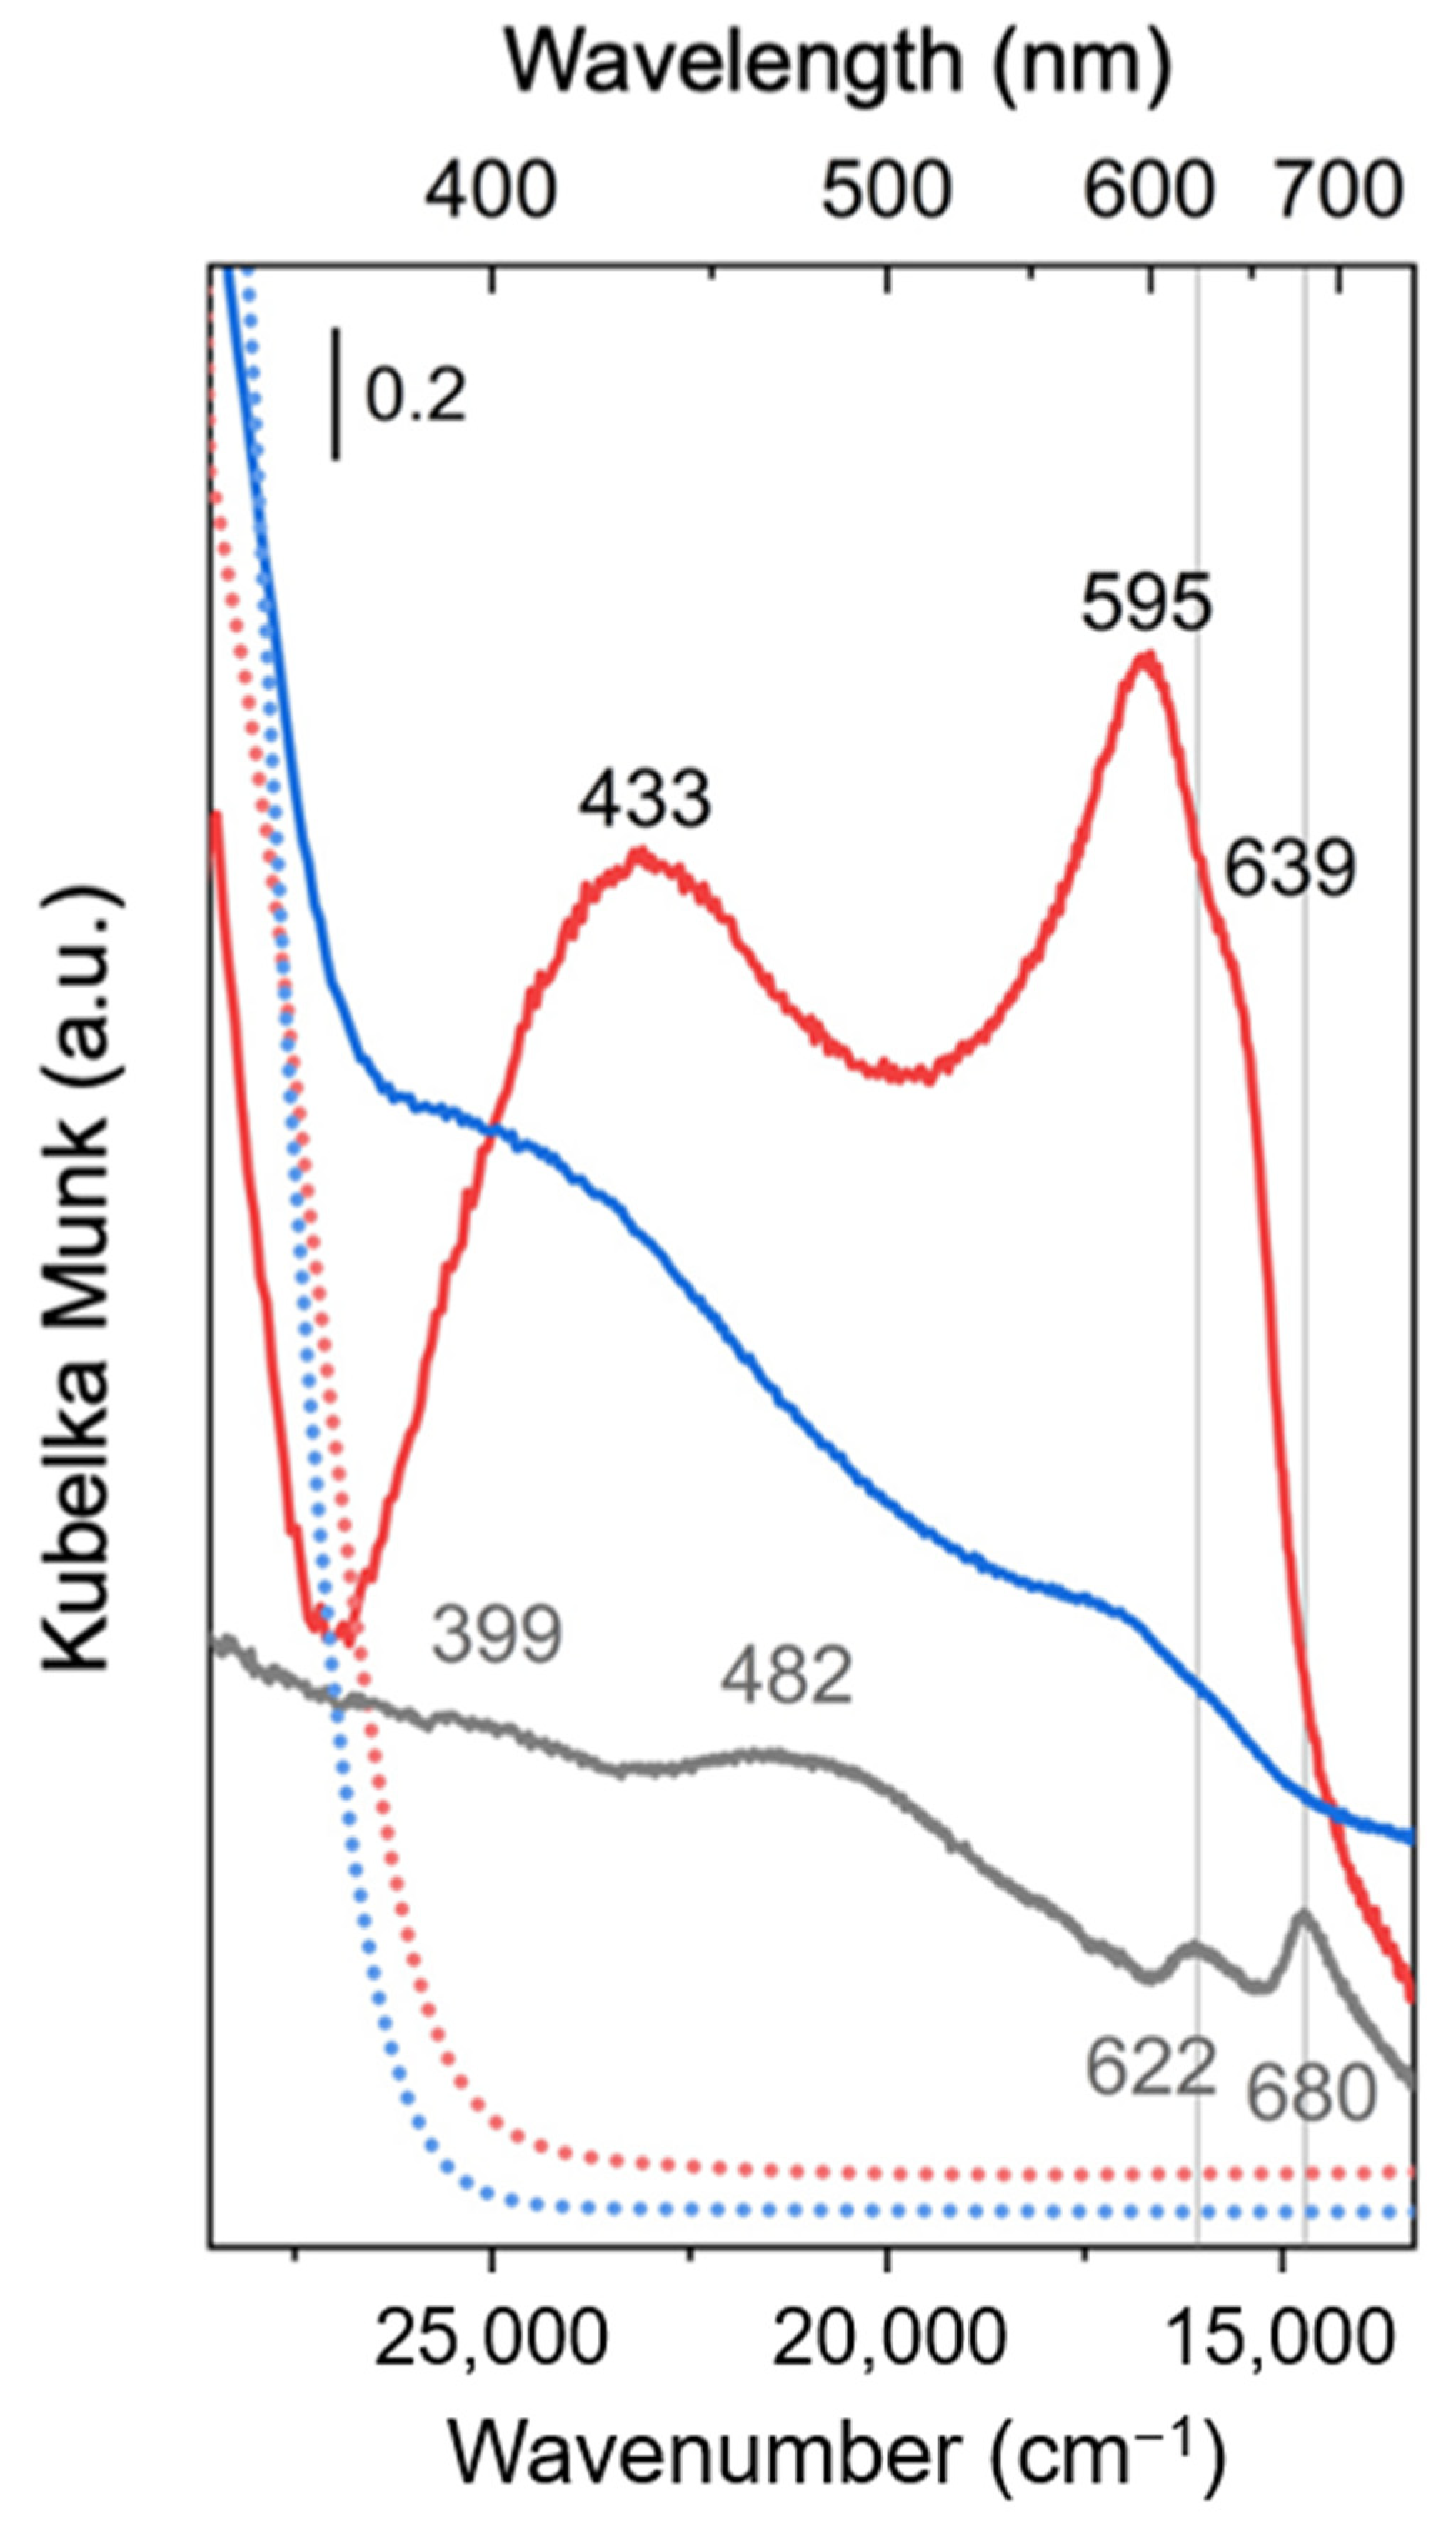
The optical properties of both the sulfided phase and the support, as well as the electronic structure of MoS2/TiO2 bipy and MoS2/TiO2 n-sh, are investigated by comparing their UV-Vis–NIR spectra with those of the TiO2 bipy, TiO2 n-sh, and bare MoS2 (Figure 5).
UV-Vis spectra of TiO2 bipy and TiO2 n-sh show the typical absorption edge of TiO2-based systems, due to the transition from the O2− antibonding orbital to the Ti4+ lowest-energy orbital [18]. Considering both systems in more detail, a slightly different energy gap can be observed. In this regard, the TiO2 n-sh particle thickness is less than that of TiO2 bipy [46], thus explaining the observed higher bandgap of the nanosheets, which could be due to quantum confinement effects.
According to literature data [52,53] and considering MoS2 reference spectrum (grey line), the peaks at 680 nm and 622 nm, on the low wavelength side of the 700 nm threshold, are assigned to the A and B direct excitonic transitions, respectively, at the K point of the Brillouin zone [40,41,52,53]. The two excitons are explained with interlayer interactions and spin-orbit splitting effects, that are known to increase with decreasing MoS2 particle sizes [42]. A second threshold, at about 500 nm, can be assigned also to a direct transition from the deep states in the valence band to the conduction band at the M point of the Brillouin zone. Another excitonic features at 482 nm (C) and 399 nm (D) are also observed on the low wavelength side of this transition [39]. Notice that, although C and D are assigned to direct exitonic transitions at M point, according to some authors [53], it cannot be ruled out the possibility that at least one of them is due to a direct transition at Γ point. Lastly a third threshold at about 350 nm was also ascribed to transitions from deep states in the valence band [40].
From a careful observation of the UV-Vis spectra of MoS2/TiO2 bipy and MoS2/TiO2 n-sh hybrid systems over the UV-Vis range, at first a wide and continuum absorption, due to the presence of new electronic states, can be highlighted. These are due to the mixing of sulfur 3p atomic orbitals with the TiO2 valence band, as a consequence of sulfur–oxygen exchange reactions at the surface of TiO2 nanosheets [17,39]. Concerning the A and B typical excitonic bands for MoS2/TiO2 bipy and MoS2/TiO2 n-sh hybrid systems, it is noteworthy that they are shifted to higher energies as compared to those of MoS2 bulk, although to a lesser extent for MoS2/TiO2 bipy as compared to the MoS2/TiO2 n-sh system.
This behavior is explained in terms of quantum size effects, related to the MoS2 particle dimensions. In particular, depending on the cluster size, a higher dependence of the frequency shift for C, D excitonic bands has been observed. Therefore, the frequency values of A and B excitons are only slightly blue shifted, whereas remarkable shifts are observed for the C and D excitons [37]. Notice that C and D excitons overlap inside a broad band, as expected for a widely dispersed supported material. These conclusions are in agreement with HRTEM and XRD results
Lastly by comparing MoS2/TiO2 bipy and MoS2/TiO2 n-sh systems, due to the higher energy of the excitonic transitions in the MoS2/TiO2 n-sh system, we can state that the quantum size effects are prevalently concerning with the low dimensionality along c direction, i.e. with the number of layers, although the intra-layer small dimension of MoS2 platelets can also play a role [54]. By the way, we can conclude that our Raman and UV-visible results are in agreement with the data reported by [46].

2.3. Surface Vibrational Properties by FTIR Spectra of CO Adsorbed on MoS2/TiO2 n-sh and on MoS2/TiO2 Bipy

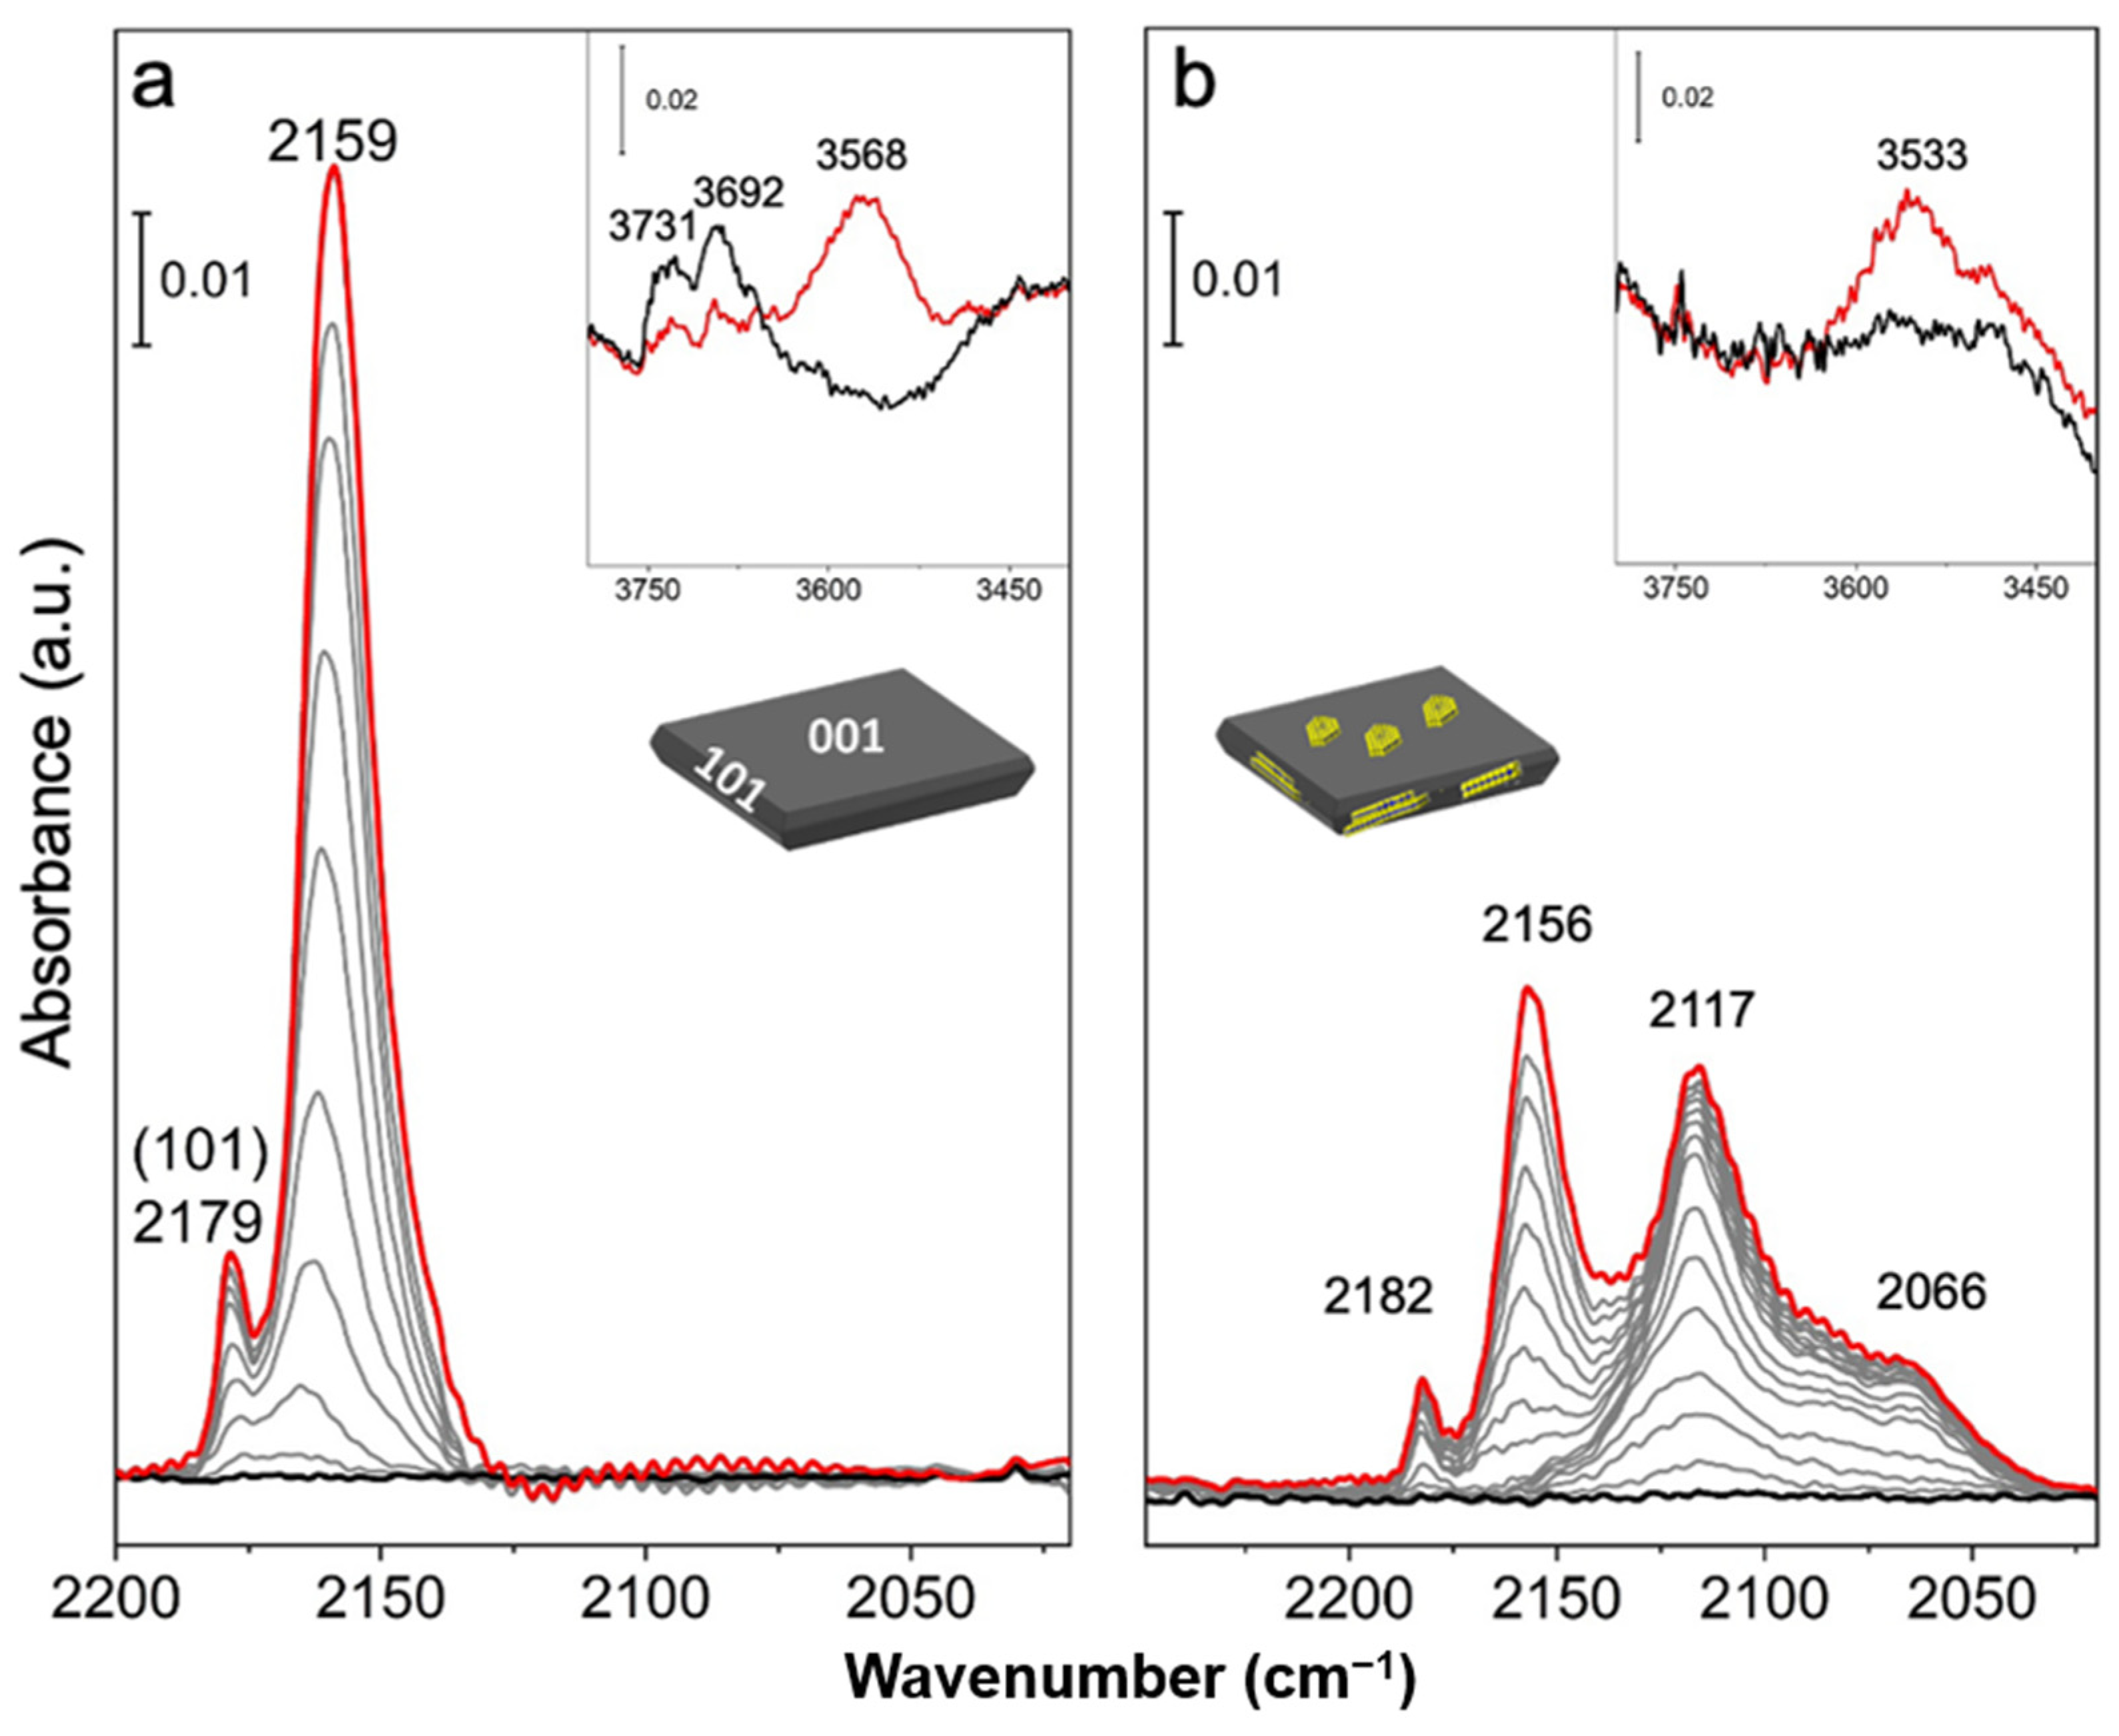
FTIR spectra of CO adsorbed at liquid nitrogen temperatures, at decreasing coverages up to the residual pressure of 4 × 10⁻⁴ Torr, on the surface of TiO2 n-sh, pretreated at 873 K, and of MoS2/TiO2 n-sh (Mo 3 wt.%) pretreated at 673 K (Figure 6a,b) are compared with those of TiO2 bipy pretreated at 873 K and of MoS2/TiO2 bipy (Mo 3 wt.%) pretreated at 673 K (Figure 7a,b).
Therefore, FTIR spectra of CO adsorbed on TiO2 n-sh and MoS2/TiO2 n-sh surfaces [6] can be taken into account, with the aim to compare them with those on TiO2 bipy and MoS2/TiO2 bipy samples.
It is worth noticing that the sulfidation treatment has an influence also on the support matrix (data not reported, for sake of brevity).
The main envelope centered at 2159 cm−1, fully reversible upon CO outgassing (Figure 6a), is due to CO species interacting with the residual surface OH groups on the Ti4+ sites located on both (1 × 4) reconstructed (001) and (101) surfaces of the TiO2 n-sh sample, whereas the minor feature observed at 2179 cm−1, almost unaffected by CO outgassing, can be assigned to CO molecules adsorbed on (101) surfaces, less extensive than (001), according to the published data [46]. The complete reversibility of the 2159 cm−1 band is indicative of the weakness of CO interaction on OH groups on Ti4+ sites [18]. With regard to this, the bands at 3731 and 3692 cm−1, due to the stretching mode of hydroxyl groups present on both the (001) and (101) surfaces, are shifted to lower frequency after CO adsorption, thus giving rise to a broader feature centered at 3568 cm−1 (inset of Figure 6a). The original spectral profile of the hydroxyl groups is fully restored by decreasing the CO gas pressure (spectra not reported for the sake of brevity) together with the progressive disappearance of the 2159 cm−1 band.
As far as the CO spectra on MoS2/TiO2 nanosheets (Mo 3 wt.%) are concerned (Figure 6b), at first, a decreased intensity of the adsorption signals on (101) and (001) surfaces is observed, compared to CO spectra on pure TiO2 n-sh. This fact is explained with a few MoS2 slabs decorating small surface regions on both {001} and {101} facets, thus causing a lower number of available Ti4+ and OH sites to interact with CO probe molecules.
In particular, the features at 2179 and 2159 cm−1, already assigned on previous systems to CO molecules adsorbed on Ti4+ sites on (101) and on OH groups on both (001) and (101) surfaces, respectively, are now observed at 2182 and 2156 cm−1, with a different intensity ratio.
It is worth noting that the asymmetry on the low-frequency side of the band centered at 2156 cm−1 can be explained with CO physisorption on heterogeneous surface sites, including sulfur anions and SH groups, in addition to a few residual OH groups on the (001)/(101) planes of crystalline MoS2 [55].
In this regard, the wide band observed in the 3600–3400 cm−1 interval (inset of Figure 6b) could be associated with the formation of surface H2O as a consequence of the oxygen-sulfur exchange and/or of H2S interaction with surface –OH groups (bonded to Ti4+) to give rise to hydrogen bonds. Moreover, after CO adsorption, no frequency shift can be observed, thus meaning that OH groups are covered by a few MoS2 slabs and are, thus, no longer available for any interaction [17,18,39].
However, in the 2130–2050 cm−1 range, two significant features, at 2117 and 2066 cm−1, downshifted with respect to the CO free molecule (2143 cm−1), indicate the formation of surface sites characterized by π-backdonation characteristics (Figure 6b) [56]. In particular, the band at 2117 cm−1 can be ascribed to the Mox+ species (x < 4) located on defective sites (e.g., edges), while the 2066 cm−1 one could be due to the interaction of CO with Mox+ species (x < 4) located on highly coordinatively unsaturated (cus) sites such as corners [38]. Such bands are the last to disappear by outgassing and this finding further confirms the presence of isolated and cus molybdenum species on defective sites associated with sulfur vacancies, which belong to thin and uniformly distributed MoS2 slabs, in agreement with Raman and XRD analyses [17].
FTIR spectra of CO adsorbed at 77 K at decreasing coverages up to the residual pressure of 4 × 10⁻⁴ Torr, on the surface of TiO2 bipy (pretreated at 873 K) and of MoS2/TiO2 bipy (Mo 3 wt.%) (pretreated at 673 K), are shown in Figure 7 a,b.
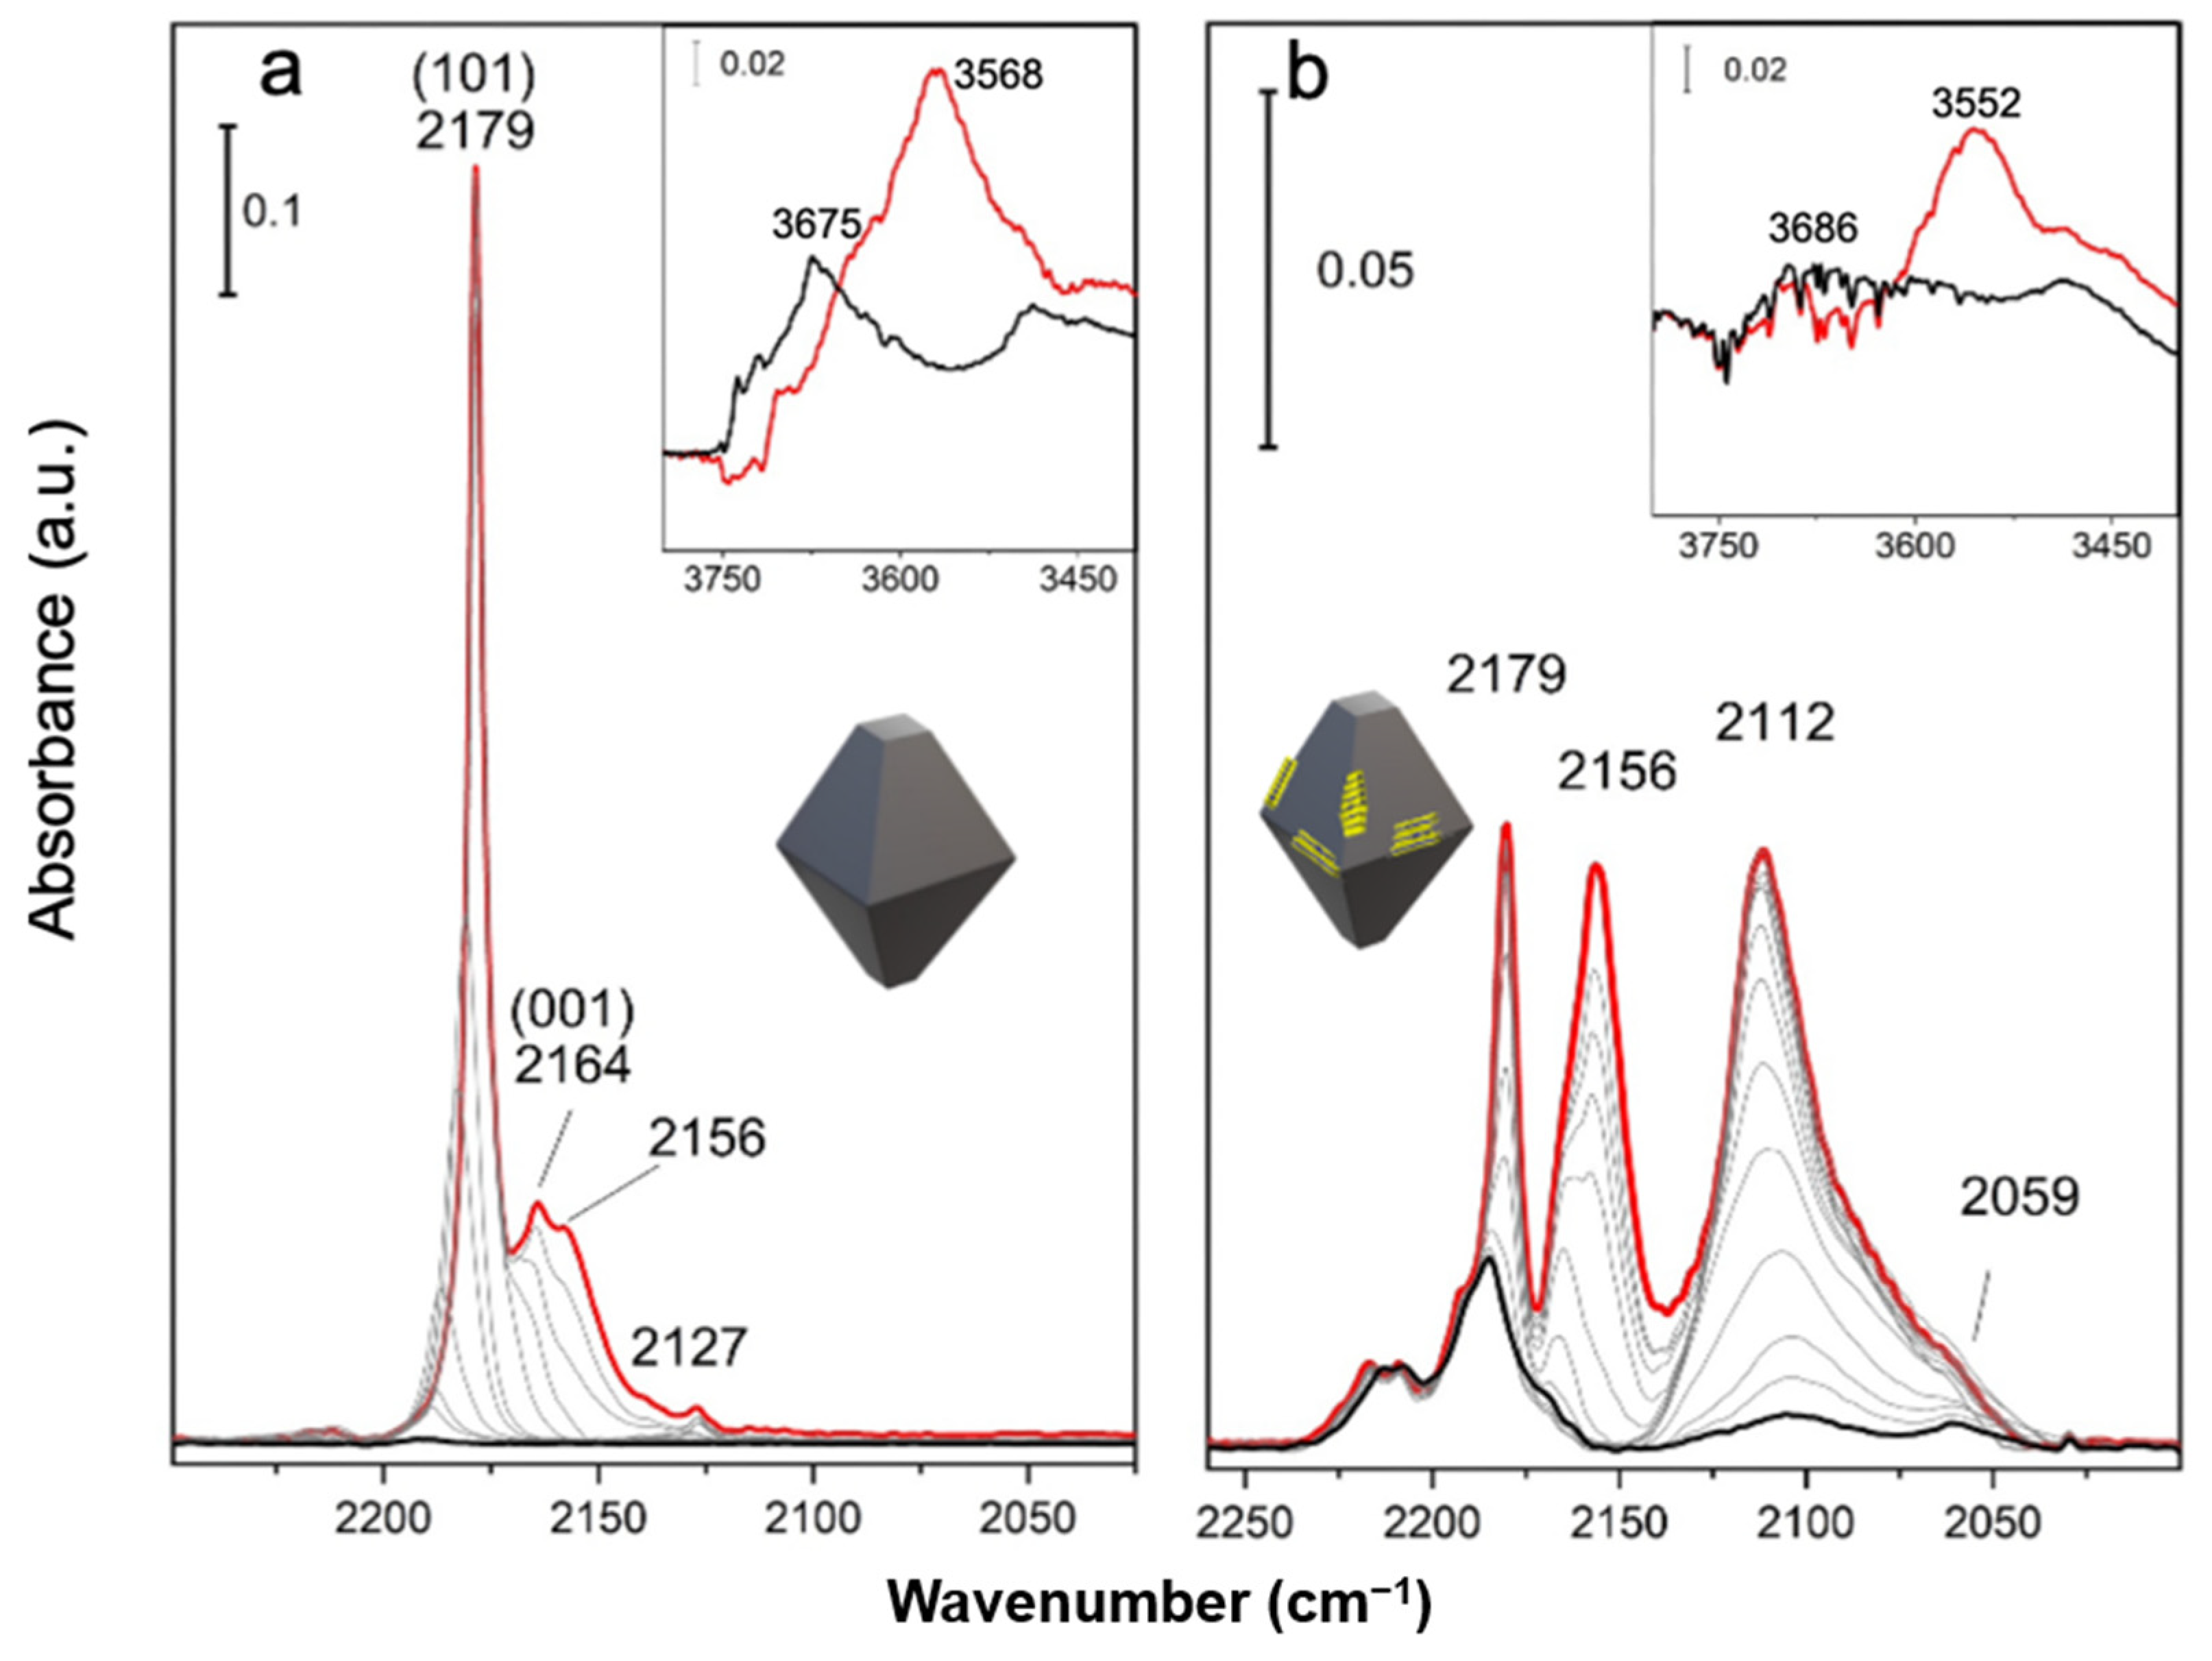
Unlike the CO spectra on TiO2 n-sh, the main feature of the CO adsorbed on the TiO2 bipy sample is the band at 2179 cm−1 assigned to the CO molecules adsorbed on Ti4+ sites on (101) surfaces, which, by decreasing the coverage, shifts reversibly to 2190 cm−1, that is, the frequency of the isolated CO molecule (vCO singleton) (Figure 7a). The full-width at half-height of this band (FWHM = 4 cm−1) is an indication of crystallites delimited by very large, regular (101) surfaces with no defects. The less intense band at about 2164 cm−1 is due to the interaction of CO with Ti4+ sites on the less extended (001) surfaces, which also decreases faster than the band at 2179 cm−1 as the CO coverage decreases. The high reversibility means a weak interaction on Ti4+ sites on (001) surfaces, which behave as even weaker Lewis acid sites. The shoulder around 2156 cm−1 indicates the presence of hydrogen interactions between CO and residual OH groups on the surface, located in defective positions (edges, vertices, and steps), as confirmed by the wide band centered at 3675 cm−1, which shifts to 3568 cm−1 after CO interaction (inset in Figure 7a) [40]. It is worth noting that the component at 3731 cm−1, before being ascribed to OH groups on highly reactive Ti4+ sites of the TiO2 n-sh (001) surface, is now missing.
The weak signal at 2127 cm−1 is finally related to the adsorption of the naturally occurring 13CO isotope.
As for the CO spectra on MoS2/TiO2 bipy (Figure 7b), significant changes can be observed. The features at 2179 cm−1 and 2156 cm−1, already assigned to CO molecules adsorbed on Ti4+ sites on (101) and on residual OH groups, respectively, are also observed, but with a lower intensity and with a different intensity ratio. It is noteworthy that, as the CO coverage decreases, a weak feature on the high-frequency side of the 2156 cm−1 band, already assigned to CO interaction with Ti4+ sites of the (001) surfaces, appears. In addition, the wide and small band at 3686 cm−1, in the hydroxyl region (inset of Figure 7b), plausibly due to residual OH groups on the main (101) surfaces, shifts to 3552 cm−1 as a consequence of CO interaction. The general decrease in intensity can be due to the presence of new Mox+ species, masking the Ti4+ sites, which are no longer available for interactions with CO [17,18].
Unlike before, however, the complete desorption of CO from the Ti4+ sites on (101) (feature at 2179 cm−1) does not take place, thus indicating a strong energy interaction. In addition, two signals in the 2130–2050 cm−1 range, i.e., at 2112 cm−1 and at 2059 cm−1, can be ascribed to reduced Mox+ species (x < 4) located on defective sites (e.g., edges).
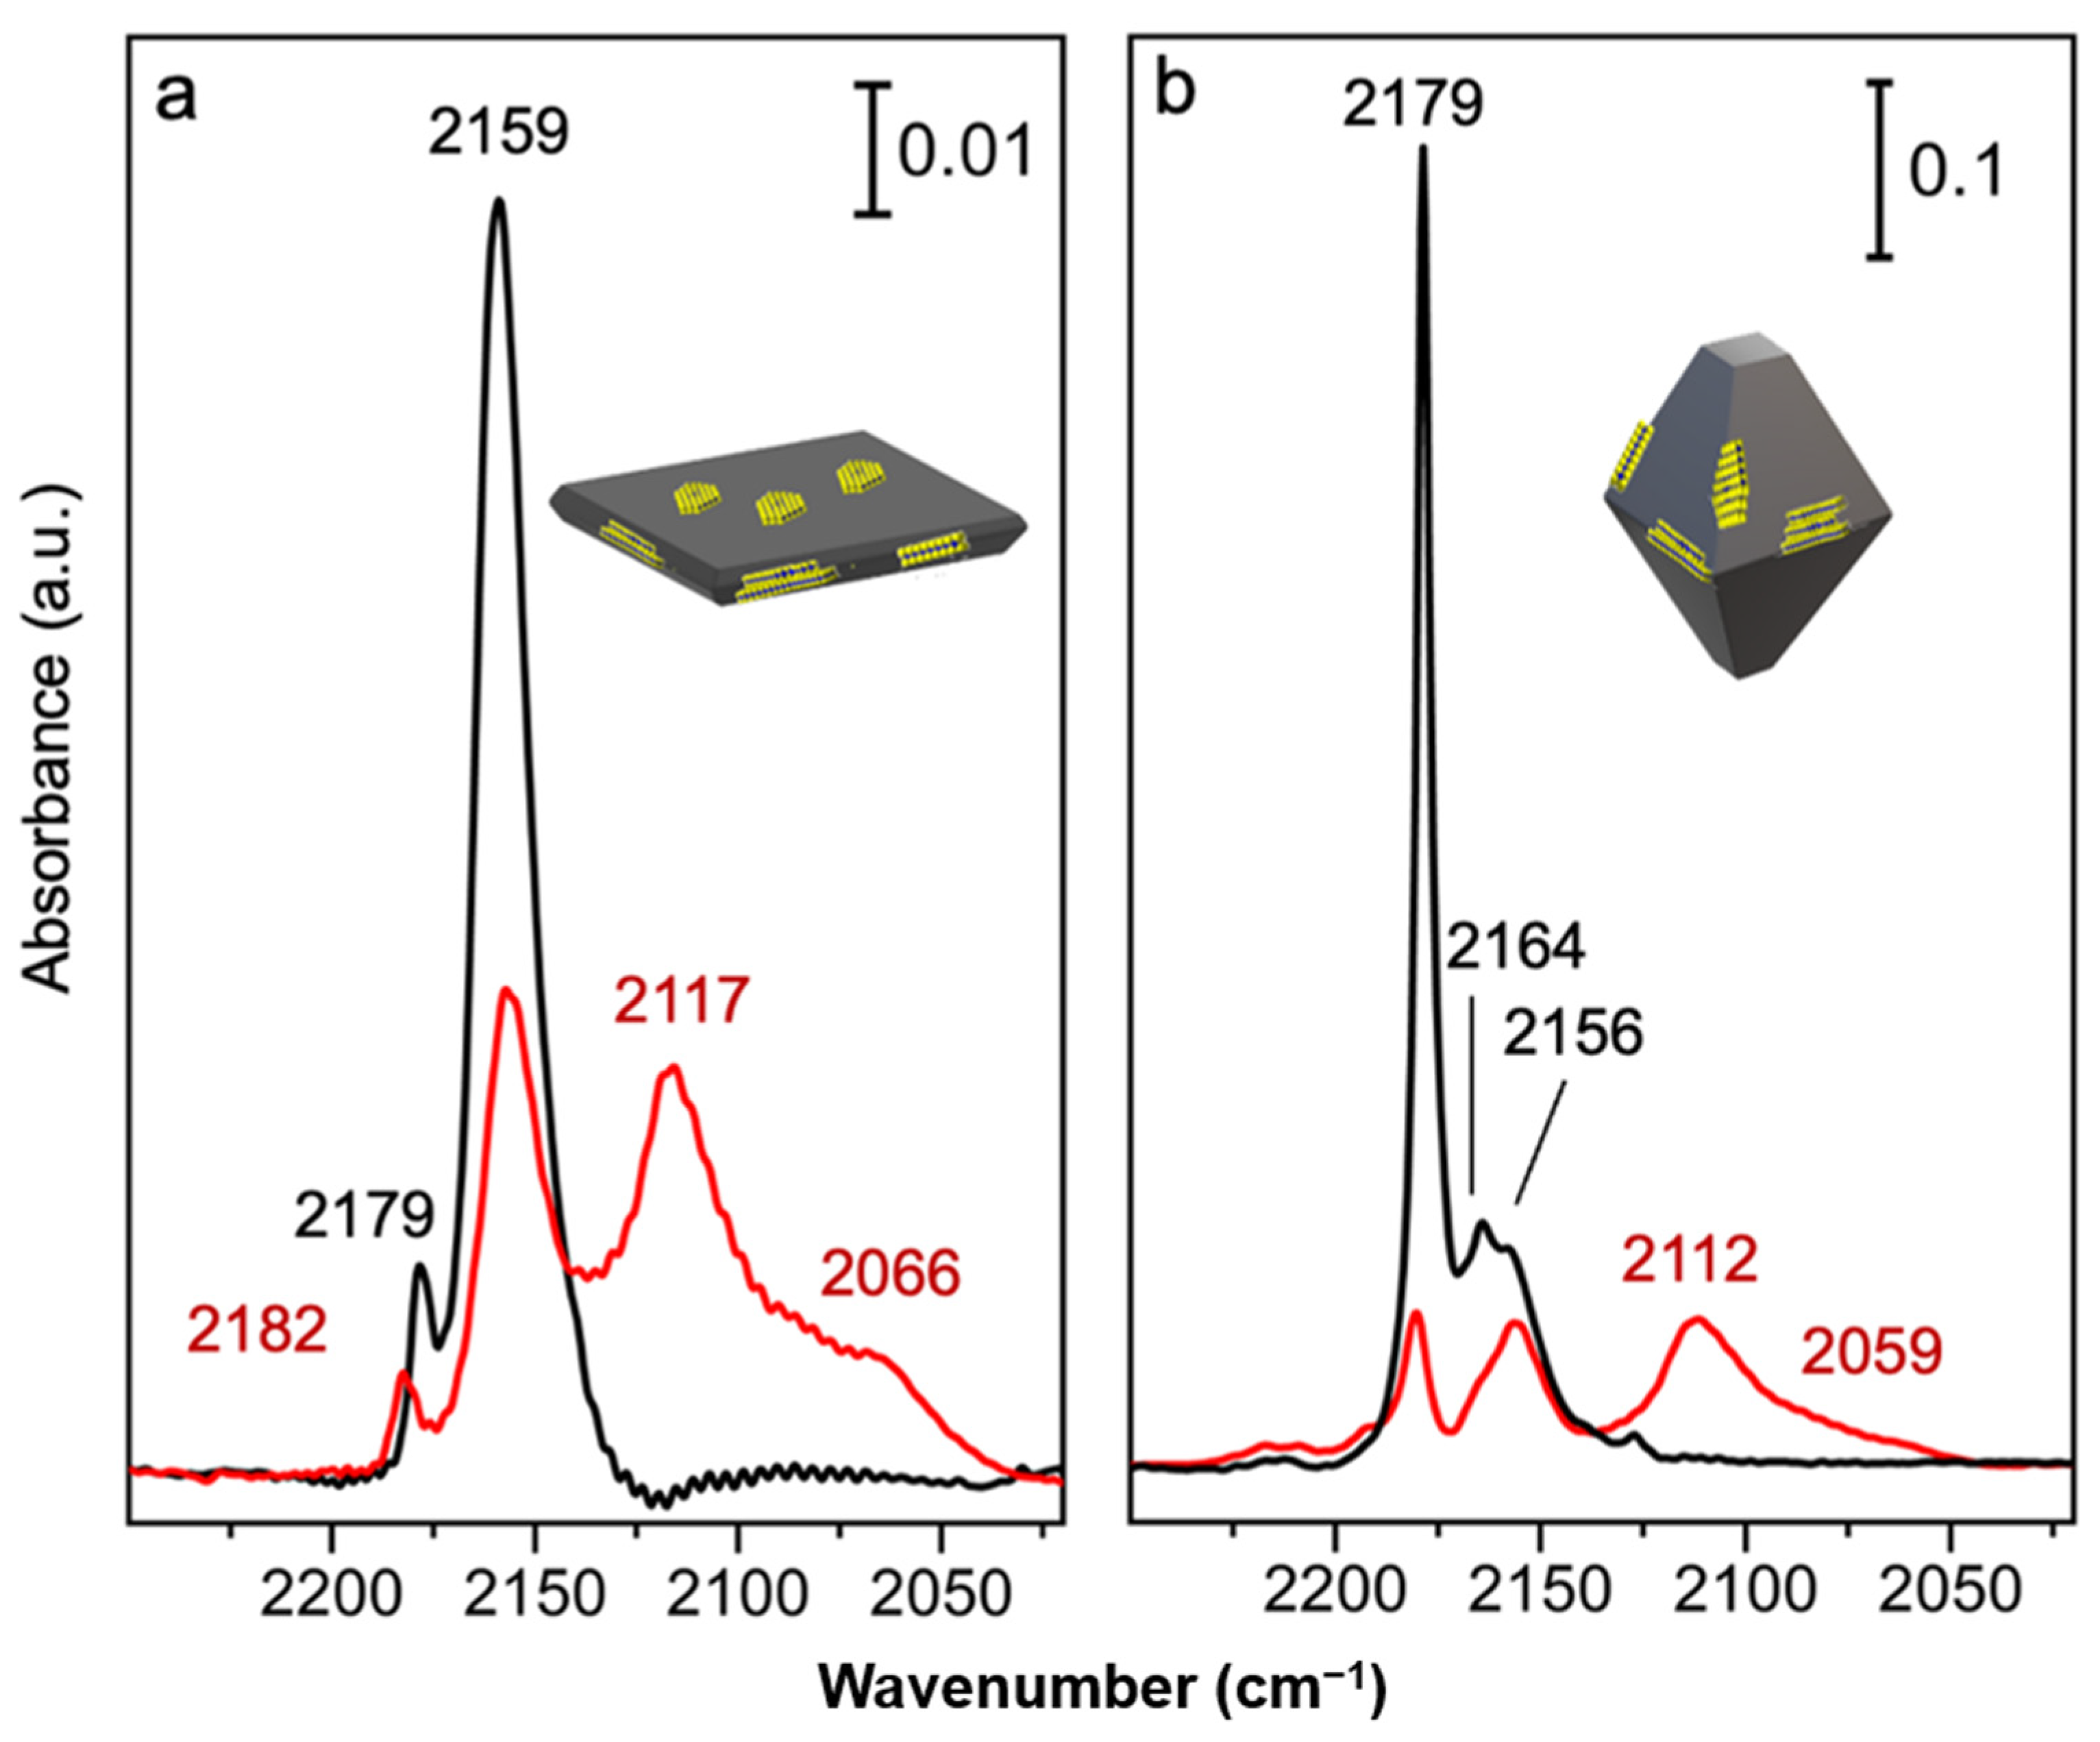
Lastly, FTIR spectra of CO adsorbed (at 77 K at maximum coverage) on TiO2 n-sh and MoS2/TiO2 n-sh, and on TiO2 bipy and MoS2/TiO2 bipy are all compared in Figure 8a,b, respectively.
We can conclude that the spectrum of CO on the MoS2/TiO2 bipy heterostructure shows a significant intensity decrease of overall signals with respect to CO on TiO2 bipy, with this behavior even being more remarkable when compared to the CO interaction on MoS2/TiO2 n-sh and on TiO2 n-sh. This could be explained with a larger amount of MoS2 domains covering the TiO2 bipy surfaces. According to many authors, despite the lattice mismatch between MoS2 and TiO2 [57], the Mo oxysulfide species are responsible for the grafting of MoS2, either in a parallel or perpendicularly oriented shape at the surface of TiO2 nanoparticles [39,58]. Density Functional Theory (DFT) calculations, in addition, show a favorable epitaxial relation between the MoS2 edge sites and (101) anatase surfaces, thus explaining the observed numerous MoS2 domains on the TiO2 bipy surfaces [59].

2.4. Photocatalytic Activity

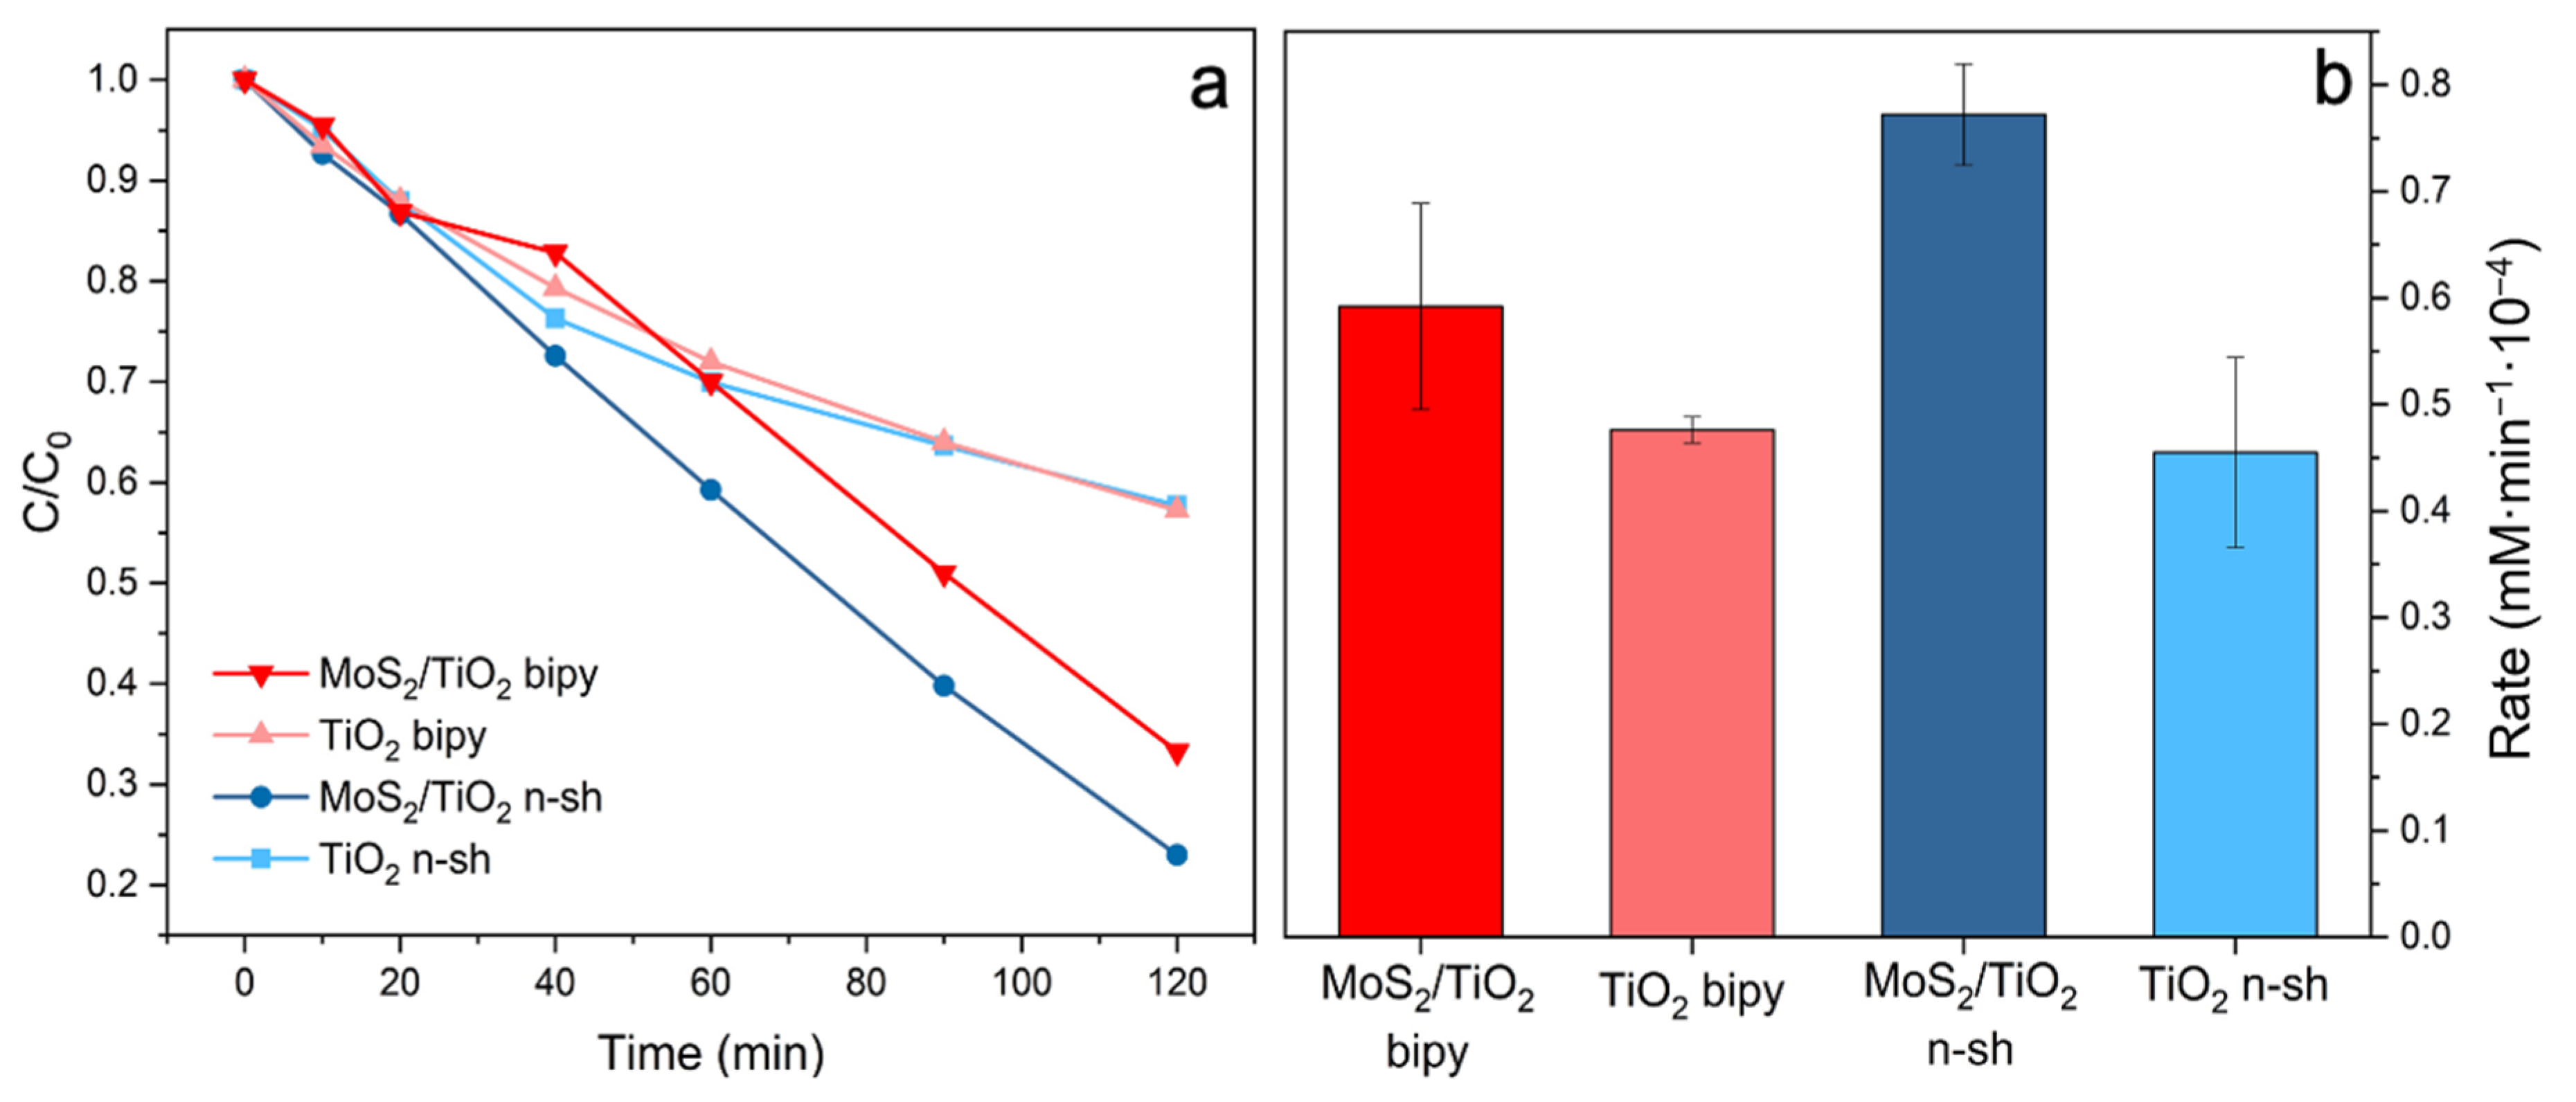
The photocatalytic properties of all the samples are investigated by measuring the decomposition rates of phenol under UV-irradiation (t = 120 min, λmax = 365 nm) in HClO4 solution. Results are shown in Figure 9 and Figure S2.
By comparing the photocatalytic activity of all systems, the fast and continuous decrease in the phenol absorbance intensity can be observed, when phenol mixes with pure and hybrid systems under UV-vis light illumination (Figure 9a and Figure S2).
In Figure 9b, the remarkable role of the MoS2/TiO2 heterostructures in the phenol decomposition rate can be highlighted. More in detail, it is inferred that on TiO2 n-sh and TiO2 bipy, the photodegradation rate is quite comparable, whereas on MoS2/TiO2 n-sh and on MoS2/TiO2 bipy heterostructures, a significant enhancement can be evaluated, being more relevant on MoS2/TiO2 n-sh heterostructures. The degradation rate of phenol from its initial concentration C0 could be described by a pseudo-first-order kinetics reaction, in agreement with the Langmuir–Hinshelwood model: ln (C0/C) = kt, where k is the apparent first-order constant, as obtained in Figure 9b. The obtained degradation rates are in the following order: TiO2 n-sh ≈ TiO2 bipy < MoS2/TiO2 bipy < MoS2/TiO2 n-sh, thus confirming the enhanced photoactivity of MoS2/TiO2 heterostructures with respect to the pristine TiO2 systems. Considering the pristine TiO2 n-sh and TiO2 bipy, the simultaneous presence of (001) and (101) coexposed surfaces, although with a different ratio (for TiO2 n-sh: (001)/(101) = 58%/42% and for TiO2 bipy: (001)/(101) = 13%/87% [46]), is known to give rise to a crystal heterojunction, where photoinduced electrons flow to (101) surfaces, while photoinduced holes flow to (001) surfaces, thus improving the separation efficiency of photoinduced carriers [60]. Hence, despite the higher extension of the more unstable (001) surfaces on TiO2 n-sh, together with the slightly lower band gap with respect to TiO2 bipy, an almost similar photoactivity can be highlighted, with the (001) and (101) surfaces being more effective in phenol oxidation and reduction, respectively.
As for hybrid heterostructures, the photocatalytic activity can be improved. Such an enhancement is due to the presence of MoS2 nanoparticles, which play a role in reducing charge carrier recombination even more.
More in detail, the MoS2/TiO2 bipy heterostructure, because of the prevailing extension of (101) TiO2 surfaces, could be considered similar to the heterojunction made by P25 with MoS2, where some carrier recombination effects cannot be ruled out [44]. Conversely, on MoS2/TiO2 n-sh, the ”double heterojunction” made by combining a crystal heterojunction between (101) and (001) TiO2 surfaces and a heterojunction between MoS2 and (001) facets of TiO2 has a relevant role in affecting the relative position of the conduction and valence bands. As a result of a synergistic effect, the photoinduced holes and electrons produced in TiO2 can flow into MoS2 and (101) TiO2 surfaces, respectively, thus avoiding charge recombination on MoS2. Based on the aforementioned synergistic effect occurring in the “double heterojunction” between MoS2 and TiO2 (101), (001) surfaces on MoS2/TiO2 n-sh, we can explain the higher photoactivity toward phenol degradation shown by the MoS2/TiO2 n-sh, when compared with the MoS2/TiO2 bipy heterostructure.

3. Materials and Methods

3.1. Synthesis of the Samples

The synthesis of both TiO2 nanostructures is briefly summarized hereafter, because an extensive literature is well known on this theme [6,46,61,62].

3.1.1. TiO2 Nanosheets

TiO2 nanosheets were obtained via a solvothermal procedure, that is, 25 mL of Ti(OBu)4 (titanium (IV) butoxide) was poured in a 150 mL Teflon-lined stainless-steel reactor and 3.5 mL of concentrated hydrofluoric acid was added dropwise under stirring, at 523 K for 24 h. The resulting bluish paste was centrifuged and washed with acetone to remove the residual organics and then with water. Finally, the obtained aqueous suspension was freeze-dried, thus obtaining bluish-powder TiO2 nanosheets (hereafter TiO2 n-sh). The subsequent steps are skipped for sake of brevity [6,63,64,65]. We only remind readers that calcination in air at 873 K, for 60 min, and then cooling down to 298 K in the closed furnace for approximately 10 h were performed to remove the bulk and the surface fluorides.

3.1.2. TiO2 Bipyramidal Nanoparticles

Truncated bipyramidal TiO2 nanoparticles, hereafter named TiO2 bipy NPs [46], were obtained by hydrolysis of a 40 mM aqueous solution of Ti (TeoaH)2 complex (TeoaH = triethanolamine; initial pH 10), carried out by hydrothermal treatment at 493 K for 50 h in an autoclave. The procedure is similar to that developed by Sugimoto but without the intermediate gelation step [66]. Further details on the preparation of TiO2 bipy NPs, which show a bipyramidal shape, mainly limited by {101} facets, can be found in [62,67].

3.1.3. Synthesis of the MoS2/TiO2 n-sh (Nanosheets) and MoS2/TiO2 Bipy (Bipyramids) by In Situ Method

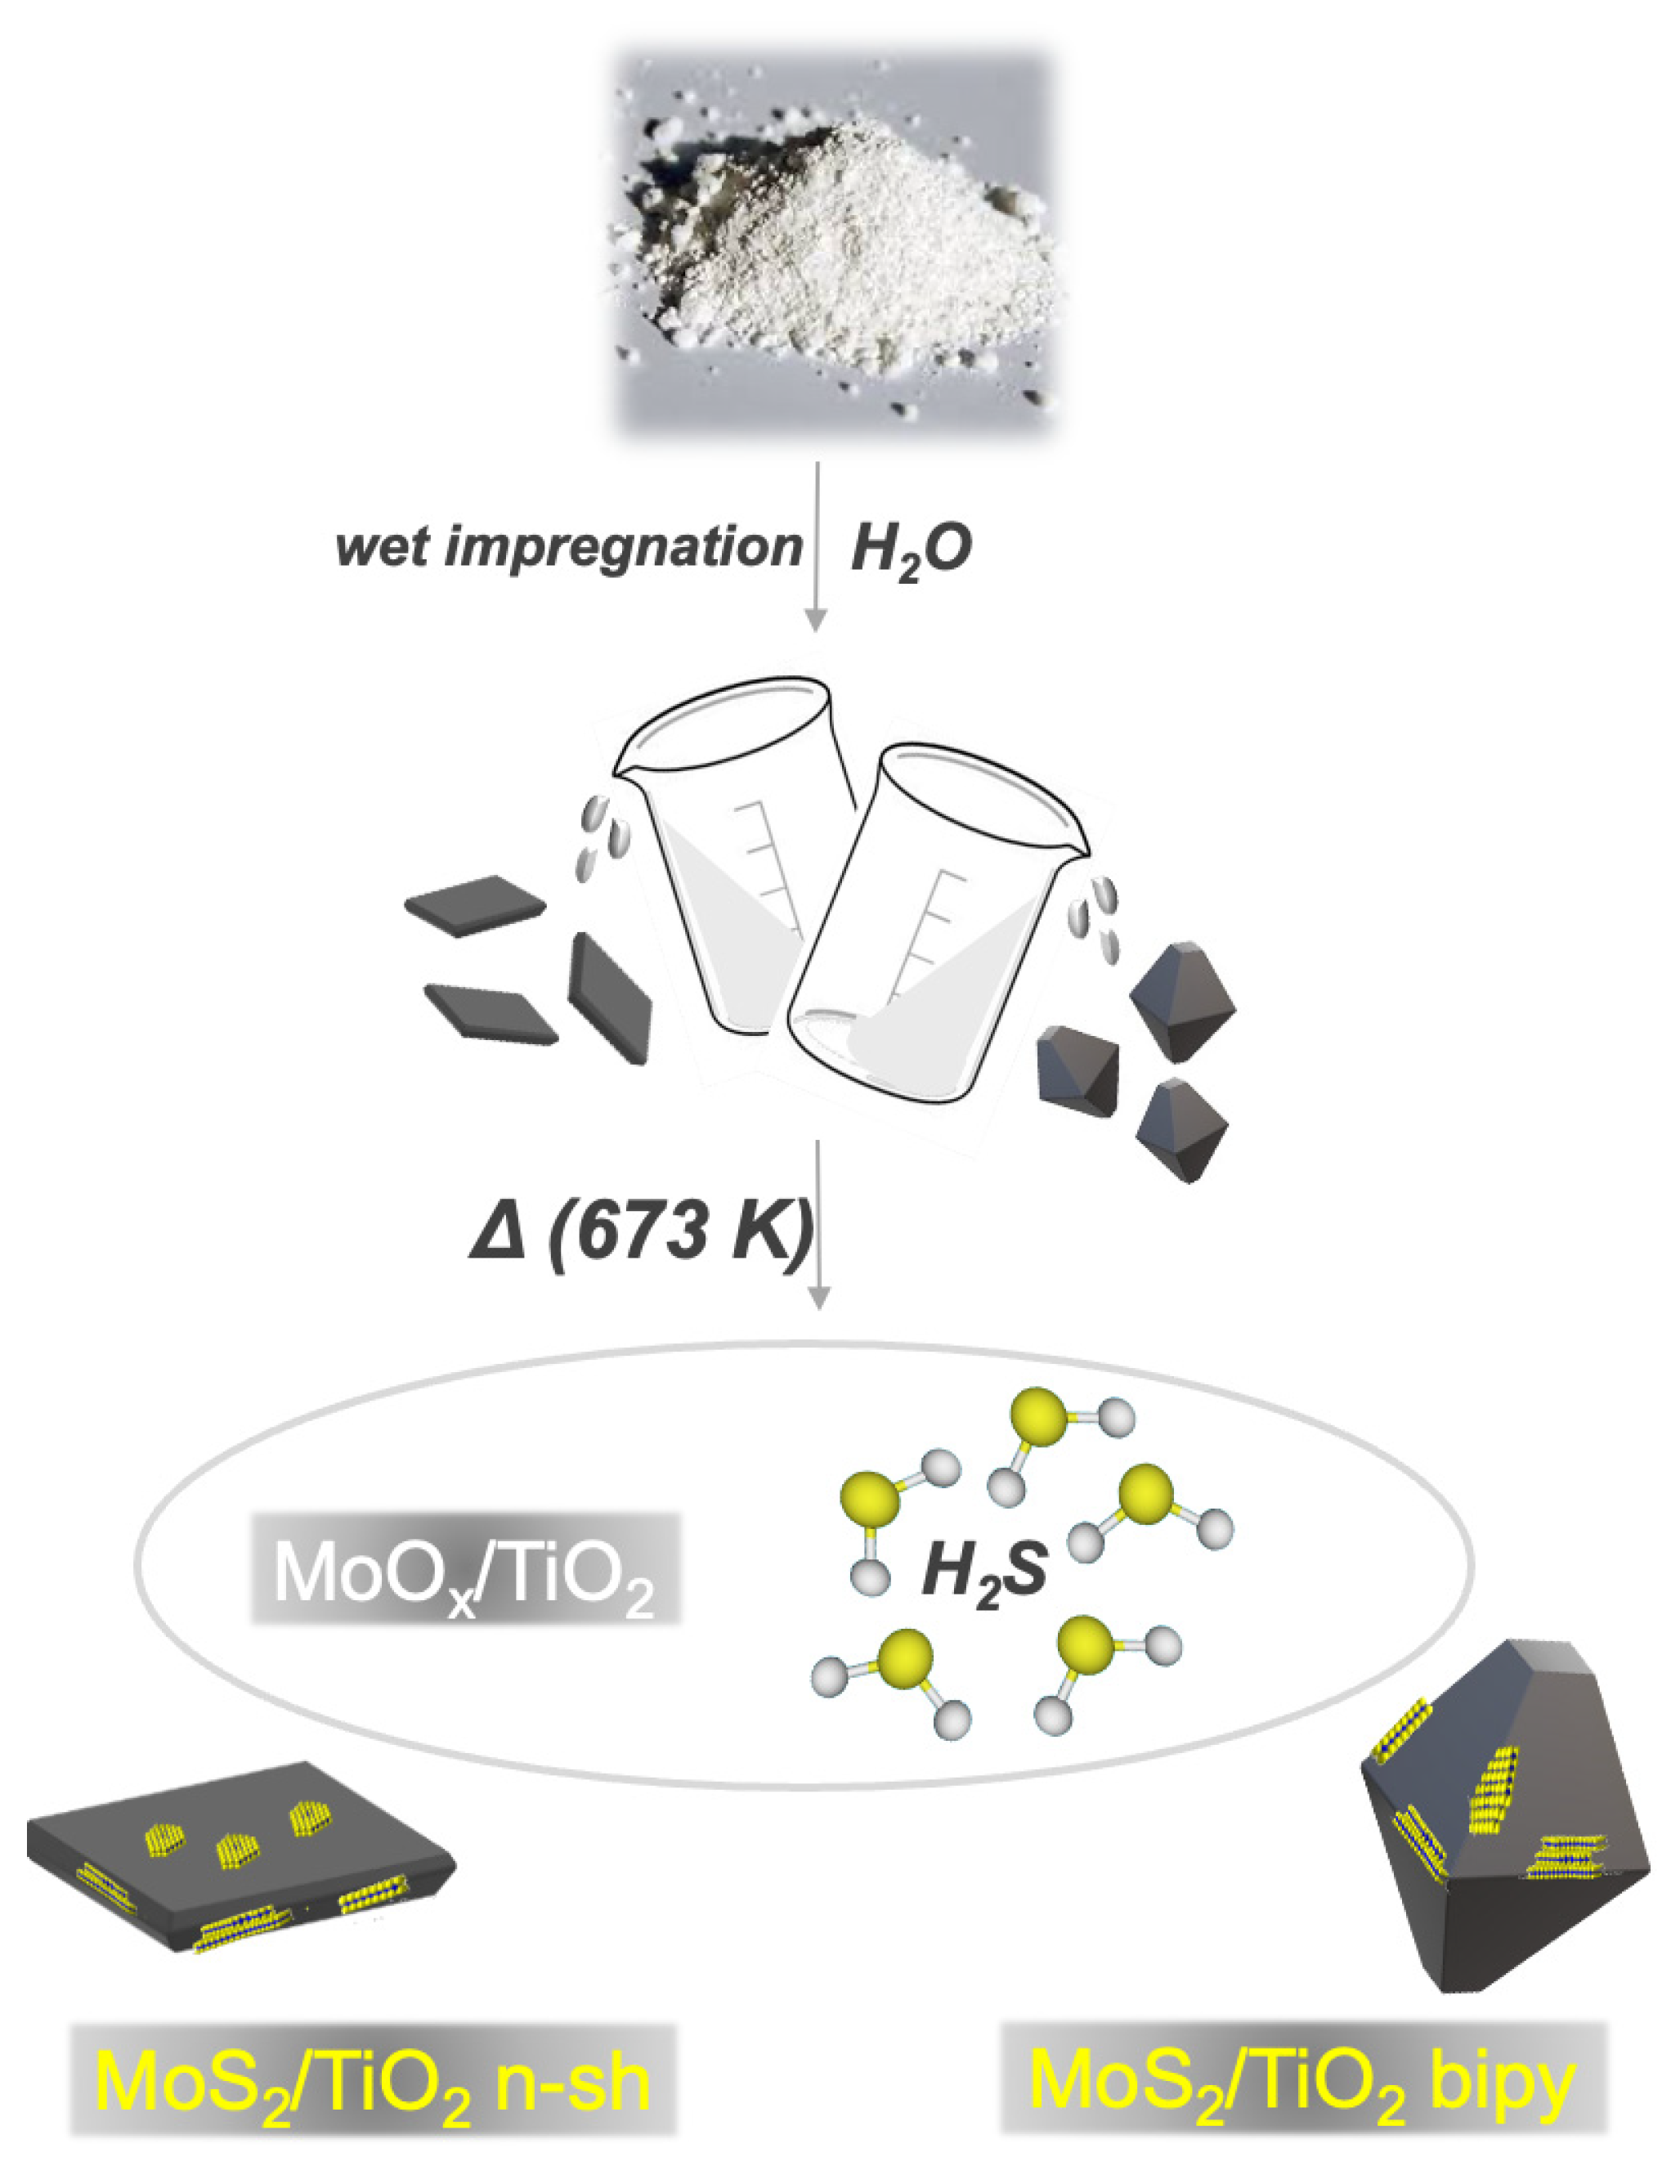
The same adopted procedure to obtain MoS2-decorated TiO2 nanosheets was carried out also to obtain MoS2-decorated TiO2 bipyramids. As already described in our previous paper [6], to which we refer the reader for more details, a distilled water solution of 0.066 g of ammonium heptamolybdate (AHM, (NH4)6Mo7O24·4H2O) was prepared first. Then, the solution was dripped onto the TiO2 bipyramids powder (2 g) and mixed with a glass rod. The mixture was placed in an oven at 323 K overnight, to obtain hybrids with Mo 3% by weight. Then, the obtained powder was pressed in a self-supporting pellet by means of a hydraulic press and inserted in a gold frame (suitable for FTIR measurements in situ). Later, the decomposition of AHM into molybdenum oxide (MoOx) and the removal of ammonia and water were taken by heat treatment in air at 673 K for 12 h, having set a temperature ramp of 5 K per minute. The MoOx sample was activated under dynamic vacuum at 673 K for 30 min, and then twice-oxidized in oxygen atmosphere (40 Torr) at the same temperature and time. The oxidized sample was sulfided at 673 K, in the H2S atmosphere (30 Torr) for 1 h, then outgassed. The sulfidation process was carried out twice. The main steps for both samples are summarized in Scheme 1.

3.2. Characterization Methods

The structure and morphology of the samples were investigated by employing the following techniques:
(i) X-ray diffraction (XRD) patterns of samples were collected with a PANalytical PW3050/60 X’Pert PRO MPD diffractometer (Amsterdam, Netherlands) with a Cu anode and a Ni filter, in Bragg–Brentano configuration. The 2θ range was from 10° to 80° with a step size of 0.02°.
(ii) High-resolution transmission electron microscopy (HRTEM) images were obtained with a JEOL 3010-UHR HRTEM microscope (Tokyo, Japan) operating at 300 kV with a point-to-point resolution of 0.12 nm, equipped with a 2 k × 2 k pixels Gatan US1000 CCD camera.
(iii) Micro-Raman spectra were acquired in backscattering mode using a Renishaw InVia Raman spectrophotometer (Wotton-Under-Edge, UK), equipped with an Ar+ laser emitting at 514.5 nm (20× ULWD obj) and an He/Cd laser emitting at 442 nm (5× obj). The backscattered lights were analyzed by a grid with 1800 lines/mm (for the 514 nm light) and with 2400 lines/nm (for the 442 nm light), then detected by a Peltier cooled CCD detector, with 1 cm−1 resolution. The effects of the radiation damage on the samples were reduced by employing 10% of the total laser’s emitted power (final power at the sample less than 1 mW) and adopting a homemade setup that allowed the samples to be rotated under the laser beam [68]. This also increased the statistical significance of the measurements [69].
(iv) FTIR spectra were acquired by means of a Bruker IFS 66 FTIR spectrometer (Billerica, MA, USA) equipped with a cryogenic MCT detector with 2 cm−1 resolution. Each sample was pressed in the form of a self-supporting pellet with an “optical thickness” of ca. 10 mg·cm−2. To investigate the surface properties, the CO probe molecule was dosed on samples by means of a gas manifold connected to the IR cell, thus allowing us to perform thermal treatments under vacuum and a gas dosage. The spectra were collected after a CO dosage (40 Torr) at 77 K in an IR cell designed for liquid N2 flow conditions.
(v) The optical properties of the powder samples were studied by means of diffuse reflectance (DR) mode. A Cary 5000 UV-Vis-NIR spectrophotometer (Agilent Technology, Santa Clara, CA, USA), equipped with a diffuse reflectance sphere, was used in the 2500–190 nm wavelength range.

3.3. Photocatalytic Activity

The photocatalytic activities of MoS2/TiO2 n-sh and MoS2/TiO2 bipy, also compared with those of native TiO2 n-sh and TiO2 bipy powders, were evaluated by irradiating the suspensions of the samples (loading 100 mg L−1; pH = 6.5) in cylindrical Pyrex glass cells under magnetic stirring (4 cm diameter, 2.5 cm height, area of 1.26 × 10⁻³ m2, cutoff 295 nm, and 5 mL suspension volume), using a fluorescent source with λmax = 365 nm (Philips PL-S 9W BLB, integrated irradiance = 10 W m−2). Although the phenol absorption on TiO2 was negligible, before irradiation, the suspension with the substrate was stirred under dark conditions to achieve the equilibrium [70].
Substrate absorption at this wavelength was negligible. The use of this wavelength assured a minimal impact of nanoparticle agglomeration on the photoactivity during the test. The incident radiant power was measured in the range of 290−400 nm with an Ocean Optics USB2000 spectrophotometer (Dunedin, FL, USA). equipped with a cosine-corrected optical fiber probe, spectro-radiometrically calibrated with a NIST traceable DH-2000 CAL UV−vis source (Ocean Optics, Dunedin, FL, USA). The initial nominal concentration of phenol was 0.1 mM. Time profiles of phenol decay were obtained as an average of three irradiation runs. HPLC determination of phenol was carried out with an Agilent Technologies HPLC chromatograph 1200 series (Santa Clara, CA, USA) equipped with a diode array detector, binary gradient high-pressure pump, and an automatic sampler. Isocratic elution was carried out with a mixture of 15/85 acetonitrile/formic acid aqueous solution (0.05% w/v), a flow rate of 0.5 mL min−1, and an injection volume of 20 μL. The column used was a Kinetex C18 150-2 (150 mm length, 2 mm i.d., 2.6 μm core−shell particles, Phenomenex, Torrance, CA, USA).

4. Conclusions

Well-defined MoS2 slabs on shape-tailored anatase TiO2 structures, i.e., nanosheets and bipyramidal TiO2 nanoparticles, having a different ratio/extension of (101), (001) coexposed surfaces, are prepared by the in situ method. The peculiar properties of the obtained MoS2/TiO2 heterostructures are investigated to highlight the relevant role played by morphology, structure, stacking order, and defectivity of the MoS2 slabs toward phenol photodegradation.
More in detail, MoS2 slabs appear to be thin and defective (i.e., basal plane interruptions, curved structures decorating the anatase facets) with a stacking number of 2 ± 1 layers and basal sizes of 2–10 nm on both systems. The presence of curved MoS2 slabs decorating the anatase nanosheets and, even more, the bipyramids means that a relevant grafting of MoS2 particles at the {001} and {101} anatase facets occurs. A further confirmation that MoS2 slabs are thin and uniformly distributed on the TiO2 surfaces comes from the presence of new Mox+ species on defective sites, masking the Ti4+ sites, which are no longer available for interactions with CO.
Furthermore, the sulfidation process affects the reactivity of the support matrix as well, which, in turn, plays a role in the MoS2/support interaction.
Concerning the photoactivity properties, on TiO2 n-sh and TiO2 bipy, the photodegradation rate is quite comparable, whereas by comparing MoS2/TiO2 n-sh and on MoS2/TiO2 bipy heterostructures, a significant enhancement on MoS2/TiO2 n-sh can be evaluated.
Indeed, on MoS2/TiO2 n-sh, the double heterojunction made by combining the crystal heterojunction between (101) and (001) TiO2 facets and the heterojunction between MoS2 and TiO2 (001) facets has a synergistic role in affecting the relative position of the conduction and valence bands, thus causing a higher photoactivity toward phenol degradation of the MoS2/TiO2 n-sh with respect to the MoS2/TiO2 bipy heterostructure.
Hence, the obtained results can give a contribution to the understanding of the role played by the morphology and optical properties of TiO2-based heterostructures in enabling a higher efficiency of photocatalysts used in photodegradation processes under UV light irradiation.
In conclusion, we state that hybrid heterostructures can be tailored, by designing suitable preparation methods, also considering the interface structure and then the charge control.
The future prospective of this study can be addressed to visible- and solar-light-driven photocatalytic processes, due to the good photodegradation performances and the optical properties of these nanomaterials, which enable extensive absorption of visible light with the consequent use of green and renewable-energy-activated processes.

Supplementary Materials

The following supporting information can be downloaded at: https://www.mdpi.com/article/10.3390/catal12111414/s1, Figure S1: TEM image of MoS2/bipyramidal TiO2 nanoparticles with exposed TiO2 single nanocrystals with the assignment of exposed surfaces; Figure S2: Phenol degradation profiles, expressed as the ratio between concentration after irradiation (C) and concentration before irradiation (C0) of: (a) MoS2/TiO2 bipy (red curve), (b) bipyramidal TiO2 nanoparticles (light red curve), (c) MoS2/TiO2 n-sh (blue curve), and (d) TiO2 nanosheets.

Author Contributions

F.C., A.D., P.N., F.P., R.S., D.S. and T.V. wrote and organized the manuscript; F.C., A.D., P.N., F.P., R.S. and T.V. performed experiments and characterizations. In particular, F.C. performed XRD and TEM analyses; A.D. performed Raman analyses; F.P. contributed to sample preparation and photocatalytic analysis; P.N., R.S. and T.V. performed FTIR and UV-Vis analyses; D.S., F.C., P.N. and R.S. provided a substantial contribution to the work; D.S. supervised the manuscript. All authors have read and agreed to the published version of the manuscript.

Funding

This research received no external funding.

Data Availability Statement

The data presented in this study are available on request from the corresponding author.

Acknowledgments

This work was supported by MUR (Ministero dell’ Università e della Ricerca), INSTM Consorzio, and NIS (Nanostructured Interfaces and Surfaces) Inter-Departmental Center of University of Torino. The authors thank the Laboratory of the Chemistry Department and, in particular, Valsania, M.C., and Maurino, V.

Conflicts of Interest

The authors declare no conflict of interest.

References

  1. Yang, X.; Huang, H.; Jin, B.; Luo, J.; Zhou, X. Facile synthesis of MoS2/B-TiO2 nanosheets with exposed {001} facets and enhanced visible-light-driven photocatalytic H2 production activity. RSC Adv. 2016, 6, 107075–107080. [Google Scholar] [CrossRef]
  2. Chen, C.; Xin, X.; Zhang, J.; Li, G.; Zhang, Y.; Lu, H.; Gao, J.; Yang, Z.; Wang, C.; He, Z. Few-Layered MoS2 Nanoparticles Loaded TiO2 Nanosheets with Exposed {001} Facets for Enhanced Photocatalytic Activity. Nano 2018, 13, 1850129. [Google Scholar] [CrossRef]
  3. Zhang, J.; Huang, L.; Lu, Z.; Jin, Z.; Wang, X.; Xu, G.; Zhang, E.; Wang, H.; Kong, Z.; Xi, J.; et al. Crystal face regulating MoS2/TiO2 (001) heterostructure for high photocatalytic activity. J. Alloys Compd. 2016, 688, 840–848. [Google Scholar] [CrossRef]
  4. Cao, L.; Wang, R.; Wang, D.; Li, X.; Jia, H. MoS2-hybridized TiO2 nanosheets with exposed {001} facets to enhance the visible-light photocatalytic activity. Mater. Lett. 2015, 160, 286–290. [Google Scholar] [CrossRef]
  5. Jia, P.-Y.; Guo, R.-T.; Pan, W.-G.; Huang, C.-Y.; Tang, J.-Y.; Liu, X.-Y.; Qin, H.; Xu, Q.-Y. The MoS2/TiO2 heterojunction composites with enhanced activity for CO2 photocatalytic reduction under visible light irradiation. Coll. Surf. A Phys. Engin. Asp. 2019, 570, 306–316. [Google Scholar] [CrossRef]
  6. Santalucia, R.; Vacca, T.; Cesano, F.; Martra, G.; Pellegrino, F.; Scarano, D. Few-layered MoS2 nanoparticles covering anatase TiO2 nanosheets: Comparison between ex situ and in situ synthesis approaches. Appl. Sci. 2021, 11, 143. [Google Scholar] [CrossRef]
  7. Chatterjee, D.; Mahata, A. Visible light induced photodegradation of organic pollutants on dye adsorbed TiO2 surface. J. Photochem. Photob. A Chem. 2002, 153, 199–204. [Google Scholar] [CrossRef]
  8. Matos, J.; García, A.; Zhao, L.; Titirici, M.M. Solvothermal carbon-doped TiO2 photocatalyst for the enhanced methylene blue degradation under visible light. Appl. Catal. A Gen. 2010, 390, 175–182. [Google Scholar] [CrossRef]
  9. Cheng, Y.; Geng, H.; Huang, X. Advanced water splitting electrocatalysts via the design of multicomponent heterostructures. Dalton Trans. 2020, 49, 2761–2765. [Google Scholar] [CrossRef]
  10. Uddin, M.J.; Daramola, D.; Velasquez, E.; Dickens, T.; Yan, J.; Hammel, E.; Cesano, F.; Okoli, O.I. A high efficiency 3D photovoltaic microwire with carbon nanotubes (CNT)-quantum dot (QD) hybrid interface. Phys. Status Solidi (RRL)—Rapid Res. Lett. 2014, 8, 898–903. [Google Scholar] [CrossRef]
  11. Wang, H.; Liu, F.; Fu, W.; Fang, Z.; Zhou, W.; Liu, Z. Two-dimensional heterostructures: Fabrication, characterization, and application. Nanoscale 2014, 6, 12250–12272. [Google Scholar] [CrossRef] [PubMed]
  12. Wang, Z.; Mi, B. Environmental Applications of 2D Molybdenum Disulfide (MoS2) Nanosheets. Environ. Sci. Technol. 2017, 51, 8229–8244. [Google Scholar] [CrossRef] [PubMed]
  13. Yuan, Y.-J.; Ye, Z.-J.; Lu, H.-W.; Hu, B.; Li, Y.-H.; Chen, D.-Q.; Zhong, J.-S.; Yu, Z.-T.; Zou, Z.-G. Constructing Anatase TiO2 Nanosheets with Exposed (001) Facets/Layered MoS2 Two-Dimensional Nanojunctions for Enhanced Solar Hydrogen Generation. ACS Catal. 2016, 6, 532–541. [Google Scholar] [CrossRef]
  14. Chen, B.; Meng, Y.; Sha, J.; Zhong, C.; Hu, W.; Zhao, N. Preparation of MoS2/TiO2 based nanocomposites for photocatalysis and rechargeable batteries: Progress, challenges, and perspective. Nanoscale 2018, 10, 34–68. [Google Scholar] [CrossRef] [PubMed]
  15. Cesano, F.; Pellerej, D.; Scarano, D.; Ricchiardi, G.; Zecchina, A. Radially organized pillars of TiO2 nanoparticles: Synthesis, characterization and photocatalytic tests. J. Photochem. Photob. A Chem. 2012, 242, 51–58. [Google Scholar] [CrossRef]
  16. Haque, M.M.; Khan, A.; Umar, K.; Mir, N.A.; Muneer, M.; Harada, T.; Matsumura, M. Synthesis, Characterization and Photocatalytic Activity of Visible Light Induced Ni-Doped TiO2. Energy Environ. Focus 2013, 2, 73–78. [Google Scholar] [CrossRef]
  17. Cravanzola, S.; Cesano, F.; Gaziano, F.; Scarano, D. Sulfur-Doped TiO2: Structure and Surface Properties. Catalysts 2017, 7, 214. [Google Scholar] [CrossRef] [Green Version]
  18. Scarano, D.; Cesano, F.; Zecchina, A. MoS2 Domains on TiO2-Based Nanostructures: Role of Titanate/TiO2 Transformation and Sulfur Doping on the Interaction with the Support. J. Phys. Chem. C 2019, 123, 7799–7809. [Google Scholar] [CrossRef]
  19. Yashwanth, H.J.; Rondiya, S.R.; Dzade, N.Y.; Hoye, R.L.Z.; Choudhary, R.J.; Phase, D.M.; Dhole, S.D.; Hareesh, K. Improved photocatalytic activity of TiO2 nanoparticles through nitrogen and phosphorus co-doped carbon quantum dots: An experimental and theoretical study. Phys. Chem. Chem. Phys. 2022, 24, 15271–15279. [Google Scholar] [CrossRef]
  20. Wang, Y.; Ding, Z.; Arif, N.; Jiang, W.-C.; Zeng, Y.-J. 2D material based heterostructures for solar light driven photocatalytic H2 production. Mater. Adv. 2022, 3, 3389–3417. [Google Scholar] [CrossRef]
  21. Du, R.; Li, B.; Han, X.; Xiao, K.; Wang, X.; Zhang, C.; Arbiol, J.; Cabot, A. 2D/2D Heterojunction of TiO2 Nanoparticles and Ultrathin g–C3N4 Nanosheets for Efficient Photocatalytic Hydrogen Evolution. Nanomaterials 2022, 12, 1557. [Google Scholar] [CrossRef] [PubMed]
  22. Cravanzola, S.; Sarro, M.; Cesano, F.; Calza, P.; Scarano, D. Few-Layer MoS₂ Nanodomains Decorating TiO₂ Nanoparticles: A Case Study for the Photodegradation of Carbamazepine. Nanomaterials 2018, 8, 207. [Google Scholar] [CrossRef] [PubMed] [Green Version]
  23. Kumar, S.G.; Devi, L.G. Review on Modified TiO2 Photocatalysis under UV/Visible Light: Selected Results and Related Mechanisms on Interfacial Charge Carrier Transfer Dynamics. J. Phys. Chem. A 2011, 115, 13211–13241. [Google Scholar] [CrossRef] [PubMed]
  24. Shen, M.; Yan, Z.; Yang, L.; Du, P.; Zhang, J.; Xiang, B. MoS2 nanosheet/TiO2 nanowire hybrid nanostructures for enhanced visible-light photocatalytic activities. Chem. Commun. 2014, 50, 15447–15449. [Google Scholar] [CrossRef] [PubMed]
  25. Schneider, W.-D.; Heyde, M.; Freund, H.-J. Charge Control in Model Catalysis: The Decisive Role of the Oxide–Nanoparticle Interface. Chem. A Eur. J. 2018, 24, 2317–2327. [Google Scholar] [CrossRef] [PubMed]
  26. Hu, K.H.; Hu, X.G.; Xu, Y.F.; Pan, X.Z. The effect of morphology and size on the photocatalytic properties of MoS2. React. Kinet. Mech. Catal. 2010, 100, 153–163. [Google Scholar] [CrossRef]
  27. Goswami, N.; Giri, A.; Pal, S.K. MoS2 Nanocrystals Confined in a DNA Matrix Exhibiting Energy Transfer. Langmuir 2013, 29, 11471–11478. [Google Scholar] [CrossRef] [Green Version]
  28. Lee, Y.-H.; Zhang, X.-Q.; Zhang, W.; Chang, M.-T.; Lin, C.-T.; Chang, K.-D.; Yu, Y.-C.; Wang, J.T.-W.; Chang, C.-S.; Li, L.-J.; et al. Synthesis of large-area MoS2 atomic layers with chemical vapor deposition. Adv. Mater. 2012, 24, 2320–2325. [Google Scholar] [CrossRef] [Green Version]
  29. Stephenson, T.; Li, Z.; Olsen, B.; Mitlin, D. Lithium ion battery applications of molybdenum disulfide (MoS2) nanocomposites. Energy Environ. Sci. 2014, 7, 209–231. [Google Scholar] [CrossRef]
  30. Lin, Y.; Ren, P.; Wei, C. Fabrication of MoS2/TiO2 heterostructures with enhanced photocatalytic activity. CrystEngComm 2019, 21, 3439–3450. [Google Scholar] [CrossRef]
  31. Wan, J.; Lacey, S.D.; Dai, J.; Bao, W.; Fuhrer, M.S.; Hu, L. Tuning two-dimensional nanomaterials by intercalation: Materials, properties and applications. Chem. Soc. Rev. 2016, 45, 6742–6765. [Google Scholar] [CrossRef] [PubMed]
  32. Sreepal, V.; Yagmurcukardes, M.; Vasu, K.S.; Kelly, D.J.; Taylor, S.F.R.; Kravets, V.G.; Kudrynskyi, Z.; Kovalyuk, Z.D.; Patanè, A.; Grigorenko, A.N.; et al. Two-Dimensional Covalent Crystals by Chemical Conversion of Thin van der Waals Materials. Nano Lett. 2019, 19, 6475–6481. [Google Scholar] [CrossRef] [PubMed] [Green Version]
  33. Zhao, X.; Song, P.; Wang, C.; Riis-Jensen, A.C.; Fu, W.; Deng, Y.; Wan, D.; Kang, L.; Ning, S.; Dan, J.; et al. Engineering covalently bonded 2D layered materials by self-intercalation. Nature 2020, 581, 171–177. [Google Scholar] [CrossRef]
  34. Geim, A.K.; Grigorieva, I.V. Van der Waals heterostructures. Nature 2013, 499, 419–425. [Google Scholar] [CrossRef] [PubMed] [Green Version]
  35. Mao, Y.; Wong, S.S. Size- and Shape-Dependent Transformation of Nanosized Titanate into Analogous Anatase Titania Nanostructures. JACS 2006, 128, 8217–8226. [Google Scholar] [CrossRef] [PubMed]
  36. Kitano, M.; Wada, E.; Nakajima, K.; Hayashi, S.; Miyazaki, S.; Kobayashi, H.; Hara, M. Protonated Titanate Nanotubes with Lewis and Brønsted Acidity: Relationship between Nanotube Structure and Catalytic Activity. Chem. Mater. 2013, 25, 385–393. [Google Scholar] [CrossRef]
  37. Cravanzola, S.; Muscuso, L.; Cesano, F.; Agostini, G.; Damin, A.; Scarano, D.; Zecchina, A. MoS2 Nanoparticles Decorating Titanate-Nanotube Surfaces: Combined Microscopy, Spectroscopy, and Catalytic Studies. Langmuir 2015, 31, 5469–5478. [Google Scholar] [CrossRef]
  38. Cesano, F.; Bertarione, S.; Piovano, A.; Agostini, G.; Rahman, M.M.; Groppo, E.; Bonino, F.; Scarano, D.; Lamberti, C.; Bordiga, S.; et al. Model oxide supported MoS2 HDS catalysts: Structure and surface properties. Catal. Sci. Technol. 2011, 1, 123–136. [Google Scholar] [CrossRef]
  39. Cravanzola, S.; Cesano, F.; Gaziano, F.; Scarano, D. Carbon Domains on MoS2/TiO2 System via Catalytic Acetylene Oligomerization: Synthesis, Structure, and Surface Properties. Front. Chem. 2017, 5, 91. [Google Scholar] [CrossRef] [Green Version]
  40. Cesano, F.; Bertarione, S.; Uddin, M.J.; Agostini, G.; Scarano, D.; Zecchina, A. Designing TiO2 Based Nanostructures by Control of Surface Morphology of Pure and Silver Loaded Titanate Nanotubes. J. Phys. Chem. C 2010, 114, 169–178. [Google Scholar] [CrossRef]
  41. Bavykin, D.V.; Friedrich, J.M.; Walsh, F.C. Protonated Titanates and TiO2 Nanostructured Materials: Synthesis, Properties, and Applications. Adv. Mater. 2006, 18, 2807–2824. [Google Scholar] [CrossRef]
  42. Cesano, F.; Cravanzola, S.; Rahman, M.M.; Scarano, D. Interplay between Fe-Titanate Nanotube Fragmentation and Catalytic Decomposition of C2H4: Formation of C/TiO2 Hybrid Interfaces. Inorganics 2018, 6, 55. [Google Scholar] [CrossRef] [Green Version]
  43. Pan, J.; Liu, G.; Lu, G.Q.M.; Cheng, H.-M. On the True Photoreactivity Order of {001}, {010}, and {101} Facets of Anatase TiO2 Crystals. Angew. Chem. Int. Ed. 2011, 50, 2133–2137. [Google Scholar] [CrossRef] [PubMed]
  44. Zhang, J.; Zhang, L.; Yu, W.; Jiang, F.; Zhang, E.; Wang, H.; Kong, Z.; Xi, J.; Ji, Z. Novel dual heterojunction between MoS2 and anatase TiO2 with coexposed {101} and {001} facets. J. Am. Ceram. Soc. 2017, 100, 5274–5285. [Google Scholar] [CrossRef]
  45. Zhang, J.; Zhang, L.; Ma, X.; Ji, Z. A study of constructing heterojunction between two-dimensional transition metal sulfides (MoS2 and WS2) and (101), (001) faces of TiO2. Appl. Surf. Sci. 2018, 430, 424–437. [Google Scholar] [CrossRef]
  46. Mino, L.; Pellegrino, F.; Rades, S.; Radnik, J.; Hodoroaba, V.-D.; Spoto, G.; Maurino, V.; Martra, G. Beyond Shape Engineering of TiO2 Nanoparticles: Post-Synthesis Treatment Dependence of Surface Hydration, Hydroxylation, Lewis Acidity and Photocatalytic Activity of TiO2 Anatase Nanoparticles with Dominant {001} or {101} Facets. ACS Appl. Nano Mater. 2018, 1, 5355–5365. [Google Scholar] [CrossRef] [Green Version]
  47. Kumar, S.; Shakya, J.; Mohanty, T. Probing interfacial charge transfer dynamics in MoS2/TiO2 nanocomposites using scanning Kelvin probe for improved photocatalytic response. Surf. Sci. 2020, 693, 121530. [Google Scholar] [CrossRef]
  48. Zhu, K.-R.; Zhang, M.-S.; Chen, Q.; Yin, Z. Size and phonon-confinement effects on low-frequency Raman mode of anatase TiO2 nanocrystal. Phys. Lett. A 2005, 340, 220–227. [Google Scholar] [CrossRef]
  49. Li, H.; Zhang, Q.; Yap, C.C.R.; Tay, B.K.; Edwin, T.H.T.; Olivier, A.; Baillargeat, D. From Bulk to Monolayer MoS2: Evolution of Raman Scattering. Adv. Funct. Mater. 2012, 22, 1385–1390. [Google Scholar] [CrossRef]
  50. Lee, C.; Yan, H.; Brus, L.E.; Heinz, T.F.; Hone, J.; Ryu, S. Anomalous Lattice Vibrations of Single- and Few-Layer MoS2. ACS Nano 2010, 4, 2695–2700. [Google Scholar] [CrossRef]
  51. Mignuzzi, S.; Pollard, A.J.; Bonini, N.; Brennan, B.; Gilmore, I.S.; Pimenta, M.A.; Richards, D.; Roy, D. Effect of disorder on Raman scattering of single-layer MoS2. Phys. Rev. B Condens. Matter Mater. Phys. 2015, 91, 195411. [Google Scholar] [CrossRef] [Green Version]
  52. Muscuso, L.; Cravanzola, S.; Cesano, F.; Scarano, D.; Zecchina, A. Optical, Vibrational, and Structural Properties of MoS2 Nanoparticles Obtained by Exfoliation and Fragmentation via Ultrasound Cavitation in Isopropyl Alcohol. J. Phys. Chem. C 2015, 119, 3791–3801. [Google Scholar] [CrossRef]
  53. Wilcoxon, J.P.; Newcomer, P.P.; Samara, G.A. Synthesis and optical properties of MoS2 and isomorphous nanoclusters in the quantum confinement regime. J. Appl. Phys. 1997, 81, 7934–7944. [Google Scholar] [CrossRef]
  54. Shi, H.; Yan, R.; Bertolazzi, S.; Brivio, J.; Gao, B.; Kis, A.; Jena, D.; Xing, H.G.; Huang, L. Exciton Dynamics in Suspended Monolayer and Few-Layer MoS2 2D Crystals. ACS Nano 2013, 7, 1072–1080. [Google Scholar] [CrossRef] [PubMed]
  55. Tsyganenko, A.A.; Can, F.; Travert, A.; Maugé, F. FTIR study of unsupported molybdenum sulfide—In situ synthesis and surface properties characterization. Appl. Catal. A Gen. 2004, 268, 189–197. [Google Scholar] [CrossRef]
  56. Bolis, V.; Barbaglia, A.; Bordiga, S.; Lamberti, C.; Zecchina, A. Heterogeneous Nonclassical Carbonyls Stabilized in Cu(I)− and Ag(I)−ZSM-5 Zeolites:  Thermodynamic and Spectroscopic Features. J. Phys. Chem. B 2004, 108, 9970–9983. [Google Scholar] [CrossRef]
  57. Dai, R.; Zhang, A.; Pan, Z.; Al-Enizi, A.M.; Elzatahry, A.A.; Hu, L.; Zheng, G. Epitaxial Growth of Lattice-Mismatched Core–Shell TiO2@MoS2 for Enhanced Lithium-Ion Storage. Small 2016, 12, 2792–2799. [Google Scholar] [CrossRef]
  58. Kibsgaard, J.; Clausen, B.S.; Topsøe, H.; Lægsgaard, E.; Lauritsen, J.V.; Besenbacher, F. Scanning tunneling microscopy studies of TiO2-supported hydrotreating catalysts: Anisotropic particle shapes by edge-specific MoS2–support bonding. J. Catal. 2009, 263, 98–103. [Google Scholar] [CrossRef]
  59. Arrouvel, C.; Breysse, M.; Toulhoat, H.; Raybaud, P. A density functional theory comparison of anatase (TiO2)- and γ-Al2O3-supported MoS2 catalysts. J. Catal. 2005, 232, 161–178. [Google Scholar] [CrossRef]
  60. Yu, J.; Low, J.; Xiao, W.; Zhou, P.; Jaroniec, M. Enhanced Photocatalytic CO2-Reduction Activity of Anatase TiO2 by Coexposed {001} and {101} Facets. JACS 2014, 136, 8839–8842. [Google Scholar] [CrossRef]
  61. Zhang, Y.; Cai, J.; Ma, Y.; Qi, L. Mesocrystalline TiO2 nanosheet arrays with exposed {001} facets: Synthesis via topotactic transformation and applications in dye-sensitized solar cells. Nano Res. 2017, 10, 2610–2625. [Google Scholar] [CrossRef]
  62. Deiana, C.; Minella, M.; Tabacchi, G.; Maurino, V.; Fois, E.; Martra, G. Shape-controlled TiO2 nanoparticles and TiO2 P25 interacting with CO and H2O2 molecular probes: A synergic approach for surface structure recognition and physico-chemical understanding. Phys. Chem. Chem. Phys. 2013, 15, 307–315. [Google Scholar] [CrossRef] [PubMed] [Green Version]
  63. Panayotov, D.A.; Burrows, S.P.; Morris, J.R. Infrared Spectroscopic Studies of Conduction Band and Trapped Electrons in UV-Photoexcited, H-Atom n-Doped, and Thermally Reduced TiO2. J. Phys. Chem. C 2012, 116, 4535–4544. [Google Scholar] [CrossRef]
  64. Jangir, M.; Jain, A.; Yamaguchi, S.; Ichikawa, T.; Lal, C.; Jain, I.P. Catalytic effect of TiF4 in improving hydrogen storage properties of MgH2. Int. J. Hydrogen Energy 2016, 41, 14178–14183. [Google Scholar] [CrossRef]
  65. Radnik, J.; Mohr, C.; Claus, P. On the origin of binding energy shifts of core levels of supported gold nanoparticles and dependence of pretreatment and material synthesis. Phys. Chem. Chem. Phys. 2003, 5, 172–177. [Google Scholar] [CrossRef]
  66. Sugimoto, T.; Zhou, X.; Muramatsu, A. Synthesis of uniform anatase TiO2 nanoparticles by gel–sol method: 3. Formation process and size control. J. Colloid Interface Sci. 2003, 259, 43–52. [Google Scholar] [CrossRef]
  67. Pellegrino, F.; Isopescu, R.; Pellutiè, L.; Sordello, F.; Rossi, A.M.; Ortel, E.; Martra, G.; Hodoroaba, V.D.; Maurino, V. Machine learning approach for elucidating and predicting the role of synthesis parameters on the shape and size of TiO2 nanoparticles. Sci. Rep. 2020, 10, 18910. [Google Scholar] [CrossRef]
  68. Signorile, M.; Bonino, F.; Damin, A.; Bordiga, S. A Novel Raman Setup Based on Magnetic-Driven Rotation of Sample. Top. Catal. 2018, 61, 1491–1498. [Google Scholar] [CrossRef]
  69. Menżyk, A.; Damin, A.; Martyna, A.; Alladio, E.; Vincenti, M.; Martra, G.; Zadora, G. Toward a novel framework for bloodstains dating by Raman spectroscopy: How to avoid sample photodamage and subsampling errors. Talanta 2020, 209, 120565. [Google Scholar] [CrossRef]
  70. Pellegrino, F.; Pellutiè, L.; Sordello, F.; Minero, C.; Ortel, E.; Hodoroaba, V.-D.; Maurino, V. Influence of agglomeration and aggregation on the photocatalytic activity of TiO2 nanoparticles. Appl. Catal. B Environm. 2017, 216, 80–87. [Google Scholar] [CrossRef]
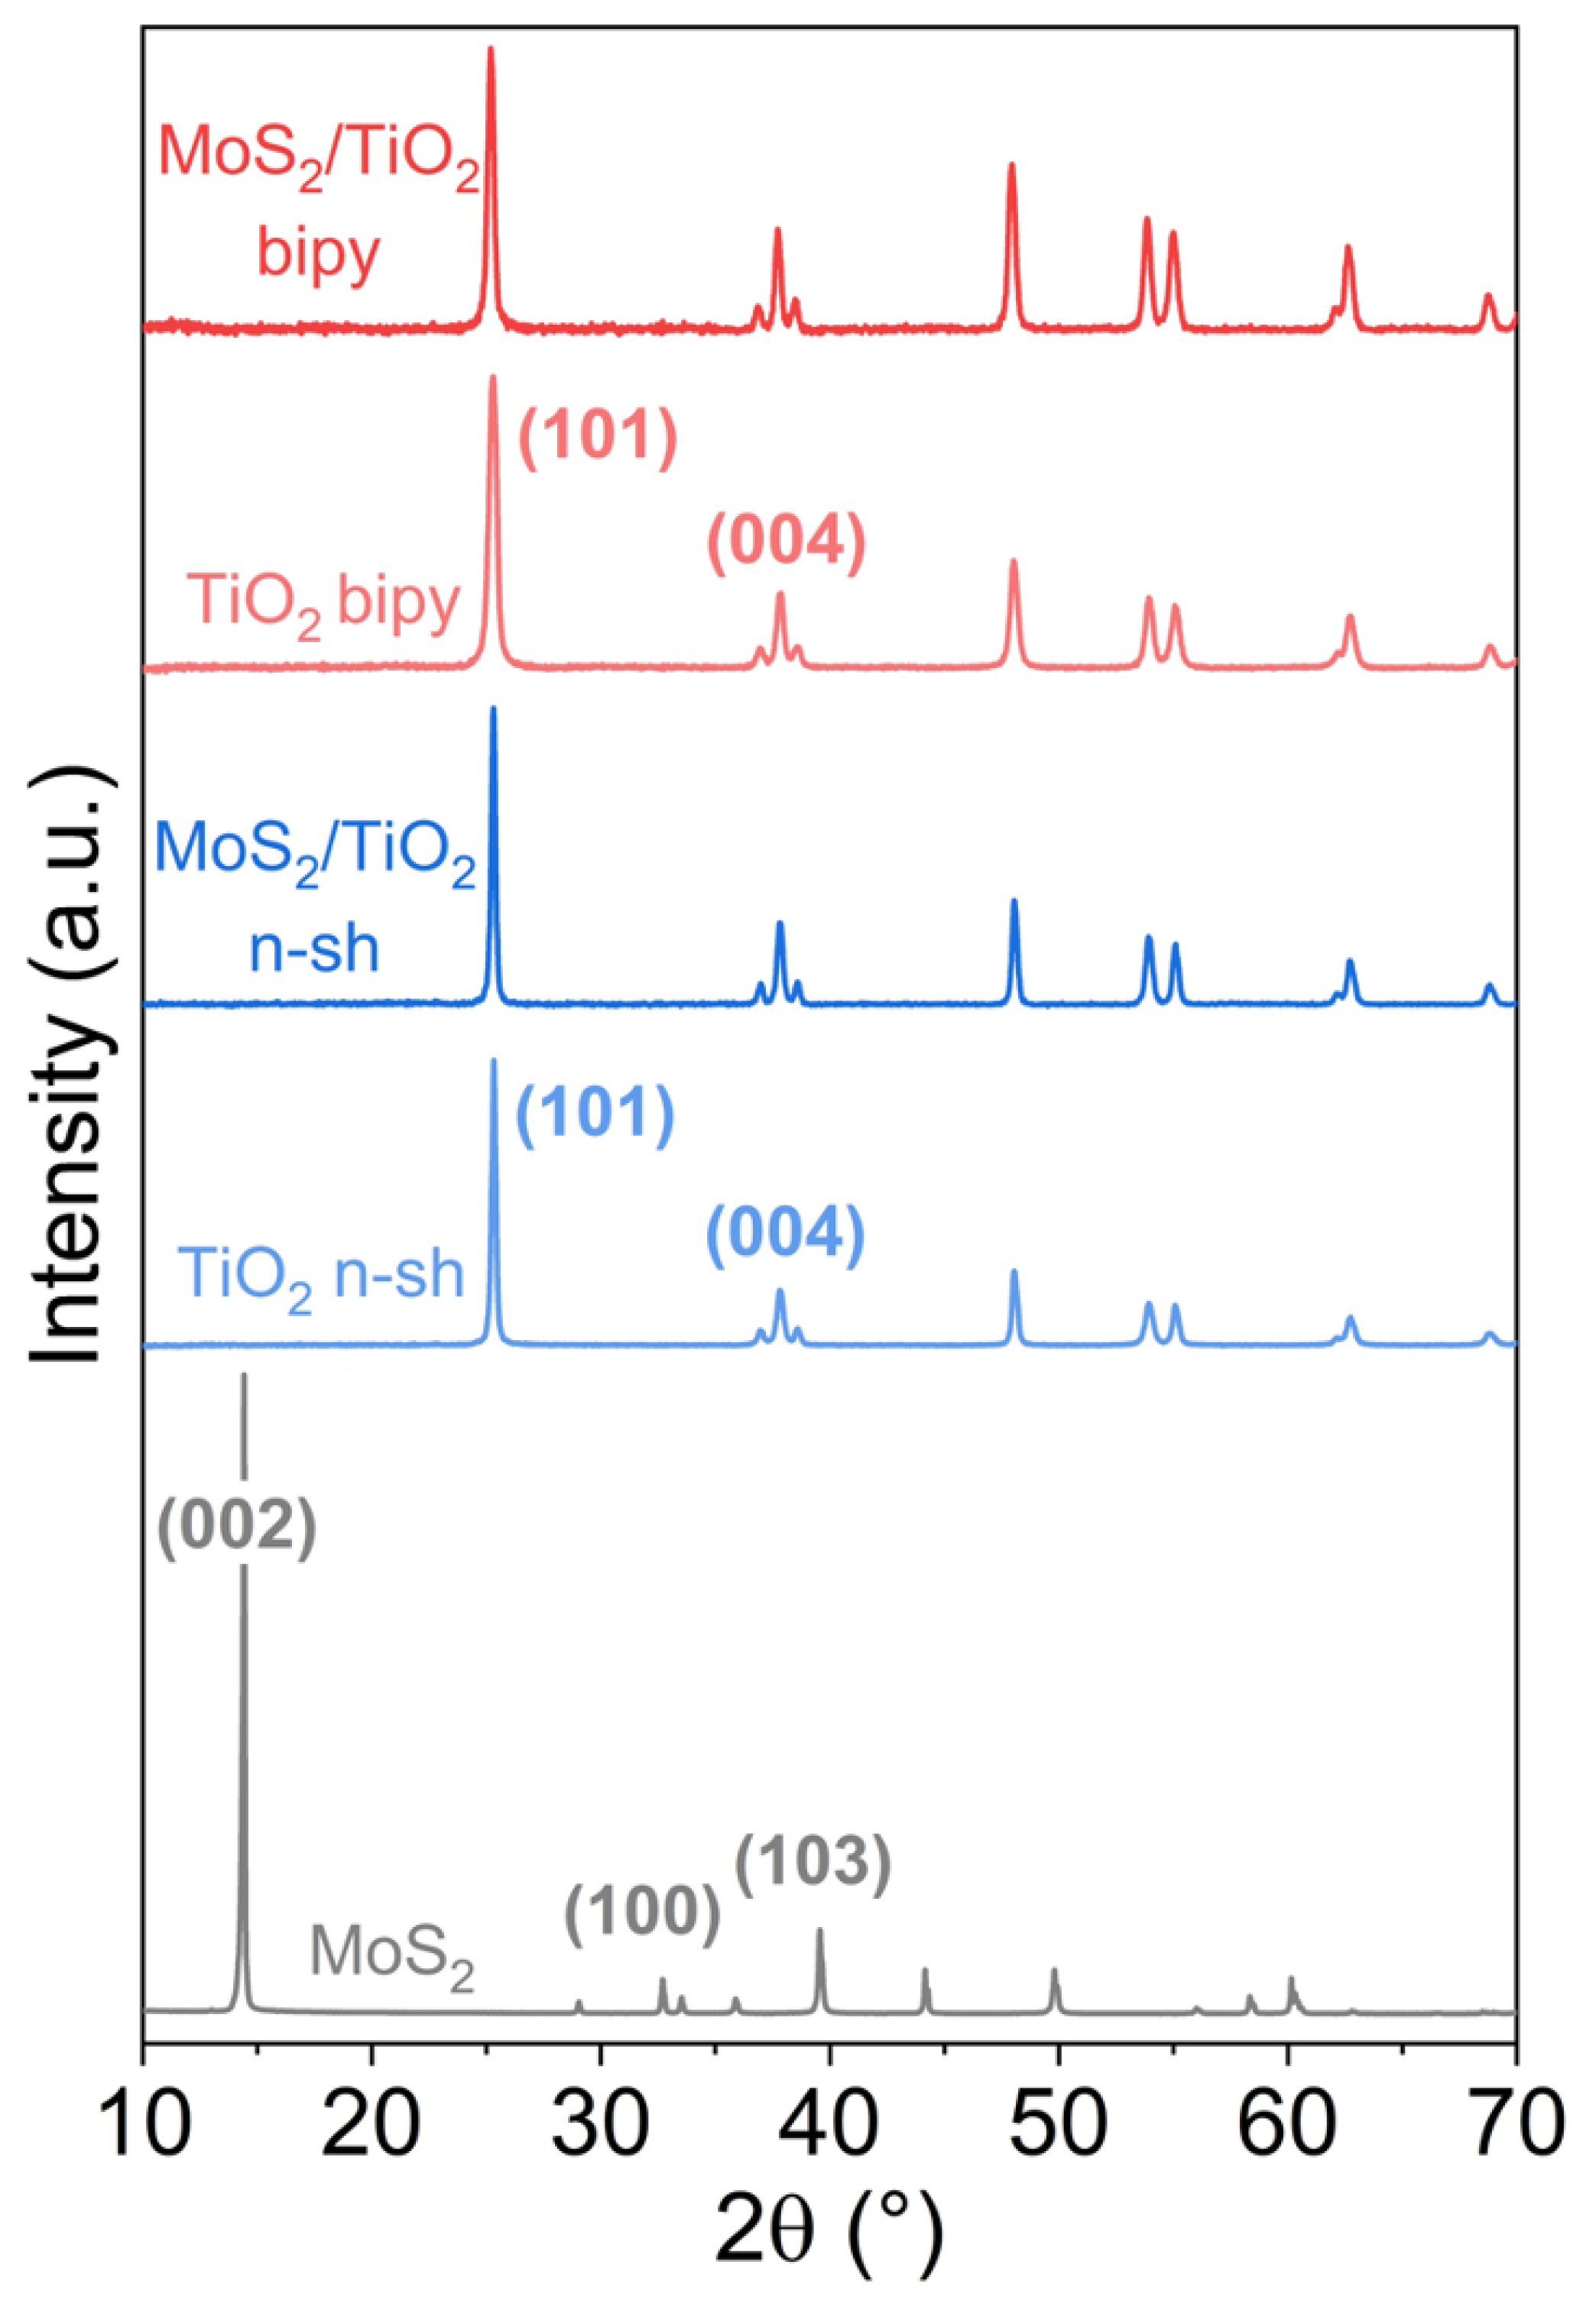
Figure 1. XRD patterns of: MoS2/TiO2 bipy (red line), TiO2 bipy (light red line), MoS2/TiO2 n-sh (blue line), TiO2 n-sh (light blue line), and MoS2 (grey line).
Catalysts 12 01414 g001
Figure 2. TEM images of: (a) MoS2/TiO2 n-sh and (c) MoS2/TiO2 bipy nanoparticles; lateral size distribution of TiO2 nanoparticles (grey histograms) and MoS2 stacking order (yellow histograms) for: (b) MoS2/TiO2 n-sh and (d) MoS2/TiO2 bipy nanoparticles.
Catalysts 12 01414 g002
Figure 3. HRTEM images of: (a) MoS2/TiO2 n-sh and (b) MoS2/TiO2 bipy nanoparticles. In the insets, fast-Fourier-transform (FFT) images of selected regions in a and b are shown.
Catalysts 12 01414 g003
Figure 4. Raman spectra recorded with: (a) λ = 514 nm and (b) λ = 442 nm laser lines of: MoS2/TiO2 bipy (red line), TiO2 bipy (light red line), MoS2/TiO2 n-sh (blue line), TiO2 n-sh (light blue line), and bare MoS2 (grey line) used as a reference material. Enlarged views in the 430–360 cm−1 range have been reported on the right sides of both a and b panels.
Catalysts 12 01414 g004
Figure 5. UV-Vis spectra of: MoS2/TiO2 bipy (red line), MoS2/TiO2 n-sh (blue line), TiO2 bipy (dotted light red line), TiO2 n-sh (dotted light blue line), and MoS2 (grey line). For better clarity, the intensities of bulk MoS2 and of MoS2/TiO2 n-sh spectra are multiplied by a factor of 3 and 2, respectively. The vertical grey dashed lines in the bulk MoS2 spectrum indicate the position of MoS2 A and B excitonic transitions. All the spectra are recorded in the diffuse reflectance mode and converted to equivalent absorption Kubelka–Munk units.
Catalysts 12 01414 g005
Figure 6. FTIR spectra of CO adsorbed at 77 K (40 Torr, red line) at decreasing coverage up to the residual pressure of 4 × 10⁻⁴ Torr (black line) on the surface of: (a) TiO2 n-sh and (b) MoS2/TiO2 n-sh. The insets show the OH vibrational modes regions before (black line) and after CO dosage (red line).
Catalysts 12 01414 g006
Figure 7. FTIR spectra of CO adsorbed at 77 K (40 Torr, red line) at decreasing coverage up to the residual pressure of 4 × 10⁻⁴ Torr (black line) on the surface of: (a) TiO2 bipy and (b) MoS2/TiO2 bipy. The insets show the OH vibrational modes regions before (black line) and after CO dosage (red line).
Catalysts 12 01414 g007
Figure 8. FTIR spectra of CO at 77 K at maximum coverage (40 Torr) adsorbed on the surface of: (a) TiO2 n-sh (black line) and MoS2/TiO2 n-sh (red line); (b) TiO2 bipy (black line) and MoS2/TiO2 bipy (red line).
Catalysts 12 01414 g008
Figure 9. Phenol photocatalytic degradation: (a) relationship between C/C0 and irradiation time; (b) decomposition rates of: MoS2/TiO2 bipy (red curve), TiO2 bipy (light red curve), MoS2/TiO2 n-sh (blue curve), and TiO2 n-sh (light blue curve).
Catalysts 12 01414 g009
Scheme 1. Main steps of the synthesis process of the MoS2/TiO2 nanosheets and MoS2/TiO2 bipyramids obtained by an in situ method.
Catalysts 12 01414 sch001
Publisher’s Note: MDPI stays neutral with regard to jurisdictional claims in published maps and institutional affiliations.