


Effect of Calcination Temperature of SiO2/TiO2 Photocatalysts on UV-VIS and VIS Removal Efficiency of Color Contaminants


Abstract
:1. Introduction
2. Results and Discussion
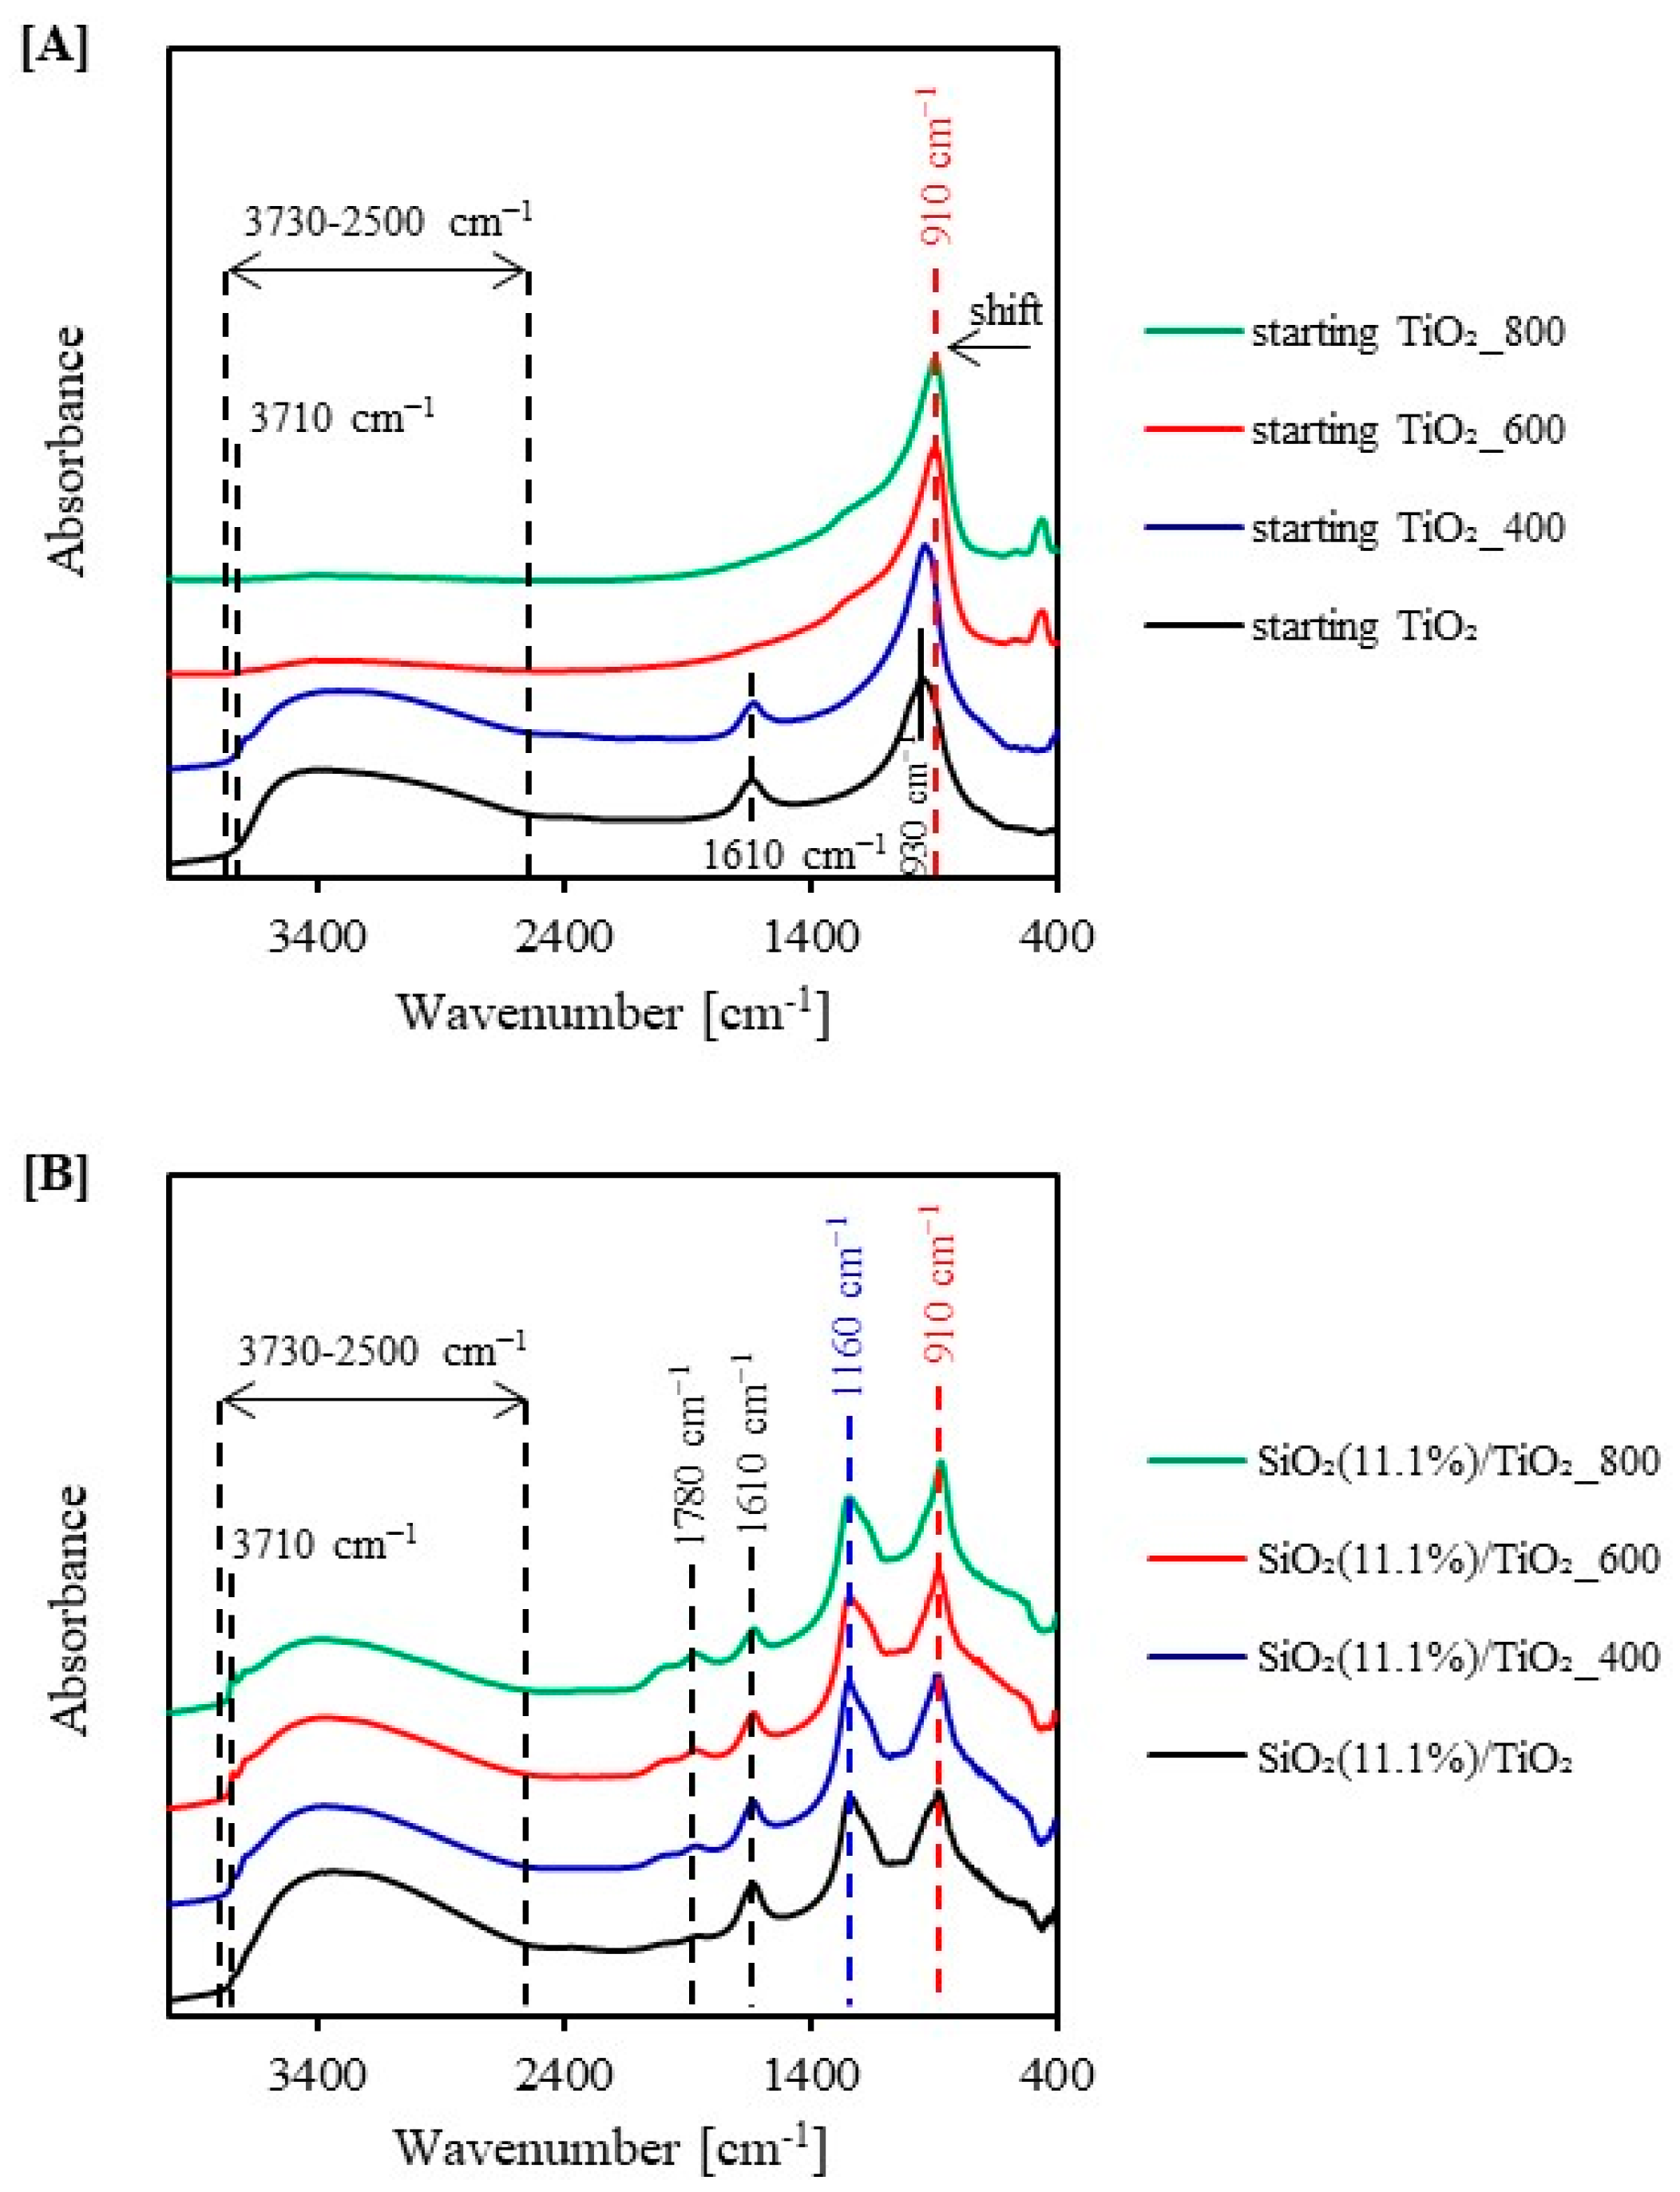
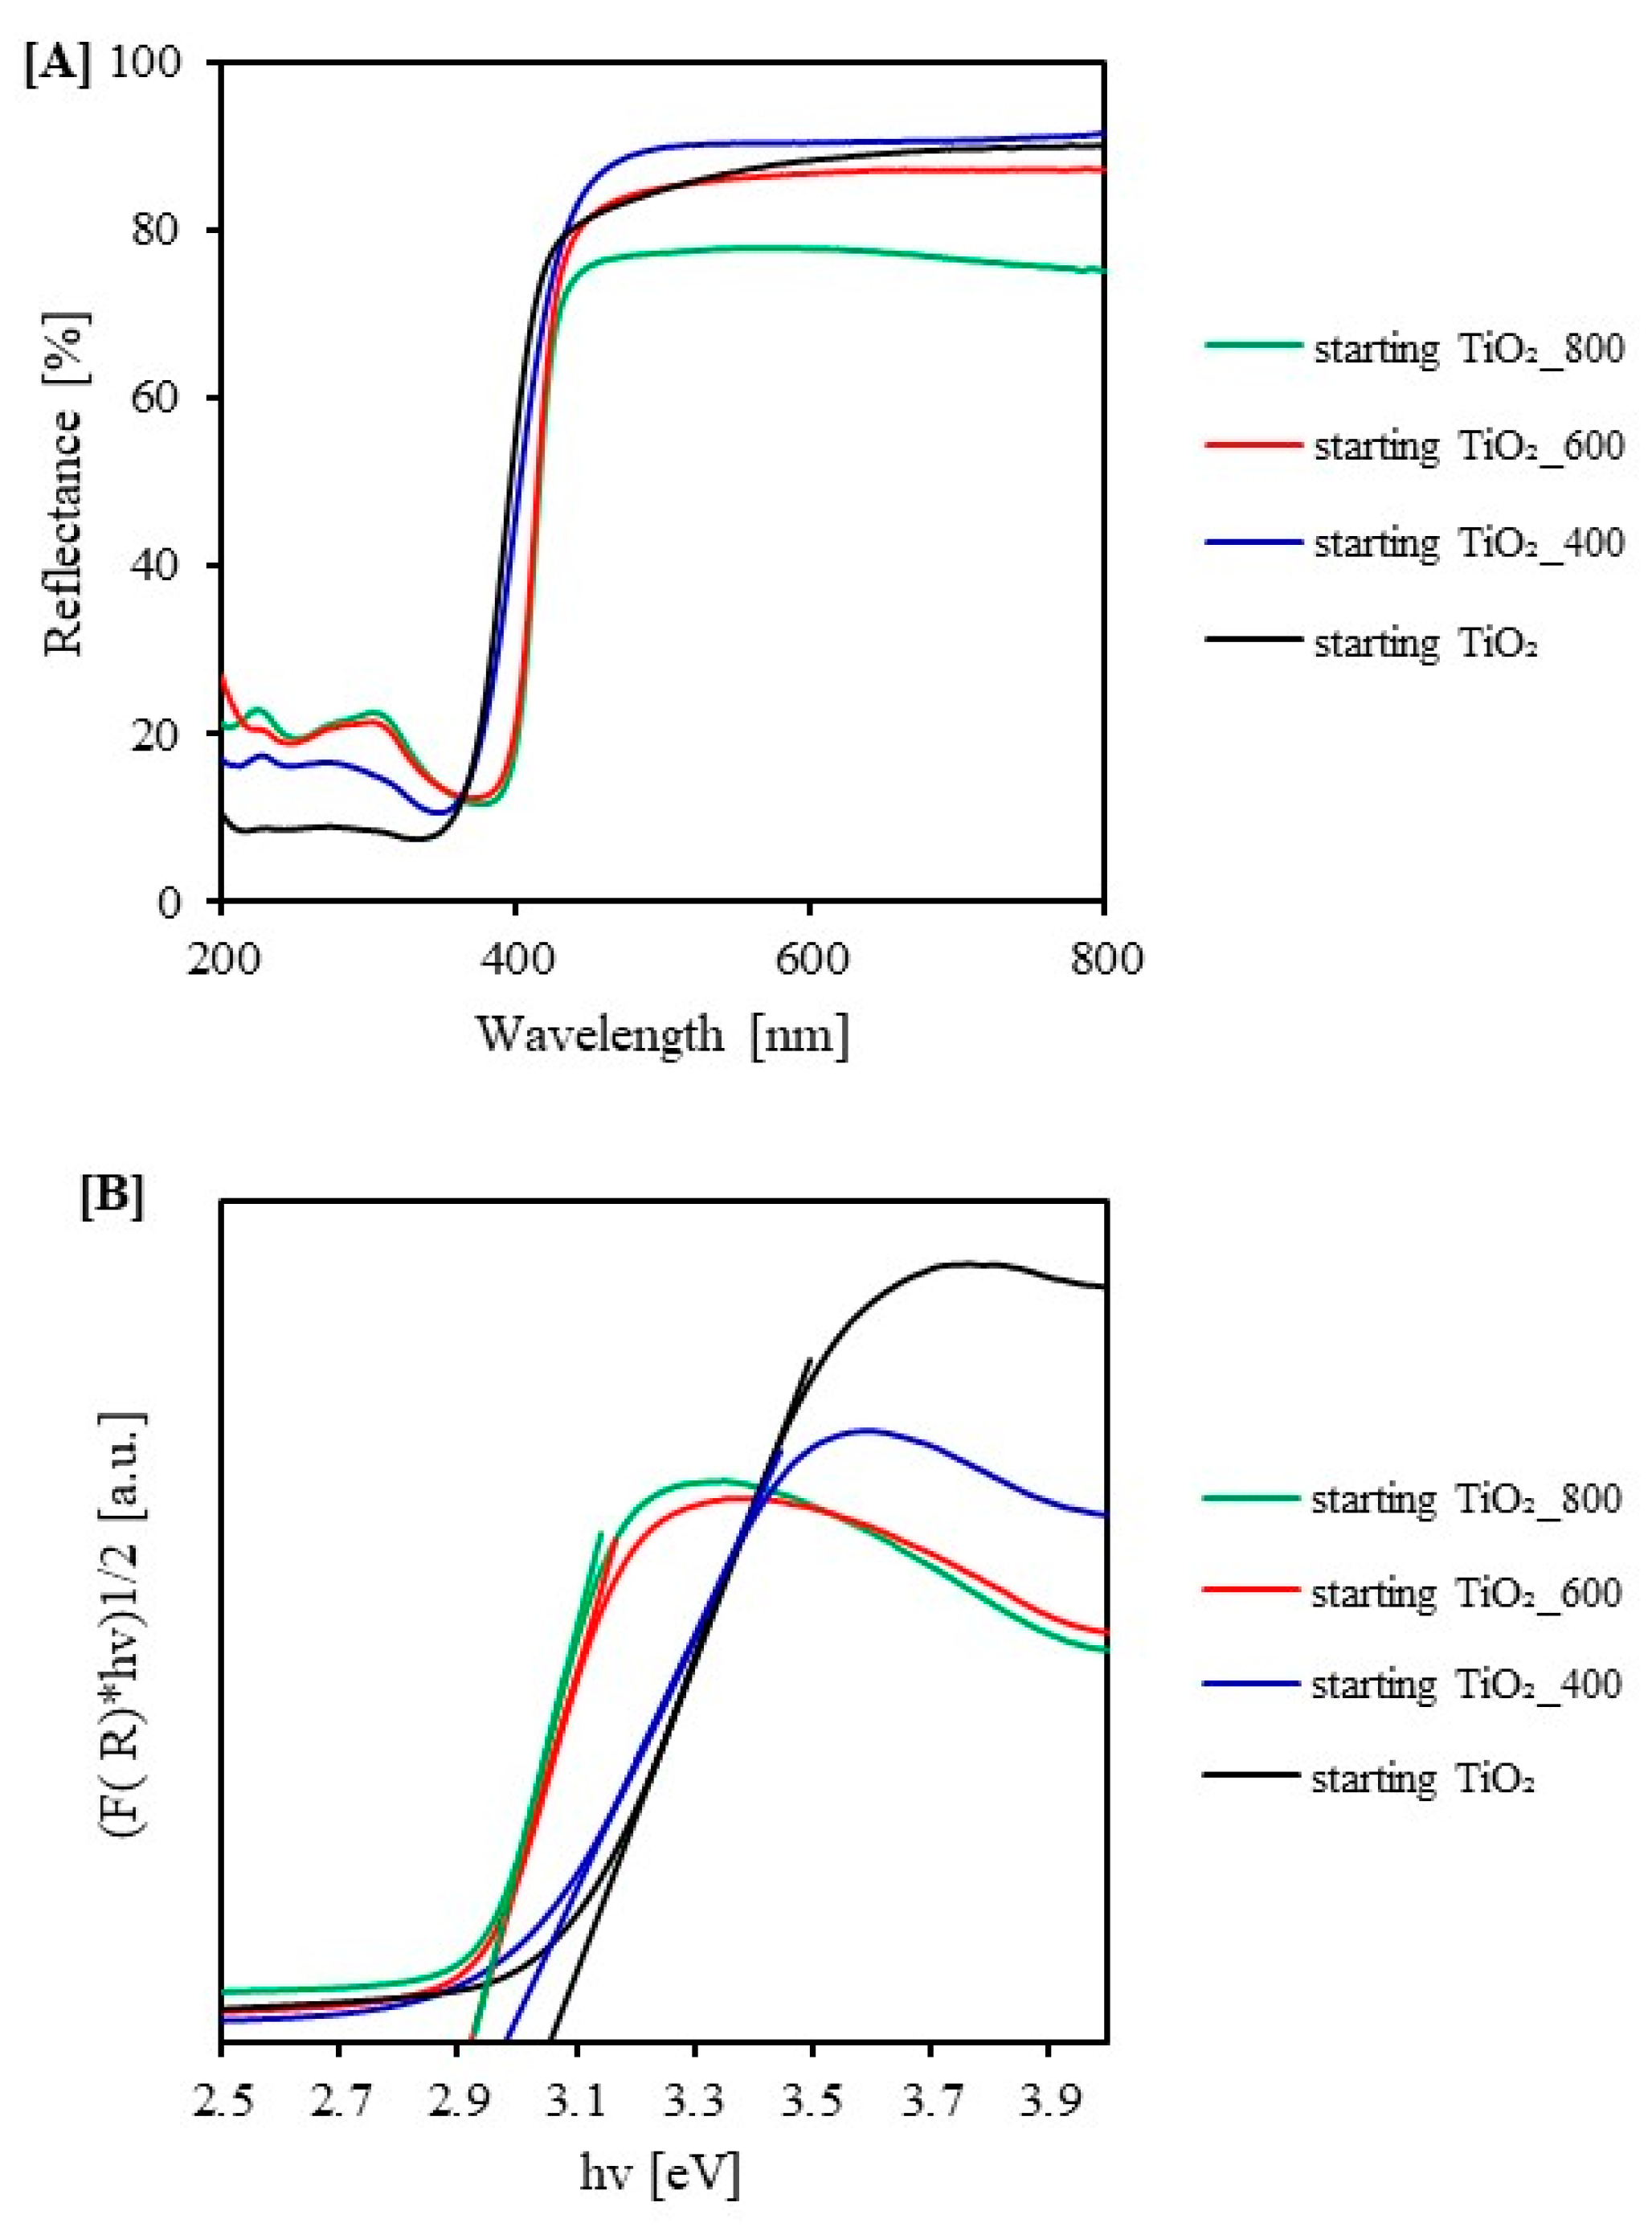
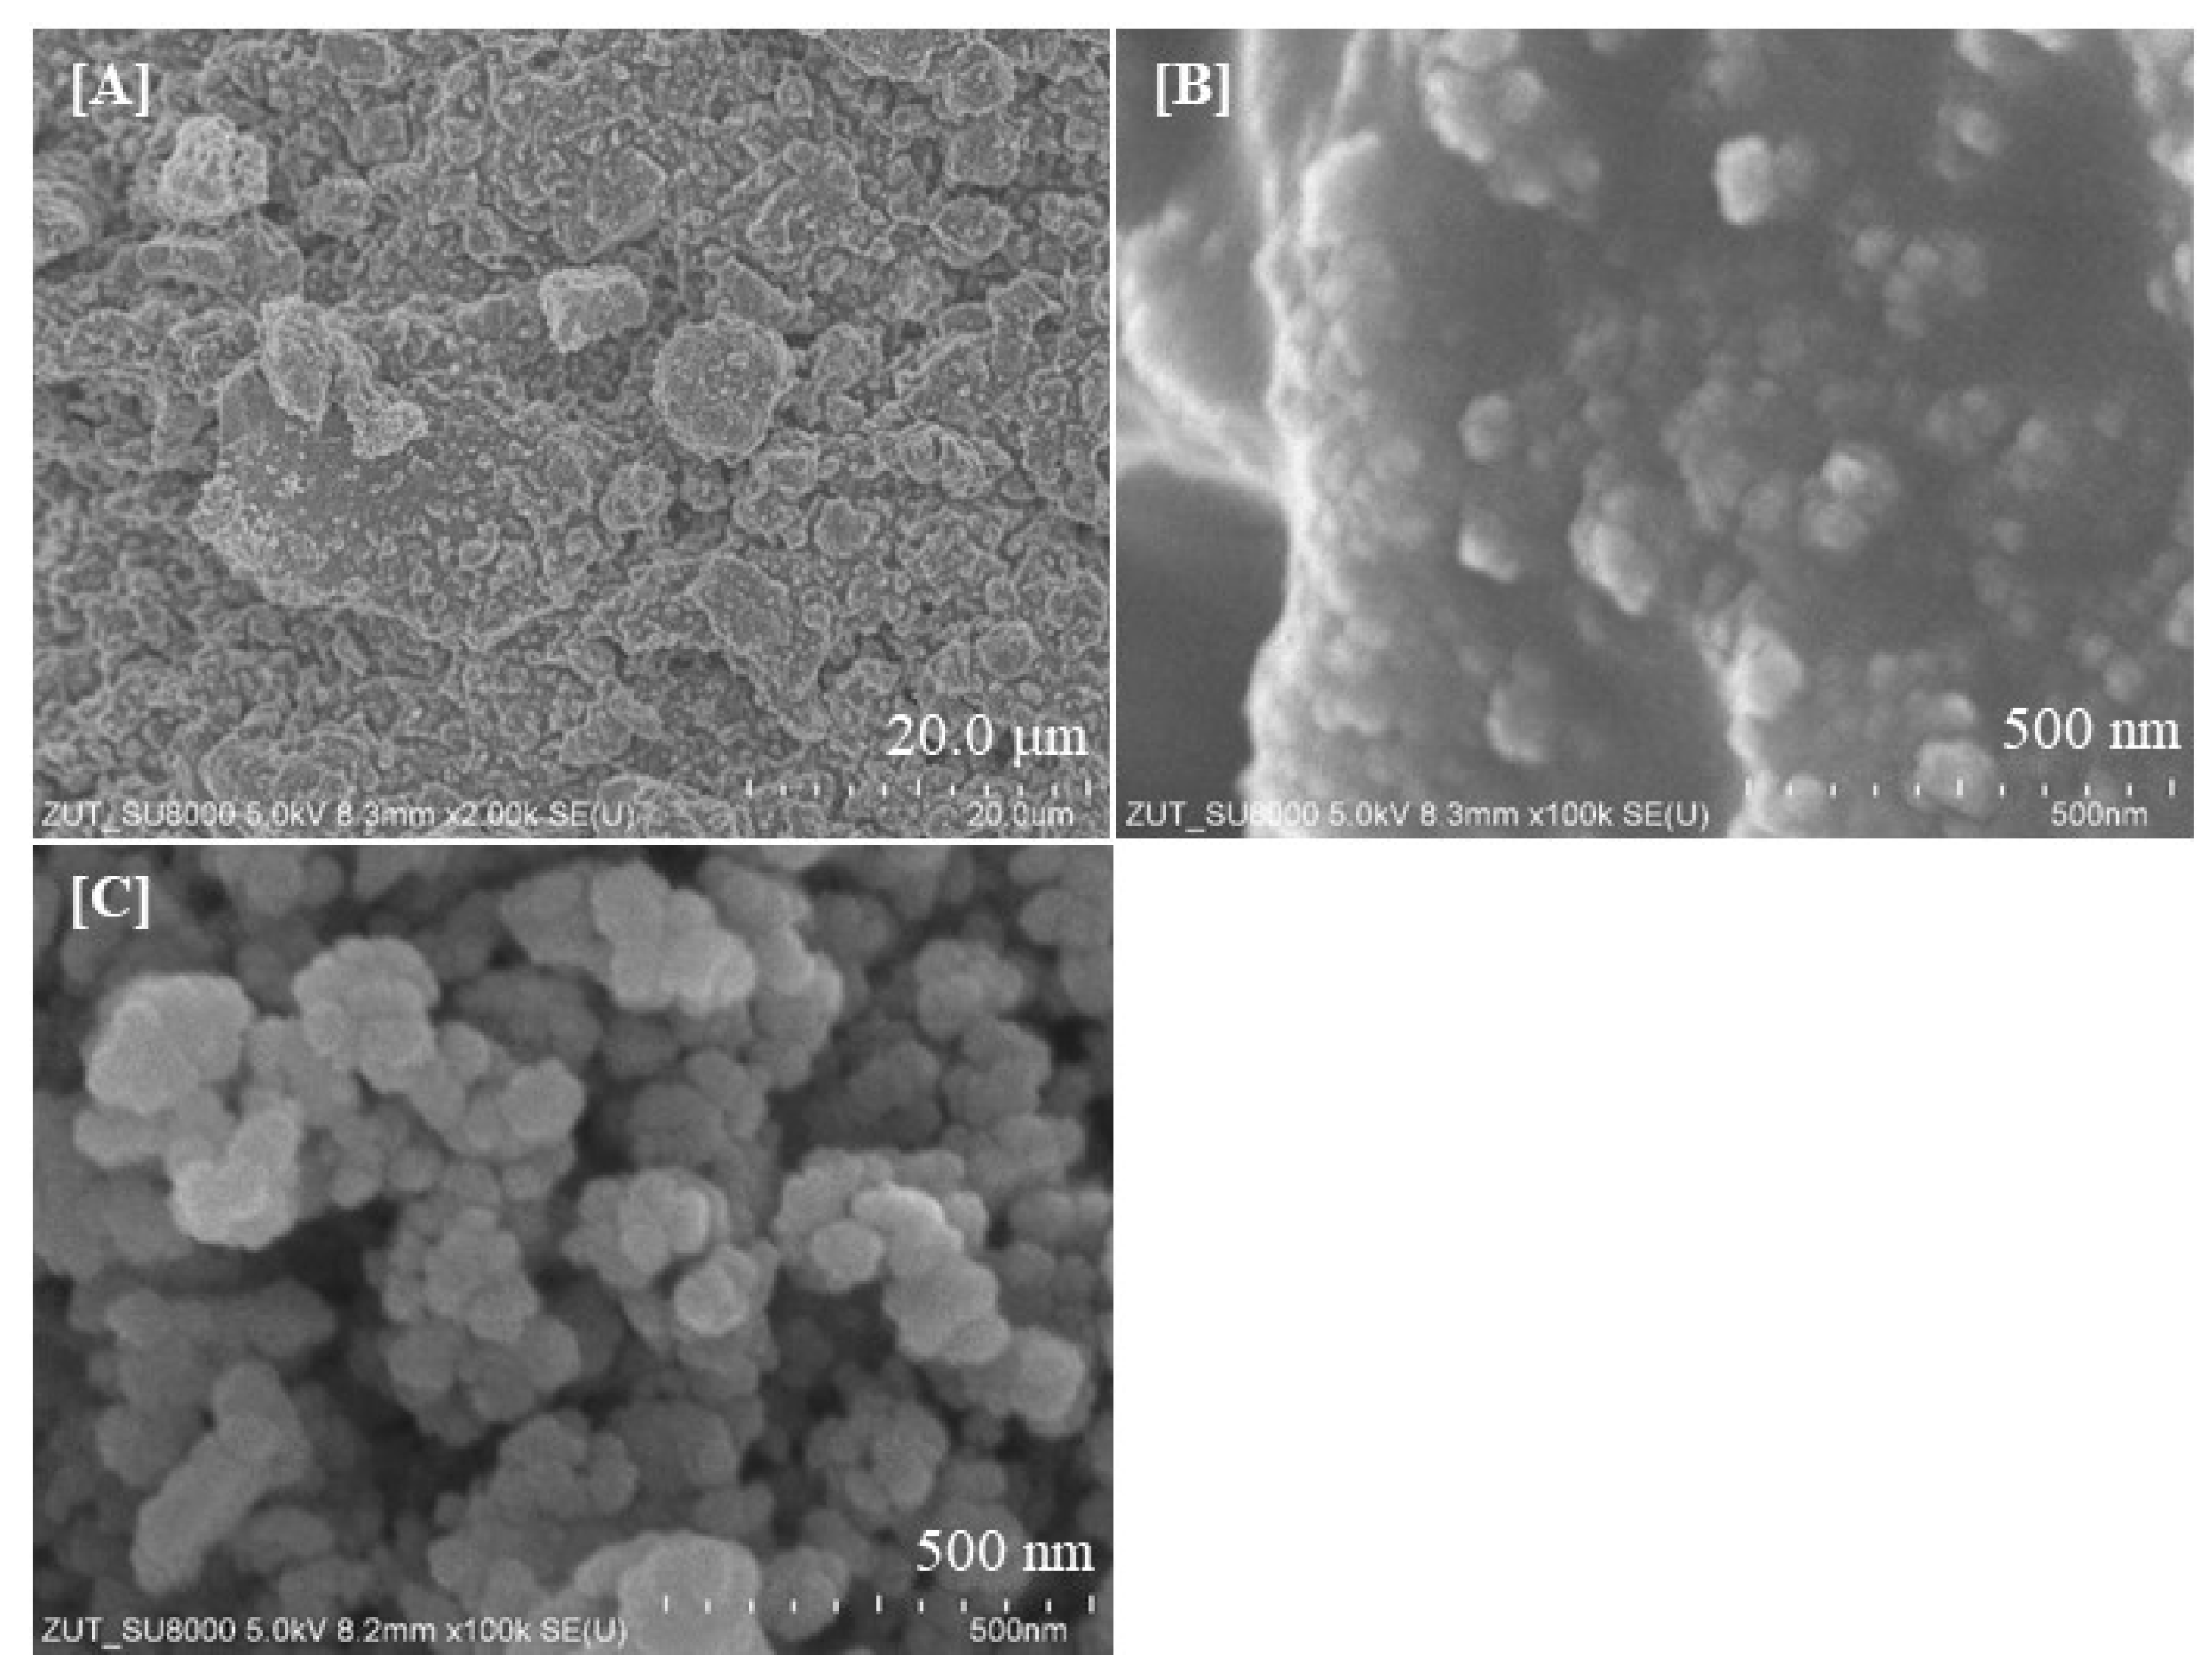
2.1. Characterization of the Photocatalysts
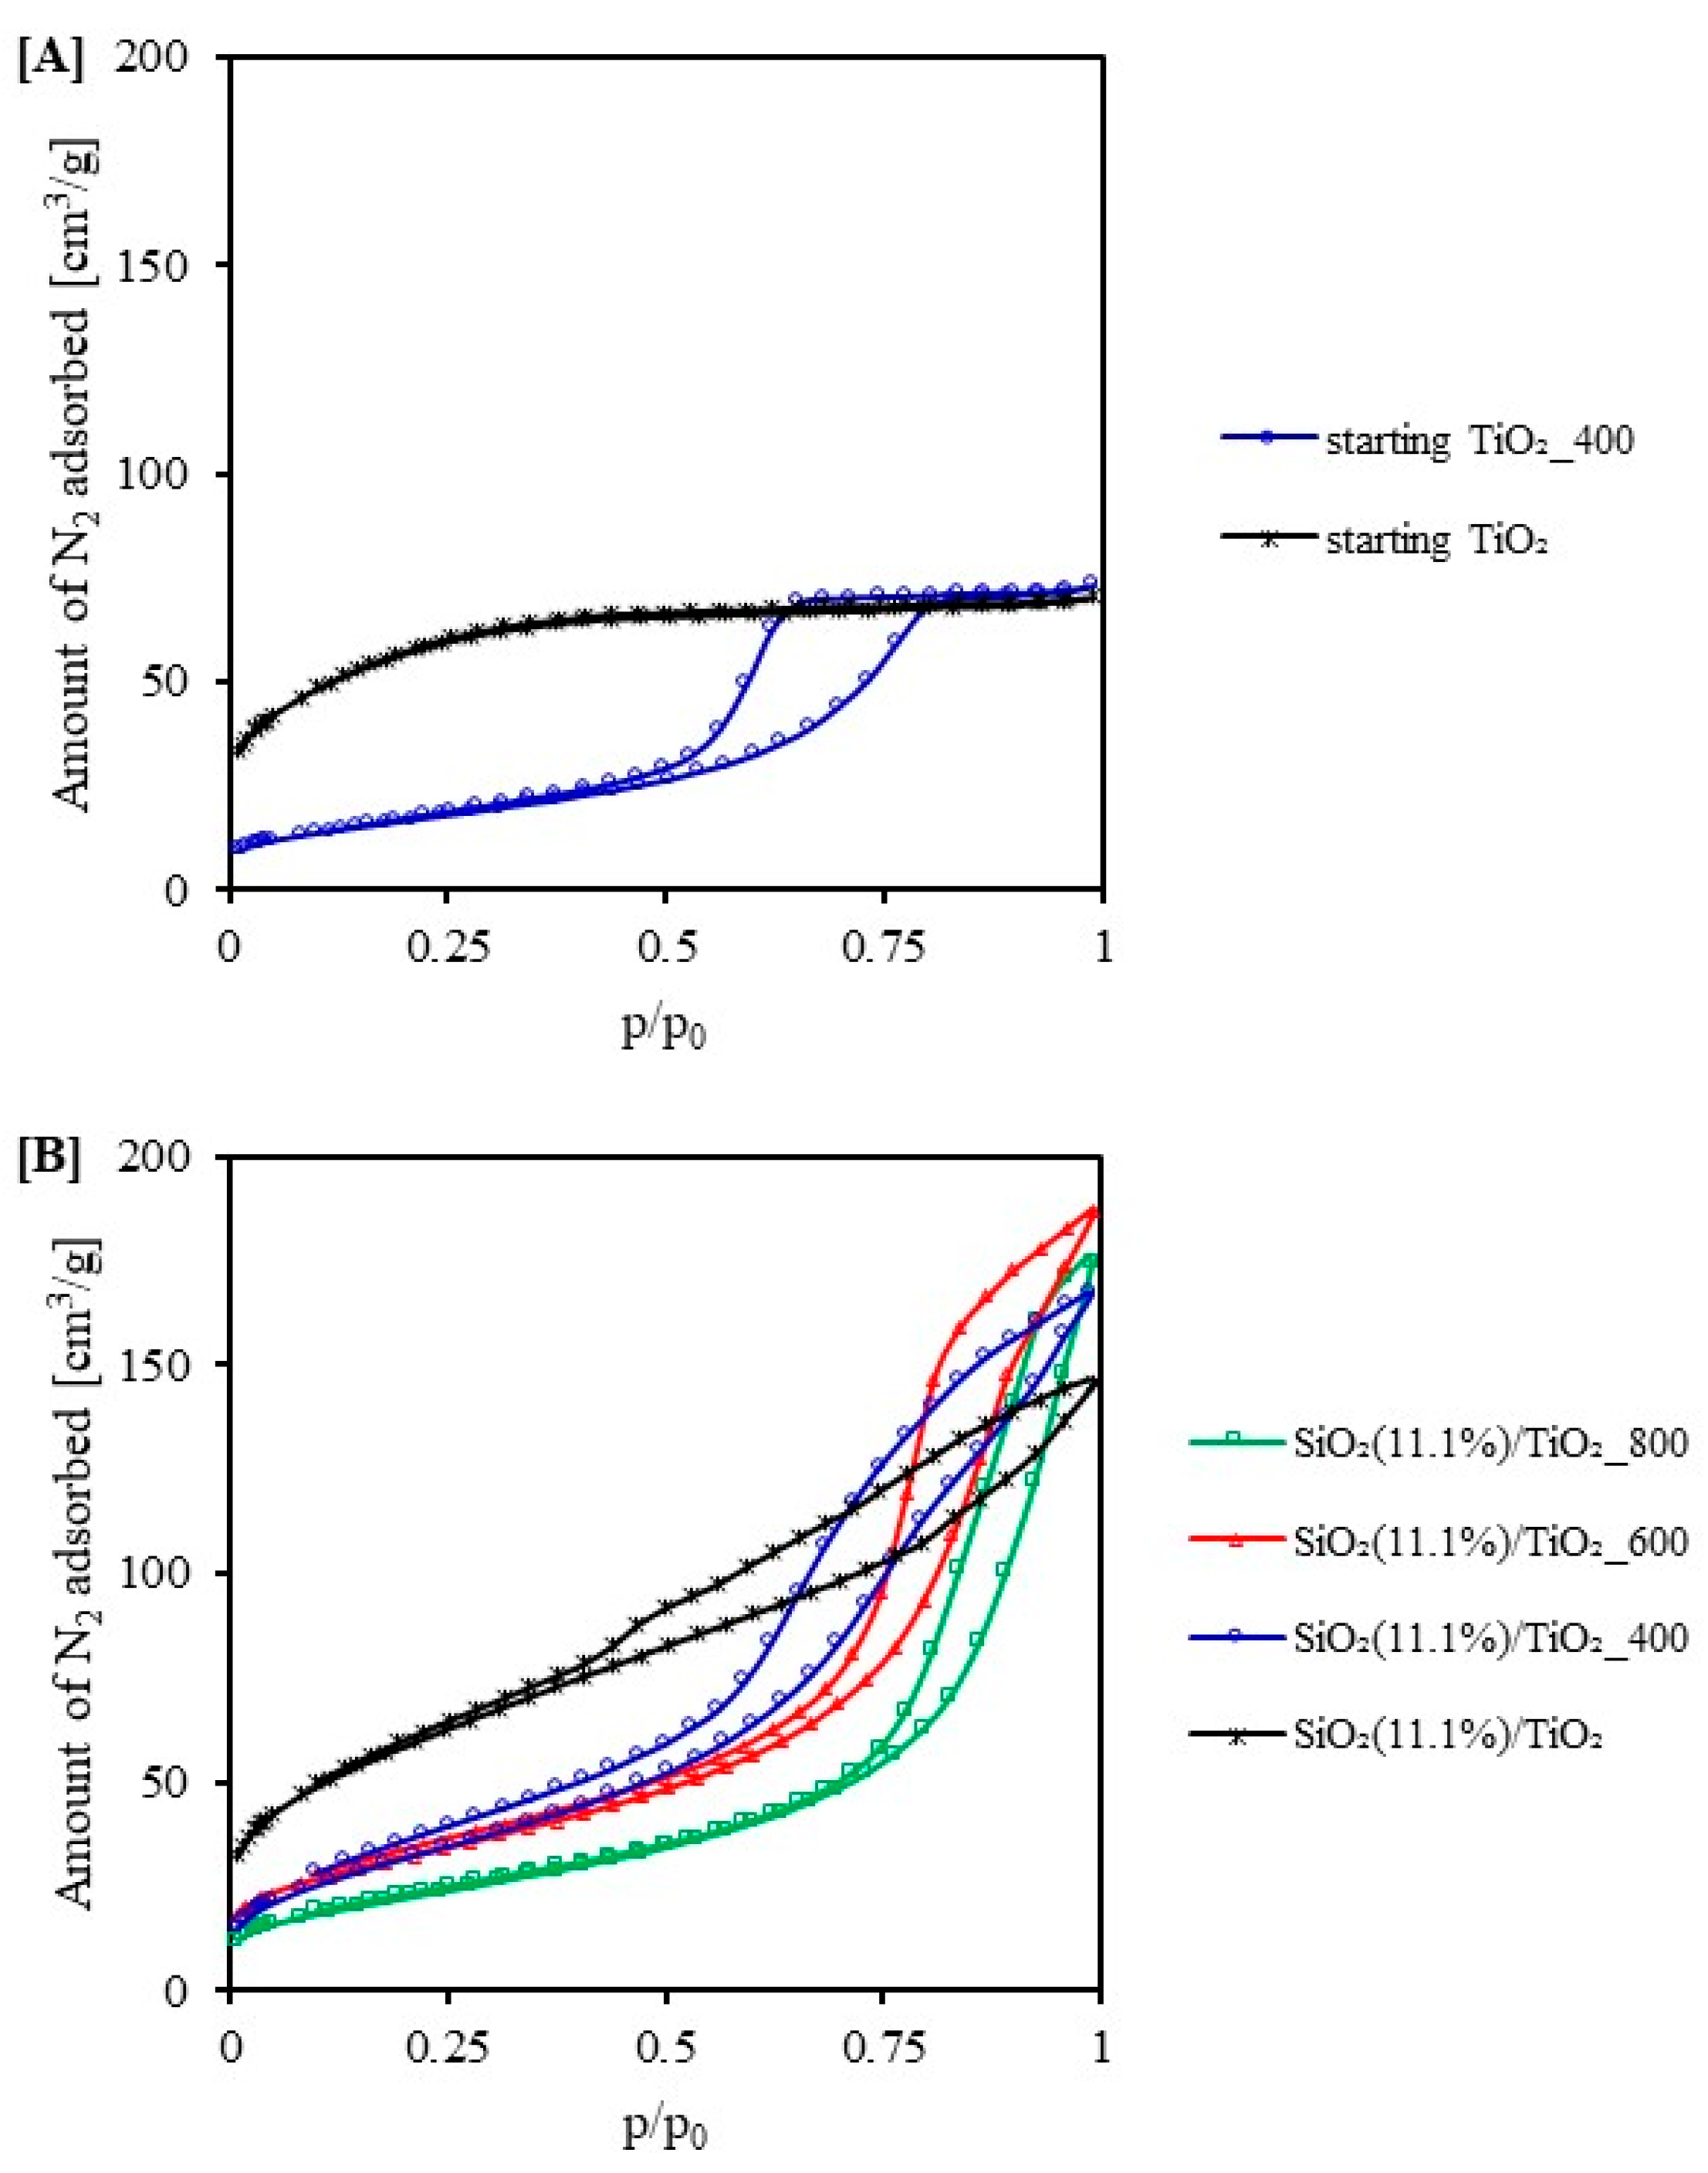
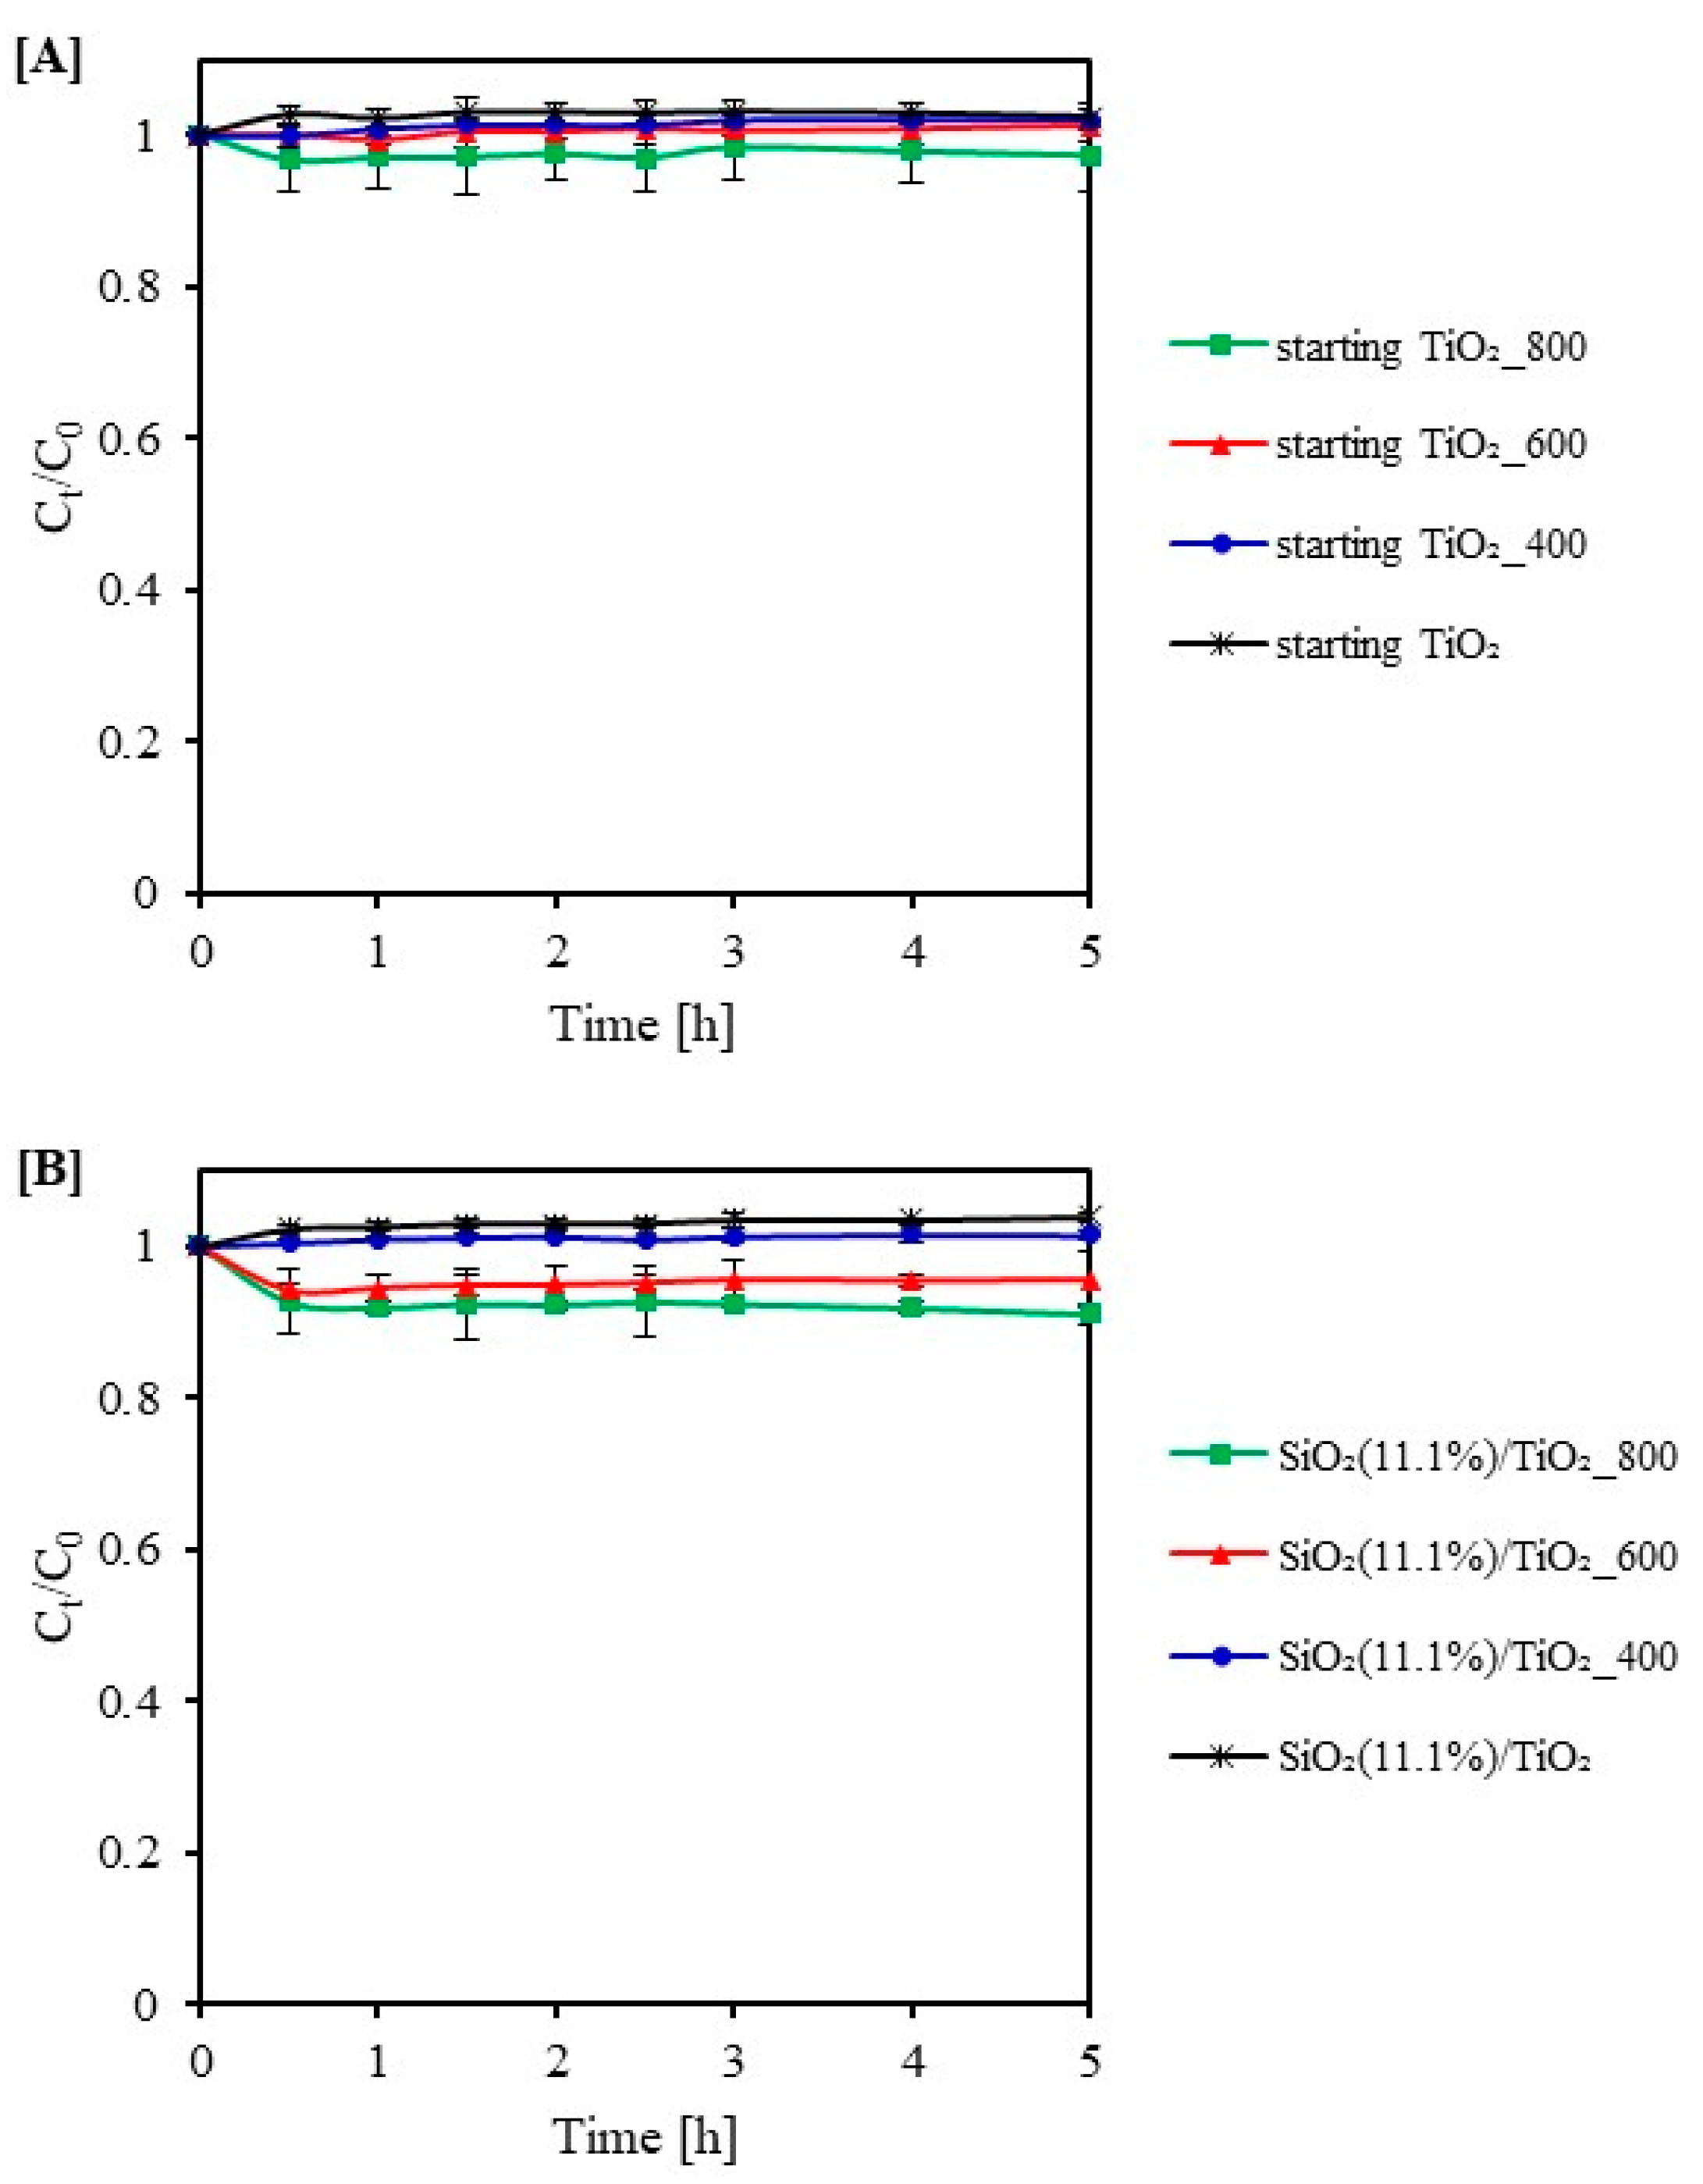
2.2. Adsorption Test
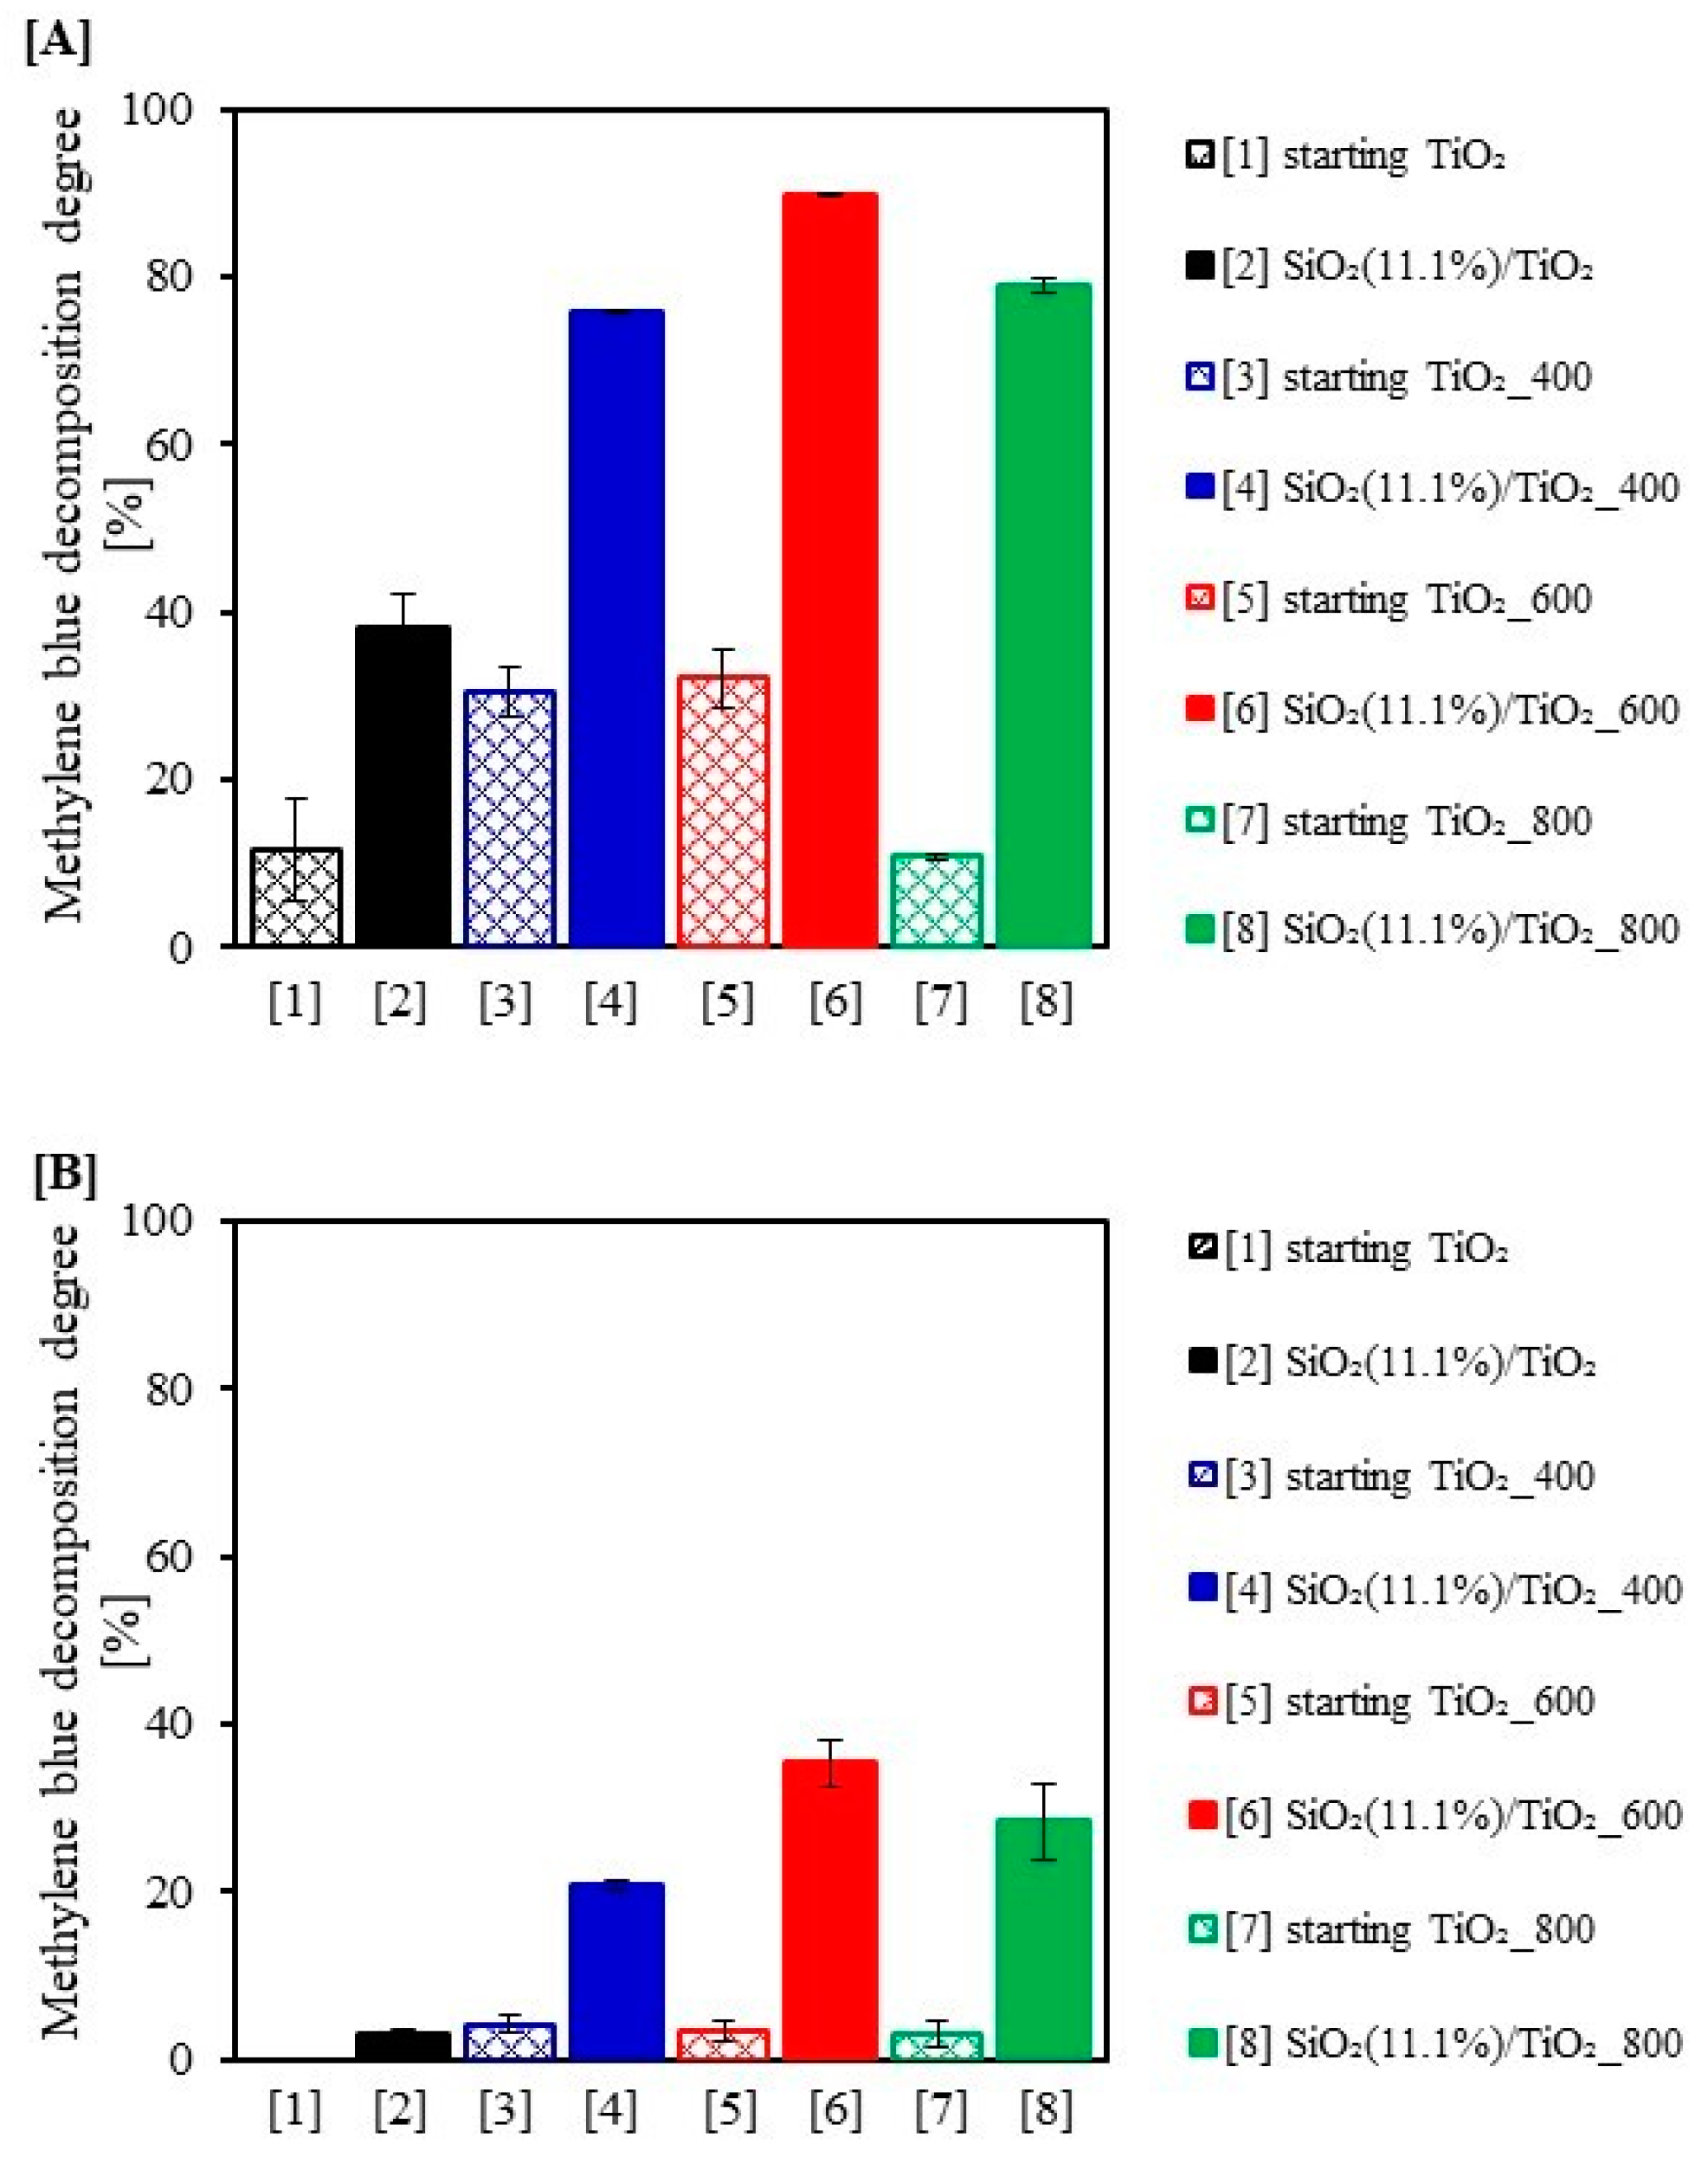
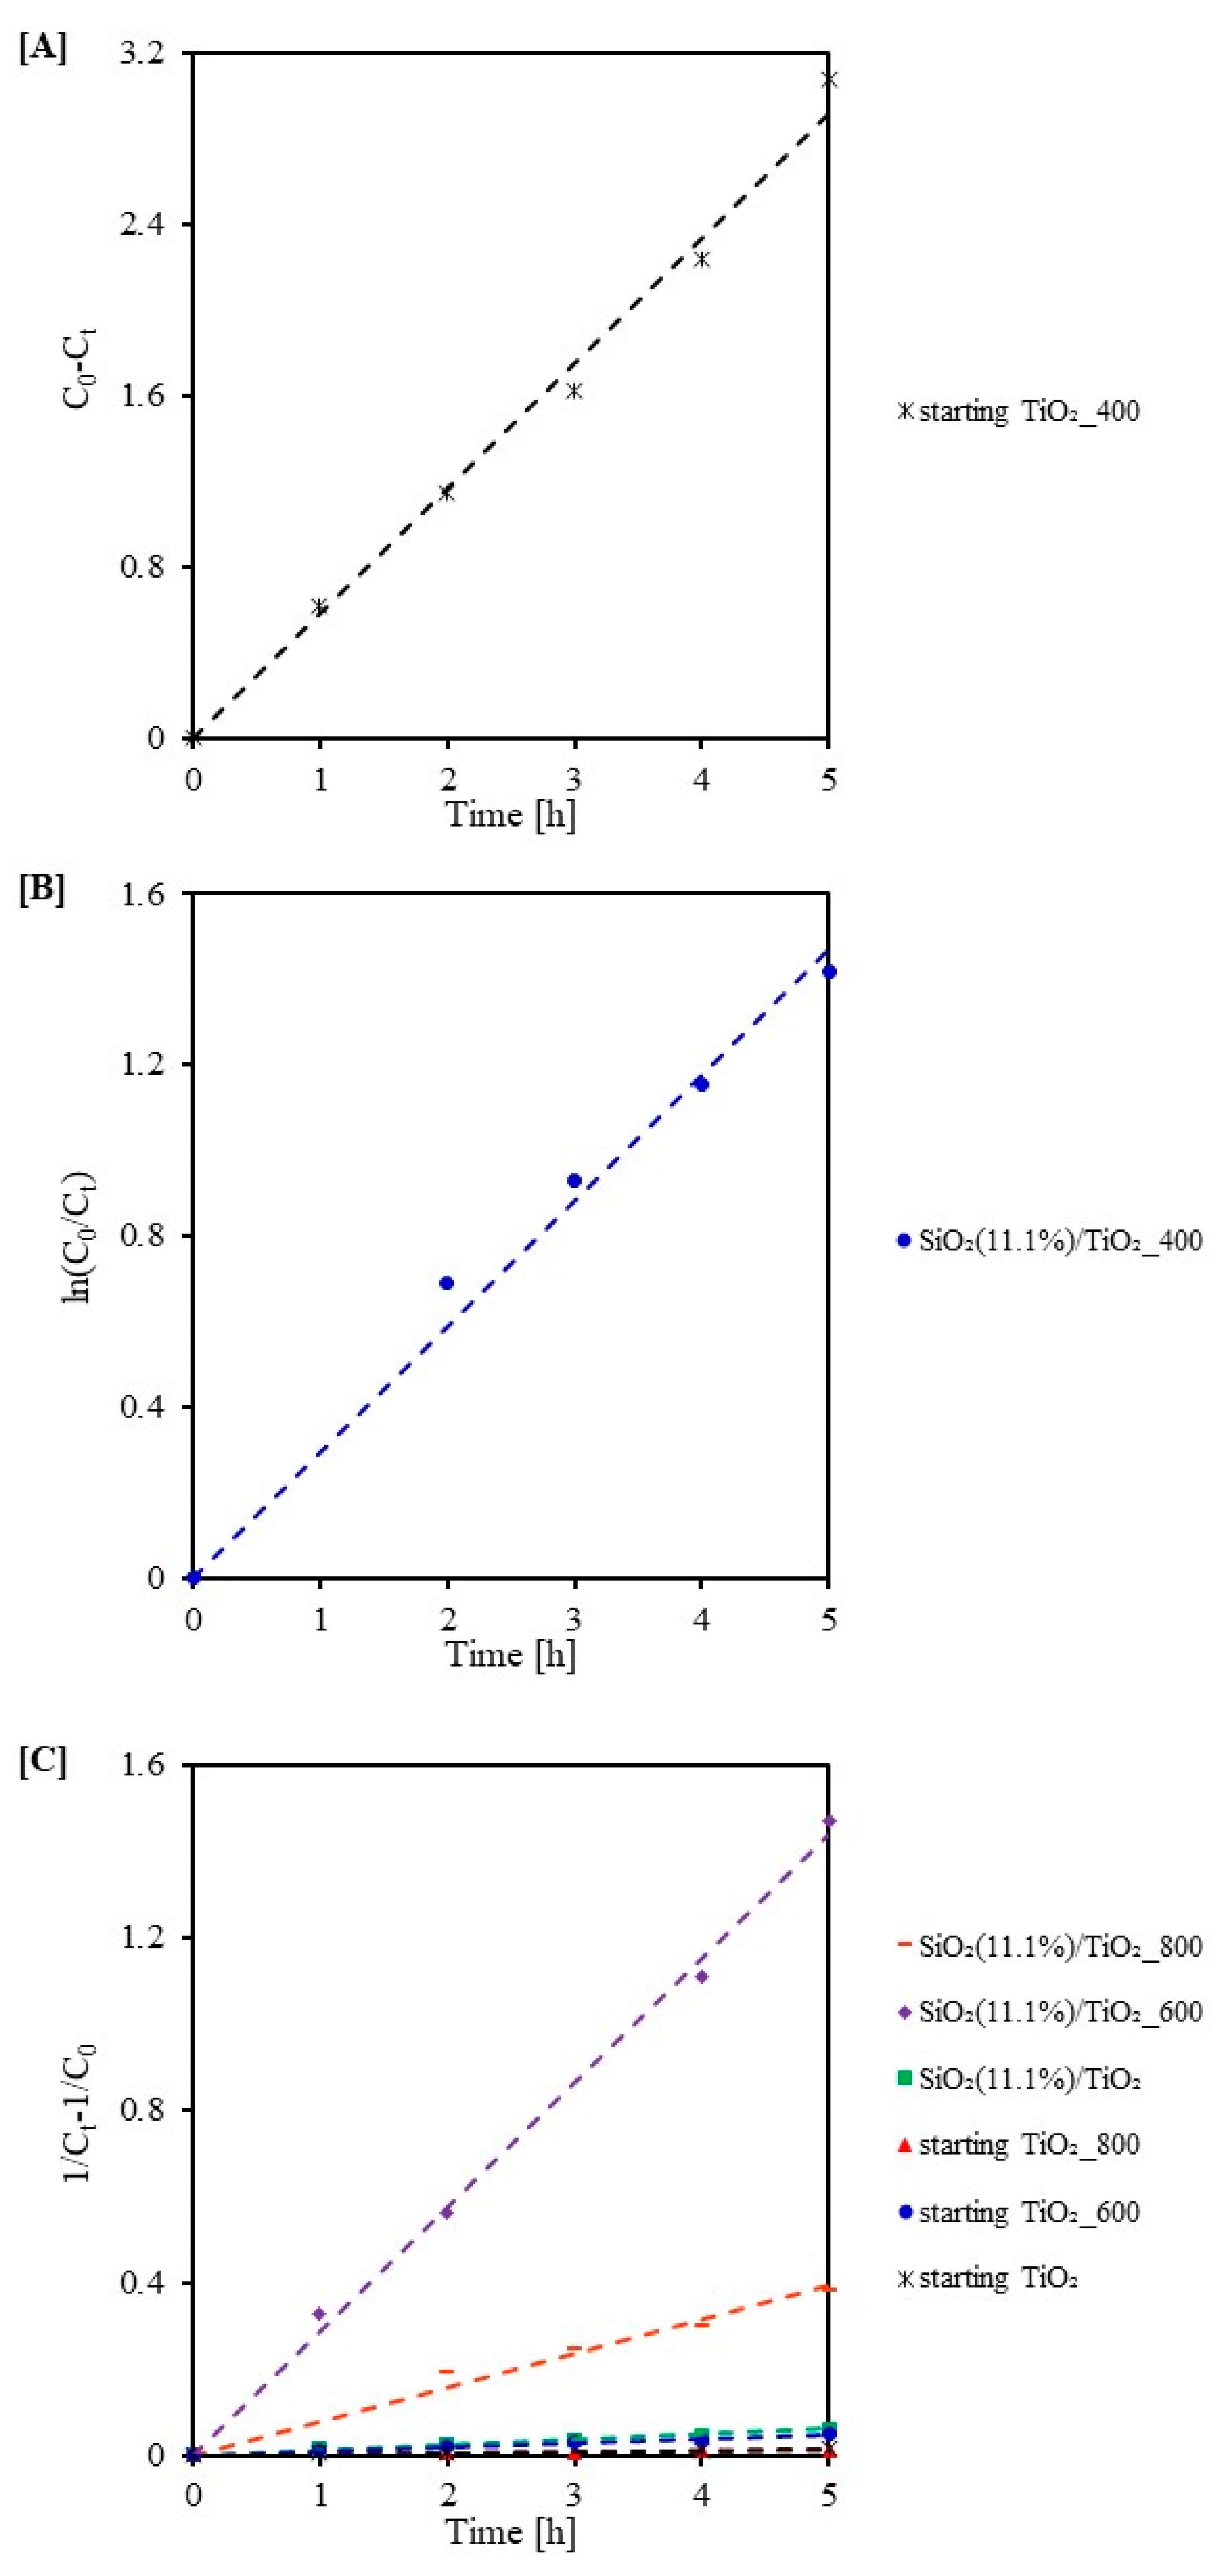
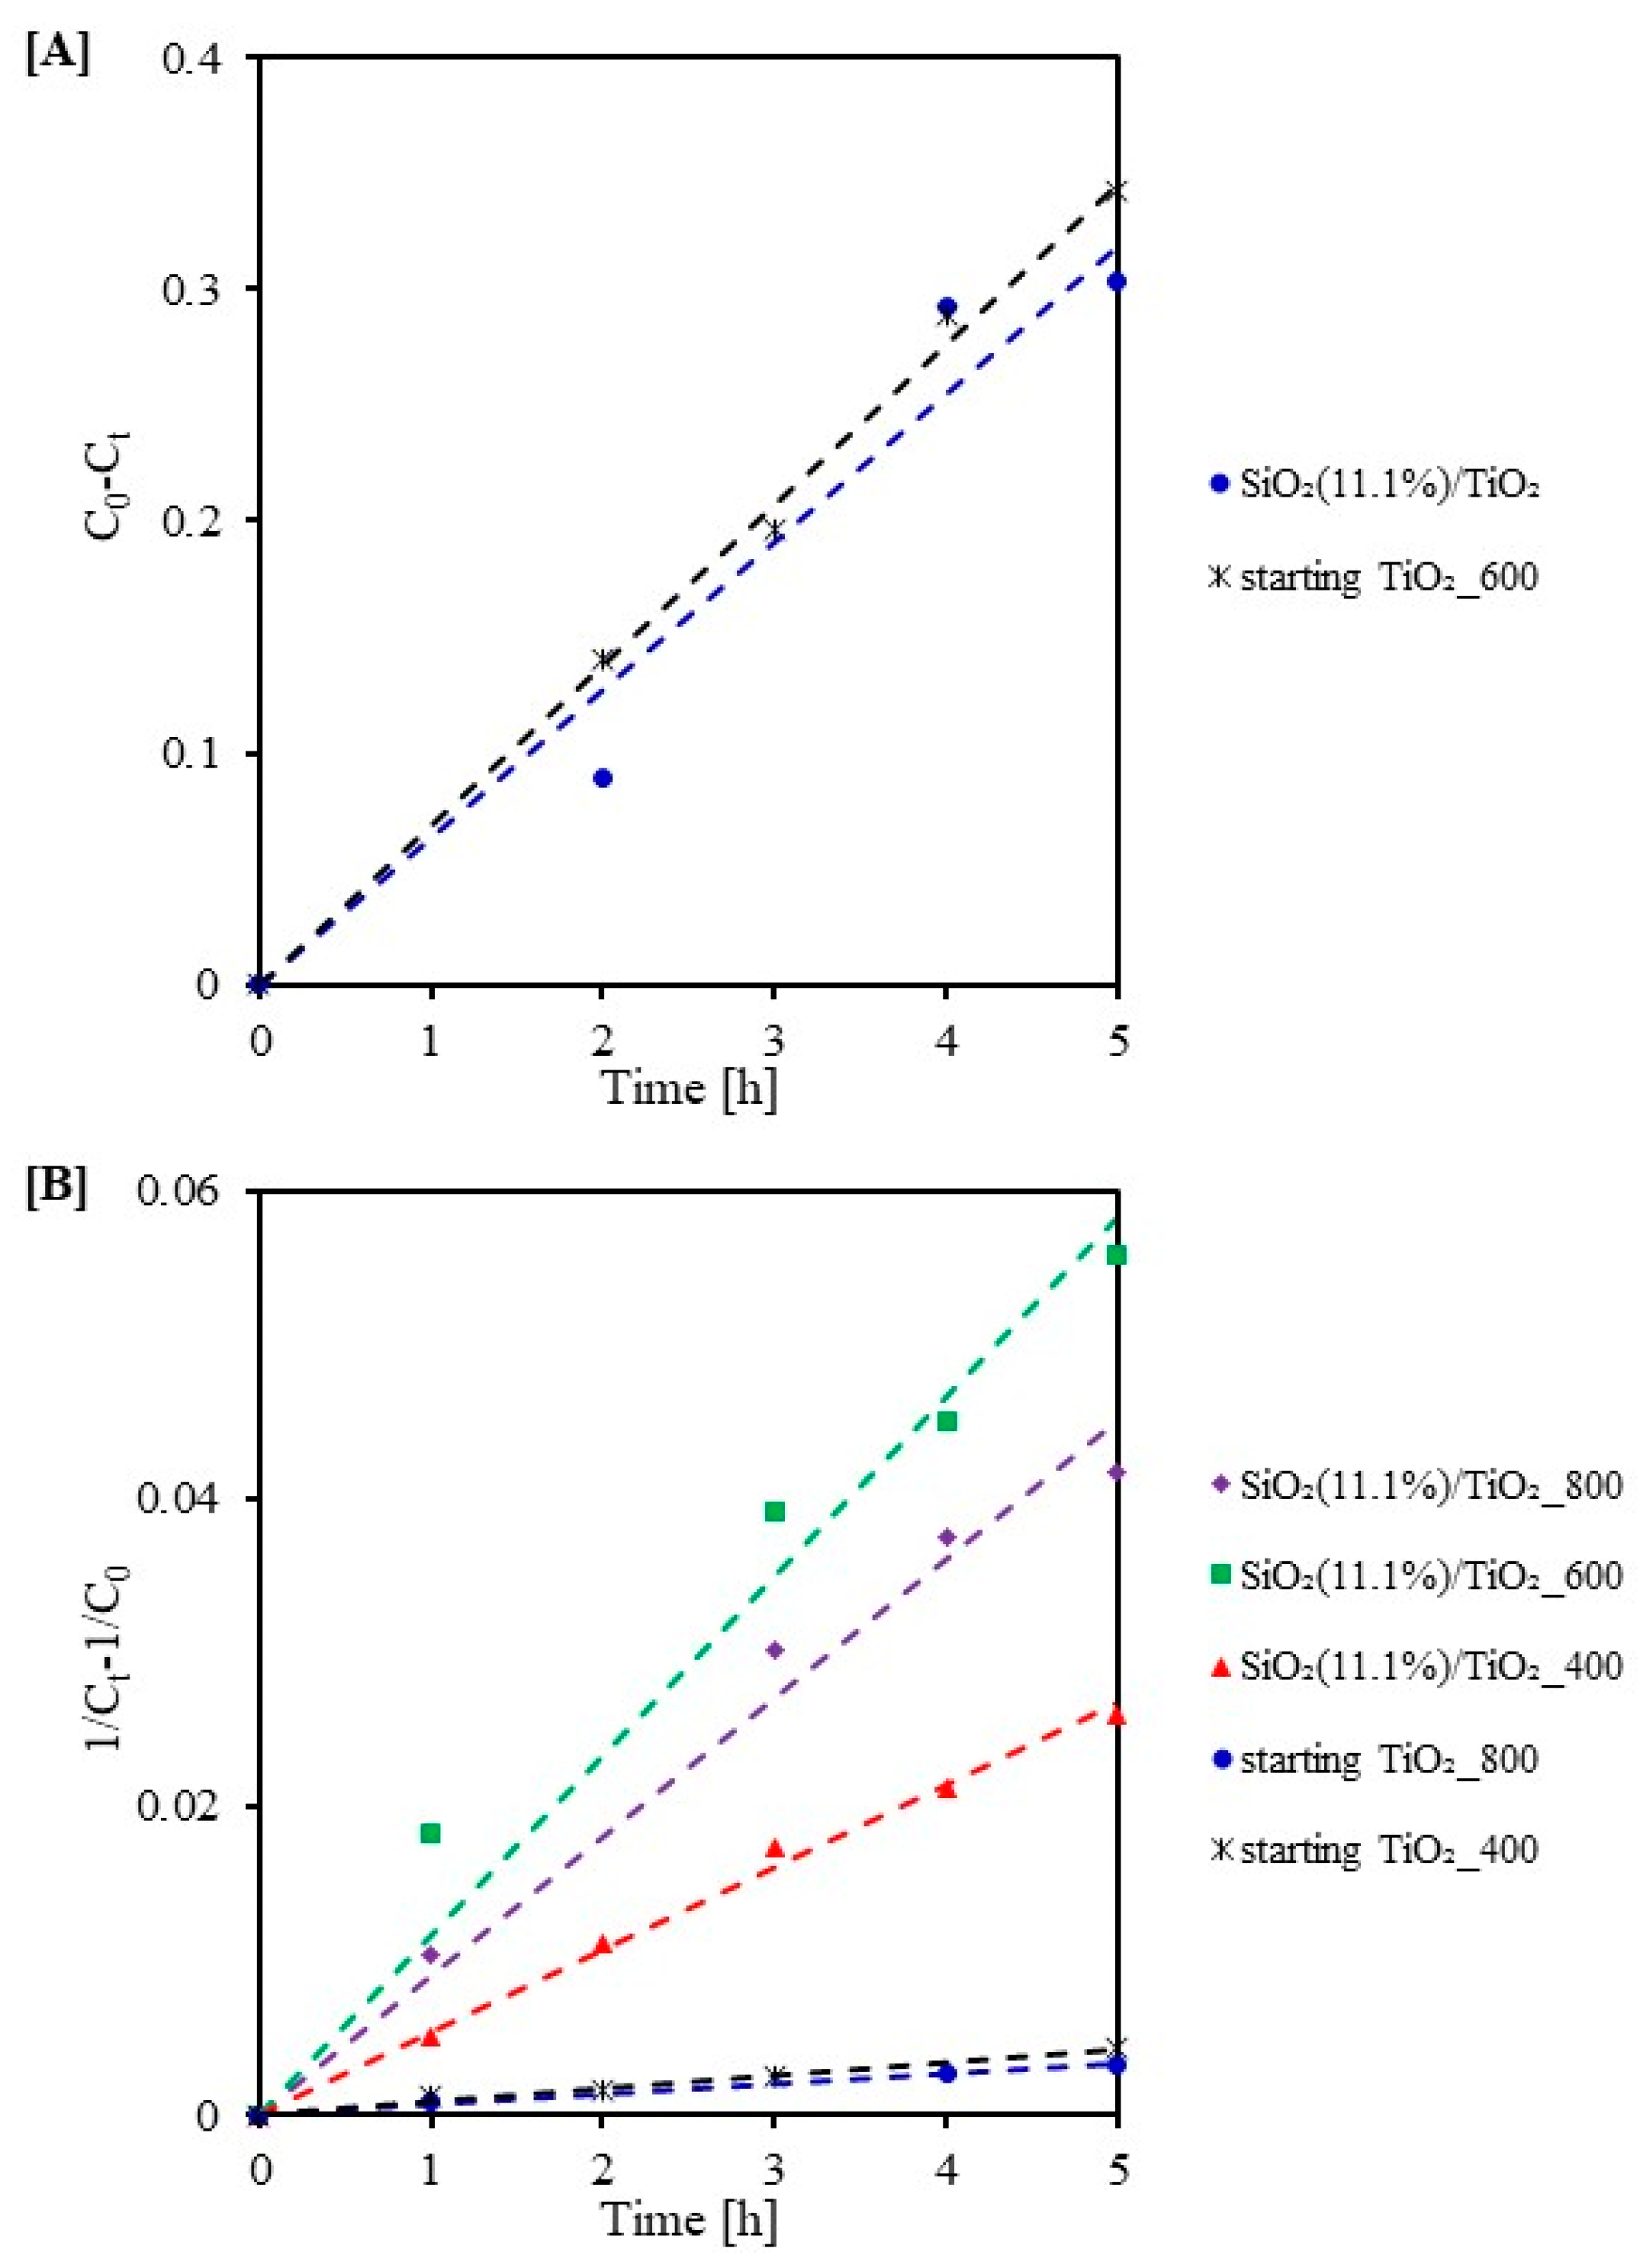
2.3. Photocatalytic Activity Test
2.4. Photocatalytic Mechanism
3. Materials and Methods
3.1. Materials
3.2. Preparation of Photocatalysts
3.3. Characterization Methods
3.4. Photocatalytic Activity Measurements
4. Conclusions
Author Contributions
Funding
Data Availability Statement
Conflicts of Interest
References
- Sultana, T.; Dey, S.C.; Molla, M.; Islam, A.; Hossain, M.R.; Rahman, M.M.; Quddus, M.S.; Moniruzzaman, M.; Shamsuddin, S.M.; Sarker, M. Facile synthesis of TiO2/Chitosan nanohybrid for adsorption-assisted rapid photodegradation of an azo dye in water. React. Kinet. Mech. Catal. 2021, 133, 1121–1139. [Google Scholar] [CrossRef]
- Shathy, R.A.; Fahim, S.A.; Sarker, M.; Quddus, M.S.; Moniruzzaman, M.; Masum, S.M.; Molla, M.A.I. Natural Sunlight Driven Photocatalytic Removal of Toxic Textile Dyes in Water Using B-Doped ZnO/TiO2 Nanocomposites. Catalysts 2022, 12, 308. [Google Scholar] [CrossRef]
- Mondol, B.; Sarker, A.; Shareque, A.M.; Dey, S.C.; Islam, M.T.; Das, A.K.; Shamsuddin, S.M.; Molla, M.A.I.; Sarker, M. Preparation of activated carbon/TiO2 nanohybrids for photodegradation of reactive red-35 dye using sunlight. Photochem 2021, 1, 54–66. [Google Scholar] [CrossRef]
- Guo, Z.; Ma, R.; Li, G. Degradation of phenol by nanomaterial TiO2 in wastewater. Chem. Eng. J. 2006, 119, 55–59. [Google Scholar] [CrossRef]
- Grabowska, E.; Reszczyńska, J.; Zaleska, A. RETRACTED: Mechanism of phenol photodegradation in the presence of pure and modified-TiO2: A review. Water Res. 2012, 46, 5453–5471. [Google Scholar] [CrossRef] [PubMed]
- Borges, M.E.; Sierra, M.; Cuevas, E.; García, R.D.; Esparza, P. Photocatalysis with solar energy: Sunlight-responsive photocatalyst based on TiO2 loaded on a natural material for wastewater treatment. Sol. Energy 2016, 135, 527–535. [Google Scholar] [CrossRef]
- Boyjoo, Y.; Sun, H.; Liu, J.; Pareek, V.K.; Wang, S. A review on photocatalysis for air treatment: From catalyst development to reactor design. Chem. Eng. J. 2017, 310, 537–559. [Google Scholar] [CrossRef]
- Shayegan, Z.; Lee, C.S.; Haghighat, F. TiO2 photocatalyst for removal of volatile organic compounds in gas phase—A review. Chem. Eng. J. 2018, 334, 2408–2439. [Google Scholar] [CrossRef] [Green Version]
- Adnan, R.; Shah, I. A mini-review on rare earth metal-doped TiO2 for photocatalytic remediation of wastewater. Environ. Sci. Pollut. Res. 2016, 23, 15941–15951. [Google Scholar]
- Khalid, N.R.; Majid, A.; Tahir, M.B.; Niaz, N.A.; Khalid, S. Carbonaceous-TiO2 nanomaterials for photocatalytic degradation of pollutants: A review. Ceram. Int. 2017, 43, 14552–14571. [Google Scholar] [CrossRef]
- Mazierski, P.; Mikolajczyk, A.; Bajorowicz, B.; Malankowska, A.; Zaleska-Medynska, A.; Nadolna, J. The role of lanthanides in TiO2-based photocatalysis: A review. Appl. Catal. B Environ. 2018, 233, 301–317. [Google Scholar] [CrossRef]
- Yoo, D.K.; Ahmed, I.; Sarker, M.; Lee, H.J.; Vinu, A.; Jhung, S.H. Metal–organic frameworks containing uncoordinated nitrogen: Preparation, modification, and application in adsorption. Mater. Today 2021, 51, 566–585. [Google Scholar] [CrossRef]
- Sarker, M.; Yoo, D.K.; Lee, S.; Kim, T.W.; Kim, C.U.; Jhung, S.H. Conversion of Y into SSZ-13 zeolite, in the absence of extra silica, alumina and seed crystals, with N, N, N-dimethylethylcyclohexylammonium bromide, and application of the SSZ-13 zeolite in the propylene production from ethylene. Catal. Today 2021, 375, 94–100. [Google Scholar] [CrossRef]
- Khanna, S.; Chaliyawala, H.; Paneliya, S.; Roy, D.; Mukhopadhyay, K.; Banerjee, R.; Mukhopadhyay, I. Systematic investigation of close-packed silica nanospheres monolayer under sintering conditions. J. Eur. Ceram. Soc. 2019, 39, 1411–1419. [Google Scholar] [CrossRef]
- Zhang, Y.P.; Lee, S.H.; Reddy, K.R.; Gopalan, A.I.; Lee, K.P. Synthesis and characterization of core-shell SiO2 nanoparticles/poly (3-aminophenylboronic acid) composites. J. Appl. Polym. Sci. 2007, 104, 2743–2750. [Google Scholar] [CrossRef]
- Zhang, L.; Xing, Z.; Zhang, H.; Li, Z.; Wu, X.; Zhang, X.; Zhang, Y.; Zhou, W. High thermostable ordered mesoporous SiO2–TiO2 coated circulating-bed biofilm reactor for unpredictable photocatalytic and biocatalytic performance. Appl. Catal. B Environ. 2016, 180, 521–529. [Google Scholar] [CrossRef]
- Pal, A.; Jana, T.K.; Chatterjee, K. Silica supported TiO2 nanostructures for highly efficient photocatalytic application under visible light irradiation. Mater. Res. Bull. 2016, 76, 353–357. [Google Scholar] [CrossRef]
- Raj, K.; Smith, Y.R.; Subramanian, V.R.; Viswanathan, B. Structural studies of silica modified titania and its photocatalytic activity of 4-chlorophenol oxidation in aqueous medium. Indian J. Chem. 2010, 49A, 867–875. [Google Scholar]
- Fu, X.; Clark, L.A.; Yang, Q.; Anderson, M.A. Enhanced photocatalytic performance of titania-based binary metal oxides: TiO2/SiO2 and TiO2/ZrO2. Environ. Sci. Technol. 1996, 30, 647–653. [Google Scholar] [CrossRef]
- Chun, H.; Yizhong, W.; Hongxiao, T. Influence of adsorption on the photodegradation of various dyes using surface bond-conjugated TiO2/SiO2 photocatalyst. Appl. Catal. B Environ. 2001, 35, 95–105. [Google Scholar] [CrossRef]
- Xie, C.; Xu, Z.; Yang, Q.; Xue, B.; Du, Y.; Zhang, J. Enhanced photocatalytic activity of titania–silica mixed oxide prepared via basic hydrolyzation. Mater. Sci. Eng. B 2004, 112, 34–41. [Google Scholar] [CrossRef]
- Ding, Z.; Lu, G.Q.; Greenfield, P.F. Role of the crystallite phase of TiO2 in heterogeneous photocatalysis for phenol oxidation in water. J. Phys. Chem. B 2000, 104, 4815–4820. [Google Scholar] [CrossRef]
- Iwamoto, S.; Tanakulrungsank, W.; Inoue, M.; Kagawa, K.; Praserthdam, P. Synthesis of large-surface area silica-modified titania ultrafine particles by the glycothermal method. J. Mater. Sci. Lett. 2000, 19, 1439–1443. [Google Scholar] [CrossRef]
- Cheng, P.; Zheng, M.; Jin, Y.; Huang, Q.; Gu, M. Preparation and characterization of silica–doped titania photocatalyst through sol–gel method. Mater. Lett. 2003, 57, 2989–2994. [Google Scholar]
- Nilchi, A.; Janitabar-Darzi, S.; Mahjoub, A.R.; Rasouli-Garmarodi, S. New TiO2/SiO2 nanocomposites—Phase transformations and photocatalytic studies. Colloids Surf. A Physicochem. Eng. Asp. 2010, 361, 25–30. [Google Scholar] [CrossRef]
- Wang, J.; Zhang, W.; Zhu, B.; Xiao, Y. Microstructure and photocatalytic activity of TiO2-SiO2 composite materials. In Proceedings of the 2020 6th International Conference on Materials, Mechanical Engineering and Automation Technology, Zhuhai, China, 1–3 May 2020. [Google Scholar] [CrossRef]
- Babyszko, A.; Wanag, A.; Sadłowski, M.; Kusiak-Nejman, E.; Morawski, A.W. Synthesis and Characterization of SiO2/TiO2 as Photocatalyst on Methylene Blue Degradation. Catalysts 2022, 12, 1372. [Google Scholar] [CrossRef]
- SiO2—Krzemionka Koloidalna, Nanoproszek, Hydrofilowy. Available online: https://3d-nano.com/pl/catalogue/sio2-krzemionka-koloidalna-nanoproszek-hydrofilowy/ (accessed on 18 November 2022).
- Hu, Y.; Tsai, H.L.; Huang, C.L. Effect of brookite phase on the anatase–rutile transition in titania nanoparticles. J. Eur. Ceram. Soc. 2003, 23, 691–696. [Google Scholar] [CrossRef]
- Pelaez, M.; Nolan, N.T.; Pillai, S.C.; Seery, M.K.; Falaras, P.; Kontos, A.G.; Dunlop, P.S.M.; Hamilton, J.W.J.; Byrne, J.A.; O’Shea, K.; et al. A review on the visible light active titanium dioxide photocatalysts for environmental applications. Appl. Catal. B Environ. 2012, 125, 331–349. [Google Scholar] [CrossRef] [Green Version]
- Tobaldi, D.M.; Tucci, A.; Škapin, A.S.; Esposito, L. Effects of SiO2 addition on TiO2 crystal structure and photocatalytic activity. J. Eur. Ceram. Soc 2010, 30, 2481–2490. [Google Scholar] [CrossRef]
- Lu, Z.; Jiang, X.; Zhou, B.; Wu, X.; Lu, L. Study of effect annealing temperature on the structure, morphology and photocatalytic activity of Si doped TiO2 thin films deposited by electron beam evaporation. Appl. Surf. Sci. 2011, 257, 10715–10720. [Google Scholar] [CrossRef]
- Xu, G.; Zheng, Z.; Wu, Y.; Feng, N. Effect of silica on the microstructure and photocatalytic properties of titania. Ceram. Int. 2009, 35, 1–5. [Google Scholar] [CrossRef]
- Sing, K.S.W. Reporting physisorption data for gas/solid systems with special reference to the determination of surface area and porosity (Provisional). Pure Appl. Chem. 1982, 54, 2201–2218. [Google Scholar] [CrossRef]
- Leofanti, G.; Padovan, M.; Tozzola, G.; Venturelli, B.J.C.T. Surface area and pore texture of catalysts. Catal. Today 1998, 41, 207–219. [Google Scholar] [CrossRef]
- Bao, N.; Wei, Z.; Ma, Z.; Liu, F.; Yin, G. Si-doped mesoporous TiO2 continuous fibers: Preparation by centrifugal spinning and photocatalytic properties. J. Hazard. Mater. 2010, 174, 129–136. [Google Scholar] [CrossRef]
- Nyamukamba, P.; Tichagwa, L.; Greyling, C. The influence of carbon doping on TiO2 nanoparticle size, surface area, anatase to rutile phase transformation and photocatalytic activity. Mater. Sci. Forum 2012, 712, 49–63. [Google Scholar] [CrossRef]
- Winter, M.; Hamal, D.; Yang, X.; Kwen, H.; Jones, D.; Rajagopalan, S.; Klabunde, K.J. Defining reactivity of solid sorbents: What is the most appropriate metric? Chem. Mater. 2009, 21, 2367–2374. [Google Scholar] [CrossRef]
- Resende, S.F.; Nunes, E.H.M.; Houmard, M.; Vasconcelos, W.L. Simple sol–gel process to obtain silica-coated anatase particles with enhanced TiO2-SiO2 interfacial area. J. Colloid Interface Sci. 2014, 433, 211–217. [Google Scholar] [CrossRef] [Green Version]
- Yang, G.; Jiang, Z.; Shi, H.; Xiao, T.; Yan, Z. Preparation of highly visible-light active N-doped TiO2 photocatalyst. J. Mater. Chem. 2010, 20, 5301–5309. [Google Scholar] [CrossRef]
- Rokicka-Konieczna, P.; Markowska-Szczupak, A.; Kusiak-Nejman, E.; Morawski, A.W. Photocatalytic water disinfection under the artificial solar light by fructose-modified TiO2. Chem. Eng. J. 2019, 372, 203–215. [Google Scholar] [CrossRef]
- Abdullah, M.A.; Chong, F.K. Dual-effects of adsorption and photodegradation of methylene blue by tungsten-loaded titanium dioxide. Chem. Eng. J. 2010, 158, 418–425. [Google Scholar]
- Sienkiewicz, A.; Rokicka-Konieczna, P.; Wanag, A.; Kusiak-Nejman, E.; Morawski, A.W. Artificial Solar Light-Driven APTES/TiO2 Photocatalysts for Methylene Blue Removal from Water. Molecules 2022, 27, 947. [Google Scholar] [CrossRef] [PubMed]
- Banerjee, S.; Gopal, J.; Muraleedharan, P.; Tyagi, A.K.; Raj, B. Physics and chemistry of photocatalytic titanium dioxide: Visualization of bactericidal activity using atomic force microscopy. Curr. Sci. 2006, 90, 1378–1383. [Google Scholar]
- Suttiponparnit, K.; Jiang, J.; Sahu, M.; Suvachittanont, S.; Charinpanitkul, T.; Biswas, P. Role of surface area, primary particle size, and crystal phase on titanium dioxide nanoparticle dispersion properties. Nanoscale Res. Lett. 2011, 6, 27. [Google Scholar] [CrossRef] [PubMed] [Green Version]
- Jesionowski, T.; Żurawska, J.; Krysztafkiewicz, A.; Pokora, M.; Waszak, D.; Tylus, W. Physicochemical and morphological properties of hydrated silicas precipitated following alkoxysilane surface modification. Appl. Surf. Sci. 2003, 205, 212–224. [Google Scholar] [CrossRef]
- Mutuma, B.K.; Shao, G.N.; Kim, W.D.; Kim, H.T. Sol–gel synthesis of mesoporous anatase–brookite and anatase–brookite–rutile TiO2 nanoparticles and their photocatalytic properties. J. Colloid Interface Sci. 2015, 442, 1–7. [Google Scholar] [CrossRef] [PubMed]
- Herrmann, J.M. Heterogeneous photocatalysis: Fundamentals and application to the removal of various types of aqueous pollutants. Catal. Today 1999, 53, 115–129. [Google Scholar] [CrossRef]
- Sienkiewicz, A.; Wanag, A.; Kusiak-Nejman, E.; Ekiert, E.; Rokicka-Konieczna, P.; Morawski, A.W. Effect of calcination on the photocatalytic activity and stability of TiO2 photocatalysts modified with APTES. J. Environ. Chem. Eng. 2021, 9, 104794. [Google Scholar] [CrossRef]
- Almquist, C.B.; Biswas, P. Role of synthesis method and particle size of nanostructured TiO2 on its photoactivity. J. Catal. 2002, 212, 145–156. [Google Scholar] [CrossRef]
- Yang, Z.Y.; Shen, G.Y.; He, Y.P.; Liu, X.X.; Yang, S.J. Preparation of TiO2/SiO2 composite oxide and its photocatalytic degradation of rhodamine B. J. Porous Mater. 2016, 23, 589–599. [Google Scholar] [CrossRef]
- Zhang, W.; Zhang, Y.; Yang, K.; Yang, Y.; Jia, J.; Guo, L. Photocatalytic performance of SiO2/CNOs/TiO2 to accelerate the degradation of Rhodamine B under visible light. Nanomaterials 2019, 9, 1671. [Google Scholar] [CrossRef] [Green Version]
- Chen, D.; Zou, L.; Li, S.; Zheng, F. Nanospherical like reduced graphene oxide decorated TiO2 nanoparticles: An advanced catalyst for the hydrogen evolution reaction. Sci. Rep. 2016, 6, 1–8. [Google Scholar] [CrossRef] [Green Version]
- Sahoo, C.; Gupta, A.K.; Sasidharan Pillai, I.M. Photocatalytic degradation of methylene blue dye from aqueous solution using silver ion-doped TiO2 and its application to the degradation of real textile wastewater. J. Environ. Sci. Health 2012, 47, 1428–1438. [Google Scholar] [CrossRef]
- Khan, F.; Wahab, R.; Hagar, M.; Alnoman, R.; Rashid, M. Nanotransition materials (NTMs): Photocatalysis, validated high effective sorbent models study for organic dye degradation and precise mathematical data’s at standardized level. Nanomaterials 2018, 8, 134. [Google Scholar] [CrossRef] [PubMed]


| Sample Code | Phase Composition [%] | Mean Crystallite Size [nm] | ||||
|---|---|---|---|---|---|---|
| Anatase | Brookite | Rutile | Anatase | Brookite | Rutile | |
| starting TiO2 | 57 | 43 | - | 5 | 2 | - |
| starting TiO2_400 | 63 | 37 | - | 14 | 9 | - |
| starting TiO2_600 | 2 | - | 98 | 57 | - | 132 |
| starting TiO2_800 | - | - | 100 | - | - | 228 |
| SiO2(11.1%)/TiO2 | 81 | 19 | - | 5 | 5 | - |
| SiO2(11.1%)/TiO2_400 | 67 | 33 | - | 10 | 7 | - |
| SiO2(11.1%)/TiO2_600 | 83 | 17 | - | 25 | 21 | - |
| SiO2(11.1%)/TiO2_800 | 100 | - | - | 29 | - | - |
| Sample Code | SBET [m2/g] | Vtotal [cm3/g] | Vmicro [cm3/g] | Vmeso [cm3/g] | Eg [eV] |
|---|---|---|---|---|---|
| starting TiO2 | 193 | 0.109 | 0.079 | 0.030 | 3.05 |
| starting TiO2_400 | 54 | 0.101 | 0.020 | 0.081 | 2.98 |
| starting TiO2_600 | - | - | - | - | 2.92 |
| starting TiO2_800 | - | - | - | - | 2.92 |
| SiO2(11.1%)/TiO2 | 208 | 0.265 | 0.080 | 0.185 | 3.22 |
| SiO2(11.1%)/TiO2_400 | 121 | 0.259 | 0.043 | 0.216 | 3.23 |
| SiO2(11.1%)/TiO2_600 | 115 | 0.290 | 0.044 | 0.246 | 3.19 |
| SiO2(11.1%)/TiO2_800 | 81 | 0.270 | 0.031 | 0.239 | 3.08 |
| Sample Code | pH | δ [mV] |
|---|---|---|
| starting TiO2 | 3.1 | +38.9 |
| starting TiO2_400 | 4.1 | +39.0 |
| starting TiO2_600 | 5.4 | −13.2 |
| starting TiO2_800 | 5.6 | −25.8 |
| SiO2(11.1%)/TiO2 | 3.3 | +33.6 |
| SiO2(11.1%)/TiO2_400 | 4.4 | +19.7 |
| SiO2(11.1%)/TiO2_600 | 5.0 | −8.7 |
| SiO2(11.1%)/TiO2_800 | 5.4 | −29.5 |
| Sample Code | k0 (mg/(L·min)) | R2 | Sample Code | k1 (1/min) | R2 | Sample Code | k2 (L/(min·mg)) | R2 |
|---|---|---|---|---|---|---|---|---|
| starting TiO2_400 | 0.583 | 0.99 | SiO2(11.1%)/TiO2_400 | 0.294 | 0.98 | starting TiO2_800 | 0.002 | 0.95 |
| starting TiO2 | 0.003 | 0.99 | ||||||
| starting TiO2_600 | 0.009 | 0.99 | ||||||
| SiO2(11.1%)/TiO2 | 0.012 | 0.99 | ||||||
| SiO2(11.1%)/TiO2_800 | 0.078 | 0.98 | ||||||
| SiO2(11.1%)/TiO2_600 | 0.288 | 0.99 |
| Sample Code | k0 (mg/(L·min)) | R2 | Sample Code | k2 (L/(min·mg)) | R2 |
|---|---|---|---|---|---|
| SiO2(11.1%)/TiO2 | 0.064 | 0.95 | starting TiO2_800 | 0.001 | 0.99 |
| starting TiO2_600 | 0.069 | 0.99 | starting TiO2_400 | 0.001 | 0.98 |
| SiO2(11.1%)/TiO2_400 | 0.005 | 0.99 | |||
| SiO2(11.1%)/TiO2_800 | 0.009 | 0.98 | |||
| SiO2(11.1%)/TiO2_600 | 0.012 | 0.96 |
| Photocatalysts Preparation Method | Preparation Conditions | Precursor of TiO2 and Silica | Determination of Photoactivity | Radiation Source | Literature |
|---|---|---|---|---|---|
| sol-gel method | hydrolysis polycondensation of titanium n-butoxide and tetraethyl orthosilicate (TEOS), calcination at 400–950 °C/2 h | titanium n-butoxide (Ti(OBun)4), tetraethyl orthosilicate (TEOS) | decomposition of methyl orange | UV and solar irradiation | [24] |
| sol-gel method | hydrolysis, calcination at 400, 600, 800, 950 and 1000 °C/1 h | titanium tetrachloride (TiCl4), tetraethyl orthosilicate (TEOS) | photocatalytic degradation of Congo Red | UV lamp (254 nm, 18 W) | [25] |
| glycothermal method | silica-modified titanias were directly synthesized by the reaction of TIP and TEOS in 1.4-butanediol, calcination at 800, 1000, and 1200 °C/30 min | titanium tetraisopropoxide (TIP), tetraethyl orthosilicate (TEOS) | - | - | [23] |
| sol-gel method | hydrolysis, calcination at 400 °C/2 h and 500 °C/1 h | tetrabutyl titanate, tetraethyl orthosilicate (TEOS) | decomposition of phenol and 2,4,5-trichlorophenol | UV lamp (365 nm, 8 W) | [16] |
| sol-gel method | hydrolysis, calcination at 500 °C/1 h | tetrabutyl titanate, ethyl orthosilicate | decomposition of methylene blue | high-voltage halogen tungsten lamp | [26] |
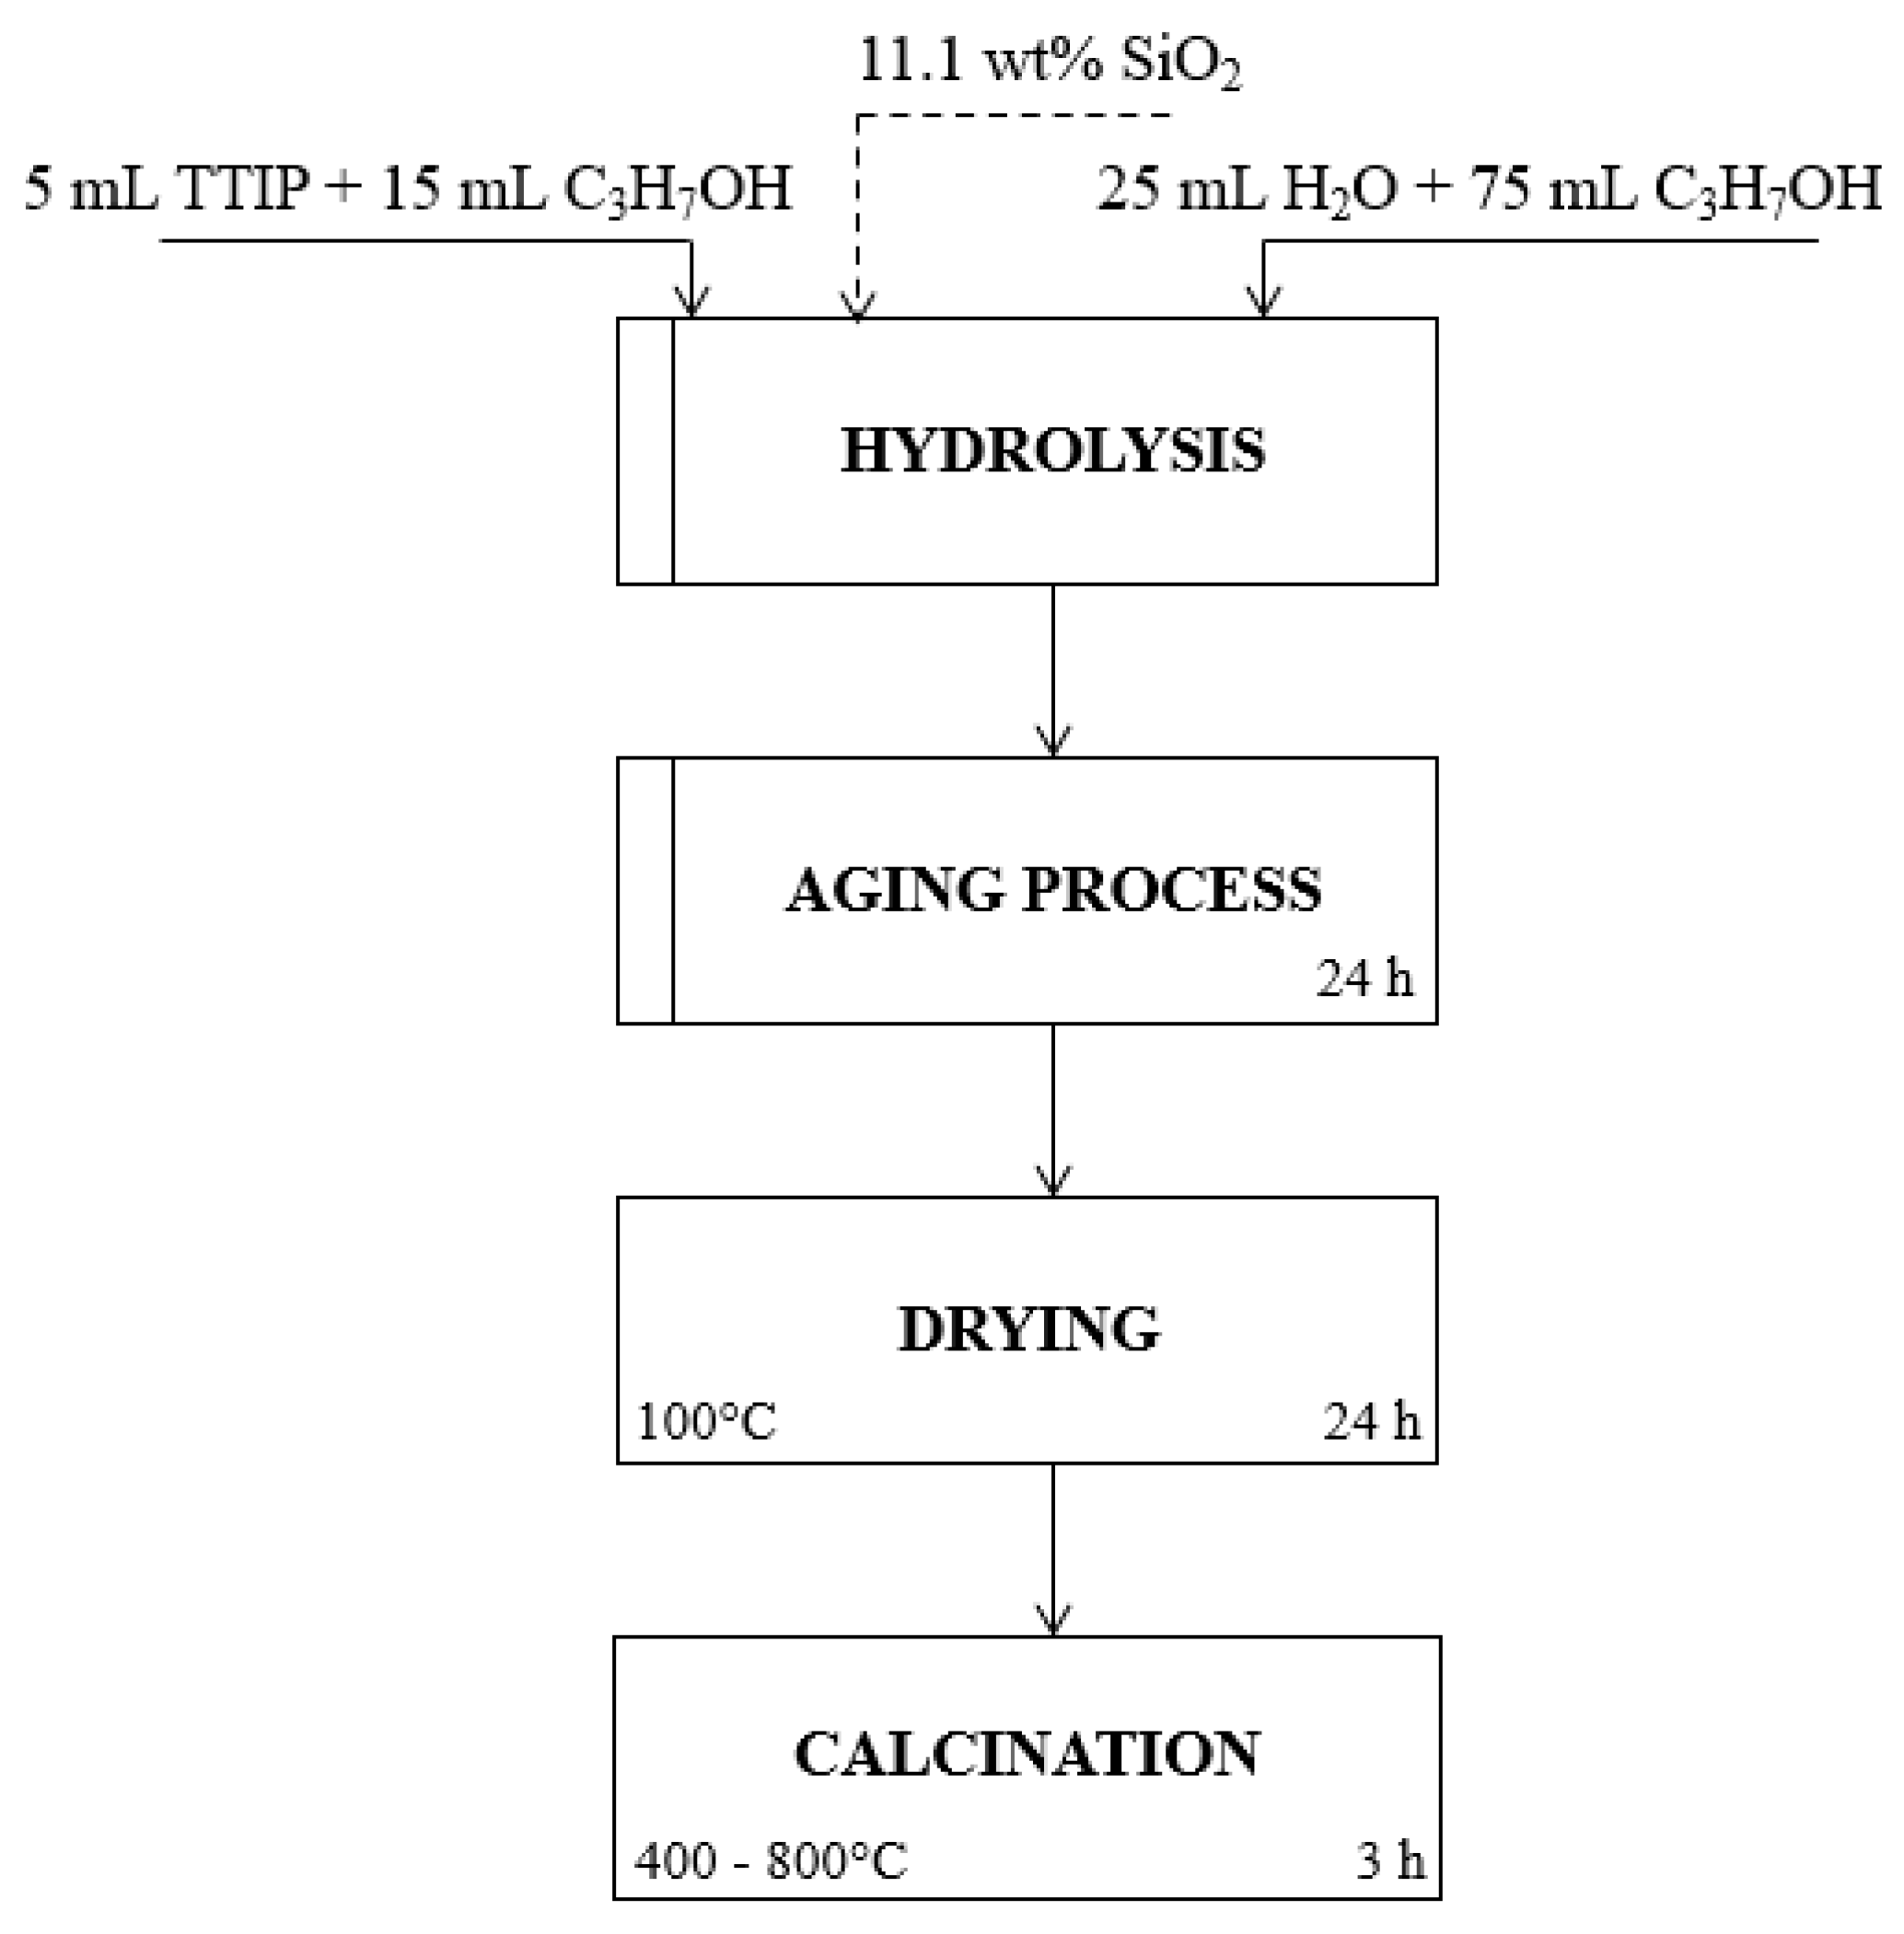
| sol-gel method | hydrolysis TTIP, sol drying at 100 °C/24 h, calcination at 400–800 °C/3 h | titanium(IV) isopropoxide (TTIP), fumed silica | decomposition of methylene blue | the intensity of UV radiation was 138 W/m2 (for 280–400 nm range) and that of VIS radiation was 167 W/m2 (for 300–2800 nm range) | our research |
Disclaimer/Publisher’s Note: The statements, opinions and data contained in all publications are solely those of the individual author(s) and contributor(s) and not of MDPI and/or the editor(s). MDPI and/or the editor(s) disclaim responsibility for any injury to people or property resulting from any ideas, methods, instructions or products referred to in the content. |
© 2023 by the authors. Licensee MDPI, Basel, Switzerland. This article is an open access article distributed under the terms and conditions of the Creative Commons Attribution (CC BY) license (https://creativecommons.org/licenses/by/4.0/).
Share and Cite
Babyszko, A.; Wanag, A.; Kusiak-Nejman, E.; Morawski, A.W. Effect of Calcination Temperature of SiO2/TiO2 Photocatalysts on UV-VIS and VIS Removal Efficiency of Color Contaminants. Catalysts 2023, 13, 186. https://doi.org/10.3390/catal13010186
Babyszko A, Wanag A, Kusiak-Nejman E, Morawski AW. Effect of Calcination Temperature of SiO2/TiO2 Photocatalysts on UV-VIS and VIS Removal Efficiency of Color Contaminants. Catalysts. 2023; 13(1):186. https://doi.org/10.3390/catal13010186
Chicago/Turabian StyleBabyszko, Aleksandra, Agnieszka Wanag, Ewelina Kusiak-Nejman, and Antoni Waldemar Morawski. 2023. "Effect of Calcination Temperature of SiO2/TiO2 Photocatalysts on UV-VIS and VIS Removal Efficiency of Color Contaminants" Catalysts 13, no. 1: 186. https://doi.org/10.3390/catal13010186