Article

Kinetic Modelling of Esterification and Transesterification Processes for Biodiesel Production Utilising Waste-Based Resource

by
M. A. Hazrat
1,*,
Mohammad G. Rasul
1,
Mohammad M. K. Khan
2,
Nanjappa Ashwath
3,
Arridina S. Silitonga
4,5,
I. M. R. Fattah
4,6,* and
T. M. Indra Mahlia
4
1
School of Engineering and Technology, CQUniversity Australia, Rockhampton 4701, Australia
2
Department of Mechanical Engineering, Auckland University of Technology, Auckland 1010, New Zealand
3
School of Health, Medical and Applied Sciences, CQUniversity Australia, Rockhampton 4701, Australia
4
Centre for Technology in Water and Wastewater (CTWW), School of Civil and Environmental Engineering, University of Technology Sydney, Ultimo 2007, Australia
5
Center of Renewable Energy, Department of Mechanical Engineering, Politeknik Negeri Medan, Medan 20155, Indonesia
6
Department of Mechanical Engineering, College of Engineering, Universiti Tenaga Nasional, Kajang 43000, Malaysia
*
Authors to whom correspondence should be addressed.
Catalysts 2022, 12(11), 1472; https://doi.org/10.3390/catal12111472
Submission received: 1 October 2022 / Revised: 8 November 2022 / Accepted: 9 November 2022 / Published: 18 November 2022

Abstract

:
Process optimisation and reaction kinetic model development were carried out for two-stage esterification-transesterification reactions of waste cooking oil (WCO) biodiesel. This study focused on these traditional processes due to their techno-economic feasibility, which is an important factor before deciding on a type of feedstock for industrialisation. Four-factor and two-level face-centred central composite design (CCD) models were used to optimise the process. The kinetic parameters for the esterification and transesterification processes were determined by considering both pseudo-homogeneous irreversible and pseudo-homogeneous first-order irreversible processes. For the esterification process, the optimal conditions were found to be an 8.12:1 methanol to oil molar ratio, 1.9 wt.% of WCO for H2SO4, and 60 °C reaction temperature for a period of 90 min. The optimal process conditions for the transesterification process were a 6.1:1 methanol to esterified oil molar ratio, 1.2 wt.% of esterified oil of KOH, reaction temperature of 60 °C, and a reaction time of 110 min in a batch reactor system; the optimal yield was 99.77%. The overall process conversion efficiency was found to be 97.44%. Further research into reaction kinetics will aid in determining the precise reaction process kinetic analysis in future.

1. Introduction

The creation of clean and green energy is an option that cannot be avoided in light of rapid industrialisation, increased consumption of fossil fuels, and environmental concerns [1,2,3]. Waste cooking oil (WCO) is regarded as one of the cheapest and non-food category feedstocks for biodiesel production, resulting in an environmentally benign method of reducing waste-related pollution. This waste is increasing as a result of rising human consumption and the industrialisation of food culture. In reality, leaving this waste product unused and inappropriately disposing of it could be a severe environmental (especially for the aquatic inhabitants and wildlife) threat [4,5]. Awogbemi et al. [6] reviewed a few relevant articles and concluded that WCO could be harmful due to the presence of various harmful chemicals such as 2,3-Dihydroxypropyl elaidate, 1-hexanol, palmitic acid, linoleic acid, i-propyl 14-methyl-pentadecanoate, 1-heptane, and cis-9-hexadecenal. The toxicity also affects aquatic wildlife organisms due to irresponsible practices. This feedstock is a category of inedible feedstocks with variable sources such as edible oils and fats. Regionally available WCO may vary in water and free fatty acid (FFA) contents. For this feedstock, two-stage (i.e., esterification and transesterification) [7] and single-stage (i.e., transesterification) production procedures have been noted [8]. The acid-catalysed esterification process [9] and the non-catalytical supercritical method [10] can efficiently remove the FFA-linked saponification reactions of WCO to biodiesel production processes [11,12]. Following the esterification process with acid catalysts, the triglycerides are transesterified to produce biodiesel with a high level of purity due to the elimination of FFAs. Based on the type of reactors and methodology utilised for biodiesel production from a feedstock, catalysts employed for both esterification and transesterification processes could be homogeneous or heterogeneous from acidic, alkali, enzymatic, and nano catalytic resources [13,14,15,16]. For example, Munir et al. [17] studied the heterogeneous catalysis of non-edible Capparis spinosa L. seed oil using a Cu–Ni-doped ZrO2 catalyst to produce biodiesel; they claimed that the generated biodiesel matched and was in close compliance with the European Union’s biodiesel standards (EN-14214). Ma et al. [18] utilised 30 wt.% of HPW-anchored UiO-66 metal–organic framework (HPW: 12-tungstophosphoric acid) as a catalyst for the heterogeneous esterification of acetic acid using n-butanol as a solvent, which resulted in an 80.2% conversion rate under the optimised reaction conditions.
Debates exist over the sorts of catalysts to be employed for technological and economic advantages in the mass production of biodiesel from feedstocks [19,20]. In this case, environmentally friendly and sustainable chemical ingredients [21] are encouraged, along with a biodiesel conversion rate of more than 98% [22]. Statistical optimisation and kinetic modelling of these processes can ensure the best use of these catalysts, thus minimising any corrosion and economic risks related to the processes at a commercial scale [23,24]. A recent review by Raheem et al. [25] mentioned that kinetic studies are generally performed on homogeneous catalyst systems. They have been widely implemented, with rare examples performed on heterogeneous catalyst systems. Moradi et al. [26] conducted an esterification of WCO (2 mgKOH/g oil) with 5 wt.% of H2SO4, and 18:1 methanol:oil at 65 °C and 5 h reaction time, yielding esterified oil with a 0.49 mgKOH/g acid value. The authors used CaO/MgCO3 catalysts derived from waste mussel shells as well as demineralised water (DM) treated precipitating catalysts to perform transesterification with methanol. The activation energies were 79.83 kJ/mol and 77.09 kJ/mol, and the reaction kinetics for the transesterification process were k = 2.81 × 10 11 e 9601.8 T and k = 1.08 × 10 11 e 92728 T , for the waste mussel shell and DM treated precipitating catalysts, respectively. Freedman et al. [27] mentioned that the range of activation energy of the transesterification reaction could vary between 33.6 and 84 kJ/mol based on several sets of kinetics studies of the soybean oil transesterification process. Sanjel et al. [10] conducted supercritical alcohol (both methanol (SCM)-based, and ethanol (SCE)-based) transesterification of waste vegetable oils (WVO); the apparent activation energy and order of the reactions were 64.9–180.8 kJ/mol, 22.42 and 61.0–116.2 kJ/mol, 31.61 for the SCM and SCE processes, respectively. The authors reported that the mathematical complexities could also be a factor in producing such high reaction orders of the respective processes. However, the SCM-based transesterification process was better than that of SCE due to higher solvent capacity during the reaction.
Gaurav et al. [28] conducted simultaneous esterification and transesterification with solidus acid catalyst (heteropolyacid supported with alumina (HSiW/Al2O3)) of a modelled yellow grease (canola oil mixed with (i) 10% palmitic, (ii) 10% oleic, and (iii) 10% linoleic acids) to determine the kinetics of biodiesel production. The authors considered a pseudo-homogeneous (first order) irreversible reaction type of kinetics (at 150 °C, 170 °C, and 190 °C) for both esterification and transesterification reactions. The activation energies found for the esterification process and transesterification process were (i) 32.9 kJ/mol and 59.0 kJ/mol, (ii) 34.1 kJ/mol and 50.8 kJ/mol, (iii) 34.0 kJ/mol and 55.6 kJ/mol, respectively. A high-speed homogeniser was used to conduct the transesterification reaction of WCO in a study by Hsiao et al. [29]. The authors found that CH3ONa is better than a NaOH catalyst when performing this particular process reaction. The optimal process parameters were obtained as a 9:1 M methanol to oil ratio, 0.75 wt.% of CH3ONa, 65 °C reaction temperature, 8000 rpm rotating speed/mixing speed, and reaction completion period of just 8 min. Mićić et al. [30] suggested that glycerols can be used to replace the acid-catalysed esterification reaction of high FFA-containing oils for biodiesel production. The optimal condition was 5.86:1 for the glycerol to oil ratio and a temperature of 222 °C, for which the %FFA is reduced from 8.6 to 1.6. Semi-industrial microreactors can also efficiently produce biodiesel from WCO within a short reaction time. Mohadesi et al. [31] demonstrated that using a homogeneous catalyst (KOH) could yield a conversion efficiency of about 98.26% within 120 s. The optimal reaction conditions were 62.4 °C, catalyst weight 1.126% (wt.%) of oil, and a methanol to oil molar ratio of 9.4:1.
This paper describes how to optimise biodiesel production parameters (such as reaction time, reaction temperature, methanol to oil ratio, and catalyst concentrations) in a standard batch reactor using acid esterification and alkali transesterification methods. The experiments were designed to obtain sufficient data to perform a statistical analysis as per the central composite design (CCD) algorithm. The WCO feedstock was collected from food processing industries and mixed to mimic Australian waste oil recycling centres. Despite the fact that modern methods of biodiesel process optimisation were cited in this article, this study focused on conventional process optimisation due to its techno-economic feasibility, which is an important factor before making industrialisation decisions for a feedstock. Biodiesel purification after transesterification also requires less effort due to optimal operating parameters. After the production drop in 2016, it became necessary to identify an optimal operating condition for Australian WCO with a much simpler process infrastructure for the revival of industrial biodiesel production in the country [32]. Furthermore, no detailed study of the operating parameter optimisation of both the esterification and transesterification processes with homogenous catalysts for Australian WCO can be used as a reference for techno-economic analyses and comparisons with heterogeneous catalysts and other methodologies. In addition to the reaction, kinetic models have been developed for both of the WCO biodiesel production processes, which indicate the characteristics of the reactions, activation energy requirement for efficient reactions to maximise their yield, and relation between reaction temperature and reaction time. As a complete technical pathway of biodiesel production from a feedstock has been presented by determining reaction kinetics, the pathway will help us to effectively conduct detailed techno-economic analyses for scaling up and commercialisation.

2. Results and Discussion

2.1. The Relative Effect of Parameters on the Quantity of Acid Removal from the Esterification Process

Both the 3D contour surface plots and 2D contour plots are presented for the percentile quantity of acidity removal (E, %) against the independent variables: methanol to oil molar ratio (M), amount of catalyst (A), reaction temperature (T), and reaction duration (D). It is an effective way to explain the interaction between two independent variables on the response yield (% of acidity removal) in the tallow esterification process. Figure 1, Figure 2, Figure 3, Figure 4 and Figure 5 show the interaction effect of six possible combinations of the interaction parameters on acidity removal. While demonstrating the effect of any two variables against the acidity removal quantity, the other variables were held constant at their respective optimal operation condition values.

2.1.1. Effects of Reaction Time (D) and Reaction Temperature (T)

Figure 1a,b are the 3D response surface plot and 2D response contour plot, respectively, for the acidity removal (E, %) due to the interaction effect between reaction time (D) and reaction temperature (T). The other two parameters, methanol to oil molar ratio (M) and acid catalyst content (A), were kept constant at 8.12:1 M and 1.9 wt.%, respectively. The figures show that the acidity removal content increases with the increase in temperature from 55 °C to 60 °C at a level of maximum removal content and then starts decreasing with the temperature increase towards 65 °C. Furthermore, the increase in reaction time almost gradually reduces the acidity removal content at these given conditions. 2D curves can explain this observation well, as it can be observed that the acidity removal contents remain constant with a small temperature variation for a whole range of time. The highest acidity removal can be observed with the temperature range of 58 °C and 61.5 °C for a duration ranging between 90 min and 112 min. The normal plot has indicated that the mutual effect of interaction between time and temperature (DT) is significantly high to produce a better process output for the WCO FFA removal process.

2.1.2. Effects of Methanol to Oil Ratio (M) and Catalyst Content (A)

Figure 2a shows that the acidity removal rate E (%) gradually increases with the increase in the methanol-to-oil molar ratio (M) in the reaction system. From the starting molar concentration ratio of M, the acidity removal rate (%E) increases up to around 8:1 of the methanol to oil molar ratio (M); beyond that, the %E reduces for any amount of catalysts used in the process. Similarly, for any amount of catalyst content, the %E increases up to an 8:1 molar ratio of M, and beyond that, %E reduces for any amount of catalysts. The normal plot also shows that both the M and A have a negative effect on the %E. On the other hand, Figure 2b shows the contours between M and A for the %E of the WCO. The figure shows that there is a constant %E yield for a set of M and A, which is shown as elliptical contours within the graph. The optimal output range could be visualised as these graphs plotted the holding reaction temperature (60 °C) and reaction duration (90 min) at a constant optimised value.

2.1.3. Effects of Methanol to Oil Ratio (M) and Reaction Temperature (T)

The 3D response plot for acidity removal (E, %) is shown in Figure 3a when the methanol to oil molar ratio (M) and reaction temperature (T) were varied while holding the other two parameters at their optimal values. The catalyst weight was held constant at 1.9 wt.%, and the reaction time was held at 90 min. Thus, the variation of M and T were inspected to observe their effect on %FFA removal (%E) in the system. When the reaction temperature starts increasing from 55 °C to 60 °C, the acidity removal content increases at any given methanol content. However, the %E starts reducing at a slower rate (for higher M values) when the temperature increases beyond 60 °C. Similarly, for any values of T, the increase in M up to 8.5 is observed to increase the FFA removal rate, but beyond that, the %E starts decreasing. The contour graph in Figure 3b shows that there is a constant circular shape contour for a constant value of %E, which implies that there could be two solutions of M for each T value or vice versa. With the increased efficiency of the FFA removal rate, the perimeter of the contour starts shrinking. A higher percentage of %E has a very low range of M and T to be varied.

2.1.4. Effects of Methanol to Oil Ratio (M) and Reaction Time (D)

Figure 4a shows the response surface of the acidity removal (E, %) against the methanol to oil molar ratio (M) and reaction time (D). The graphs are plotted considering the other two operating parameters being constant at their optimal level of contribution, i.e., 1.9 wt.% of acid catalyst and 60 °C for the reaction temperature. Here, the %E increases for any value of reaction duration up to the optimal value of M but starts reducing for any M and D after M reaches the optimal range. On the other hand, for any constant M, it has been observed that the FFA removal efficiency decreases with the increase in reaction duration. Thus, it was observed that both M and D have a mutually positive and negative synergistic effect on %E removal. The contour graph in Figure 4b shows that the %E relationship with M and D’s mutual effect varies like pyramids. Initially, a small variation of M could show a constant amount of FFA removal for a wider range of D. However, as the value of M approaches the optimal range for the other two holding parameters, i.e., catalyst content (1.9 wt.%) and reaction temperature (60 °C), the pyramid or triangular variation is clearly observed. It has been shown that the variation of both M and D was remarkably reduced as the %E approaches the maximum value. The optimal reaction duration (D) was found to be 90 min, for which the value of M could vary within a very narrow standard deviation of around 8:1 of M. With the considered RSM analysis, the optimal response has been obtained to have 8.12:1 as the methanol to oil molar ratio.

2.1.5. Interaction between Acid Catalyst (A) and Reaction Temperature (T)

The effect of the acid catalyst content and that of the reaction temperature in developing the response of acidity removal (%E) is shown in Figure 5a as a response surface. The mutual effect between A and T is shown in the contour graph in Figure 5b. While producing these relationships, the other two parameters, methanol to oil ratio (8.12:1 M) and reaction time (90 min), were kept constant at their optimal conditions. The response plot shows that at any given catalyst concentration, the variation of reaction temperature shows varying behaviour in the developing response of E. The contour plot shows that the maximum level of response of FFA removal (~98.83%) can be obtained at the centre of the graph between the varying values of A and T. The range of varying the catalyst concentration is shown as very narrow, even though the quadratic effect of both the reaction temperature and catalytic concentration content is on the positive side of the significant effect development as per the normal plot. The Pareto chart also indicates that the mutual effect of the catalyst concentration and the reaction temperature is significant, but at a very low rate. Both these parameters are on the opposite side of the standardised effect’s fit line compared with the normal plot.

2.1.6. Interaction between Acid Catalyst (A) and Reaction Time (D)

Figure 6a is a response surface plot of acidity removal (E, %) with the change in the acid catalyst content (A) and reaction time (D). The other two parameters, methanol to oil molar ratio (M) and temperature of reaction (T), were kept constant at 8.12 M and 60 °C, respectively. The mutual relation between A and D controls the change of %E varied between 95% and 100%. A catalyst content increase from 1.5 wt.% up to about 2 wt.% shows an increase in the percentage values for all reaction durations, but the %E reduces when the catalyst content increases beyond the optimal value of A. Every constant value of A shows a gradual decrease of %E with the increase of D up to 135 min and then starts increasing. The variation of increase and decrease of %E spanned within a narrow range of E. On the other hand, the contour graph in Figure 6b shows that the maximum of E was constant for a range of A between 1.70 wt.% and 2.20 wt.% and for a reaction duration between 90 and 100 min. It showed that for a constant catalyst content, the amount of E reduced with the increase in D. However, there could be multiple values of catalyst content for a constant D to achieve the same quantity of FFA removal content.

2.2. Kinetic Parameter Determination for the Esterification Process of WCO

The kinetic parameter determination was performed at the optimal design level obtained from the RSM analysis. In this section, the reaction kinetics for the esterification process was determined by considering it as a (i) pseudo-homogeneous irreversible process [33] and (ii) pseudo-homogeneous first-order irreversible process. Both systems are presented as follows.

2.2.1. Determination of Kinetic Parameters for a Pseudo-Homogeneous Irreversible Esterification Process

To determine the reaction kinetics, the optimal conditions for the methanol to oil molar ratio (M) and H2SO4 acid catalyst (A) were held constant at 8.12:1 M and 1.9 wt.%, respectively. In order to determine the kinetic parameters of the WCO esterification process, which is a pseudo-homogeneous irreversible esterification process [33], the following FFA conversion fraction data at various times (0 min, 60 min, 75 min, and 90 min) were obtained for 50 °C, 55 °C, and 60 °C, as presented in Figure 7.
In this process, the reaction order, rate equation of the esterification reaction, activation energy, and related kinetic model were obtained. The R-square values of the regression fits are also presented in Figure 7. The regression fit and experimental fit are of very good conformity. Indeed, the FFA removal rates are non-linear functions of time at a given temperature and other reaction conditions.
Here, the following rate equation can be written for a pseudo-homogeneous irreversible process [33]:
ln d X E d t = n ln C A 0 1 x E + ln k 2
where k2 = k’/CA0 = reaction rate constant.
Based on the regression equations found for FFA removal against time, the graph plot between ln[CA0(1 − XE)] and ln(dXE/dt) to determine the reaction order and the reaction rate constant is shown in Figure 3 following Equation (1).
The reaction rate constant and reaction order can be obtained as follows in Table 1.
The reaction orders and their corresponding rate constants for each of the considered reaction temperatures have been determined from the regression equations in Figure 8 and are tabulated in Table 1. Comparing Table 1 with the logarithmic form of the Arrhenius equation (Equation (3)) can be used to determine the values of 1/T and lnk’; this method was used to construct Figure 9.
From Figure 9, the linear regression between 1/T and lnk’ can be shown as follows:
y = 15666 x + 44.616
ln k = ln A f + E a R 1 T
Now, by comparing the equations (Equation (2)) with (Equation (3)), the following results can be obtained: frequency factor, Af = 2.38 × 10¹⁹ and activation energy, Ea = 130,247.1 J/mol or 130.2471 kJ/mol.
Thus, the reaction rate equation can be expressed as follows:
r A = d C A d t = C A 0 d x d t = A f · e E a R T C A 0 1 x n
= > r A = 2.38 × 10 19 e 130.2471 R T C A 1.151
Thus, Equation (4) is the kinetic model for the WCO esterification process when the esterification reaction is an irreversible pseudo-homogeneous reaction process.
As the reaction rate is determined from the graphical process, the fractional values of the reaction orders are plausible based on these differential processes. Research works from Zeng et al. [34], and Andreo-Martínez et al. [35] proposed conducting an integral method where the reaction order is considered as any of the orders (i.e., zero-order, first-order, second-order, or third-order) to fit the kinetic model.

2.2.2. Determination of Reaction Kinetics When the Esterification Process Is the Pseudo-Homogeneous First-Order Irreversible Reaction Process

Figure 7 was used to determine the kinetic model of the process considered as a pseudo-first-order homogeneous irreversible esterification reaction. The pseudo-first-order homogenous first-order irreversible reaction process kinetics [36] can be determined by the following equation:
r = d C A d t = k 1 C A
Here, due to the esterification reaction in the oil phase only, the concentration of FFA at any time in the oil phase is considered CA. Furthermore, k1 is the overall first-order reaction rate constant. Integrating Equation (5) within initial time and concentration, as well as any time and concentration representing at that time, the first-order reaction rate expression, can be obtained [36] as seen in Equation (6):
ln C A 0 C A = k 1 t
where CA0 is the initial concentration of FFA, and CA is the concentration of FFA at time t.
If x is the fraction of FFA removal, then CA = CA0(1 − x). Thus, the above Equation (7) can be expressed as follows:
ln 1 x = k 1 t
Hence, the reaction rate constant k1 can be obtained from the plot (Figure 10) between ln C A 0 C A and t or −ln(1 − x) vs. t. Once the various values of k1 are obtained at various temperatures, the values can be put in the logarithmic form of the Arrhenius equation to determine the values of activation energy and frequency factor for that particular reaction process.
Table 2 can be obtained by comparing the figure (Figure 10) with the −ln(1 − x) = k1t equation.
From Table 2, the relation between 1/T and lnk1 can be plotted as follows in Figure 11.
Comparing Figure 11 with the Arrhenius equation, the following results can be obtained: frequency factor, Af = 4.73 × 10⁷ and activation energy, Ea = 57,369.09 J/mol or 57.36909 kJ/mol.
Now, the reaction rate can be obtained as follows, based on Equations (5) and (7):
r = d C A d t = k 1 C A = A f e E a R T C A = 4.73 × 10 7 e 57.369 R T C A

2.3. The Relative Effect of Parameters on Yield from the Transesterification Process

Both the 2D contour and 3D response surface plots were produced to observe the effects of two independent variables on the yield of WCB (WCO biodiesel) obtained from the transesterification processes. When the effect of two variables was observed, the other two independent variables were kept constant at their optimal values within the process. Figure 12, Figure 13, Figure 14, Figure 15, Figure 16 and Figure 17 show the total of six combinations of two variables from the four available parameters: namely, methanol to esterified WCO molar ratio (M), amount of KOH catalyst (B), reaction temperature (T), and the reaction time (D).

2.3.1. Effects of Catalyst Content (B) and Methanol to Oil Ratio (M)

We observed the effect of variation of the methanol (M) and catalyst (B) content to %yield (Y) of fatty acid methyl ester (FAME). Figure 12 shows that the range of methanol content varied from 5 M to 7 M, whereas the catalyst content varied from 1.0 wt.% to 2.0 wt.% of esterified oil. For the other parameters, the reaction temperature was kept constant at 60 °C, and the reaction time was held constant at 110 min as obtained from the optimisation. Figure 12a shows that the fatty acid methyl ester yields very gradually increase from low to high with an increase in M up to 6.2, and again decrease from high to low values for both methanol contents. The catalyst change effect on yield efficiency varied within a very narrow range of Y. The normal plot shows that the catalyst content has a very small negative effect on yield content and that the methanol content has a positive effect. Therefore, both the methanol and KOH contents must be increased to improve their effect on achieving a higher yield of FAME (WCB). Figure 12b shows the contour lines and relevant regions where the contour value (yield) is valid for the set of (M, B). The inner contour (100%) shows that the methanol molar ratio can be varied from 6.2 M to 6.8 M and catalyst content varied from 1.05 wt.% to 1.7 wt.% to obtain the yield values.

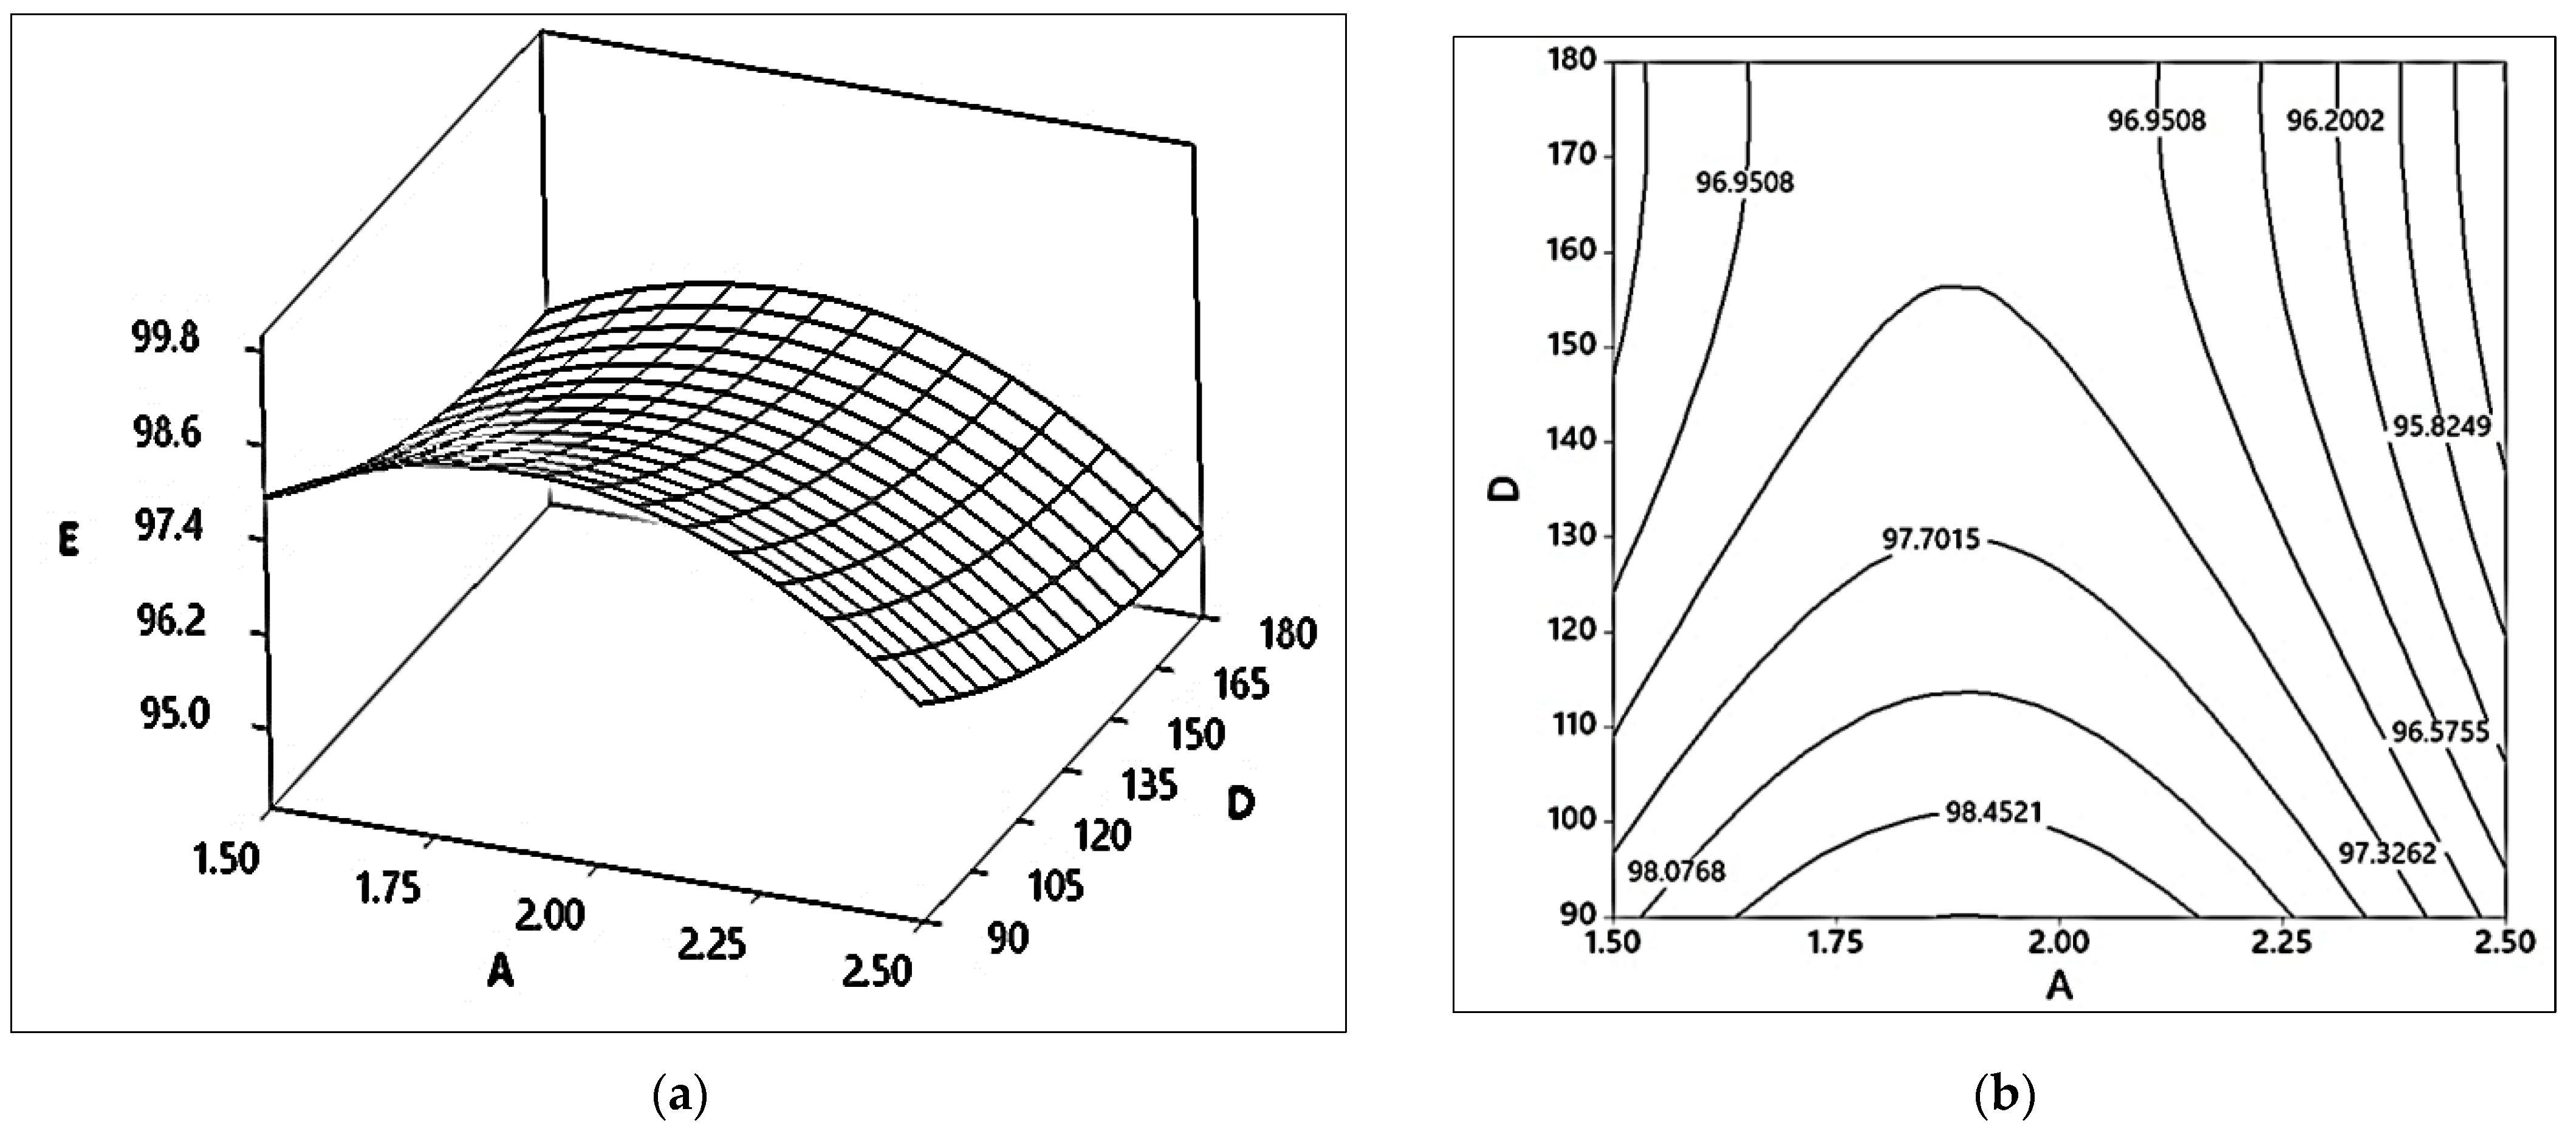
2.3.2. Effects of Catalyst Content (B) and Reaction Time (D)

Here, Figure 13a,b show the contour plot and surface plot for the interaction effect of the catalyst content and reaction time, respectively. The maximum output can be obtained within the range of 1.05 wt.% to 1.5 wt.% of catalyst, and the time requirement is more than 70 min. In this case, the other parameters, methanol content and reaction temperature, were kept constant at 6.2 M and 60 °C, respectively. The normal plot shows that the catalyst content (B) has a negative effect, while reaction duration has a positive effect on providing yield. However, the mutual interaction between B and D has a positive effect, and it is expected that increasing the catalyst quantity will increase the better synergistic effect of both parameters.

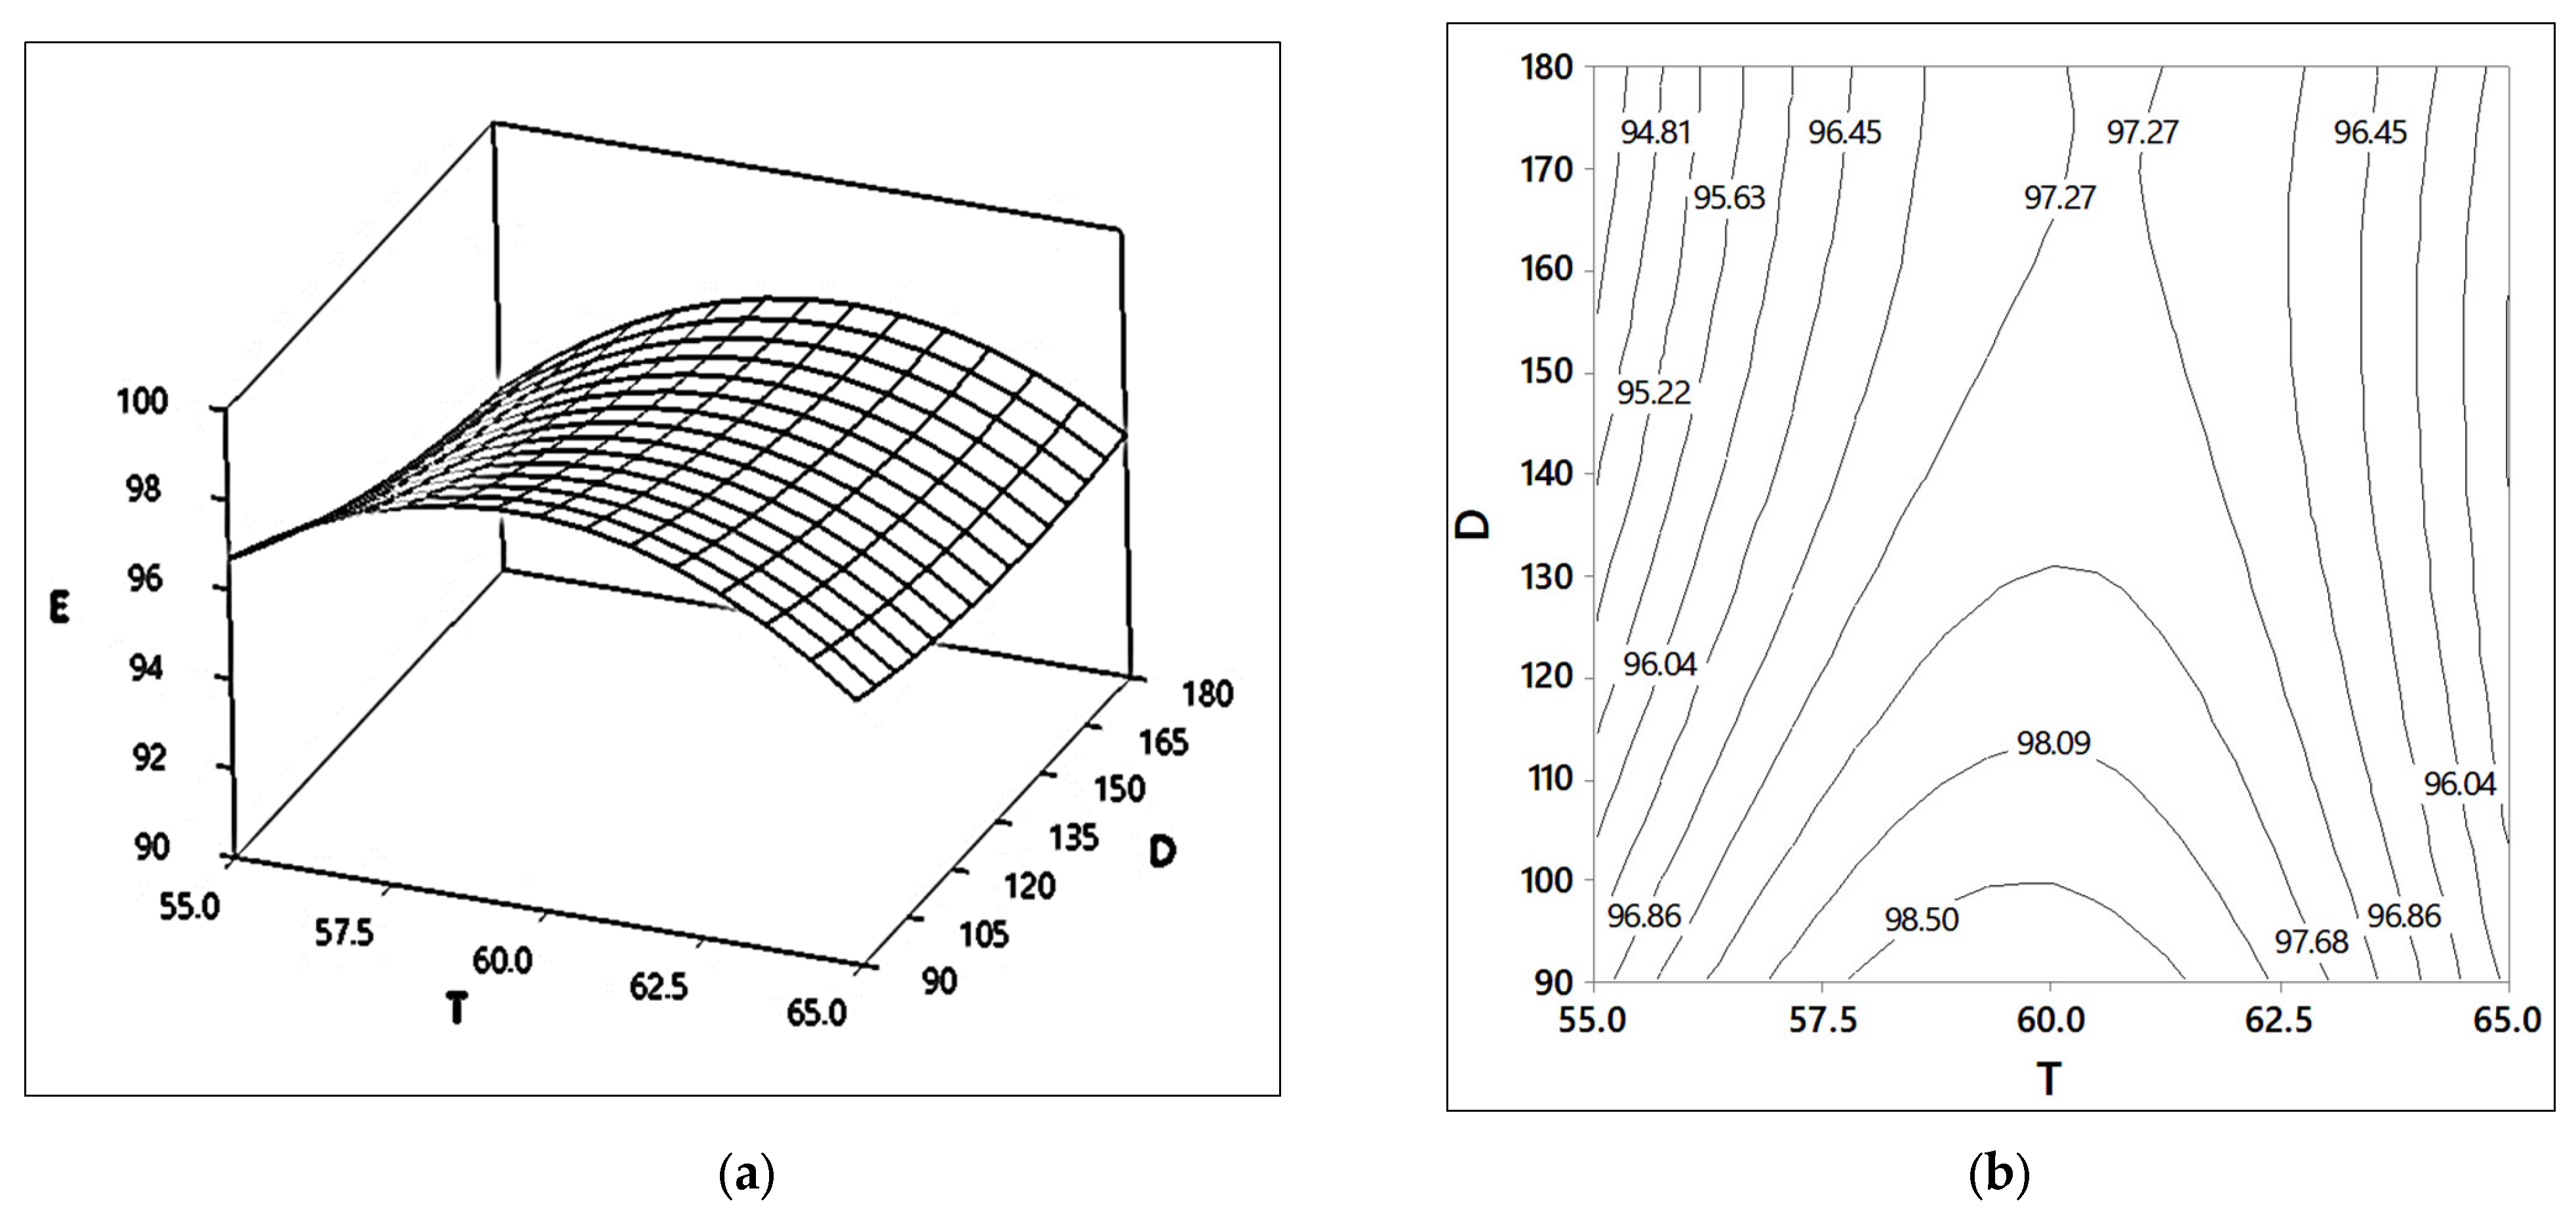
2.3.3. Effects of Reaction Temperature (T) and Reaction Time (D)

Figure 14a,b are the 2D contour and 3D surface plots for determining the effect of reaction temperature (T) and reaction time (D) on biodiesel yield (Y). Though both the T and D have a positive effect on the yield response, temperature is the most influential parameter with respect to yield efficiency. The 2D contour shows that for a constant output line of yield efficiency, the temperature can vary a negligible amount for a whole range of time, increasing from 60 to 120 min. Moreover, the increase in temperature increases the yield efficiency. The 3D surface graph shows that the increase in yield efficiency gradually increases for any reaction duration. Further, the increase of D at any constant T does not effectively vary the yield of biodiesel. As per the normal graph, the mutual effect of D and T has an overall positive effect.

2.3.4. Effect of Methanol to Esterified WCO Content (M) and Reaction Temperature (T)

As the yield efficiency increases for the response experiments, the range of variation of both the methanol content (M) and reaction temperature (T) becomes very narrow, as shown in Figure 15a,b. In both the 2D contour plot and 3D surface plots, the maximum output ranges within 6.01 M to 6.4 M methanol for the approximate temperature zone of 58 °C to 60 °C. The normal plot shows that both T and M are the two most significant positive factors in increasing the yield efficiency of the transesterification process. For a certain yield quantity, the temperature starts decreasing up to a curvature minimum point, and again increases to show the range of the methanol to oil molar ratio variation. While observing these two factors, the catalyst content was held at 1.2% (wt.%) and the reaction duration at 110 min. Thus, the area contour covered by the interaction line between M and T indicates the desired area for optimal biodiesel production.

2.3.5. Effects of Methanol to Esterified Tallow Content (M) and Reaction Time (D)

Figure 16a,b are the response effectiveness plot for the varying quantity of methanol to oil content (M) and reaction time period (D) to provide the response with respect to yield efficiency of the transesterification process. The regression model shows that the maximum FAME can be obtained for the methanol content ranging from 6.0 M to 6.6 M, and the reaction time should be more than 70 min. 2D contours demonstrate that, with increasing reaction duration by holding both the catalyst content and temperature at their optimal stage, there is a widening contour area of methanol to oil ratio to generate the same yield quantity. On the other hand, the 3D surface plot shows that the increase of M gradually increases the yield at a quadratic nature for any reaction duration. Also, the plot shows that the yield reaches a maximum at the apex of curvature for a certain value of M. Beyond the peak yield point of curvature further increase in M reduces the yield efficiency. The change of D showed little effect in this situation. M and D have a negative mutual effect on the yield, though individually, these two factors have outstanding contributions to the yield response.

2.3.6. Effects of Methanol to Reaction Temperature (T) and Catalyst Content (B)

Figure 17a,b show that the independent parameters T and B can be varied within the given regions of 50 °C to 60 °C and 1.0 wt.% to 2.0 wt.%, respectively. The maximum yield (FAME content) can be obtained at a higher temperature zone which is clearly beyond 58 °C. At such conditions, the maximum yield efficiency contour shows a range of catalyst content from 1.2% to 1.7% (wt.%). The 3D surface plot clarifies the relationship between the independent relation of one parameter while the other one is constant. For both of these observations, the other parameters M and D were kept constant at their optimal values. The normal plot shows that the increased catalyst will overcome its negative effect on yield as it is very near to the t-distribution line on the plot. The mutual effect of these two parameters is also positive. Thus, the variation of yield biodiesel on the 3D curve is well understood. Though the increase in catalyst content has been indicated by the normal plot, the 3D surface plot shows that there is a point where the yield efficiency starts decreasing with the increase in the catalyst. For any quantity of catalyst, the temperature increase shows a gradually increasing trend of yield efficiency. Therefore, the optimal quantification of catalyst content can be indicated to be between 1.5 and 1.8 for the lowest temperature, but the highest temperature of 60 °C shows that the catalyst optimisation could be a very nearest value of 1.2–1.5%.

2.4. Determination of Kinetic Model for Transesterification Process of WCO

In this study, only the single-step shunt process of transesterification reaction of the WCO triglycerides was considered, along with assumptions of homogeneous irreversible process kinetics [37]. The kinetic models were determined for pseudo-first-order and nth-order homogeneous irreversible processes following the described models in the cited articles. After the optimisation process, biodiesel’s maximum predicted yield could be obtained for the 6.1:1 M methanol to WCO oil molar ratio, 1.2% (wt.%) KOH catalyst with respect to the oil quantity, reaction temperature of 60 °C, and reaction duration of 110 min. The optimal yield was found to be 99.77% for these parameters. In order to obtain the reaction kinetics for these conditions, the following sets of biodiesel production were analysed as in Figure 18. While keeping both the methanol to oil molar ratio (M) and KOH quantity (B) at their optimal values, the temperatures were varied at 50 °C, 55 °C, and 60 °C. For each of these temperatures, the biodiesel production efficiencies were recorded at various times. The polynomial regression fit of all of these results is presented in Figure 18. The R-square values in the 3rd order polynomial regression fit show very good conformity with the achieved results.

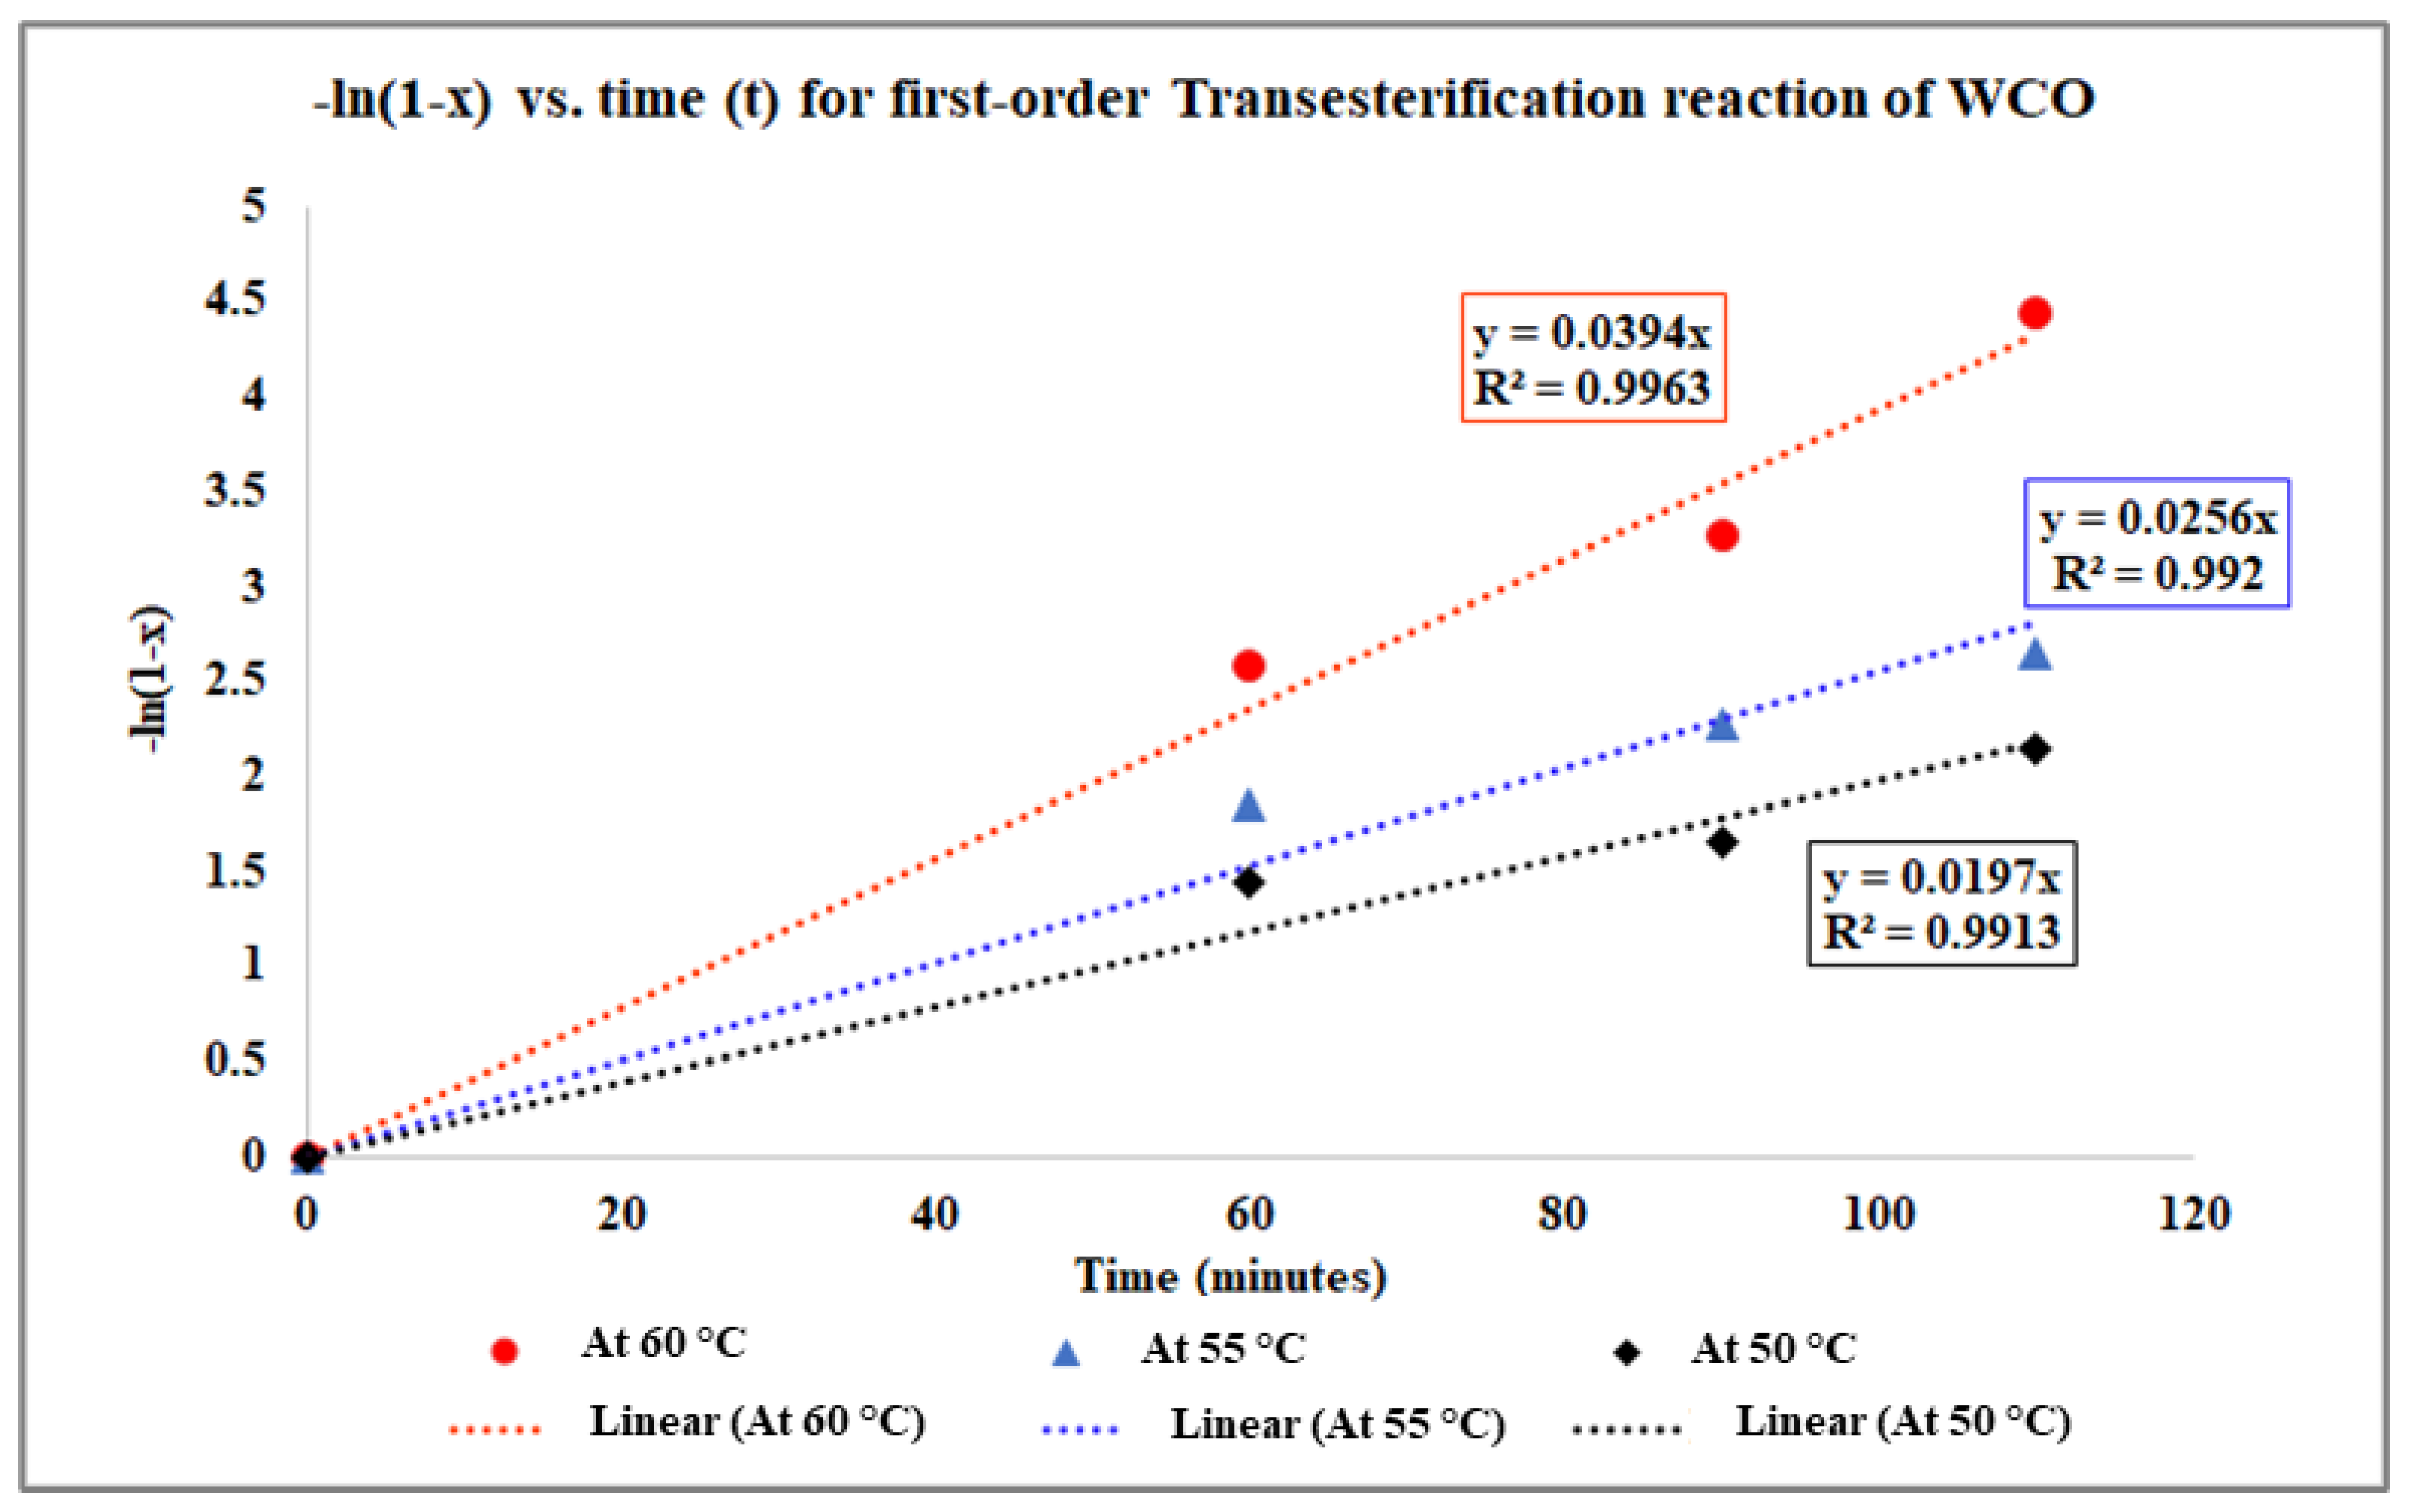
2.4.1. Transesterification Process Kinetics for Pseudo-First-Order Homogeneous Irreversible Reaction

When the transesterification process is considered as a pseudo-first-order homogeneous irreversible process reaction, the kinetic model can be derived as presented in the articles [35,36,38]. It is to be noted that these models can be used for any other methods of the transesterification process to produce biodiesel where the objective of the kinetic modelling is to observe the relationship between time and temperature to determine the activation energy and frequency factor of the reaction process [39]. If x is considered as a fractional conversion entity of methyl ester from WCO in the batch reactor, we obtain the following equation for reaction kinetics [37,38] (Equation (9)):
ln 1 x = ln T G T G 0 = k 1 t ,   or ln 1 x = k 1 t
Hence, for various values of T, the plot between −ln(1 − x) and time (t) can be plotted as in Figure 19. The R-square values indicating good regression fit in Figure 19.
Comparing the regression fits of Figure 19 with ln 1 x = k 1 t [37], the values of 1/T and lnk1 can be determined as presented in Table 3.
Data of 1/T and lnk1 from Table 3 can be plotted to obtain Figure 20 to determine the activation energy as the curve’s slope.
Comparing the regression equation with the logarithmic form of the Arrhenius equation, the following results can be obtained: frequency factor, Af = 1.9 × 10⁸ and activation energy, Ea = 61,902.718 J/mol or 61.90272 kJ/mol. Therefore, the overall reaction rate (kinetic model of the transesterification process) can be expressed as follows:
r = d C B d t = k 1 C B = A f e E a R T C B = 1.96 × 10 8 e 61.903 R T C B
The reaction kinetic model in Equation (10) has been developed, considering the process as a pseudo-first-order homogeneous irreversible reaction [37].

2.4.2. Transesterification Process Kinetic Modelling for WCO Biodiesel Production When the Reaction Is a Pseudo-Homogeneous Irreversible Process

However, if we consider the transesterification process to be a pseudo-homogenous irreversible process, then the following kinetic modelling can be performed.
Based on the regression fit in Figure 18, the following relationship (Figure 21) can be determined as followed by Banchero and Gozzelino [40]. The regression fits in Figure 21 shows a very good R-square fit. The slopes of these regression equations are the respective reaction orders of the process.
Thus, we compare the regressions in Figure 21 with the following equation (Equation (11)):
ln d x d t = ln k + n   ln C B 0 1 x  
And ,   k = k C B 0
The reaction rate constant and the reaction order can be obtained as follows in Table 4.
Figure 22 can be plotted for various values of 1/T and lnk from Table 4. The slope of the graph can be used to determine the activation energy of the process kinetics.
Comparing the equation derived from Figure 22 with the Arrhenius equation, the following results can be obtained: frequency factor, Af = 1.43 × 10¹¹ and activation energy, Ea = 79,133.48 J/mol or 79.13348 kJ/mol.
Thus, the kinetic equation of the WCO transesterification process for a pseudo-homogeneous irreversible process consideration can be estimated as follows:
r = k C B n = A f e E a R T C B n = 1.43 × 10 11 e 79.13348 R T C B 1.088133

2.5. WCO Fatty Acid Composition and Properties

The fatty acid composition of the produced biodiesel through the optimisation process had the highest amount of methyl oleate (C18:1) at 44.1 wt.%, which was followed by methyl linoleate (C18:2) and methyl palmitate (C16:0) at 23.5 wt.% and 16.5 wt.%, respectively. Other constituents included 4.8 wt.% of methyl myristate (C14:0), 1.9 wt.% of methyl palmitoleate (C16:1), 4.1 wt.% of methyl stearate (C18:0), 3.99 wt.% of methyl linolenate (C18:3), 0.69 wt.% of methyl behenate (C22:0) and 0.41 of wt.% methyl arachidate (C20:0). Based on the composition, the WCO biodiesel contained a total of 26.5 wt.% of saturated FAME component, 46.0 wt.% of monounsaturated FAME, and 27.49 wt.% of polyunsaturated FAME. Table 5 shows the physicochemical properties of the WCO biodiesel.

3. Discussion

Zuccaro et al. [41] mentioned the implementation of the “circular economy” idea, which necessitates a rising effort to recycle waste from all human activities. The waste should be converted into secondary raw materials with equal usefulness. Waste products should be reused or recycled after their life cycle [42]. This study is an effort to utilise the circular economy concept by using waste cooking oil to produce biodiesel as a sustainable energy source. Table 6 shows that most of the studies that discuss kinetic parameters also discuss the transesterification process, and the catalysts used were both homogeneous and heterogeneous. In general, activation energy (Ea) is the smallest amount of energy held by colliding molecules towards the formation of a product [43]. A steeper Arrhenius plot generally indicated greater activation energy of the transesterification process, while a flat slope suggested a low Ea. A higher Ea value indicates a slower reaction rate, which may be countered by adding a catalyst or raising the reaction temperature. In addition, by adding more solvent and using microwave or ultrasonication techniques to aid transesterification, this may be further decreased. Furthermore, higher Ea responses change more quickly across the same temperature range and are more sensitive to temperature fluctuations. However, low Ea and flat slope reactions show that the reaction rate is unaffected by temperature. Pugazhendhi et al. [44] reported that transesterification of WCO followed first-order kinetics with the reaction’s activation energy and frequency factor determined as 57.82 kJ/mol and 74 × 106 min−1, respectively. Even though Mercy Nisha Pauline et al. [43] reported a lower Ea than Pugazhendhi et al. [44], the authors used a higher catalyst percentage for the transesterification process. Al-Saadi et al. [45] studied a simultaneous esterification and transesterification process using SrO–ZnO/Al2O3 as the bifunctional catalyst and reported a 95.7% conversion to biodiesel in 5 h reaction time. In our study, sequential esterification and transesterification were carried out, which resulted in a similar Ea reported by other studies.

4. Materials and Method

4.1. Materials

In this study, WCO was collected from local restaurants to produce biodiesel. All purchased chemicals, such as methanol (CH3OH), sulfuric acid (H2SO4), and potassium hydroxide (KOH) were of analytical grade, and the catalysts were of 99.5% purity.

4.2. Method for Biodiesel Production from WCO

Before the esterification reaction, the collected WCO was heated at a temperature of 110 °C for 1 h to remove moisture. Then, the oil was cooled to filter with a grade 1 filter to remove all of the visible impurities and sediments due to heating. The acid values (AV) of the WCO, esterified oil, and biodiesel were measured following the titration method, i.e., the AOCS Official Method Cd 3d-63 (revised method in 2017 for the acid value determination of fats and oils) [48,49]. Once the AV was determined, the free fatty acid (FFA) contents were determined by following the relationship between the FFA and AV [50].
Then, the WCO was placed into the conventional batch reactor (volume: 300 mL) for the esterification reaction. Methanol was measured according to the experiment’s design amount and injected into the reaction together with the WCO. The experimental control system set both the temperature and vigorous mixing of the substances as the oil is not soluble in methanol. Mixing was assured with a magnetic stirring rod by maintaining a mixing speed of 600–650 rpm so that a well-developed vortex could be seen for the methanol–WCO mixture. Once the mixture temperature reached the set temperature, the designed amount of H2SO4 was mixed into the reactor. The reaction time was recorded, and intermittent samples (10–15 mL) were taken out from the reactor after various reaction time intervals. The samples were cooled off and later used for the determination of acid values (i.e., FFA content). When the reaction was finished, the liquid mixture was placed in a separating funnel to settle for 8–12 h. After settling down, the esterified oil was collected and dried again at 110 °C for 30 min to remove both the remainder of the methanol as well as moisture. No methanol recovery option was adopted in this study.
The dried esterified oil was placed in the reactor (volume: 300 mL) and heated to the necessary temperature for the transesterification reaction. While the oil was being heated, the KOH catalyst was dissolved into methanol in another beaker with the magnetic stirrer. For convenience, the methanol–KOH mixture was heated up to the level of the reaction temperature. After mixing the methanol–KOH solution with hot esterified oil, the reaction time was recorded, and the yield mixture was placed into a separating funnel to settle down. After 8–12 h of settling time, the glycerine and other impurities were removed from the bottom, and the top layer was washed with warm water a few times and subsequently dried again at 110 °C for 1 h. The dried biodiesel was centrifuged to remove any further impurities. Once the biodiesel was obtained, a sample amount was labelled to determine the characteristics of the fuel and conduct experimental work. The yield efficiency of biodiesel production is determined by measuring the biodiesel and WCO feedstock’s weight at the beginning of the esterification process [50].

4.3. Optimisation of Esterification Process of WCO

4.3.1. Design for Optimal Esterification Reaction Experiments

The acid value of the WCO was found to be 13.71 (6.89% FFA content). A number of distinct esterification reactions were performed to determine the optimal reaction condition for the conventional batch reactor type esterification process. The test conditions were: 6:1 M, 9:1 M, and 12:1 M methanol to oil ratio; 1.5%, 2%, and 2.5% (wt.%/wt. of oil) of H2SO4; and reaction times of 90 min, 135 min, and 180 min. The stirring speed of the reactor was maintained at 600 rpm with a magnetic stirrer.

4.3.2. Design for Esterification Process RSM Analysis

The four-factored and two-level face-centred (α = 1) central composite design (CCD) model considered in this RSM analysis, which was performed by Minitab 18.0 [51], is shown in Table 7. The model was designed with a single replicate that estimated 31 sampling experiments chosen from 3 available sampling designs for the CCD algorithm in the statistical software Minitab. Both the coded and un-coded values for all 31 samples are presented (Table 8). Moreover, the predicted values of acidity removed (%) are presented along with the experimentally (titration method) derived acidity removal in Table 8. The optimisation result can be considered sustainable with repeatability for the given operating conditions. The experimental results varied from 83.99% acidity removal to a maximum of 98.37% of acidity removal with the adopted experimental conditions. The predicted results show 84.09% minimum and 98.341% maximum acidity removals for the experimental lowest and highest acidity removal operation conditions.

4.3.3. Response Surface Regression

The FFA content of the system was determined at start time, 90 min, 135 min, and 180 min by collecting samples from the reactors at a given experimental setup. Then, the CCD model for the RSM analysis was performed as in Table 8, and the predicted yield values were fitted under the quadratic equation mentioned in Equation (14). In this analysis process, a single replica experimental system was formulated; that is why 31 experimental investigations were performed in total. Each of these test runs was performed with 50 mL of WCO collected after the time intervals. Based on the RSM analysis, the regression response for acidity removal due to the esterification process is presented in the following quadratic equation (Equation (14)). The equation shows that acidity removal is a dependent function of the four considered parameters (their individual as well as mutual interactions). Both the regression and experimental fits are compared and shown in Figure 23. Additionally, the experimental fit and predicted fit of acidity removal are shown in Figure 24 as per the experimental run order designed in Table 9. Both graphs show an excellent level of conformity between the experimental and predicted data.
Predicted acidity removed (%)
  E p = 97.282 1.89 M 1.2883 A + 0.1694 T 0.6189   D 3.5127 M 2     1.4177 A 2 2.5277 T 2 + 0.4373 D 2 2.2312 MA     0.0888 MT + 0.62 MD + 0.1863 AT 0.045 AD     + 0.54 TD

4.3.4. Response Optimisation

The statistical software Minitab 18.0 was used to determine the optimal response based on the RSM analysis. The optimal conditions for the removal of acidity (FFA content) are presented in Table 2 with a 95% confidence interval (95% CI). The values of the coded parameters obtained for the optimal conditions in Table 10 can be decoded as methanol to oil molar ratio of 8.12:1 M, H2SO4 content at 1.89 wt.% of the WCO, reaction temperature of 59.65 °C, and reaction time of 90 min. Based on the optimisation analysis, the maximum removal of FFA from the WCO could be achieved at about 98.8479%, with a standard error fit (SE fit) of just 0.062 and a very narrow range of 95% CI for these obtained operating conditions in a conventional batch reactor esterification process. The smaller values of the SE fits indicate the high-level precision of the analytically determined mean response based on the specified set of values and factors provided for the RSM analysis.

4.3.5. Analysis of Variance (ANOVA) for WCO Esterification Process

An analysis of variance (ANOVA) test has been performed along with the RSM analysis to determine the statistical significance of the variables. The results are presented in Table 11 and Table 12. The p-values obtained for the individual parameters are found to be less than the significance level (i.e., p < 0.05) except for in the two-way interaction between acid catalyst and the reaction time period (A*D, p = 0.066). The p-value (i.e., p < 0.05) implies that the parameters are statistically significant and reject the null hypothesis of the experimental investigations. The F-value of the overall ANOVA model is 4359.11, with the p-value equal to 0, which indicates a higher significance in the regression analysis process. Usually, the F-value for the model (or blocks, factor terms, etc.) searches whether any terms within the model have a dissociation with the responses. The p-value is also measured from the F-value analysis. The F-value in the lack-of-fit section is very low in comparison to the model F-value, which indicates that they did not fail to include any terms to analyse the experimental results. The reason for having the F-value in the lack-of-fit is due to a negligibly higher p-value for the A*D term. The reason for obtaining higher p-values for the A*D term could be due to an unusual fit at observation number 20, in which the experimental value is higher than the predicted fit with a standard error of 0.0271.
Table 10 also shows the standard deviation (S) of the analysis to be very low (i.e., 0.0912462), which indicates that the responses are very closely fitted, and the range of deviation is very low. However, the R-square value (99.97%) indicates that the model can fit almost all the data within the response measured. The adjusted R-square value (99.95%) is thus very close to the experimental R-square value, which indicates the high-level reliability of the fit with the regression equation for the system. Table 11 shows that the highest variance inflation factor (VIF) was 2.91 for the quadratic forms of the parameters (i.e., M*M, A*A, T*T, and D*D), but the other parametric VIFs were just 1.00. This factor explains how much multicollinearity (correlation between the predictors) can affect the regression fit by varying the variance of the regression coefficients. As a result, the overall response fails to recognise the distinct effect of correlated predictors. If VIF > 5, then the regression coefficients are very badly estimated due to the high multicollinearity effect [52]. In this analysis, the VIF values were much lower than 5, which indicates acceptable estimation was performed for the experimental data analysed.

4.3.6. Effects Plots for WCO Esterification Process

Both the Pareto chart (Figure 25) and normal chart (Figure 26) are representing the relative scales of effects the parameters contribute to the predicted results. Here, the Pareto chart indicates that the model includes the error terms for the response calculation. The reference line valued at 2.1 shows that the interaction between the catalyst and reaction time period BD (catalyst × time) is statistically insignificant in comparison to the other terms with a significant response to the system. The most significant terms have been found as the interactive effects of the methanol to oil molar ratio and quantity of the catalyst (AB), methanol to oil molar ratio (A), quadratic effect of A, and catalyst content B. The effectiveness rank can be shown with the coded parameters as AB > A > AA > B > CC > D > AD > BB > CD > BC >>C > DD > AC. Though the Pareto chart identifies the effective parameters for the response development within the system, the type of effectiveness can be determined from the normal plot of the standardised effects (Figure 25). It shows that the positive effect within the reaction system can be found as AD > CD > BC > C > DD, where AD (interactive effect of reaction time with methanol to oil molar ratio) is the highest. On the other hand, the negative effects were obtained from the normal curve as AC < BB < D < CC < B < AA < A < AB. Here, the blue-coloured BD term shows its insignificant effect, as it is very near to the response effect line. These curves show that both the reaction temperature and reaction duration are very influential in favouring the reaction for the positive yield production purpose.

4.4. Optimisation of the Transesterification Process of WCO

4.4.1. RSM Analysis and Optimisation of the Transesterification Process

The esterified WCO was processed under the transesterification process to produce WCO biodiesel (WCB). The acid value of the esterified oil was 0.24 (0.12% FFA). The reaction conditions for the transesterification process were: 5:1 M, 6:1 M, and 7:1 M methanol to oil ratio; 1%, 1.5%, and 2% wt.% of oil KOH; 55 °C, 60 °C, and 65 °C reaction temperature; and 60, 90, and 120 min of reaction time. The stirring speed of the reactor was maintained at 600 rpm with a magnetic stirrer. The RSM analysis was performed on Minitab 18.0 software for the transesterification process. The quadratic model equation was as in the case of the esterification process model. Once the RSM analysis was performed, the analysis of variance (ANOVA) table was investigated to check the significant contribution of the considered parameters in the predicted yield. Then, the model was analysed to determine the parametric conditions for an optimal yield of biodiesel from the transesterification process.

4.4.2. Design for Transesterification Process RSM Analysis

The experiments were designed as per the design summary provided in Table 12 to obtain sufficient data to perform the statistical analysis using the central composite design (CCD) algorithm. The factors were the methanol to oil molar ratio (M), amount (wt.%) of KOH catalyst (A), reaction temperature (T), and reaction time (D). The ranges of the respective factors considered for this process are presented in Table 6, with both coded and actual values. In this case, the CCD algorithm provided a design matrix of 30 runs. All 30 experiments were performed, and the predicted yields based on the RSM analysis are presented in Table 13.
The maximum predicted yield was obtained as 97.9167% against the maximum experimental yield of 98.92% WCO biodiesel (WCB) for the operating condition set of 6:1 M (M), 1.5 wt.% (A), 60 °C (T), and 90 min (D) in the transesterification process. The predicted yield was obtained as 98.82% for the same operating condition. On the other hand, the minimum predicted yield was found as 80.71% in comparison to that the minimum experimental yield of 80.57%. To observe the goodness of fit between the experimental yields and predicted yields, Figure 27 was created to plot the experimentally derived methyl ester yields (%) vs. the predicted yields (%) based on the RSM analysis, which shows a better linear regression fit (R-square value = 100).

4.4.3. Response Surface Regression

The regression analysis was conducted by a full quadratic model to predict the yield of the WCO-based fatty acid methyl esters (WCB). The full quadratic model equation (Equation (2)) can be expressed as follows, where the catalyst content (A) has a negative effect, along with the quadratic effects of the methanol content (M2), catalyst (A2), reaction temperature (T2), reaction time (D2), and mutual interaction effects of methanol-catalyst (MA), methanol-temperature (MT), methanol-reaction time (MD), and temperature-time (TD). A brief explanation of these effects is presented later with both the normal plot and the Pareto chart of the standardised effects. The un-coded regression fit of the transesterification process of esterified WCO to predict the yield of methyl esters is presented as follows:
Yield ,   Y p   % = 451.15 + 108.24 M + 53.41 B + 5.523 T 0.2514 D       9.0713 M 2 13.524 B 2 0.04984 T 2 + 0.000429 D 2       1.4812 MB + 0.13763 MT 0.00315 MD 0.111 BT       + 0.01707 BD + 0.003398 TD

4.4.4. Response Optimisation

The regression equation used to determine the optimal fit is the quadratic model equation presented in Equation (15). The limiting values of the factors and the regression fit for the optimisation are shown in Table 14. It shows that the optimal yield could be 99.77% with the reaction conditions of 6.1 M methanol, KOH 1.2% (wt.%) of oil, 60 °C reaction temperature, and 110 min of reaction time in a batch reactor system. The 95% confidence interval also lies between 99.60 and 99.94, which is a narrow range of standard distribution. The standard error of fits (SE fits) was found to be very small, i.e., 0.0789, which indicates a very high level of reliability of the response obtained as per the given factors and parameters to be analysed in the RSM analysis in the study of the transesterification process.

4.4.5. Analysis of Variance (ANOVA) for the Transesterification Process of WCO

The analysis of variance (ANOVA) test was performed (Table 15) for the multivariable dataset presented in Table 13, and the RSM analysis was performed to determine the statistical significance of the variables. The table shows that the p-values are mostly significant by being lesser than the significance level (i.e., p < 0.05). Table 15 also shows that the R-square value is 99.99%, the adjusted R-square value is 99.98%, and the predicted R-square value is 94.95%. The higher level of R-square value indicates that the model can deal with more than 99% of the experimentally derived data in this system to analyse the prediction. The predicted R-square value and a higher level of adjusted R-square value explain the efficiency of the fit between the experimental and predicted fit. Here in this model, the regression fit is well standardised, and the p-value of the model is zero, which means that the model can evaluate any predicted yield for any given set of reaction parameters within the given set of values.
Table 16 shows the values of the coefficients of the quadratic model developed by the RSM analysis as well as the coded parameters. The relevant p-values, T-values, 95% CI (confidence interval), the variance of inflation factors (VIFs), etc., are also presented in Table 16. Because the VIF values range between 1 and 2.57 in this model, which is less than 5 (i.e., VIF < 5), there is no multicollinearity effect, and the values reflect that the multicollinearity effect could not have any adverse effect on the parameters in building up the regression model coefficients.

4.5. Reaction Kinetic Models for Esterification and Transesterification Processes of WCO

Both the esterification and transesterification processes can be explained as a reversible heterogeneous process [53,54,55,56], pseudo-first-order pseudo-heterogeneous process [33,36,57], pseudo-homogeneous irreversible process [33,57], pseudo-homogeneous second-order irreversible reaction [9,58], or a pseudo-homogeneous first-order irreversible reaction [28,36,59,60,61,62]. In this study, only pseudo-homogeneous irreversible and first-order pseudo-homogeneous irreversible processes were investigated to determine the kinetic models of both the esterification and transesterification processes. The reason for comparing these two types of kinetic models was to observe whether the pseudo-homogeneous irreversible process assumptions really convert the overall reaction into a first-order or nth-order kinetic model. The effect of the optimal amount of catalyst and methanol has been inherently linked to the determination of the relationship between reaction time and reaction temperature, which were the key parameters for the kinetic modelling of the processes. The key assumptions of the pseudo-homogeneous reactions were as follows [28,33,36,57,59,60,61,62]:
  • Excessive methanol was used to dominate the reaction rates of both the esterification and transesterification processes to be driven towards the product side only (i.e., esterified WCO oil and WCO biodiesel, respectively). Thus, the reversibility was negligible for these reactions.
  • The higher molar ratio of methanol to triglycerides indicates that the change in methanol concentration due to the esterification reaction of the available FFA in the triglycerides and that of conversion of triglycerides into fatty acid methyl esters do not affect the rate of the reactions. Thus, it can be considered constant in a batch reactor.
  • Sufficiently effective and higher stirring was conducted to lessen the hydrodynamic effect and mass transfer resistance effect between methanol and FFA as well as between methanol and WCO triglycerides.
  • The overall reaction is considered to be a constant density and constant volume reaction system.
  • These models can also be used for non-catalytic processes, as the catalyst contents were not used during the determination of the kinetics.
The respective model equations for the assumed kinetic models are presented in Section 2.2 and Section 2.4 while determining the kinetic models for esterification and transesterification processes for WCO oil to WCO biodiesel production purposes. While determining the kinetic models, both the catalyst and methanol contents were kept constant as per the optimised results, but both the reaction time and reaction temperatures were varied. Polynomial fit regression lines have been presented for the conversion of both FFA and WCO biodiesel through the kinetic modelling in this study.

5. Conclusions

Process optimisation and reaction kinetic model development for two-stage esterification-transesterification reactions of waste cooking oil (WCO) biodiesel were performed in this study. The following conditions were found to be optimal for the esterification process: methanol to oil molar ratio 8.12:1, H2SO4 content 1.9 wt.% of the WCO, reaction temperature 60 °C, and reaction time of 90 min. The following conditions were found to be optimal for the transesterification process: methanol to esterified oil molar ratio 6.1:1, KOH catalyst content 1.2 wt.% of the esterified oil, reaction temperature 60 °C, and reaction time of 110 min in a batch reactor system. The reaction kinetics were determined after the optimised process parameters for each of the esterification and transesterification processes were developed. Two types of kinetics modelling were performed for both the esterification and transesterification processes. The overall process conversion efficiency was determined to be 97.44% based on the yield efficiency of the esterification and transesterification processes, which was obtained by multiplying the optimal conversion rates obtained from both processes (based on the maximum experimental yields). The fatty acid composition of produced biodiesel had the highest amount of methyl oleate at 44.1 wt.%, followed by methyl linoleate and methyl palmitate at 23.5 wt.% and 16.5 wt.%, respectively. This research included an overall experimental and analytical procedure to investigate biodiesel production from an inedible feedstock, WCO. Further research into this reaction kinetics will aid in determining the precise reaction process kinetic analysis in the near future.

Author Contributions

Conceptualisation, M.A.H.; data curation, M.A.H.; formal analysis, M.A.H.; investigation, M.A.H. and I.M.R.F.; methodology, M.A.H. and M.G.R.; project administration, M.G.R., M.M.K.K., N.A., A.S.S. and I.M.R.F.; resources, M.M.K.K., N.A. and T.M.I.M.; software, M.G.R.; supervision, M.G.R., M.M.K.K., N.A. and T.M.I.M.; validation, M.A.H.; visualization, M.A.H.; writing—original draft, M.A.H.; writing—review and editing, M.A.H., A.S.S., I.M.R.F. and T.M.I.M. All authors have read and agreed to the published version of the manuscript.

Funding

This work was supported by the research higher education division of the CQUniversity, Queensland, Australia.

Data Availability Statement

The data supporting this study’s findings are available from the corresponding author upon reasonable request.

Conflicts of Interest

The authors declare that they have no competing interests.

References

  1. Ampah, J.D.; Yusuf, A.A.; Agyekum, E.B.; Afrane, S.; Jin, C.; Liu, H.; Fattah, I.M.R.; Show, P.L.; Shouran, M.; Habil, M.; et al. Progress and Recent Trends in the Application of Nanoparticles as Low Carbon Fuel Additives—A State of the Art Review. Nanomaterials 2022, 12, 1515. [Google Scholar] [CrossRef] [PubMed]
  2. Ampah, J.D.; Jin, C.; Rizwanul Fattah, I.M.; Appiah-Otoo, I.; Afrane, S.; Geng, Z.; Yusuf, A.A.; Li, T.; Mahlia, T.M.I.; Liu, H. Investigating the evolutionary trends and key enablers of hydrogen production technologies: A patent-life cycle and econometric analysis. Int. J. Hydrog. Energy 2022. [Google Scholar] [CrossRef]
  3. Mohamed, B.A.; Fattah, I.M.R.; Yousaf, B.; Periyasamy, S. Effects of the COVID-19 pandemic on the environment, waste management, and energy sectors: A deeper look into the long-term impacts. Environ. Sci. Pollut. Res. 2022, 29, 46438–46457. [Google Scholar] [CrossRef] [PubMed]
  4. Su, G.; Ong, H.C.; Ibrahim, S.; Fattah, I.M.R.; Mofijur, M.; Chong, C.T. Valorisation of medical waste through pyrolysis for a cleaner environment: Progress and challenges. Environ. Pollut. 2021, 279, 116934. [Google Scholar] [CrossRef]
  5. Fattah, I.M.R.; Masjuki, H.H.; Kalam, M.A.; Hazrat, M.A.; Masum, B.M.; Imtenan, S.; Ashraful, A.M. Effect of antioxidants on oxidation stability of biodiesel derived from vegetable and animal based feedstocks. Renew. Sustain. Energy Rev. 2014, 30, 356–370. [Google Scholar] [CrossRef]
  6. Awogbemi, O.; Onuh, E.I.; Inambao, F.L. Comparative study of properties and fatty acid composition of some neat vegetable oils and waste cooking oils. Int. J. Low Carbon Technol. 2019, 14, 417–425. [Google Scholar] [CrossRef]
  7. He, C.; Mei, Y.; Zhang, Y.; Liu, L.; Li, P.; Zhang, Z.; Jing, Y.; Li, G.; Jiao, Y. Enhanced biodiesel production from diseased swine fat by ultrasound-assisted two-step catalyzed process. Bioresour. Technol. 2020, 304, 123017. [Google Scholar] [CrossRef]
  8. AbuKhadra, M.R.; Basyouny, M.G.; El-Sherbeeny, A.M.; El-Meligy, M.A.; Abd Elgawad, A.E.E. Transesterification of commercial waste cooking oil into biodiesel over innovative alkali trapped zeolite nanocomposite as green and environmental catalysts. Sustain. Chem. Pharm. 2020, 17, 100289. [Google Scholar] [CrossRef]
  9. Gao, Y.; Chen, Y.; Gu, J.; Xin, Z.; Sun, S. Butyl-biodiesel production from waste cooking oil: Kinetics, fuel properties and emission performance. Fuel 2019, 236, 1489–1495. [Google Scholar] [CrossRef]
  10. Sanjel, N.; Gu, H.J.; Oh, C.S. Transesterification Kinetics of Waste Vegetable Oil in Supercritical Alcohols. Energies 2014, 7, 2095–2106. [Google Scholar] [CrossRef]
  11. Fattah, I.M.R.; Ong, H.C.; Mahlia, T.M.I.; Mofijur, M.; Silitonga, A.S.; Rahman, S.M.A.; Ahmad, A. State of the Art of Catalysts for Biodiesel Production. Front. Energy Res. 2020, 8, 101. [Google Scholar] [CrossRef]
  12. Malvis, A.; Simon, P.; Dubaj, T.; Sladkova, A.; Haz, A.; Jablonsky, M.; Sekretar, S.; Schmidt, S.; Kreps, F.; Burcova, Z.; et al. Determination of the Thermal Oxidation Stability and the Kinetic Parameters of Commercial Extra Virgin Olive Oils from Different Varieties. J. Chem. 2019, 2019, 8. [Google Scholar] [CrossRef]
  13. Ruhul, A.M.; Kalam, M.A.; Masjuki, H.H.; Fattah, I.M.R.; Reham, S.S.; Rashed, M.M. State of the art of biodiesel production processes: A review of the heterogeneous catalyst. RSC Adv. 2015, 5, 101023–101044. [Google Scholar] [CrossRef]
  14. Liow, M.Y.; Gourich, W.; Chang, M.Y.; Loh, J.M.; Chan, E.-S.; Song, C.P. Towards rapid and sustainable synthesis of biodiesel: A review of effective parameters and scale-up potential of intensification technologies for enzymatic biodiesel production. J. Ind. Eng. Chem. 2022, 114, 1–18. [Google Scholar] [CrossRef]
  15. Munir, M.; Ahmad, M.; Mubashir, M.; Asif, S.; Waseem, A.; Mukhtar, A.; Saqib, S.; Siti Halimatul Munawaroh, H.; Lam, M.K.; Khoo, K.S.; et al. A practical approach for synthesis of biodiesel via non-edible seeds oils using trimetallic based montmorillonite nano-catalyst. Bioresour. Technol. 2021, 328, 124859. [Google Scholar] [CrossRef]
  16. Munir, M.; Ahmad, M.; Rehan, M.; Saeed, M.; Lam, S.S.; Nizami, A.S.; Waseem, A.; Sultana, S.; Zafar, M. Production of high quality biodiesel from novel non-edible Raphnus raphanistrum L. seed oil using copper modified montmorillonite clay catalyst. Environ. Res. 2021, 193, 110398. [Google Scholar] [CrossRef]
  17. Munir, M.; Ahmad, M.; Saeed, M.; Waseem, A.; Nizami, A.-S.; Sultana, S.; Zafar, M.; Rehan, M.; Srinivasan, G.R.; Ali, A.M.; et al. Biodiesel production from novel non-edible caper (Capparis spinosa L.) seeds oil employing Cu–Ni doped ZrO2 catalyst. Renew. Sustain. Energy Rev. 2021, 138, 110558. [Google Scholar] [CrossRef]
  18. Ma, T.; Liu, D.; Liu, Z.; Xu, J.; Dong, Y.; Chen, G.; Yun, Z. 12-Tungstophosphoric acid-encapsulated metal-organic framework UiO-66: A promising catalyst for the esterification of acetic acid with n-butanol. J. Taiwan Inst. Chem. Eng. 2022, 133, 104277. [Google Scholar] [CrossRef]
  19. Mohiddin, M.N.B.; Tan, Y.H.; Seow, Y.X.; Kansedo, J.; Mubarak, N.M.; Abdullah, M.O.; Chan, Y.S.; Khalid, M. Evaluation on feedstock, technologies, catalyst and reactor for sustainable biodiesel production: A review. J. Ind. Eng. Chem. 2021, 98, 60–81. [Google Scholar] [CrossRef]
  20. Imtenan, S.; Varman, M.; Masjuki, H.H.; Kalam, M.A.; Sajjad, H.; Arbab, M.I.; Fattah, I.M.R. Impact of low temperature combustion attaining strategies on diesel engine emissions for diesel and biodiesels: A review. Energy Convers. Manag. 2014, 80, 329–356. [Google Scholar] [CrossRef]
  21. Rezania, S.; Oryani, B.; Park, J.; Hashemi, B.; Yadav, K.K.; Kwon, E.E.; Hur, J.; Cho, J. Review on transesterification of non-edible sources for biodiesel production with a focus on economic aspects, fuel properties and by-product applications. Energy Convers. Manag. 2019, 201, 112155. [Google Scholar] [CrossRef]
  22. Musa, I.A. The effects of alcohol to oil molar ratios and the type of alcohol on biodiesel production using transesterification process. Egypt. J. Pet. 2016, 25, 21–31. [Google Scholar] [CrossRef] [Green Version]
  23. Shahir, S.A.; Masjuki, H.H.; Kalam, M.A.; Imran, A.; Rizwanul Fattah, I.M.; Sanjid, A. Feasibility of diesel–biodiesel–ethanol/bioethanol blend as existing CI engine fuel: An assessment of properties, material compatibility, safety and combustion. Renew. Sustain. Energy Rev. 2014, 32, 379–395. [Google Scholar] [CrossRef]
  24. Hazrat, M.A.; Rasul, M.G.; Khan, M.M.K.; Ashwath, N.; Fattah, I.M.R.; Ong, H.C.; Mahlia, T.M.I. Biodiesel production from transesterification of Australian Brassica napus L. oil: Optimisation and reaction kinetic model development. Environ. Dev. Sustain. 2022, 1–26. [Google Scholar] [CrossRef]
  25. Raheem, I.; Mohiddin, M.N.B.; Tan, Y.H.; Kansedo, J.; Mubarak, N.M.; Abdullah, M.O.; Ibrahim, M.L. A review on influence of reactor technologies and kinetic studies for biodiesel application. J. Ind. Eng. Chem. 2020, 91, 54–68. [Google Scholar] [CrossRef]
  26. Moradi, G.R.; Mohadesi, M.; Ghanbari, M.; Moradi, M.J.; Hosseini, S.; Davoodbeygi, Y. Kinetic comparison of two basic heterogenous catalysts obtained from sustainable resources for transesterification of waste cooking oil. Biofuel Res. J. 2015, 2, 236–241. [Google Scholar] [CrossRef]
  27. Freedman, B.; Butterfield, R.O.; Pryde, E.H. Transesterification kinetics of soybean oil. J. Am. Oil Chem. Soc. 1986, 63, 1375–1380. [Google Scholar] [CrossRef]
  28. Gaurav, A.; Dumas, S.; Mai, C.T.Q.; Ng, F.T.T. A kinetic model for a single step biodiesel production from a high free fatty acid (FFA) biodiesel feedstock over a solid heteropolyacid catalyst. Green Energy Environ. 2019, 4, 328–341. [Google Scholar] [CrossRef]
  29. Hsiao, M.-C.; Kuo, J.-Y.; Hsieh, P.-H.; Hou, S.-S. Improving Biodiesel Conversions from Blends of High- and Low-Acid-Value Waste Cooking Oils Using Sodium Methoxide as a Catalyst Based on a High Speed Homogenizer. Energies 2018, 11, 2298. [Google Scholar] [CrossRef] [Green Version]
  30. Mićić, R.; Tomić, M.; Martinović, F.; Kiss, F.; Simikić, M.; Aleksic, A. Reduction of free fatty acids in waste oil for biodiesel production by glycerolysis: Investigation and optimization of process parameters. Green Process. Synth. 2019, 8, 15–23. [Google Scholar] [CrossRef]
  31. Mohadesi, M.; Aghel, B.; Maleki, M.; Ansari, A. Production of biodiesel from waste cooking oil using a homogeneous catalyst: Study of semi-industrial pilot of microreactor. Renew. Energy 2019, 136, 677–682. [Google Scholar] [CrossRef]
  32. Biki, Z. Australia: Biofuels Annual; AS2020-0020; United States Department of Agriculture—Foreign Agriculture Service (USDA-FAS): Washington, DC, USA, 2020.
  33. Trinh, H.; Yusup, S.; Uemura, Y. Optimization and kinetic study of ultrasonic assisted esterification process from rubber seed oil. Bioresour. Technol. 2018, 247, 51–57. [Google Scholar] [CrossRef]
  34. Zeng, D.; Yang, L.; Fang, T. Process optimization, kinetic and thermodynamic studies on biodiesel production by supercritical methanol transesterification with CH3ONa catalyst. Fuel 2017, 203, 739–748. [Google Scholar] [CrossRef]
  35. Andreo-Martínez, P.; García-Martínez, N.; Durán-del-Amor, M.d.M.; Quesada-Medina, J. Advances on kinetics and thermodynamics of non-catalytic supercritical methanol transesterification of some vegetable oils to biodiesel. Energy Convers. Manag. 2018, 173, 187–196. [Google Scholar] [CrossRef]
  36. Zhou, L. Reaction Kinetics of Biodiesel Production by Using Low Quality Feedstock; University of Regina: Regina, SK, Canada, 2013. [Google Scholar]
  37. Permsuwan, A.; Tippayawong, N.; Kiatsiriroat, T.; Thararux, C.; Wangkarn, S. Reaction Kinetics of Transesterification Between Palm Oil and Methanol under Subcritical Conditions. Energy Sci. Technol. 2011, 2, 35–42. [Google Scholar] [CrossRef]
  38. Sivakumar, P.; Sindhanaiselvan, S.; Gandhi, N.N.; Devi, S.S.; Renganathan, S. Optimization and kinetic studies on biodiesel production from underutilized Ceiba Pentandra oil. Fuel 2013, 103, 693–698. [Google Scholar] [CrossRef]
  39. Kurhade, A.; Dalai, A.K. Kinetic modeling, mechanistic, and thermodynamic studies of HPW-MAS-9 catalysed transesterification reaction for biodiesel synthesis. Fuel Process. Technol. 2019, 196, 106164. [Google Scholar] [CrossRef]
  40. Banchero, M.; Gozzelino, G. A Simple Pseudo-Homogeneous Reversible Kinetic Model for the Esterification of Different Fatty Acids with Methanol in the Presence of Amberlyst-15. Energies 2018, 11, 1843. [Google Scholar] [CrossRef] [Green Version]
  41. Zuccaro, G.; Pirozzi, D.; Yousuf, A. Chapter 4—Lignocellulosic biomass to biodiesel. In Lignocellulosic Biomass Liquid Biofuels; Yousuf, A., Pirozzi, D., Sannino, F., Eds.; Academic Press: Cambridge, MA, USA, 2020; pp. 127–167. [Google Scholar] [CrossRef]
  42. Kusumo, F.; Mahlia, T.M.I.; Pradhan, S.; Ong, H.C.; Silitonga, A.S.; Fattah, I.M.R.; Nghiem, L.D.; Mofijur, M. A framework to assess indicators of the circular economy in biological systems. Environ. Technol. Innov. 2022, 28, 102945. [Google Scholar] [CrossRef]
  43. Mercy Nisha Pauline, J.; Sivaramakrishnan, R.; Pugazhendhi, A.; Anbarasan, T.; Achary, A. Transesterification kinetics of waste cooking oil and its diesel engine performance. Fuel 2021, 285, 119108. [Google Scholar] [CrossRef]
  44. Pugazhendhi, A.; Alagumalai, A.; Mathimani, T.; Atabani, A.E. Optimization, kinetic and thermodynamic studies on sustainable biodiesel production from waste cooking oil: An Indian perspective. Fuel 2020, 273, 117725. [Google Scholar] [CrossRef]
  45. Al-Saadi, A.; Mathan, B.; He, Y. Biodiesel production via simultaneous transesterification and esterification reactions over SrO–ZnO/Al2O3 as a bifunctional catalyst using high acidic waste cooking oil. Chem. Eng. Res. Des. 2020, 162, 238–248. [Google Scholar] [CrossRef]
  46. Putra, M.D.; Irawan, C.; Udiantoro; Ristianingsih, Y.; Nata, I.F. A cleaner process for biodiesel production from waste cooking oil using waste materials as a heterogeneous catalyst and its kinetic study. J. Clean. Prod. 2018, 195, 1249–1258. [Google Scholar] [CrossRef]
  47. Roy, T.; Sahani, S.; Chandra Sharma, Y. Study on kinetics-thermodynamics and environmental parameter of biodiesel production from waste cooking oil and castor oil using potassium modified ceria oxide catalyst. J. Clean. Prod. 2020, 247, 119166. [Google Scholar] [CrossRef]
  48. AOCS. AOCS Official Method Cd 3d-63: Acid Value of Fats and Oils; American Oil Chemists’ Society (AOCS): Urbana, IL, USA, 2017. [Google Scholar]
  49. Aricetti, J.A.; Tubino, M. A Visual Titration Method for the Determination of the Acid Number of Oils and Fats: A Green Alternative. J. Am. Oil Chem. Soc. 2012, 89, 2113–2115. [Google Scholar] [CrossRef]
  50. Gumahin, A.C.; Galamiton, J.M.; Allerite, M.J.; Valmorida, R.S.; Laranang, J.-R.L.; Mabayo, V.I.F.; Arazo, R.O.; Ido, A.L. Response surface optimization of biodiesel yield from pre-treated waste oil of rendered pork from a food processing industry. Bioresour. Bioprocess. 2019, 6, 48. [Google Scholar] [CrossRef] [Green Version]
  51. Minitab. What Are Response Surface Designs, Central Composite Designs, and Box-Behnken Designs? Available online: https://support.minitab.com/en-us/minitab/18/help-and-how-to/modeling-statistics/doe/supporting-topics/response-surface-designs/response-surface-central-composite-and-box-behnken-designs/ (accessed on 1 February 2020).
  52. Minitab. Interpret All Statistics and Graphs for Simple Regression. Available online: https://support.minitab.com/en-us/minitab-express/1/help-and-how-to/modeling-statistics/regression/how-to/simple-regression/interpret-the-results/all-statistics-and-graphs/#vif (accessed on 8 March 2020).
  53. Berrios, M.; Siles, J.; Martin, M.; Martin, A. A kinetic study of the esterification of free fatty acids (FFA) in sunflower oil. Fuel 2007, 86, 2383–2388. [Google Scholar] [CrossRef]
  54. Prasanna Rani, K.N.; Ramana Neeharika, T.S.V.; Kumar, T.P.; Satyavathi, B.; Sailu, C. Kinetics of Non-Catalytic Esterification of Free Fatty Acids Present in Jatropha Oil. J. Oleo Sci. 2016, 65, 441–445. [Google Scholar] [CrossRef] [Green Version]
  55. Su, C.-H. Kinetic study of free fatty acid esterification reaction catalyzed by recoverable and reusable hydrochloric acid. Bioresour. Technol. 2013, 130, 522–528. [Google Scholar] [CrossRef]
  56. Krishnamurthy, K.N.; Sridhara, S.N.; Ananda Kumar, C.S. Optimization and kinetic study of biodiesel production from Hydnocarpus wightiana oil and dairy waste scum using snail shell CaO nano catalyst. Renew. Energy 2020, 146, 280–296. [Google Scholar] [CrossRef]
  57. Cheng, J.; Li, Y.; He, S.; Shen, W.; Liu, Y.; Song, Y. Reaction Kinetics of Transesterification between Vegetable Oil and Methanol under Supercritical Conditions. Energy Sources Part A Recovery Util. Environ. Eff. 2008, 30, 681–688. [Google Scholar] [CrossRef]
  58. Lieu, T.; Yusup, S.; Moniruzzaman, M. Kinetic study on microwave-assisted esterification of free fatty acids derived from Ceiba pentandra Seed Oil. Bioresour. Technol. 2016, 211, 248–256. [Google Scholar] [CrossRef]
  59. Ataya, F.; Dubé, M.; Ternan, M. Acid-Catalyzed Transesterification of Canola Oil to Biodiesel under Single- and Two-Phase Reaction Conditions. Energy Fuels 2007, 21, 2450–2459. [Google Scholar] [CrossRef]
  60. Sendzikiene, E.; Makareviciene, V.; Janulis, P.; Kitrys, S. Kinetics of free fatty acids esterification with methanol in the production of biodiesel fuel. Eur. J. Lipid Sci. Technol. 2004, 106, 831–836. [Google Scholar] [CrossRef]
  61. Kocsisová, T.; Cvengroš, J.; Lutišan, J. High-temperature esterification of fatty acids with methanol at ambient pressure. Eur. J. Lipid Sci. Technol. 2005, 107, 87–92. [Google Scholar] [CrossRef]
  62. Cardoso, A.L.; Neves, S.C.G.; Da Silva, M.J. Esterification of Oleic Acid for Biodiesel Production Catalyzed by SnCl2: A Kinetic Investigation. Energies 2008, 1, 79–92. [Google Scholar] [CrossRef]
Figure 1. Interaction effect of temperature and time on the acidity removal of the WCO esterification process. (a) A 3D response surface plot of E (%) vs. T (°C) and D (minutes). (b) A 2D contour plot between D (minutes) and T (°C).
Catalysts 12 01472 g001
Figure 2. Interaction effect of the methanol to oil molar ratio and acid catalyst content on the acidity removal of the WCO esterification process. (a) A 3D response surface plot of E (%) vs. M (M) and A (wt.%). (b) A 2D contour plot between M (M) and A (wt.%).
Catalysts 12 01472 g002
Figure 3. Interaction effect of the methanol to oil molar ratio and reaction temperature on the acidity removal of the WCO esterification process. (a) A3D response surface plot of E (%) vs. M (M) and T (°C). (b) A 2D contour plot between M (M) and T (°C).
Catalysts 12 01472 g003
Figure 4. Interaction effect of the methanol to oil molar ratio and reaction temperature on the acidity removal of the WCO esterification process. (a) A 3D response surface plot of E (%) vs. M (M) and D (minutes). (b) A 2D contour plot between M (M) and D (minutes).
Catalysts 12 01472 g004
Figure 5. Interaction effect of the methanol to oil molar ratio and reaction temperature on the acidity removal of the WCO esterification process. (a) A 3D response surface plot of E (%) vs. A (wt.%) and T (°C). (b) A 2D contour plot between A (wt.%) and T (°C).
Catalysts 12 01472 g005
Figure 6. Interaction effect of the methanol to oil molar ratio and reaction temperature on the acidity removal of the WCO esterification process. (a) A 3D response surface plot of E (%) vs. A (wt.%) and D (minutes). (b) A 2D contour plot between A (wt.%) and D (minutes).
Catalysts 12 01472 g006
Figure 7. WCO oil FFA conversion vs. time at various temperatures.
Catalysts 12 01472 g007
Figure 8. Determination of the reaction order and rate constants.
Catalysts 12 01472 g008
Figure 9. Determination of the activation energy of the esterification reaction process.
Catalysts 12 01472 g009
Figure 10. Determination of the reaction constants for the esterification reaction kinetics of WCO.
Catalysts 12 01472 g010
Figure 11. Plotting reaction kinetics in the Arrhenius equation for WCO esterification.
Catalysts 12 01472 g011
Figure 12. Interaction effect of the methanol to oil molar ratio (M) and KOH catalyst content (B) on the FAME yield (Y) of the transesterification process of WCO. (a) A 3D response surface plot of Y (%) vs. M (M) and B (wt.%). (b) A 2D contour plot between M (M) and B (wt.%).
Catalysts 12 01472 g012
Figure 13. Interaction effect of the NaOH catalyst content (A) and reaction time period (D) on the FAME yield (Y) of the transesterification process. (a) A 3D response surface plot of Y (%) vs. B (wt.%) and D (minutes). (b) A 2D contour plot between A and D.
Catalysts 12 01472 g013
Figure 14. Interaction effect of the reaction temperature (T) and reaction time (D) on the FAME yield (Y) of the transesterification process. (a) A 3D response surface plot of Y (%) vs. T (°C) and D (minutes). (b) 2A D contour plot between T (°C) and D (minutes).
Catalysts 12 01472 g014
Figure 15. Interaction effect of the reaction temperature (T) and methanol to oil molar ratio (M) on the FAME yield (Y) of the transesterification process. (a) A 3D response surface plot of Y (%) vs. T (°C) and M (M). (b) A 2D contour plot between T (°C) and M (M).
Catalysts 12 01472 g015
Figure 16. Interaction effect of the reaction time (D) and methanol to oil molar ratio (M) on the FAME yield (Y) of the transesterification process. (a) A 3D response surface plot of Y (%) vs. D (minutes) and M (M). (b) A 2D contour plot between D (minutes) and M (M).
Catalysts 12 01472 g016
Figure 17. Interaction effect of the reaction temperature (T) and catalyst content (B) on the FAME yield (Y) of the transesterification process. (a) A 3D response surface plot of Y (%) vs. T (°C) and B (wt.%). (b) A 2D contour plot between T (°C) and B (wt.%).
Catalysts 12 01472 g017
Figure 18. WCO biodiesel (WCB) conversion at various times for the given temperatures.
Catalysts 12 01472 g018
Figure 19. Determination of the reaction rate constant for the transesterification process of WCO.
Catalysts 12 01472 g019
Figure 20. 1/T vs. lnk1 plot to determine the activation energy (Ea) and frequency factor (Af) for the Transesterification process.
Catalysts 12 01472 g020
Figure 21. ln (dx/dt) vs. lnCB0(1 − x) graph plot for the reaction kinetics of the WCO transesterification.
Catalysts 12 01472 g021
Figure 22. 1/T vs. lnk graph for the activation energy determination of the WCO transesterification process.
Catalysts 12 01472 g022
Figure 23. A regression fit between the experimental data and predicted data for acidity removal.
Catalysts 12 01472 g023
Figure 24. Acidity removed (experimental and predicted) as per the experimental run order.
Catalysts 12 01472 g024
Figure 25. Pareto chart showing the relative significance level of each of the parameters of the esterification of WCO.
Catalysts 12 01472 g025
Figure 26. Normalised plot determining the standardised effect of the parameters on the esterification of WCO.
Catalysts 12 01472 g026
Figure 27. Comparison between the experimentally derived yield and that of the predicted values for the transesterification process of WCO as per the design matrix obtained from the CCD model.
Catalysts 12 01472 g027
Table 1. 1/T vs. lnk for the WCO esterification process kinetic measurement.
T (°C)T (K)n (Order)lnkkk = k’*CA01/TlnkAverage Reaction Order, n
603331.1768−2.29230.10103380.1010340.003003−2.29231.151
553281.1612−3.41440.03289610.0328960.003049−3.4144
503231.115−3.75290.02344960.023450.003096−3.7529
Table 2. 1/T vs. lnk1 relation for WCO esterification.
T (°C)T (k)Rate Const. k1 (1/mol·min)R-sq Value1/Tlnk1
603330.04690.99820.003003−3.059737604
553280.03530.99290.003049−3.343872315
503230.02470.98280.003096−3.700952035
Table 3. Determination of 1/T and lnk1 for the WCO transesterification kinetics.
T (°C)T (k)Rate Const. k1 (1/mol·min)R-sq Value1/Tlnk1
603330.03940.9870.003003−3.233989463
553280.02560.96980.003049−3.665162927
503230.01970.9680.003096−3.927136643
Table 4. 1/T vs. lnk graph for the WCO transesterification process kinetics.
T (°C)T (K)n (Order)lnkkk = k’*CB01/TlnkAverage Reaction Order, n
603331.0095−2.83480.058730.058730.003003−2.83481.088133
553281.0962−3.44660.0318540.0318540.003049−3.4466
503231.1587−3.72150.0241980.0241980.003096−3.7215
Table 5. Physicochemical properties of the WCO biodiesel.
Physicochemical PropertiesWCO BiodieselTest StandardsASTM D6751/EN 14214 Limits
Kinematic viscosity (mm2/s, at 40 °C)5.31ASTM D4451.9–6.0 (ASTM)
Density (kg/m3, at 15 °C)889EN ISO 3675860–900 (EN)
Higher heating value (MJ/kg, HHV)40.16ASTM D4868-
Lower heating value (MJ/kg, LHV)39.51ASTM D4868-
Oxidation stability (hours, at 110 °C)8.88EN 14112>8 h (EN)
Flash point (°C)172.1ASTM D93100–170 (ASTM)
Pour point (°C)−3.2ASTM D97-
Cloud point (°C)3.5ASTM D2500Location and season dependent
Cold filter plugging point (CFPP, °C)−1.3EN 116Location and season dependent
Cetane number (CN)57.98ASTM D613>47 (ASTM)
Iodine value (IV, g I2/100 g oil)91.11EN 14111<120 (EN)
Saponification value
(SV, mg KOH/g oil)
204.12ASTM D5558-
Acid value (AV, mg KOH/g oil)0.24EN 14104<0.50 (ASTM/EN)
Table 6. Optimal reaction parameters and kinetics of the transesterification process of oil.
FeedstockMethanol: Oil Molar RatioCatalystBiodiesel Yield (%)Temp. (°C)Time
(min)
Kinetic ParametersRef.
Waste cooking oil
(bubble washing before transesterification)
10.6:10.6%
(w/w)
90 ± 0.256363First-order kinetics
Ea = 57.82 kJ/mol
A = 74 × 106 min−1
[44]
Waste cooking oil
(Transesterification)
6:1 NaOH
1% (w/v)
9060120Irreversible pseudo-second-order
Ea = 27.24 kJ/mol
[43]
Waste cooking oil
(Transesterification)
14:1CaO/SiO2
8% w/w
916090Adsorption, surface reaction and desorption
A = 5.44 × 10⁸ min−1
Ea = 66.27 kJ/mol
[46]
Waste cooking oil
(batch reaction)
14:1K–CeO2
1.5 wt.%
99.09 (conversion)65 ± 0.575Adsorption, surface reaction and desorption
Ea = 50.1 kJ mol−1
A = 35.4 × 10⁵ min−1
[47]
Waste cooking oil
(Simultaneous esterification and transesterification)
10:1
(ethanol)
SrO–ZnO/Al2O3
as bifunctional catalyst
15 wt.%
95.7
(conversion)
75300-[45]
Waste cooking oil
(Batch reaction)
Esterification then transesterification
8.12:1
then
6.1:1
1.9 wt.% of H2SO4
1.2 wt.% of KOH
99.7760 (for both)90
Then
110
Pseudo-homogeneous first-order irreversible
Esterification:
Ea = 57.36909 kJ/mol
A = 4.73 × 10⁷ min−1
Transesterification:
Ea = 61.90272 kJ/mol
A = 1.43 × 10¹¹ min−1
This work
Table 7. Coded and un-coded values of levels and factors (WCO esterification).
Design Summary (Face-Centred CCD, α = 1):
Factors:4Replicates:1Base blocks:1
Base runs:31Total runs:31Total blocks:1
Two-level factorial (Full factorial) Point Types:
Cube pointsCentre points in cubeAxial pointsCentre points in axial
16780
CCD Factors and limits:
FactorsCoded FactorSymbolLowHigh
Methanol: Oil (M)AM612
H2SO4 (wt.%)BA1.52.5
Temperature (°C)CT5565
Time (minutes)DD90180
Table 8. RSM analysis of the esterification process with percentile quantity of the experimental and predicted acidity removal.
Run OrderMATD%E Removal (Exp)%Ep Removal (Predicted)
161.5559092.8592.87
362.5559094.4694.51
561.5659091.9491.81
762.5659094.2994.33
961.55518089.4189.45
1162.55518090.8190.76
1361.56518090.6390.69
1562.56518092.7992.91
17626013595.6995.58
1991.56013597.1597.21
2092.56013594.6294.56
21925513594.6694.59
22926513594.8994.96
2392609098.3798.34
24926018097.1197.19
25926013597.2997.33
26926013597.2397.28
27926013597.3597.28
28926013597.4597.28
29926013597.0197.28
30926013597.1997.28
31926013597.3397.28
2121.5559092.4992.51
4122.5559085.1685.20
6121.5659091.2191.20
8122.5659084.6184.65
10121.55518091.4991.51
12122.55518083.9984.09
14121.56518092.3892.43
16122.56518085.6385.66
181226013591.8991.93
Table 9. Optimal response analysis for the esterification of WCO using the RSM analysis method.
VariablesMATD
Optimal Values8.121211.8939459.646590
ResponseFitSE Fit95% CI95% PI
Acidity removed98.84790.062(98.7164, 98.9794)(98.6140, 99.0818)
Table 10. The ANOVA test of the quadratic model for the acidity removal of the WCO as a function of the considered parameters (coded).
SourceDFSeq SSContributionAdj SSAdj MSF-Valuep-Value
Model14508.10799.97%508.10736.29344359.110
Linear4101.58519.99%101.58525.39643050.30
M164.29812.65%64.29864.29787722.650
A129.8765.88%29.87629.87643588.390
T10.5170.10%0.5170.516862.070
D16.8941.36%6.8946.8944828.070
Square4315.33762.04%315.33778.83429468.580
M21280.06555.10%32.02132.02123845.990
A2118.4083.62%5.2165.2157626.440
T2116.3673.22%16.58116.58071991.470
D210.4960.10%0.4960.496459.620
2-Way Interaction691.18517.94%91.18515.19751825.340
MA179.65615.67%79.65679.65569567.250
MT10.1260.02%0.1260.12615.140.001
MD16.151.21%6.156.1504738.710
AT10.5550.11%0.5550.55566.660
AD10.0320.01%0.0320.03243.890.066
TD14.6660.92%4.6664.6656560.370
Error160.1330.03%0.1330.0083
Lack-of-Fit100.0150.00%0.0150.00150.081
Pure Error60.1180.02%0.1180.0197
Total30508.24100.00%
SR-sqR-sq (adj)PRESSR-sq (pred)
0.091246299.97%99.95%0.20194999.96%
Table 11. Coefficients of the coded parameters and the VIF of the response model for the esterification process of WCO.
TermCoefficientsStandard Error95% CIT-Valuep-ValueVIF
Constant97.2820.0271(97.2246, 97.3394)3593.990
M−1.890.0215(−1.9356, −1.8444)−87.8801
A−1.28830.0215(−1.3339, −1.2427)−59.901
T0.16940.0215(0.1239, 0.2150)7.8801
D−0.61890.0215(−0.6645, −0.5733)−28.7801
M2−3.51270.0566(−3.6327, −3.3926)−62.0202.91
A2−1.41770.0566(−1.5377, −1.2976)−25.0302.91
T2−2.52770.0566(−2.6477, −2.4076)−44.6302.91
D20.43730.0566(0.3173, 0.5574)7.7202.91
MA−2.23120.0228(−2.2796, −2.1829)−97.8101
MT−0.08880.0228(−0.1371, −0.0404)−3.890.0011
MD0.620.0228(0.5716, 0.6684)27.1801
AT0.18630.0228(0.1379, 0.2346)8.1601
AD−0.0450.0228(−0.0934, 0.0034)−1.970.0661
TD0.540.0228(0.4916, 0.5884)23.6701
Table 12. Central composite design (CCD) algorithm for the transesterification process of esterified WCO.
Design Summary (Face-Centred CCD, α = 1)
Factors:4Replicates:1Base blocks:2
Base runs:30Total runs:30Total blocks:2
Two-level factorial (Full factorial) Point Types
Cube pointsCentre points in cubeAxial pointsCentre points in axial
16482
FactorsCoded FactorSymbolLowHigh
Methanol: Oil (M)AM57
KOH (wt.%)BB12
Temperature (OC)CT5060
Time (minutes)DD60120
Table 13. RSM analysis of the transesterification process of the esterified WCO.
Run OrderMBTDBiodiesel Yield, Y (%)Predicted Yield, YP (%)
1716012095.1495.11
272506080.7180.57
4725012080.9981.07
7715012082.1582.08
1071606093.5493.59
1271506082.5882.66
13726012092.9193.03
2072606090.3690.43
2371.5559090.4990.32
661.5559096.1396.19
862609096.0196.05
14626012098.2197.87
1561.5559096.2296.19
2161.5609098.9298.82
2261.5556094.9594.84
2461.5559095.0595.02
2561.55512095.8896.04
2661559091.9991.95
2761.5559094.7995.02
2862559091.2891.34
2961.5509088.6288.74
352606081.4181.45
551606081.7281.65
9516012083.4283.54
11526012084.3384.43
16525012075.2975.22
1752506074.3074.34
18515012073.3473.27
1951506073.4473.47
3051.5559081.5581.43
Table 14. Determination of the optimal response for the transesterification process of WCO by the RSM analysis.
VariablesMBTD
Optimal values6.11.260110
ResponseFitSE Fit95% CI95% PI
WCO biodiesel yield99.77180.0789517(99.6025, 99.9411)(99.4524, 100.091)
Table 15. The ANOVA test of the transesterification process yield prediction (coded parameters).
SourceDFSeq SSContributionAdj SSAdj MSF-Valuep-Value
Model151864.9199.99%1864.91124.3277797.70
Blocks1304.6516.33%3.493.489218.820
Linear41019.2354.65%843.52210.88113,226.280
M1356.1819.10%356.18356.17822,339.180
B114.490.78%1.821.823114.350
T1632.7433.92%477.8477.79929,967.160
D115.830.85%6.426.418402.510
Square4517.8427.76%505.8126.457930.860
M21471.6325.29%274.06274.06217,188.960
B2141.832.24%29.6929.6911862.20
T213.620.19%4.034.033252.920
D210.760.04%0.440.44527.90
2-Way Interaction623.191.24%23.193.864242.370
MB18.780.47%8.788.776550.450
MT17.580.41%7.587.576475.180
MD10.140.01%0.140.1438.940.01
BT11.10.06%1.31.30281.670
BD11.270.07%1.091.0968.340
TD14.320.23%4.324.321270.990
Error140.220.01%0.220.016
Lack-of-Fit120.190.01%0.190.0150.820.672
Pure Error20.040.00%0.040.019
Total291865.13100.00%
Model Summary
SR-sqR-sq(adj)PRESSR-sq(pred)
0.1262799.99%99.98%1.0202899.95%
Table 16. Coefficients of the regression fit and VIF values for the transesterification process of WCO.
TermCoefSE Coef95% CIT-Valuep-ValueVIF
Constant95.59390.0544(95.4773, 95.7105)1758.530
Blocks
10.57950.0392(0.4955, 0.6635)14.7902.57
2−0.57950.0392(−0.6635, −0.4955)−14.790
M4.44830.0298(4.3845, 4.5122)149.4601
B−0.31050.029(−0.3728, −0.2482)−10.6901.05
T5.02670.029(4.9644, 5.0890)173.1101.05
D0.5870.0293(0.5242, 0.6497)20.0601.02
M2−9.07130.0692(−9.2197, −8.9229)−131.1102.16
B2−3.3810.0783(−3.5491, −3.2130)−43.1502.57
T2−1.2460.0783(−1.4141, −1.0780)−15.902.57
D20.38650.0732(0.2296, 0.5435)5.2802.34
MB−0.74060.0316(−0.8083, −0.6729)−23.4601
MT0.68810.0316(0.6204, 0.7558)21.801
MD−0.09440.0316(−0.1621, −0.0267)−2.990.011
BT−0.27750.0307(−0.3433, −0.2116)−9.0401.06
BD0.2560.031(0.1896, 0.3224)8.2701.02
TD0.50970.031(0.4433, 0.5761)16.4601.02
Publisher’s Note: MDPI stays neutral with regard to jurisdictional claims in published maps and institutional affiliations.

