Article

Heterologous Lignan Production in Stirred-Tank Reactors—Metabolomics-Assisted Bioprocess Development for an In Vivo Enzyme Cascade

1
Chair for Bioprocess Engineering, TU Dortmund University, Emil-Figge-Straße 66, 44227 Dortmund, Germany
2
Institute of Biochemistry, Heinrich Heine University, Universitätsstraße 1, 40225 Düsseldorf, Germany
*
Author to whom correspondence should be addressed.
Catalysts 2022, 12(11), 1473; https://doi.org/10.3390/catal12111473
Submission received: 30 September 2022 / Revised: 6 November 2022 / Accepted: 16 November 2022 / Published: 18 November 2022

Abstract

:
Towards establishing a prospective industrial microbial lignan production process, we set up and investigated the biotransformation of coniferyl alcohol to secoisolariciresinol with recombinant Escherichia coli in a stirred-tank reactor (STR). Initially, we tested different cofactor concentrations and antifoam additions in shake flasks. Next, we designed an STR batch bioprocess and tested aeration rates, pH regulation, and substrate-feeding strategies. Targeted metabolomics of phenylpropanoids and lignans assisted the bioprocess development by monitoring the lignan pathway activity. We found that the copper concentration and the substrate-feeding strategy had considerable impact on lignan production. Furthermore, time-resolved monitoring of pathway metabolites revealed two maximal intracellular lignan concentrations, the first shortly after induction of gene expression and the second after the cells entered the stationary growth phase. During STR cultivation, a maximal intracellular titer of 130.4 mg L−1 secoisolariciresinol was achieved, corresponding to a yield coefficient of 26.4 mg g−1 and a space–time yield of 2.6 mg L−1 h−1. We report for the first time the in-depth evaluation of microbially produced lignans in a well-controlled STR bioprocess. Monitoring of the lignan pathway activity showed that lignan accumulation is highly dynamic during the cultivation and points towards the need for a more efficient coniferyl alcohol dimerization system for optimal microbial production conditions.

Graphical Abstract

1. Introduction

Lignans are secondary plant metabolites that are used for the development of anticancer drugs and as dietary supplements due to their vast and diverse health-beneficial biological activity [1]. For instance, secoisolariciresinol (SILR) exhibits anti-inflammatory, antioxidant, and (anti)estrogenic activity, amongst others [2]. However, lignan extraction from native plant producers is inefficient and causes environmental degradation [3,4]. Biocatalytic cascades using engineered microbes or isolated enzymes are valuable tools for the sustainable synthesis of pharmaceuticals and fine chemicals from renewable substrates [5,6]. Hence, a bioprocess using a biocatalytic cascade is desired to ensure the stable and more sustainable production of lignans.
The lignan biosynthesis pathway starts with the one-electron oxidation of two phenylpropanoid monomers, for instance, performed by a copper-dependent laccase or an oxidizing agent. Without the assistance of so-called dirigent proteins, the homocoupling of coniferyl alcohol radicals results in the production of a racemic mixture of the lignan (±)-pinoresinol as well as several byproducts [7]. Further conversion of (+)-pinoresinol by an enantioselective pinoresinol-ariciresinol reductase (PLR) leads first to the formation of (+)-lariciresinol and subsequently (−)-SILR [8,9]. Depending on the genetic toolbox of the respective organism, a plethora of diverse lignan structures is formed [10]. Previously we reported microbial SILR production from a monomeric substrate for the first time. We employed a laccase from Corynebacterium glutamicum (CgL1) for coniferyl alcohol dimerization and a PLR from Forsythia intermedia for heterologous SILR production in Escherichia coli as host [11]. In a recent study, Decembrino et al. used the copper-activated endogenous laccase CueO of E. coli for coniferyl alcohol dimerization instead of CgL1 [12].
SILR was previously produced as product, byproduct, or intermediate in resting-cell biotransformations of various substrates with mono- or cocultures of engineered E. coli, but only in small-scale cultivation systems (Table 1). Cells for resting-cell biotransformations were grown in complex media, commonly supplemented with CuSO4 when a laccase was synthesized for coniferyl alcohol oxidation during biotransformation. When a P450 monooxygenase was part of the in vivo cascade, 5-aminolevulinic acid and FeSO4 were added. Protein synthesis was performed at 25–30 °C. The biotransformations were carried out in Tris-buffered LB medium or potassium phosphate (KPi) buffer at 22 or 25 °C. For biotransformations in KPi buffer, glucose was added to facilitate cofactor regeneration and isopropyl-β-d-thiogalactopyranoside (IPTG) to keep the cells in an induced state [9,11,12,13]. Factors influencing the substrate conversion and the final lignan yield were the choice of substrate [9,12], the cell density [13], and the time of fresh-cell addition for cocultures [11,12]. When monomeric substrates were provided, the choice of laccase [11,12], the supplied concentration of the necessary cofactor copper, and the timing of the substrate addition [12] had a notable impact on product formation.
The bioavailable copper and the endogenous CueO laccase activity of E. coli are influenced by several dissenting cultivation conditions. For instance, the solubility of copper ions is pH-dependent [14]. The availability of oxygen exhibits both positive and negative influence on CueO activity. On the one hand, the endogenous PcueO is oxygen-dependent [15] and oxygen is required as the final electron acceptor during the catalytic cycle [16]. On the other hand, the accumulation of copper within cells and the loading of CueO with copper ions are favored by microaerobic conditions [15,17]. In addition, copper in high concentrations limits cell viability due to the toxicity of free copper ions [18]. Thus, for an optimal lignan production bioprocess from a monomeric substrate, the environmental conditions must be considered as well as the above-mentioned parameters, since they impact the concentration of the bioavailable copper, the laccase activity, and the cell viability.
Quantitative metabolite analysis is a valuable tool for bioprocess development [19]. It enables the determination of key bioprocess parameters, i.e., yield coefficients based on the substrate (YP/S) or biomass (YP/X) and space–time yield (STY). In addition, metabolomics in combination with frequent sampling permits monitoring of in situ lignan pathway activity, as recently established by our group [20]. Since the previously designed bioprocesses (Table 1) were carried out in shake flasks or reaction tubes, an SILR production bioprocess in a scalable reaction vessel, for instance, a stirred-tank reactor (STR), does not currently exist. Correspondingly, neither key bioprocess parameters nor lignan pathway activity are available for SILR production in an STR. The determination of key bioprocess parameters and the behavior of lignan pathway activity is essential for the development of an efficient, scalable, microbial lignan-production bioprocess.
Herein we investigated the transfer of an SILR production process with recombinant growing cells harboring an in vivo cascade in a defined growth medium from shake flasks to an STR system. By applying our previously established targeted metabolomics method [20], we monitored intracellular phenylpropanoid and lignan concentrations and thereby assessed pathway activity upon changes in the concentration of the supplemented copper ions, the addition of antifoam, the availability of oxygen, the pH, and the substrate addition. The in-depth monitoring over the course of cultivation points out a major bottleneck in the microbial bioprocess, which is the coniferyl alcohol dimerization initiated by CueO.

2. Results

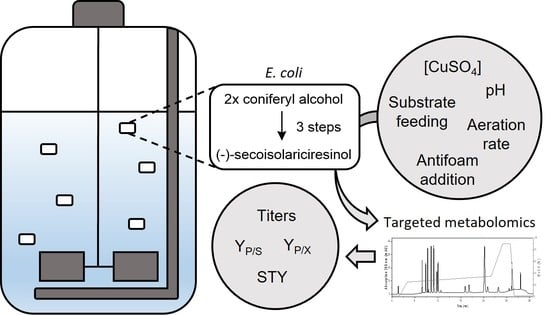
2.1. Bioprocess Design

A recombinant E. coli was constructed for the biotransformation of the monomeric substrate coniferyl alcohol to the lignan SILR (Figure 1). CueO, an endogenous laccase of E. coli that is activated by the addition of copper ions [12], was used to initiate the formation of (±)-pinoresinol. For the enantioselective conversion of (+)-pinoresinol to the intermediate (+)-lariciresinol and the subsequent product (−)-SILR, PLR was synthesized using pCDFDuet_syfiPLR [11]. To induce plr expression and activate CueO, IPTG and CuSO4 were added during the early exponential phase. Our bioprocess design was based on growing cells to simplify the evaluation of fitness under the various tested medium and process conditions. Additionally, a biotransformation with growing cells does not require an extra vessel for the production of the biocatalyst. Therefore, the substrate coniferyl alcohol was added simultaneously with IPTG and CuSO4, with the exception of the substrate-feeding experiments. Cells were grown in a modified Riesenberg medium [20]. Riesenberg medium is suitable for high-cell-density cultivations and is chemically defined [21]. Regarding a prospective industrial process, defined media enable a high process reproducibility, are easier to scale up, facilitate process regulation as well as monitoring, and entail comparatively lower costs for product isolation and purification [22]. The first step for a future scale-up requires the transfer to a scalable reaction vessel and the knowledge of critical control parameters for the maintenance of metabolic activity [23]. Therefore, we changed to an STR after the initial experiments in shake flasks. Using our previously published targeted metabolomics method for phenylpropanoid and lignan quantification [20], we tested the impact of various process parameters on lignan pathway activity and SILR production.

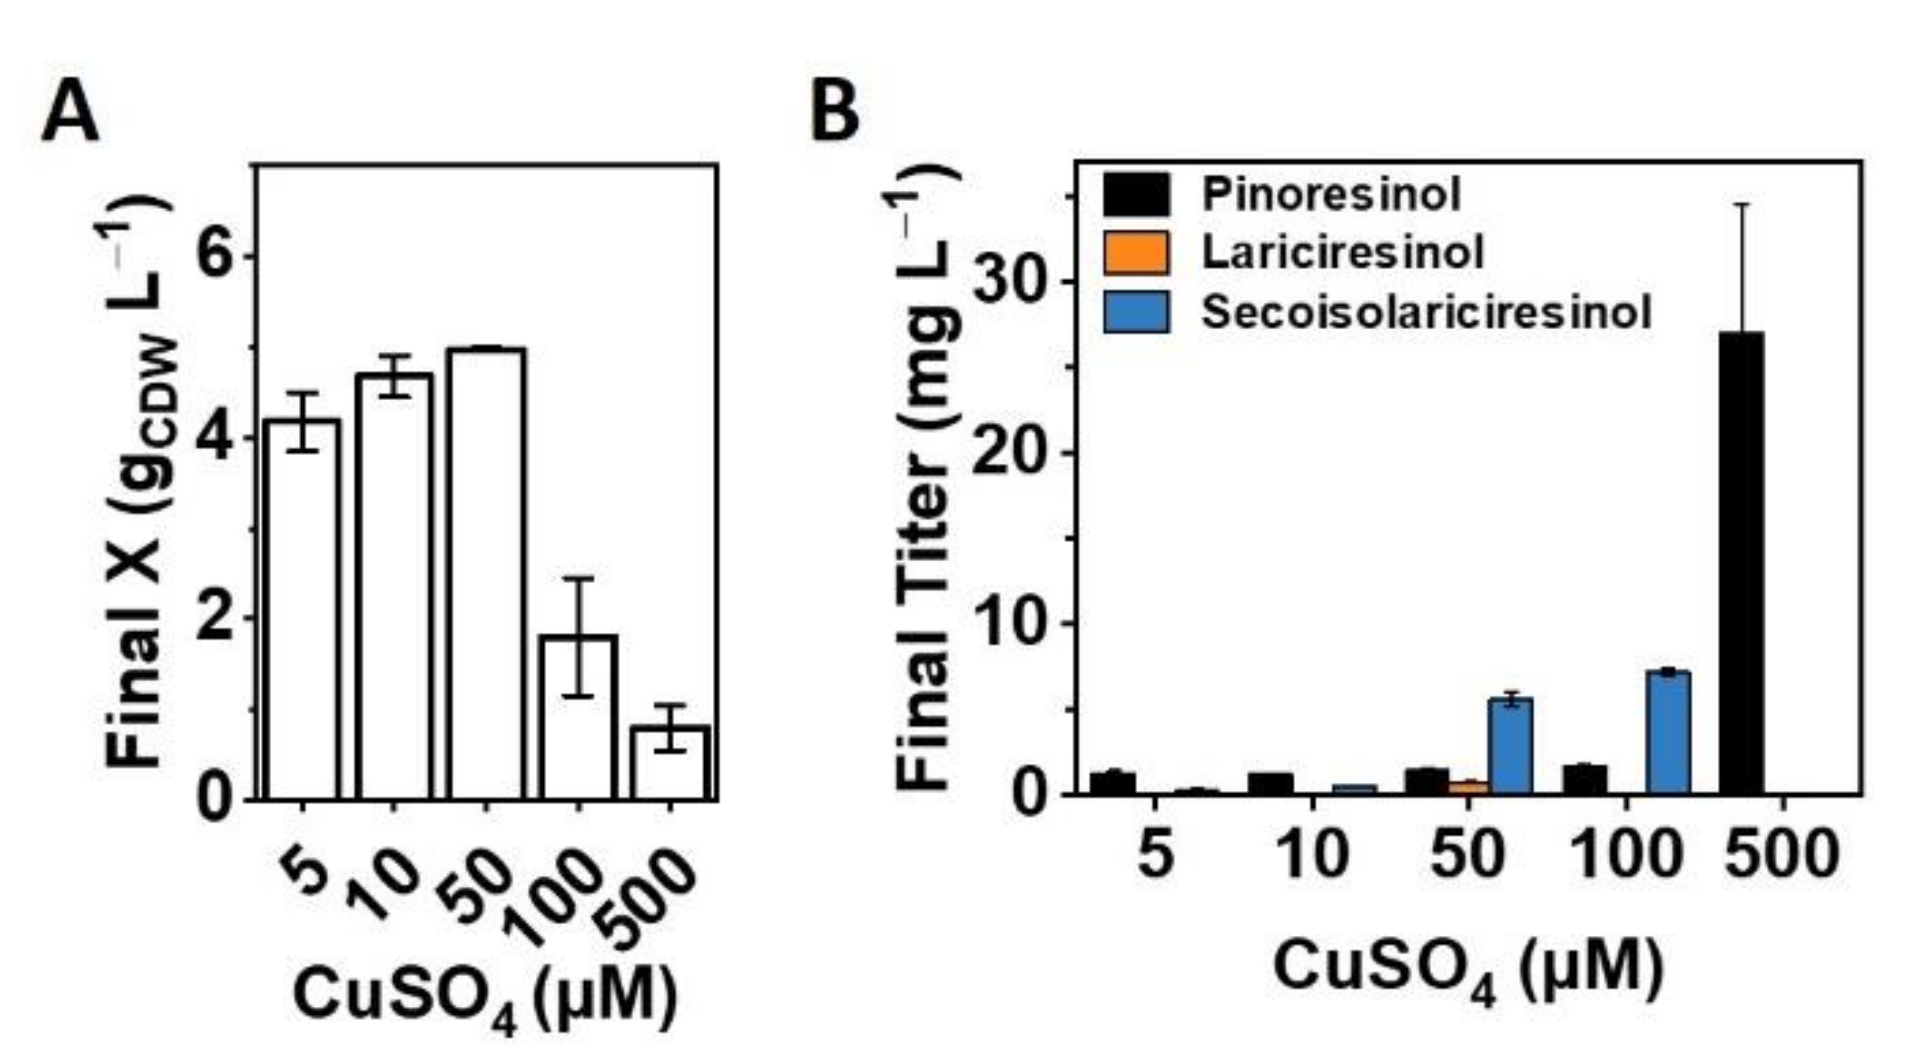
2.2. Optimizing the Copper Supply

To find the optimal copper supply for SILR production, we varied the added CuSO4 concentration. During the catalytic cycle of laccases, copper ions transfer electrons from the substrate to the final acceptor oxygen and are thus required as cofactor [24]. However, an excess of copper ions overexerts the copper homeostasis system, resulting in damage to cellular reactions and decreased viability [18]. Thus, an optimal concentration of supplemented copper ions is necessary for combined CueO activation and sufficient viability for cell growth. To determine the optimal CuSO4 concentration for the set process key points, we tested various CuSO4 concentrations, ranging from 5 to 500 µM, that were supplemented at the time of induction with IPTG and coniferyl alcohol.
As displayed in Figure 2, similar final biomass concentrations (X) of approximately 4.5 g cell dry weight (CDW) L−1 were reached with supplemented CuSO4 concentrations between 5 and 50 µM. In contrast, final Xs of 1.8 ± 0.7 and 0.8 ± 0.3 gCDW L−1 were measured after the addition of 100 and 500 µM CuSO4, respectively. In a biotransformation setup with a defined medium, supplementation of 100 µM CuSO4 and above caused growth limitation.
Regarding product formation, only low titers of pinoresinol and SILR were measured when CuSO4 at a concentration below 50 µM was added (Figure 2). For 50 and 100 µM CuSO4, the pinoresinol titer was still low, whereas a comparably high accumulation of SILR was observed, reaching a maximal titer of 7.2 ± 0.2 mg L−1 at 100 µM CuSO4. Lariciresinol accumulation was only quantified at 50 µM CuSO4, but titers were still very low with less than 1 mg L−1. The extracellular pinoresinol titer peaked at 500 µM CuSO4 with 27.0 ± 7.6 mg L−1, but no lariciresinol or SILR was detected. Further increase in the CuSO4 concentration up to 4000 µM was tested but resulted in lower pinoresinol titers and subsequent lignans were not detected (data not shown). Coniferyl aldehyde and coupling byproducts were also detected in culture supernatants (data not shown).
The highest titer of the final product SILR was measured at 100 µM CuSO4. Addition of 50 µM CuSO4 resulted in SILR accumulation within the same range, while still enabling cell growth. Further experiments were thus carried out with supplementation of 50 µM CuSO4.

2.3. Impact of Antifoam Addition and Oxygen Availability on Lignan Synthesis

Active aeration and stirring cause foaming, resulting in several physical and biological drawbacks. The addition of an antifoam agent to the medium decreases foaming, but can also affect mass transfer and cellular metabolism [25]. Antifoam addition is required for STR cultivation, but we also tested its effect on growth and lignan accumulation during shake-flask cultivation. Samples were taken periodically during cultivation to monitor temporal changes in the lignan pathway activity and both extra- and intracellular lignan titers were quantified (Figure 3). Regarding growth parameters X, pH, glucose, and acetate concentration, no considerable effect of 0.01% (v/v) antifoam 204 (AF204) was apparent compared to the reference condition without AF204 (Figure S1). Extra- and intracellular coniferyl alcohol titers decreased similarly as well (Figure 3). Regarding intracellular lignan accumulation, a temporary maximum was apparent at 5 h after induction for both conditions. At this time, we observed increased intracellular titers of 670.9 ± 84.9 mg L−1 pinoresinol and 202.5 ± 14.0 mg L−1 SILR in cultivations with antifoam addition, compared to the reference with 243.1 ± 89.0 and 108.8 ± 14.5 mg L−1, respectively. Afterwards, intracellular titers of pinoresinol, lariciresinol, and SILR declined to a temporary minimum. However, they increased again during the stationary phase, reaching similar final intracellular SILR titers of 123.1 ± 1.9 mg L−1 for the reference and 134.0 ± 3.1 mg L−1 for cultures with antifoam addition at 24 h after induction. In comparison, extracellular titers exhibited higher fluctuations than intracellular titers, deeming recognition of trends difficult. The coniferyl aldehyde accumulation was not affected by the antifoam addition. Both extra- and intracellular coniferyl aldehyde titers showed a trend of accumulation shortly after the substrate addition, followed by a temporary decrease and subsequent increase during the stationary phase. Monitoring of intracellular titers during cultivation in baffled flasks with and without antifoam addition showed a distinct dynamic of pathway activity, resulting in increased lignan accumulation shortly after copper addition and during the stationary phase. As antifoam addition did not affect growth and the change in the intracellular dynamics was minor, we conclude that antifoam in the added concentration of 0.01% (v/v) has no negative effect on product formation.
It was previously reported that microaerobic conditions during CueO synthesis were beneficial for in vitro oxidation activity [17]. Therefore, we tested the impact of oxygen availability on lignan production by comparing cultivation and biotransformation in baffled to unbaffled shake flasks. The usage of unbaffled shake flasks instead of baffled ones had a profound effect on cellular metabolism. Final Xs in unbaffled flasks were less than half as high as in baffled flasks with 1.7 ± 0.0 gCDW L−1 vs. 4.5 ± 0.3 gCDW L−1, respectively (Figure S1). Although glucose was nearly depleted from the medium at the end of cultivation in unbaffled flasks, the decrease in extracellular glucose concentration occurred slower compared to cultivation in baffled shake flasks. Furthermore, extracellular acetate accumulation reached up to 3.3 ± 0.0 g L−1 at the end of cultivation, compared to a maximal acetate concentration of 0.7 ± 0.3 after 14 h of cultivation in baffled shake flasks. Accordingly, the pH decreased to 5.0 ± 0.0 in unbaffled shake flasks and 6.4 ± 0.1 in baffled shake flasks after ~27 h of cultivation. The slower glucose depletion, as well as the accumulation of acetate and the concomitant decrease in pH, indicate oxygen-limiting conditions. As a derivate of E. coli BL21(DE3), C43(DE3) commonly exhibits low acetate formation. However, increased acetate accumulation was previously shown for E. coli BL21(DE3) at low dissolved oxygen concentrations (DO) [26]. Thus, less oxygen was transferred during cultivation in unbaffled shake flasks. The uptake of supplemented coniferyl alcohol occurred similarly in baffled and unbaffled shake-flask cultivations (Figure 3). A more constant intracellular coniferyl alcohol titer was detected during cultivation in unbaffled shake flasks. Accumulation of extra- and intracellular lignan metabolites exhibited the same dynamic during cultivation in unbaffled flasks as observed for the baffled reference cultivation, resulting in comparable intracellular SILR titers (125.7 ± 8.9 mg L−1 vs. 123.1 ± 1.9 mg L−1 at 24 h after induction, respectively). With regard to coniferyl aldehyde formation, increased extracellular titers were measured 1 to 5 h after the substrate addition. In contrast to the reference cultivation in baffled flasks, no second phase of coniferyl aldehyde accumulation occurred during cultivation in unbaffled flasks. Although the use of shake flasks without baffles had a strong impact on the growth and accumulation of coniferyl aldehyde, this was not the case for the accumulation of the final product SILR. The effect of oxygen availability was further scrutinized in subsequent STR cultivation experiments. Due to the high fluctuation of extracellular titers, only intracellular titers were considered in further experiments.

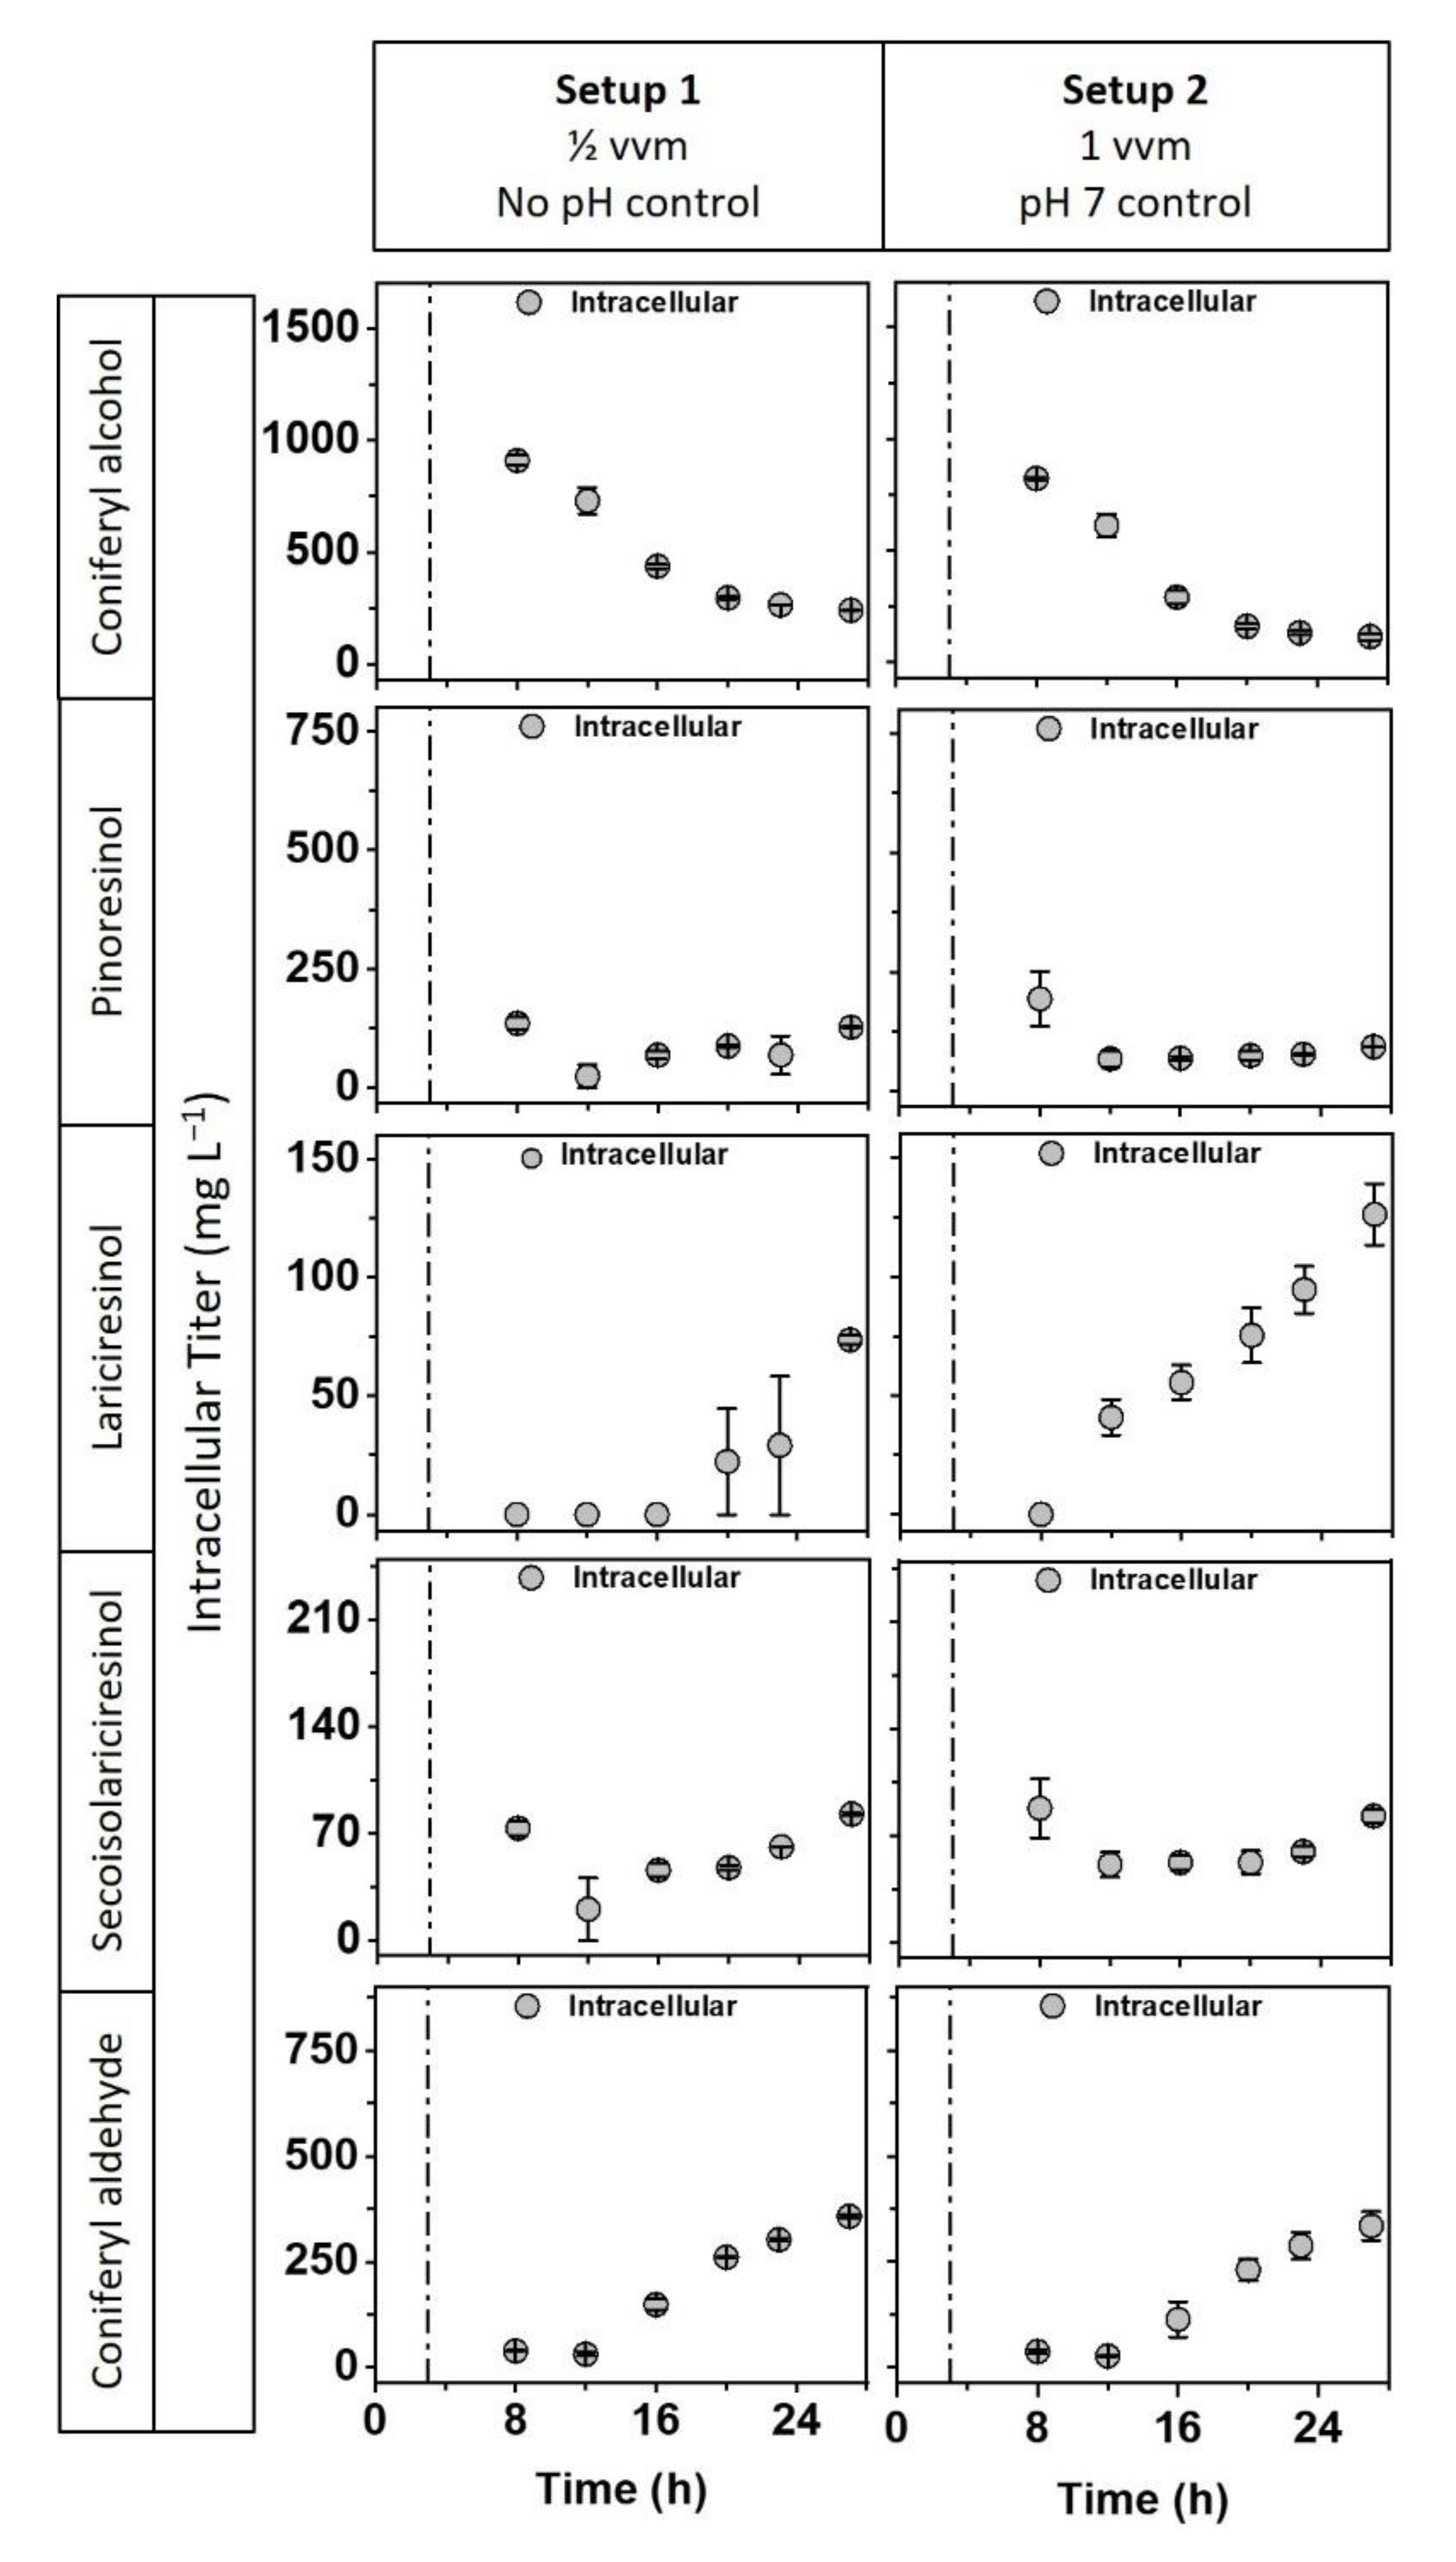
2.4. Transfer to Stirred-Tank Reactor with Regulated Conditions

A prospective microbial lignan production process requires a scalable reaction system. To test the scalability of the biotransformation, we next transferred the developed process from shake flasks to an STR system. In a first setup (Setup 1), a relatively low aeration rate of 0.5 volume gas per volume liquid per minute (vvm) and no pH regulation were chosen to generate an STR process with conditions close to those during shake-flask cultivation. As displayed in Figure S2, growth-related parameters of STR cultivation did not change considerably after transfer from shake flasks. After induction, similar specific growth rates µ of 0.35 ± 0.02 h−1 for STR Setup 1 and 0.31 ± 0.01 h−1 for shake-flask cultivation were observed. Slightly higher final Xs were reached during STR cultivation (5.5 ± 0.3 gCDW L−1 vs. 4.8 ± 0.1 gCDW L−1 at 24 h after induction). Although acetate accumulation was low in both baffled shake flasks and STR, the maximal acetate concentration was marginally lower for STR Setup 1, with 0.1 ± 0.0 g L−1 at 12 h of cultivation and 0.5 ± 0.2 g L−1 at approx. 14 h of shake-flask cultivation. Furthermore, in both cultivation systems, the same trends of intracellular accumulation of phenylpropanoid and lignan metabolites were observed, pointing towards an active lignan pathway. Similar to shake-flask cultivations (Figure 3), a temporary decrease in the intracellular lignan titers occurred during the mid-to-late exponential phase of STR cultivation (Figure 4), followed by accumulation during the stationary phase. Final intracellular SILR titers of 82.9 ± 0.6 mg L−1 were achieved during STR cultivation, compared to 134.0 ± 3.1 mg L−1 in shake-flask cultivation. Further intracellular metabolite titers were also within the same range as observed for shake-flask cultivation, although both pinoresinol and lariciresinol titers were slightly higher during shake-flask cultivation, corresponding to the higher SILR titer. Based on the similar growth parameters, trends of intracellular metabolites, and measured intracellular titers for both shake-flask and STR cultivation, the transfer of cultivation systems was successful.
STR systems enable the monitoring and regulation of process parameters such as pH and DO. Both parameters are known or presumed to (indirectly) influence CueO activity [14,15,17]. In a second setup (Setup 2), the pH was regulated at 7.0 for an optimal environmental pH for E. coli. The aeration rate was increased to 1 vvm for sufficient oxygen availability even under increased cell densities, for instance during fed-batch cultivation. The different aeration rates and pH regulation strategies of Setups 1 and 2 did not considerably impact cell growth, glucose consumption, and acetate formation (Figure S2). As expected, the pH of the unregulated STR Setup 1 dropped to 6.2 ± 0.0 over the course of the exponential phase, whereas the pH of cultures in the regulated Setup 2 remained constant at 7.0 ± 0.0. Predictably, the DO of Setup 1 decreased slightly further than the DO of Setup 2 during exponential growth, reaching minimum DOs of 44 ± 6% and 56 ± 13%, respectively (Figure S3). Intracellular accumulation of substrate, intermediates, and (by)product showed similar trends of pathway activity between both setups (Figure 4). Measured titers of metabolites were also mostly within the same range. The measured intracellular titers of lariciresinol were higher in the cultures of Setup 2. However, this was not reflected in the accumulation of pinoresinol or SILR. Since neither pH regulation nor an aeration rate of 1 vvm impacted lignan pathway activity and SILR formation, further STR experiments were carried out without pH regulation and an aeration rate of 6 L h−1.

2.5. Impact of Coniferyl Alcohol Feeding Strategies on Pathway Activity

Since dynamic pathway activity was observed during cultivation in previous experiments, we intended to feed the substrate at different time points to evaluate the pathway activity on dependence on the feeding strategy. Comparable to previous experiments, the substrate was supplied as a single pulse in a concentration of 0.5 g L−1 at the time of induction (F1). In contrast, two different pulsed-feeding strategies following either a linear (F2) or an exponential (F3) profile were assessed. For F4, the substrate was added as a single pulse during the early stationary phase. Both IPTG and CuSO4 were added at an optical density at 600 nm (OD600) of 0.6.
As expected, feeding strategy F1 (Figure S4) exhibited similar growth behavior compared to Setup 1 (Figure S2). Likewise, intracellular lignan accumulation also occurred comparably (Figure 5), reaching an intracellular SILR titer of 90.6 mg L−1 at 24 h after induction for F1. Simultaneous addition of IPTG, CuSO4, and the substrate (F1) appeared to cause a short lag time in growth compared to the other feeding strategies (F2–F4). Otherwise, no major differences were observed regarding growth parameters X, pH, and carbon-source consumption. As expected, intracellular coniferyl alcohol titers varied for the different strategies. For F2, intracellular coniferyl alcohol concentration was almost constant, whereas an increase was observed in F3, correlating with the increasing externally supplied coniferyl alcohol concentration. For F4, no coniferyl alcohol was detected during the exponential phase since it was added as late as the beginning of the stationary phase. For both F3 and F4, a decrease in the intracellular substrate titer was observed after the majority or all of the substrate was added at 13 h after induction. In contrast to F1, no lignan products were detected in intracellular samples of F2, F3, or F4. However, an increased formation of the undesired byproduct coniferyl aldehyde was observed for cultures subjected to these feeding strategies. Feeding experiments demonstrated that the mechanism of coniferyl dimerization was no longer active when substrate supplementation was delayed from IPTG and CuSO4 addition. This indicates that the initial copper pulse is important for the dimerization of coniferyl alcohol in the biotransformation setup with growing cells in a defined medium.

2.6. Determination of Key Bioprocess Parameters

In previous studies where SILR was produced as a (by)product or intermediate (Table 1), key bioprocess parameters such as YP/X, YP/S, and STY were not determined for SILR biosynthesis. We calculated these coefficients for the various experiments with a time-resolved analysis of intracellular metabolite titers in shake flasks and STR (Table 2). The yield coefficients and STY were calculated based on the estimated total concentration of SILR within the reaction volume (within cells and in the extracellular medium).
In the time-resolved analysis of SILR accumulation, we observed two maxima of the lignan pathway activity: one shortly (5 h) after induction and one during the stationary phase towards the end of cultivation (24 after induction). YP/X and STY were higher at 5 h than at 24 h after induction (Table 2) due to the low X and the short reaction time at this time in the process. The highest YP/X of 26.4 mg gCDW−1 was calculated for the cultivations in baffled shake flasks with antifoam addition at 5 h after induction. These cultivations also exhibited the highest YP/S and STY at the same process time, with 41.1 mg g−1 and 4.1 mg L−1 h−1, respectively. At the end of cultivation, YP/S and STY were also highest for cultivation in baffled shake flasks with antifoam addition, achieving 29.3 mg g−1 and 0.6 mg L−1 h−1. However, due to the low final cell density during cultivation in unbaffled flasks, the highest YP/X at the end of cultivation was determined for cultivation in unbaffled shake flasks (7.5 mg gCDW−1). YP/X, YP/S, and STY were not determined for STR feeding strategies F2, F3, and F4 because no intracellular SILR was detected during these cultivations.

3. Discussion

In previous studies of microbial lignan production from a monomeric substrate, SILR was produced as a (by)product or intermediate, but only in a small scale, and SILR titers were not quantified. Therefore, we developed the first bioprocess for SILR production using growing cells in a defined medium cultivated in an STR system. Various medium and process parameters were considered. Assisted by targeted metabolomics of phenylpropanoid and lignan metabolites, we performed a quantitative, time-resolved analysis of lignan production for our developed process and the various tested conditions.
The intracellular metabolite titers monitored during cultivation in both shake flasks and STRs revealed a distinct trend of lignan accumulation with two maxima at 5 h after induction and during the stationary phase when the substrate was supplemented at the same time as IPTG and CuSO4. These results are in accordance with our previously obtained data [20]. Based on the trend of lignan accumulation observed under various process conditions, lignan pathway activity is robust but not constant during the monitored cultivation time of the developed bioprocess. Since lariciresinol and SILR titers increase and decrease in accordance with the pinoresinol titer, PLR is assumed to be constantly active. Thus, changes in pathway activity are presumed to be a result of varying oxidation activity of CueO. In a previous study, changes in CueO activity were observed depending on the use of either resting or growing E. coli cells. Resting cells exhibited higher CueO activity than growing cells, which was suspected to relate to the oxygen availability in growing cells [12]. On the one hand, cueO expression is oxygen-dependent and oxygen is required as the final electron acceptor of the oxidation reaction [15]. On the other hand, CueO activity also depends on sufficient loading with copper ions, which is improved under microaerobic conditions [17]. However, neither oxygen depletion as a consequence of the shake-flask shape nor improved availability due to active aeration and stirring had a considerable effect on the formation of lignans. The attribution of changes in pathway activity is further obstructed by the promiscuity of CueO, which also accepts pinoresinol as substrate, leading to oligo- and polymerization [12]. Thus, changes in CueO activity require further elucidation.
Most of the investigated medium and process parameters, including antifoam addition, oxygen availability, and pH regulation, showed little effect on the lignan pathway activity and the accumulation of SILR within the tested range. In contrast, the supplemented copper concentration and the feeding of the substrate exhibited noticeable effects on product formation. Regarding copper concentration, SILR accumulation peaked at 50–100 µM CuSO4, but reduced growth was also observed at 100 µM. A dependency of CueO activity and cell viability on the supplemented copper concentration was previously described [12]. However, the viable CuSO4 concentration enabling efficient coniferyl alcohol dimerization was much lower in our study, presumably due to the different growth media. In contrast to the terrific broth medium used by Decembrino et al., who supplemented 5 mM CuSO4, the chemically defined medium used in this study does not contain copper-complexing agents such as amino acids or peptides. Thus, our process considerably reduces the required concentration of the environmentally harmful heavy-metal copper compared to existing processes. Nevertheless, the low copper concentration is sufficient for expression and activity. Copper ions exhibit positive effects on both expression and activity of CueO. On the one hand, the transcriptional regulator CueR activates cueO expression in the presence of copper ions. CueR shows zeptomolar sensitivity towards Cu+ ions and half-maximum induction of PcueO is achieved at CuSO4 concentration as low as 3 µM under aerobic conditions [15,27]. On the other hand, activity of CueO highly depends on supplemented copper. This was demonstrated for the plasmid-based expression of cueO controlled by copper-independent promoters. Activity increased concomitantly with copper concentration until saturation was reached, regardless of whether copper ions were supplemented during growth [17] or during the activity assay [28,29]. Therefore, the supplementation of copper presumably affects specific CueO activity more than cueO expression. Concerning substrate feeding, no lignan products were measured when substrate supplementation was delayed from IPTG and copper addition, indicating that the highest phenol coupling activity occurs directly after copper addition in this setup. This opposes earlier findings of Decembrino et al. [12] but might be a result of the different conditions. It might also suggest that coniferyl alcohol was (at least partially) consumed via oxidation catalyzed by extracellular copper ions and not CueO, which decreases when copper ions are taken up into the cells. Oxidation of coniferyl alcohol with CuSO4 was previously reported [12,30,31]. However, these studies showed that oxidation occurred slower when CuSO4 was used instead of a laccase [31] and resulted in decreased coniferyl alcohol conversion as well as less distinguishable products [12]. Thus, further investigation is required to determine the efficiency and activity of CueO in our process design.
For our microbial SILR production process with growing cells in a defined medium, the determined YP/S values ranged from 15 to 41 mg g−1. This corresponds to 10–30% of the theoretical maximum of approximately 140 mg g−1 [32]. Since PLR activity is presumed to be unchallenging, a more efficient coniferyl alcohol coupling system is required to achieve an industrially relevant microbial production process of lignans. This system should exhibit high coniferyl alcohol oxidation activity, increased substrate specificity for minimized oxidation of subsequent lignans, and increased product specificity to decrease byproduct formation. High oxidation activity might be achieved by recombinant plasmid-based expression of cueO with a strong copper-independent promoter [17] or the synthesis of another laccase with higher specific activity [33]. However, due to the high percentage of byproducts produced during radical coupling [32], an increased product specificity is required to improve the theoretical maximal yield coefficient based on the substrate. In plants, glycosylated dirigent proteins prevent excessive byproduct formation [7]. During in vitro dimerization of coniferyl alcohol with an isolated laccase, the addition of cyclodextrin was beneficial for the specific formation of pinoresinol and the prevention of overoxidation [34]. However, the improvement of (+)-pinoresinol formation in recombinant microbial whole-cell biotransformation remains a challenge for the future.

4. Materials and Methods

4.1. Strains, Plasmids, and Long-Term Storage

All experiments were performed with E. coli OverExpressTM C43(DE3) (Lucigen, Middleton, WI, USA) in combination with plasmid pCDFDuet_syfiPLR [11]. For long-term storage, the strain was stored as a glycerol stock at −80 °C.

4.2. Medium and Chemicals

Pre- and main cultures were cultivated in a modified Riesenberg medium (15.0 g L−1 glucose, 4.0 g L−1 (NH4)2HPO4, 13.3 g L−1 KH2PO4, 0.45 g L−1 MgSO4, 2 mL L−1 trace element solution, pH adjusted to 7.0). The used trace element solution contained 4.87 g L−1 FeSO4∙7 H2O, 4.12 g L−1 CaCl2∙2 H2O, 1.50 g L−1 MnCl2∙4 H2O, 1.87 g L−1 ZnSO4∙7 H2O, 0.30 g L−1 H3BO3, 0.25 g L−1 Na2MoO4∙2 H2O, 0.15 g L−1 CuCl2∙2 H2O, 0.84 g L−1 Na2EDTA∙2 H2O, and 82.81 mL L−1 37% HCl. Streptomycin (50 mg L−1) was added when needed. For STR cultivation, 0.01% (v/v) AF204 (Sigma Aldrich, St. Louis, MO, USA) was added to the medium prior to inoculation as an antifoam agent. AF204 was not added to shake-flask cultivation, if not stated otherwise.
Chemicals were purchased from Carl Roth (Karlsruhe, Germany), FlukaChemie (Buch, Germany), Merck (Darmstadt, Germany), Sigma-Aldrich (St. Louis, MO, USA), Thermo Fisher Scientific (Waltham, MA, USA), and AlfaAesar (Haverhill, MA, USA). Standards for quantification of coniferyl alcohol (Alfa Aesar, Haverhill, MA, USA), coniferyl aldehyde (Sigma Aldrich, St. Louis, MO, USA), pinoresinol (Carbosynth, Compton, U.K.), lariciresinol (Carbosynth), and SILR (Sigma Aldrich, St. Louis, MO, USA) were commercially acquired.

4.3. Fermentation Conditions

4.3.1. Batch Cultivation in Shake Flask

Single colonies were obtained by spreading the glycerol stock on an agar plate, followed by overnight incubation at 37 °C. For precultures, modified Riesenberg medium was inoculated with a single colony from plate and incubated overnight at 37 °C and 200 rpm. For main cultures in 250 mL baffled shake flasks, 50 mL of modified Riesenberg medium was inoculated to an OD600 of 0.1. Main cultures were cultivated at 37 °C and 180 rpm, until induction. At OD600 0.6, cells were induced with 0.75 mM IPTG and 0.5 g L−1 coniferyl alcohol was added. For experiments regarding CuSO4 concentration variation, 5, 10, 50, 100, or 500 µM CuSO4 was supplemented. To all other shake-flask cultivations, 50 µM CuSO4 was added. After induction, cultivation was continued at 30 °C and 180 rpm. All shake-flask cultivations were performed in duplicate and terminated 24 h after induction with IPTG.

4.3.2. Batch Cultivation in Stirred-Tank Reactor

A transfer to an STR was performed with the DASbox® Mini Bioreactor System (Eppendorf, Hamburg, Germany). A 6-blade Rushton turbine impeller was used for stirring. All STR cultures were stirred at 1000 rpm. First, two setups with different aeration rates and pH regulation strategies were compared. For Setup 1, cultures were aerated with 6 L h−1 compressed air (0.5 vvm) and no pH regulation was used. For Setup 2, 12 L h−1 (1 vvm) compressed air was used for aeration, and pH was regulated at 7.0 by the addition of 1 M NaOH/1 M HCl. The cultivations for comparison of Setups 1 and 2 were performed in duplicate. Secondly, different feeding strategies of coniferyl alcohol were tested. An aeration rate of 0.5 vvm compressed air and no pH regulation were set for these cultivations. Substrate-feeding experiments were carried out once.
For propagation of cells, a glycerol stock was spread on an agar plate to obtain single colonies after overnight incubation at 37 °C. Modified Riesenberg medium was inoculated with a single colony from plate and incubated at 37 °C and 180 rpm overnight to obtain precultures for inoculation of the bioreactors. For main cultures in DASbox® Mini Bioreactors, 200 mL of modified Riesenberg medium was inoculated to an OD600 of 0.1. Main cultures were cultivated at 37 °C until an OD600 of 0.6 was reached. At this point, cells were induced with 0.75 mM IPTG and 50 µM CuSO4 was added. After induction, the temperature was reduced to 30 °C for all STR experiments. For comparison of Setups 1 and 2, 0.5 g L−1 coniferyl alcohol was supplemented at OD600 0.6 as well. Regarding substrate feeding, four strategies for the addition of coniferyl alcohol were tested. As reference, 0.5 g L−1 coniferyl alcohol was supplemented at OD600 0.6 (F1). A linear (F2) and an exponential (F3) pulsed-feed scheme as well as the addition of the substrate during the stationary phase (F4) were compared to this reference. For F2, 25% (125 mg L−1) of the substrate was added at 1, 5, 9, and 13 h after induction. At the same time points, 1.25% (6.25 mg L−1), 5% (25 mg L−1), 18.75% (93.75 mg L−1), and 75% (375 mg L−1) of the substrate were added for F3, respectively. For F4, 0.5 g L−1 coniferyl alcohol was added at 13 h after induction. All cultivations were terminated 24 h after induction with IPTG.

4.3.3. Determination of Biomass Growth

Optical cell density was determined with a spectrophotometer (Libra S11 Visible Spectrophotometer, Biochrom, Cambridge, U.K.). X was calculated from OD600, assuming an OD600 of 1 equated to 0.312 gCDW L−1 [35]. For CuSO4 concentration variation experiments, final Xs were measured gravimetrically after desiccating 2 mL of culture broth in 2 mL reaction tubes (5 to 100 µM CuSO4) or on FT-4-303-185 filters (Sartorius, Göttingen, Germany, 500 µM CuSO4) at 70 °C for 72 h. The specific growth rate µ during the exponential growth phase was calculated from X at ~6 h (t1) and ~12 h (t2) of cultivation time, according to Equation (1).
µ = ln ( X 2 ) ln ( X 1 ) t 2 t 1

4.4. Analysis of Extra- and Intracellular Metabolites

4.4.1. Sampling

Over the course of cultivation, broth samples were taken for extra- and intracellular metabolite analysis. For CuSO4 concentration variation experiments, the broth samples were only taken at the end of cultivation. Samples for analysis of extracellular metabolites were centrifuged at 4 °C, 17,000× g for 15 min for removal of cells, and the supernatant was stored at −20 °C. For analysis of intracellular lignan metabolites, cell pellets of 1.12 mgCDW were collected by 30 s of centrifugation at 17,000× g. The supernatant was removed, and the cell pellets were frozen in liquid nitrogen and stored at −20 °C until extraction.

4.4.2. Extraction of Intracellular Metabolites

Intracellular metabolites were extracted from cells via hot-water cell disruption, as previously described [20]. Briefly, 100 µL of ultrapure water was added to the cell pellets. The suspension was incubated at 99 °C for a total of six minutes. After cooling on ice, the cell debris was removed by centrifugation. The metabolite extracts were analyzed by high-performance liquid chromatography coupled to a diode-array detector and a mass spectrometer (HPLC-DAD-MS).

4.4.3. Quantification of Carbon Sources

Glucose and acetate were quantified via HPLC with a refractive index (RI) detector, as previously described [20]. In brief, extracellular samples were filtered with 0.45 µm polyamide filters (Macherey-Nagel, Düren, Germany). Separation was performed with a Metab-AAC column (300 × 7.8 mm, 10 μm, Isera GmbH, Düren, Germany) and a mobile phase of 5 mM H2SO4 at an isocratic flow of 0.5 mL min−1. Concentrations of glucose and acetate were calculated using external calibration curves of 0–15 g L−1 glucose and 0–10 g L−1 acetate.

4.4.4. Quantification of Phenylpropanoid and Lignan Metabolites

Extra- and intracellular phenylpropanoid and lignan metabolites were analyzed and quantified via HPLC-DAD-MS using a 1260 Infinity II LC System coupled to a 6120 quadrupole (Agilent, Santa Clara, CA, USA), as previously described [20]. Extracellular samples were filtered with 0.45 µm polyamide filters (Macherey-Nagel, Düren, Germany) prior to analysis. A gradient of 0.1% (v/v) formic acid and methanol was used at a flow rate of 0.3 mL min−1 with an EC 100/2 Nucleoshell RP18 column (100 × 2 mm) with a particle size of 2.7 µm (Macherey-Nagel). Samples of cultures supplemented with 500 µM CuSO4 were analyzed with a 1260 Infinity II LC System (Agilent, Santa Clara, CA, USA) coupled to a compact QTOF (Bruker, Billerica, MA, USA), using the same column and gradient, but at a flow rate of 0.4 mL min−1. Identification of analytes was performed via mass spectrometry and comparison of retention time with commercial standards. Coniferyl alcohol, pinoresinol, lariciresinol, and SILR were quantified via UV absorption at 280 nm, whereas coniferyl aldehyde was quantified by means of absorption at 340 nm. External calibration curves of commercial standards were used to calculate metabolite titers.

4.5. Calculation of Intracellular Metabolite Concentration and Key Bioprocess Parameters

Intracellular metabolite titers (cintra) were calculated from the concentrations measured in samples of extracted cell pellets, considering the dilution of the intracellular volume with the volume of solvent used for cell disruption (Vsolvent). The intracellular volume was determined from the specific intracellular volume (SIV), X, at the time of sampling, and the sample volume of the cell suspension (Vsample) according to Equation (2). An SIV of 1.9 µL mgCDW−1 was assumed [36].
c intra = c HPLC   × (   V solvent + ( X   ×   V sample   ×   SIV ) X   ×   V sample   ×   SIV )
Based on the intracellular metabolite concentration, YP/X, YP/S, and STY were calculated for SILR production. To this end, the extracellular SILR titer (cextra) was estimated from the mean intracellular concentration, assuming a 10x increased concentration within cells compared to the extracellular medium [20]. According to Equation (3), the total SILR concentration (ctotal) was calculated from the sum of mass of SILR within and outside of cells (mtotal) and normalized to the reaction volume (VR):
c total = m total V R = c intra × SIV × X × V R V R + c extra × V R V R
The key bioprocess parameters YP/X, YP/S, and STY were calculated as the quotient of ctotal and X at the time of sampling, the initially supplied concentration of coniferyl alcohol, or the reaction time after induction, respectively.

5. Conclusions

To the best of our knowledge, our study reports on a microbial STR bioprocess for lignan production for the first time. Furthermore, it is the first study quantifying intracellular lignan metabolites under different process conditions and deriving key bioprocess parameters such as yield coefficients and STY for SILR, the final product of this study. Via targeted metabolomics, we were able to monitor the underlying dynamic of pathway activity and identify the dimerization of coniferyl alcohol as a bottleneck of our process. Although the achieved titers are still comparably low and not yet relevant from an industrial point of view, the process is robust and stable within the range of most tested medium and process parameters.

Supplementary Materials

The following supporting information can be downloaded at: https://www.mdpi.com/article/10.3390/catal12111473/s1, Figure S1: Influence of antifoam addition and oxygen availability on growth parameters in shake flasks; Figure S2: Effect of various STR process conditions on growth parameters; Figure S3: DO during testing of various STR process conditions; Figure S4: Growth parameters for comparison of substrate-feeding strategies during STR cultivation.

Author Contributions

Conceptualization, A.S., M.F., C.N., D.D., G.H., M.G., V.B.U. and S.L.; methodology, A.S., M.F., C.N. and G.H.; validation, A.S. and M.F.; formal analysis, A.S.; investigation, A.S. and M.F.; resources, C.N. and D.D.; data curation, A.S. and S.L.; writing—original draft preparation, A.S.; writing—review and editing, A.S., M.F., C.N., D.D., G.H., M.G., V.B.U. and S.L.; visualization, A.S.; supervision, G.H., M.G., V.B.U. and S.L.; project administration, M.G., V.B.U. and S.L.; funding acquisition, M.G., V.B.U. and S.L. All authors have read and agreed to the published version of the manuscript.

Funding

This research was funded by the Federal Ministry of Education and Research, Germany to TU Dortmund University (grant number 031B0362C) and Heinrich Heine University Düsseldorf (grant number 031B0362A) under the umbrella of the “Nationale Forschungsstrategie BioÖkonomie 2030” project “LignaSyn”.

Data Availability Statement

All processed data generated or analyzed during this study are included in this article and its supplementary information files. Raw chromatograms are available upon request.

Acknowledgments

The authors thank Michael Hillen for his support in the STR experiments.

Conflicts of Interest

The authors declare no conflict of interest. The funders had no role in the design of the study; in the collection, analyses, or interpretation of data; in the writing of the manuscript; or in the decision to publish the results.

References

  1. Satake, H.; Koyama, T.; Bahabadi, S.E.; Matsumoto, E.; Ono, E.; Murata, J. Essences in Metabolic Engineering of Lignan Biosynthesis. Metabolites 2015, 5, 270–290. [Google Scholar] [CrossRef] [PubMed] [Green Version]
  2. Imran, M.; Ahmad, N.; Anjum, F.M.; Khan, M.K.; Mushtaq, Z.; Nadeem, M.; Hussain, S. Potential Protective Properties of Flax Lignan Secoisolariciresinol Diglucoside. Nutr. J. 2015, 14, 1–7. [Google Scholar] [CrossRef] [PubMed] [Green Version]
  3. Mark, R.; Lyu, X.; Lee, J.J.L.; Parra-Saldívar, R.; Chen, W.N. Sustainable Production of Natural Phenolics for Functional Food Applications. J. Funct. Foods 2019, 57, 233–254. [Google Scholar] [CrossRef]
  4. Nadeem, M.; Palni, L.M.S.; Purohit, A.N.; Pandey, H.; Nandi, S.K. Propagation and Conservation of Podophyllum Hexandrum Royle: An Important Medicinal Herb. Biol. Conserv. 2000, 92, 121–129. [Google Scholar] [CrossRef]
  5. Zhou, Y.; Wu, S.; Bornscheuer, U.T. Recent Advances in (Chemo)Enzymatic Cascades for Upgrading Bio-Based Resources. Chem. Commun. 2021, 57, 10661–10674. [Google Scholar] [CrossRef]
  6. An, C.; Maloney, K.M. Designing for Sustainability with Biocatalytic and Chemoenzymatic Cascade Processes. Curr. Opin. Green Sustain. Chem. 2022, 34, 100591. [Google Scholar] [CrossRef]
  7. Pickel, B.; Schaller, A. Dirigent Proteins: Molecular Characteristics and Potential Biotechnological Applications. Appl. Microbiol. Biotechnol. 2013, 97, 8427–8438. [Google Scholar] [CrossRef]
  8. Dinkova-Kostova, A.T.; Gang, D.R.; Davin, L.B.; Bedgar, D.L.; Chu, A.; Lewis, N.G. (+)-Pinoresinol/(+)-Lariciresinol Reductase from Forsythia Intermedia: Protein Purification, CDNA Cloning, Heterologous Expression and Comparison to Isoflavone Reductase. J. Biol. Chem. 1996, 271, 29473–29482. [Google Scholar] [CrossRef] [Green Version]
  9. Decembrino, D.; Ricklefs, E.; Wohlgemuth, S.; Girhard, M.; Schullehner, K.; Jach, G.; Urlacher, V.B. Assembly of Plant Enzymes in E. Coli for the Production of the Valuable (−)-Podophyllotoxin Precursor (−)-Pluviatolide. ACS Synth. Biol. 2020, 9, 3091–3103. [Google Scholar] [CrossRef]
  10. Lewis, N.G.; Davin, L.B.; Munasinghe, V.R.N.; Roberts, A.D. The Lignan Handbook; CRC Press: Boca Raton, FL, USA, 2022; ISBN 9781315152523. [Google Scholar]
  11. Ricklefs, E.; Girhard, M.; Urlacher, V.B. Three-Steps in One-Pot: Whole-Cell Biocatalytic Synthesis of Enantiopure (+)- and (−)-Pinoresinol via Kinetic Resolution. Microb. Cell Fact. 2016, 15, 1–11. [Google Scholar] [CrossRef]
  12. Decembrino, D.; Girhard, M.; Urlacher, V.B. Use of Copper as a Trigger for the in Vivo Activity of E. Coli Laccase CueO: A Simple Tool for Biosynthetic Purposes. ChemBioChem 2021, 22, 1470–1479. [Google Scholar] [CrossRef] [PubMed]
  13. Kuo, H.J.; Wei, Z.Y.; Lu, P.C.; Huang, P.L.; Lee, K.T. Bioconversion of Pinoresinol into Matairesinol by Use of Recombinant Escherichia Coli. Appl. Environ. Microbiol. 2014, 80, 2687–2692. [Google Scholar] [CrossRef] [Green Version]
  14. Cuppett, J.D. Evaluation of Copper Speciation and Water Quality Factors That Affect Aqueous Copper Tasting Response. Chem. Senses 2006, 31, 689–697. [Google Scholar] [CrossRef] [PubMed] [Green Version]
  15. Outten, F.W.; Huffman, D.L.; Hale, J.A.; O’Halloran, T.V. The Independent Cue and Cus Systems Confer Copper Tolerance during Aerobic and Anaerobic Growth in Escherichia Coli. J. Biol. Chem. 2001, 276, 30670–30677. [Google Scholar] [CrossRef] [Green Version]
  16. Singh, G.; Bhalla, A.; Kaur, P.; Capalash, N.; Sharma, P. Laccase from Prokaryotes: A New Source for an Old Enzyme. Rev. Environ. Sci. Biotechnol. 2011, 10, 309–326. [Google Scholar] [CrossRef]
  17. Hiraishi, T.; Tachibana, K.; Asakura, N.; Abe, H. Enhanced Expression of a Recombinant Multicopper Oxidase, CueO, from Escherichia Coli and Its Laccase Activity towards Aromatic Substrates. Polym. Degrad. Stab. 2019, 164, 1–8. [Google Scholar] [CrossRef]
  18. Solioz, M. Copper and Bacteria; SpringerBriefs in Molecular Science; Springer International Publishing: Cham, Switzerland, 2018; ISBN 978-3-319-94438-8. [Google Scholar]
  19. Oldiges, M.; Lütz, S.; Pflug, S.; Schroer, K.; Stein, N.; Wiendahl, C. Metabolomics: Current State and Evolving Methodologies and Tools. Appl. Microbiol. Biotechnol. 2007, 76, 495–511. [Google Scholar] [CrossRef]
  20. Steinmann, A.; Schullehner, K.; Kohl, A.; Dickmeis, C.; Finger, M.; Hubmann, G.; Jach, G.; Commandeur, U.; Girhard, M.; Urlacher, V.B.; et al. A Targeted Metabolomics Method for Extra- and Intracellular Metabolite Quantification Covering the Complete Monolignol and Lignan Synthesis Pathway. Metab. Eng. Commun. 2022, 15, e00205. [Google Scholar] [CrossRef]
  21. Riesenberg, D.; Schulz, V.; Knorre, W.A.; Pohl, H.D.; Korz, D.; Sanders, E.A.; Roß, A.; Deckwer, W.D. High Cell Density Cultivation of Escherichia Coli at Controlled Specific Growth Rate. J. Biotechnol. 1991, 20, 17–27. [Google Scholar] [CrossRef]
  22. Zhang, J.; Greasham, R. Chemically Defined Media for Commercial Fermentations. Appl. Microbiol. Biotechnol. 1999, 51, 407–421. [Google Scholar] [CrossRef]
  23. Meyer, H.; Minas, W.; Schmidhalter, D. Industrial-Scale Fermentation. In Industrial Biotechnology; Wiley-VCH Verlag GmbH & Co. KGaA: Weinheim, Germany, 2016; pp. 1–53. [Google Scholar]
  24. Góralczyk-Bińkowska, A.; Jasińska, A.; Długoński, J. Characteristics and Use of Multicopper Oxidases Enzymes. Postępy Mikrobiol. Adv. Microbiol. 2019, 58, 7–18. [Google Scholar] [CrossRef] [Green Version]
  25. Vardar-Sukan, F. Foaming: Consequences, Prevention and Destruction. Biotechnol. Adv. 1998, 16, 913–948. [Google Scholar] [CrossRef]
  26. Phue, J.N.; Shiloach, J. Impact of Dissolved Oxygen Concentration on Acetate Accumulation and Physiology of E. Coli BL21, Evaluating Transcription Levels of Key Genes at Different Dissolved Oxygen Conditions. Metab. Eng. 2005, 7, 353–363. [Google Scholar] [CrossRef] [PubMed]
  27. Changela, A.; Chen, K.; Xue, Y.; Holschen, J.; Outten, C.E.; O’Halloran, T.V.; Mondragón, A. Molecular Basis of Metal-Ion Selectivity and Zeptomolar Sensitivity by CueR. Science 2003, 301, 1383–1387. [Google Scholar] [CrossRef] [PubMed] [Green Version]
  28. Stolle, P.; Hou, B.; Brüser, T. The Tat Substrate CueO Is Transported in an Incomplete Folding State. J. Biol. Chem. 2016, 291, 13520–13528. [Google Scholar] [CrossRef] [Green Version]
  29. Zeng, J.; Lin, X.; Zhang, J.; Li, X.; Wong, M.H. Oxidation of Polycyclic Aromatic Hydrocarbons by the Bacterial Laccase CueO from E. Coli. Appl. Microbiol. Biotechnol. 2011, 89, 1841–1849. [Google Scholar] [CrossRef]
  30. Lancefield, C.S.; Westwood, N.J. The Synthesis and Analysis of Advanced Lignin Model Polymers. Green Chem. 2015, 17, 4980–4990. [Google Scholar] [CrossRef] [Green Version]
  31. Freudenberg, K.; Harkin, J.M.; Reichert, M.; Fukuzumi, T. Die an Der Verholzung Beteiligten Enzyme. Die Dehydrierung Des Sinapinalkohols. Chem. Ber. 1958, 91, 581–590. [Google Scholar] [CrossRef]
  32. Halls, S.C.; Lewis, N.G. Secondary and Quaternary Structures of the (+)-Pinoresinol-Forming Dirigent Protein. Biochemistry 2002, 41, 9455–9461. [Google Scholar] [CrossRef]
  33. Ricklefs, E.; Girhard, M.; Koschorreck, K.; Smit, M.S.; Urlacher, V.B. Two-Step One-Pot Synthesis of Pinoresinol from Eugenol in an Enzymatic Cascade. ChemCatChem 2015, 7, 1857–1864. [Google Scholar] [CrossRef]
  34. Tarrago, L.; Modolo, C.; Yemloul, M.; Robert, V.; Rousselot-Pailley, P.; Tron, T. Controlling the Polymerization of Coniferyl Alcohol with Cyclodextrins. New J. Chem. 2018, 42, 11770–11775. [Google Scholar] [CrossRef] [Green Version]
  35. Rolf, J.; Julsing, M.K.; Rosenthal, K.; Lütz, S. A Gram-Scale Limonene Production Process with Engineered Escherichia Coli. Molecules 2020, 25, 1881. [Google Scholar] [CrossRef] [PubMed] [Green Version]
  36. Wang, L.; Zhou, Y.J.; Ji, D.; Zhao, Z.K. An Accurate Method for Estimation of the Intracellular Aqueous Volume of Escherichia Coli Cells. J. Microbiol. Methods 2013, 93, 73–76. [Google Scholar] [CrossRef] [PubMed]
Figure 1. Design of a stirred-tank reactor (STR) bioprocess for SILR production. Host cell E. coli C43(DE3) harboring plasmid pCDFDuet_syfiPLR [11] was used for the synthesis of the endogenous laccase copper efflux oxidase (CueO) and recombinant pinoresinol–lariciresinol reductase (PLR). CueO catalyzes the one-electron oxidation of coniferyl alcohol, which initiates the radical coupling of two oxidized coniferyl alcohol monomers, resulting in the formation of racemic (±)-pinoresinol and byproducts. (+)-Pinoresinol is enantioselectively converted by PLR first to (+)-lariciresinol and then to (−)-SILR. Biotransformation was performed in modified Riesenberg medium with 0.01% (v/v) antifoam 204 (AF204) during growth and stationary phase. Coniferyl alcohol as substrate, CuSO4 as inducer and cofactor for CueO, and IPTG for inducing plr expression were supplemented during the process. Biotransformations were stopped 24 h after induction.
Catalysts 12 01473 g001
Figure 2. Variation of CuSO4 concentration for optimization of SILR production. E. coli C43(DE3) pCDFDuet_syfiPLR was cultivated at 37 °C, 180 rpm, in modified Riesenberg medium. At OD600 0.6, 0.75 mM IPTG, 0.5 g L−1 coniferyl alcohol, and various CuSO4 concentrations were added. After induction, the cultivation temperature was reduced to 30 °C. Cultivations were stopped 24 h after induction. (A) Final biomass concentrations (X) and (B) titers of pinoresinol, lariciresinol, and SILR are displayed in dependency on the supplemented CuSO4 concentration. CDW: cell dry weight.
Catalysts 12 01473 g002
Figure 3. Influence of antifoam addition and oxygen availability on lignan production in shake flasks. E. coli C43(DE3) pCDFDuet_syfiPLR was cultivated in baffled (w/baffles) or unbaffled shake flasks (w/o baffles). For some shake-flask cultivations, 0.01% (v/v) AF204 (w/AF204) was added. Cells were grown at 37 °C, 180 rpm, in modified Riesenberg medium. At OD600 0.6, 0.75 mM IPTG was added for induction. Amounts of 50 µM CuSO4 and 0.5 g L−1 coniferyl alcohol were added at the same time (indicated by pointed-dashed line). After induction, the cultivation temperature was reduced to 30 °C. Cultivations were ended 24 h after induction.
Catalysts 12 01473 g003
Figure 4. Testing of various STR process conditions for the production of SILR. E. coli C43(DE3) pCDFDuet_syfiPLR was cultivated at 37 °C, 1000 rpm, in modified Riesenberg medium with 0.01% (v/v) AF204. At OD600 0.6, 0.75 mM IPTG, 0.5 g L−1 coniferyl alcohol, and 50 µM CuSO4 were added (indicated by pointed-dashed line). After induction, the cultivation temperature was reduced to 30 °C. Cultivations were ended 24 h after induction. Bioreactor cultivations were aerated with 6 L h−1 (0.5 volume gas per volume liquid per minute (vvm)) or 12 L h−1 (1 vvm) compressed air. The pH of cultivations was either not regulated or was maintained at pH 7.0.
Catalysts 12 01473 g004
Figure 5. Comparison of substrate-feeding strategies during STR cultivation. E. coli C43(DE3) pCDFDuet_syfiPLR was cultivated at 37 °C, 1000 rpm, in modified Riesenberg medium with 0.01% (v/v) AF204. At OD600 0.6, 0.75 mM IPTG and 50 µM CuSO4 were added (pointed-dashed or dashed lines). After induction, the cultivation temperature was reduced to 30 °C. For F1, 0.5 g L−1 coniferyl alcohol was added at the time of induction (pointed-dashed line). Regarding F2 and F3, the amount of substrate corresponding to a final concentration of 0.5 g L−1 coniferyl alcohol was split and supplemented at 1, 5, 9, and 13 h after induction (pointed lines). For F2, substrate was added in a linear pulsed feed of 25% (corresponding to 125 mg L−1) or for F3 in an exponential pulsed-feed profile with 1.25% (6.25 mg L−1), 5% (25 mg L−1), 18.75% (93.75 mg L−1), and 75% (375 mg L−1). For F4, 0.5 g L−1 coniferyl alcohol was added at 13 h after induction (pointed line). Cultivations were ended 24 h after induction.
Catalysts 12 01473 g005
Table 1. Literature reported resting-cell biotransformations with Escherichia coli (E. coli) forming secoisolariciresinol (SILR) as an intermediate or (by)product.
Protein SynthesisBiotransformation
E. coli Strain(s)MediumConditionsBufferConditionsSubstrateProductReference
C41(DE3)200 mL TB
OD600 0.6:
0.5 mM IPTG
3 mM CuSO4
30 °C
140 rpm
21 h
50 mM KPi buffer
10 + 10 mL
pH 7.5
0.1 mM IPTG
20 g L−1 glucose
70 gCWW L−1
Sequential coculture
24 h + 2/4/6 h
25 °C
140 rpm
Eugenol
1642 mg L−1
Enantiopure
(−)-pinoresinol
219 mg L−1
(24 + 2 h)
[11]
C41(DE3)50 mL TB
OD600 0.6:
0.5 mM IPTG
25 °C
120 rpm
48 h
50 mM KPi buffer
10 mL
pH 7.5
0.1 mM IPTG
5 mM CuSO4
500 mM glucose
70 gCWW L−1
Monoculture
20 h
25 °C
200 rpm
Coniferyl alcohol
900 mg L−1
(−)-Matairesinol
(n.d.)
[12]
BL21(DE3) + C41(DE3)50 mL TB
OD600 0.6:
0.5 mM IPTG
BL21(DE3):
5 mM CuSO4
BL21(DE3):
30 °C
140 rpm
21–22 h
C41(DE3):
25 °C
120 rpm
48 h
50 mM KPi buffer
5 + 5 mL
pH 7.5
0.1 mM IPTG
500 mM glucose
70 gCWW L−1
Coculture
20 h
25 °C
200 rpm
Coniferyl alcohol
900 mg L−1
(−)-Matairesinol
(n.q.)
[12]
BL21(DE3) +
C41(DE3)
50 mL TB
OD600 0.6:
0.5 mM IPTG
BL21(DE3):
5 mM CuSO4
BL21(DE3):
30 °C
140 rpm
21–22 h
C41(DE3):
25 °C
120 rpm
48 h
50 mM KPi buffer
10 + 10 mL
pH 7.5
0.1 mM IPTG
500 mM glucose
70 gCWW L−1
Sequential Coculture
20 h + 4 h
25 °C
200 rpm
Coniferyl alcohol
900 mg L−1
(−)-Matairesinol
89 mg L−1
[12]
C41(DE3)50 mL TB
OD600 0.6:
0.5 mM IPTG
25 °C
120 rpm
48 h
50 mM KPi buffer
500 µL
pH 7.5
0.1 mM IPTG
500 mM glucose
70 gCWW L−1
Monoculture
24 h
25 °C
1500 rpm
Pinoresinol
(77% ee (+))
72 mg L−1
(−)-SILR
(n.q.)
[9]
C41(DE3)50 mL TB
OD600 0.6:
0.5 mM IPTG
25 °C
120 rpm
48 h
50 mM KPi buffer
500 µL
pH 7.5
0.1 mM IPTG
500 mM glucose
70 gCWW L−1
Monoculture
25 °C
1500 rpm
Pinoresinol
(77% ee (+))
72 mg L−1
(−)-Matairesinol
(n.q.)
[9]
C41(DE3)50 mL TB
OD600 0.6:
0.5 mM IPTG
0.5 mM 5-Ala
0.1 mM FeSO4
25 °C
120 rpm
48 h
50 mM KPi buffer
500 µL
pH 7.5
0.1 mM IPTG
500 mM glucose
70 gCWW L−1
Monoculture
24 h
25 °C
1500 rpm
(+)-Pinoresinol
(≥96% ee)
72 mg L−1
(−)-Pluviatolide
(n.q.)
[9]
C41(DE3)50 mL TB
OD600 0.6:
0.5 mM IPTG
0.5 mM 5-Ala
0.1 mM FeSO4
25 °C
120 rpm
48 h
50 mM KPi buffer
10 mL
pH 7.5
0.1 mM IPTG
500 mM glucose
70 gCWW L−1
Monoculture
24 h
25 °C
180–250 rpm
(+)-Pinoresinol
180 mg L−1
(−)-Pluviatolide
137 mg L−1
(250 rpm)
[9]
M15100 mL LB
OD600 0.6:
0.01 mM IPTG
25 °C
130 rpm
9 h
20 mM Tris buffer
LB medium
pH 8.0
2 × 10⁹/1 × 1010 CFU
Monoculture
3 h
22 °C
vigorous shaking
(+)-Pinoresinol
18 mg L−1
(−)-Matairesinol
(n.q.)
[13]
TB: terrific broth; OD600: optical density at 600 nm; IPTG: isopropyl-β-d-thiogalactopyranoside; LB: lysogeny broth; CWW: cell wet weight; ee: enantiomeric excess; n.d.: not detected; n.q.: not quantified; 5-Ala: 5-aminolevulinic acid; CFU: colony forming unit; KPi: potassium phosphate.
Table 2. Key bioprocess parameters YP/X, YP/S, and STY for SILR synthesis. Parameters were calculated from mean values for the two accumulation peaks at 5 and 24 h after induction.
Cultivation SystemExperimentt
(h)
X
(gCDW L−1)
cintra
(mg L−1)
cextra
(mg L−1)
ctotal
(mg L−1)
YP/X
(mg gCDW−1)
YP/S
(mg g−1)
STY
(mg L−1 h−1)
Shake flaskw/baffles
w/o AF
50.9108.810.911.0112.422.12.2
244.5123.212.313.43.026.80.6
w/baffles
w/AF
50.8202.520.320.626.441.14.1
244.8134.013.414.63.029.30.6
w/o baffles
w/o AF
50.8118.611.912.015.724.12.4
241.7125.712.613.07.526.00.5
STRSetup 150.873.77.47.59.914.91.5
245.582.98.39.21.718.30.4
Setup 250.788.08.88.912.617.81.8
245.082.88.39.11.818.10.4
F150.7130.413.013.218.426.42.6
245.290.69.110.01.919.90.4
F251.2n.d.-----
245.4n.d.-----
F351.2n.d.-----
245.5n.d.-----
F451.2n.d.-----
245.4n.d.-----
t: time after induction; cintra: intracellular SILR titer; cextra: estimated extracellular SILR titer; ctotal: calculated total SILR titer; YP/X: yield coefficient based on biomass; YP/S: yield coefficient based on substrate; STY: space–time yield.
Publisher’s Note: MDPI stays neutral with regard to jurisdictional claims in published maps and institutional affiliations.

