Article

Applying Hydrogenation to Stabilize N-TiO2 and Enhance Its Visible Light Photocatalytic Activity

1
School of Physics and Electrical Engineering, Anyang Normal University, Anyang 455000, China
2
Institute of Materials Physics and Chemistry, College of Science, Nanjing Forestry University, Nanjing 210037, China
*
Author to whom correspondence should be addressed.
Catalysts 2022, 12(2), 178; https://doi.org/10.3390/catal12020178
Submission received: 31 December 2021 / Revised: 25 January 2022 / Accepted: 27 January 2022 / Published: 29 January 2022
(This article belongs to the Section Photocatalysis)

Abstract

:
Up to now, the explanation for the origin of enhanced photocatalytic activity of N doped TiO2 (N-TiO2) with H incorporation, which is observed in experiment, is still lacking. In our work, the effects of hydrogenation on the stability and electronic properties of N-TiO2 have been systematically investigated by first-principles calculations. Our results of the study on stability demonstrate that, both full and part hydrogenation could stabilize N-TiO2 by largely reducing the formation energy of N doping under Ti-rich conditions. Moreover, the calculated results on the electronic structure show that, for the completely hydrogenated N-TiO2, band gap becomes slightly larger, which is caused by the full passivation for unpaired electron from N atom. However, for the partially hydrogenated N-TiO2, due to the interaction between hydrogenated and unhydrogenated N atoms, its valence band maximum shifts to higher energy by 0.32 eV and the valence band states mix with the wide band-gap states, which results in a higher light absorption capacity and carrier separation. Our results not only explain the enhancement of visible light photocatalytic activity experimentally found in N-TiO2 specimen with H incorporation, but also indicate that, tuning the hydrogenation degree is a hopeful routine to improve the photocatalytic performance of N-TiO2.

1. Introduction

Due to the ever-growing energy crisis and environmental pollution problems, the development of clean, environmentally friendly and sustainable alternative energy sources is urgently required. Hydrogen is an ideal alternative energy source for traditional fossil fuels because of its high energy density and low greenhouse gas emission. Since the discovery of “Honda-Fujima” effect [1], photocatalytic water splitting has been considered as an optimal pathway for hydrogen production, which has received extensive attention for decades [2,3,4,5,6,7]. Efficient and stable photocatalysts plays a key role in improving the efficiency of photocatalytic water splitting. As an originator photocatalyst, anatase titanium dioxide (TiO2) has attracted a great interest for the application of hydrogen generation [8] and environmental cleanup [9]. Although it possesses strong photocatalytic activity, high physical and chemical stability, and nontoxicity [10], its energy conversion efficiency is extremely low, which is caused by its large band gap (Eg) (~3.2 eV) [11] and high electron-hole recombination rate. The large Eg makes its photo-responsive only to the ultraviolet light (about 5% of the total solar spectrum), great limiting the light utilization rate. Tremendous experimental and theoretical research has demonstrated that, ion doping is an effective way to raise the photocatalytic performance of TiO2 by lowering its Eg and/or reducing the recombination rate of photogenerated electron-hole pairs [12,13,14,15,16,17,18,19,20].
For an overall water-splitting photocatalyst, the desirable Eg is about 2.0 eV, and the band edges must straddle the redox potential levels of water [21]. The valence band maximum (VBM) potential of TiO2 is far below the water oxidation level, but its conduction band minimum (CBM) is slightly above the hydrogen reduction level [22]. Therefore, the ideal doping pattern is such that VBM is substantially elevated, while CBM remains at the original position. Doping nitrogen atoms to form N-TiO2 is such an effective approach [23,24] that, it could optimize the VBM of TiO2 and keep the CBM at the same position [25]. However, due to the high formation energy, the substitutional N doping level is extremely low, which limits the improvement of VBM [26]. The oxygen vacancies (Vo) induced by N doping can compensate for the high formation energy of N-TiO2. However, the Vo introduced in the bulk TiO2 is prone to become recombination centers for photogenerated electron-hole pairs, and the visible light photocatalytic activity of N-TiO2 does not improve with N doping concentration increase [24]. This is contrary to the introduced Vo by N doping on the surface of TiO2, which can achieve efficient co-catalyst-free photocatalytic activity under less extreme conditions [27]. Therefore, to obtain a higher efficiency, the VBM of bulk N-TiO2 should be further modified by some other methods.
It has found that, compared to pristine N-TiO2, the specimen with H incorporation has a better visible light (VL) photocatalytic performance [28]. The N-doping concentration can be increased from 2% to 4.4% when the N-doped TiO2 was prepared under NH3 atmosphere [29]. Earlier theoretical calculations proposed that, the enhancement of VL photocatalytic performance was attributed to the narrowed Eg after hydrogenation [28]. Later, another theoretical research suggested that, the hydrogenation did not reduce the Eg of N-TiO2, instead, it brought in some distortion of local structure near N atoms, which is accounted for the improvement of VL photocatalytic activity [30]. Moreover, some other theoretical results even stated that, the increase of VL photocatalytic efficiency was ascribed to the disappearance of band-gap states, because they found that hydrogenation made the Eg of N-TiO2 become larger [31,32]. This explanation must be untenable, because band-gap states serve as a springboard for the photoexcitation of electrons in N-TiO2 [25], without which, the use ratio of visible light is greatly reduced. To sum up the above, the origin of enhanced VL photocatalytic activity of N-TiO2 with H incorporation was still confusing.
In addition, during the experimental fabrication of N-TiO2 with H incorporation, normally, due to the complex preparation conditions [29], the N atoms may be hardly completely hydrogenated, so there is often a coexistence of hydrogenated and unhydrogenated N atoms (marked as Nh and Nu for short, respectively). Although, to date, there have been massive configurations for N-TiO2 with H incorporation studied by density functional theory (DFT) calculations, such as substitutional NH for O, interstitial NH, and Hn(1~4) occupying Ti or interstitial sites with N doping, etc. [28,30,31,32,33]. The study on partially hydrogenated N-TiO2, which contains Nh and Nu, is still absent. Hence the effect of Nu-Nh interaction on its stability and photocatalytic performance is unclear yet.
In this work, to explore the enhancement of N-TiO2 photocatalytic activity caused by hydrogenation, we built completely and partially hydrogenated N-TiO2 models, and studied their morphology, formation energy, electronic structures, and optical properties. Based on the results above, the influence of hydrogenation on the VL photocatalytic activity of N-TiO2 was further discussed.

2. Calculation Method

The atomic models were built with the DeviceStudio software [34], which also could provide a number of functions for performing visualization, modeling and simulation. The calculations were performed using the ultrasoft pseudopotentials with generalized gradient approximation of the Perdew-Wang 91 as implemented in the CASTEP code [35]. Considering that there is one unpaired electron in pristine and partially hydrogenated N-TiO2, spin-polarized DFT was employed to study the electronic structures of these systems. Though the Eg calculated with our method normally is smaller than the experimental value, our results still could reflect the relative changes of electronic structures among these samples considered in our study. More information for this could be found in the Supplementary Materials. The Monkhorst-Pack k-point sampling [36] for Brillouin zone integration was generated with a 3 × 7 × 3 grid, and the cutoff energy for the plane wave expansion was 340 eV. The valence atomic configurations were used as 1s1 for H, 2s22p3 for N, 2s22p4 for O, and 3s23p63d24s2 for Ti. The imaginary parts of dielectric functions and optical absorption were calculated with ‘scissors operator’. Considering that the formation energies, electronic structures, and optical properties are almost independent of the size of the supercells, and the finite-size effects could be ignored [37]. In order to compare with the previous study of the N doping case [25], we also employed the 2 × 1 × 1 TiO2 supercell, containing 16 O atoms and 8 Ti atoms, to construct the calculated models. The completely hydrogenated N-TiO2 (symbolized as sample I for short) model was realized by replacing one O atom with an N atom, where H atom was bonded to the N atom and perpendicular to the Ti–O–Ti plane. Similar substitutions were used to build the partially hydrogenated N-TiO2 (symbolized as sample II for short) configuration, in which two O sites were separately occupied by a Nu and Nh atom.

3. Results and Discussion

3.1. Crystal Structure and Formation Energy

After optimization, the stable configurations for sample I and sample II were plotted in Figure 1, and their lattice parameters remain almost unchanged compared to N-TiO2 (as listed in Table S1). However, there occur some slight changes for the local structure adjacent to Nh. For instance, the Nh dose not situate in its three-nearest-Ti plane, instead, it moves into the tetrahedral body, which is made of the bonded hydrogen and the three-nearest-Ti. In sample I, the N–H bond length was 1.034 Å. In sample II, it shortens to 1.031 Å, suggesting an enhanced covalent bond between the N ion and the H proton. These N–H bond lengths are comparable to that in an NH3 molecule (1.05 Å) [30].
To examine the influence of hydrogenation on the stability of these doped systems, we calculate the formation energies Eform according to the Equation (1) below [32]:
Eform = Edoped − (Epure + N + μHO)
in which Edoped and Epure are the total energy of the TiO2 supercell with and without dopant, respectively. The symbol n represents the number of O atoms substituted by N dopants in a supercell, and μO, μN, and μH refer to the chemical potentials of O, N and H, respectively. The formation energy depends on the chemical potentials of the host and dopant atoms. The value of chemical potential μO is determined by growth conditions, which is varied from O-rich condition to Ti-rich condition. Under O-rich conditions, μO is obtained from the energy of the ground-state of the O2 molecule (μO = ½ μO2). And under Ti-rich conditions, μO is calculated from the formula μTi + 2μO = μ(TiO2), where μTi equals to the energy of one Ti atom in Ti bulk. For dopants, μN and μH are determined by the energy of the ground-states, namely N2 and H2 molecules, (μN = ½ μN2, μH = ½ μH2) respectively. The calculated formation energies for N-TiO2, sample I, and sample II are listed in Table 1, which reveals that, in Ti-rich condition, which is more energetically favorable to form doped systems than O-rich condition, the hydrogenated N-TiO2 has much lower formation energy than the pristine N-TiO2, implying that a higher substitutional N doping concentration may be achieved with H incorporation during the experimental fabrication process. Additionally, as displayed in Figure S1, we also considered the configurations with H bonded to O (H–O) and H bonded to Ti (H–Ti). As listed in Table 1 and Table S2, the calculated formation energies for the H–O model and the H–Ti model separately are 0.506 eV and 0.654 eV higher than that of sample I, which indicates that the configuration of sample I is the most energetically stable. In other words, during the hydrogenation process, the H atom prefers to bind to the doped N atom instead of O and Ti atoms. Therefore, our work chooses the configurations with H bonded to N.

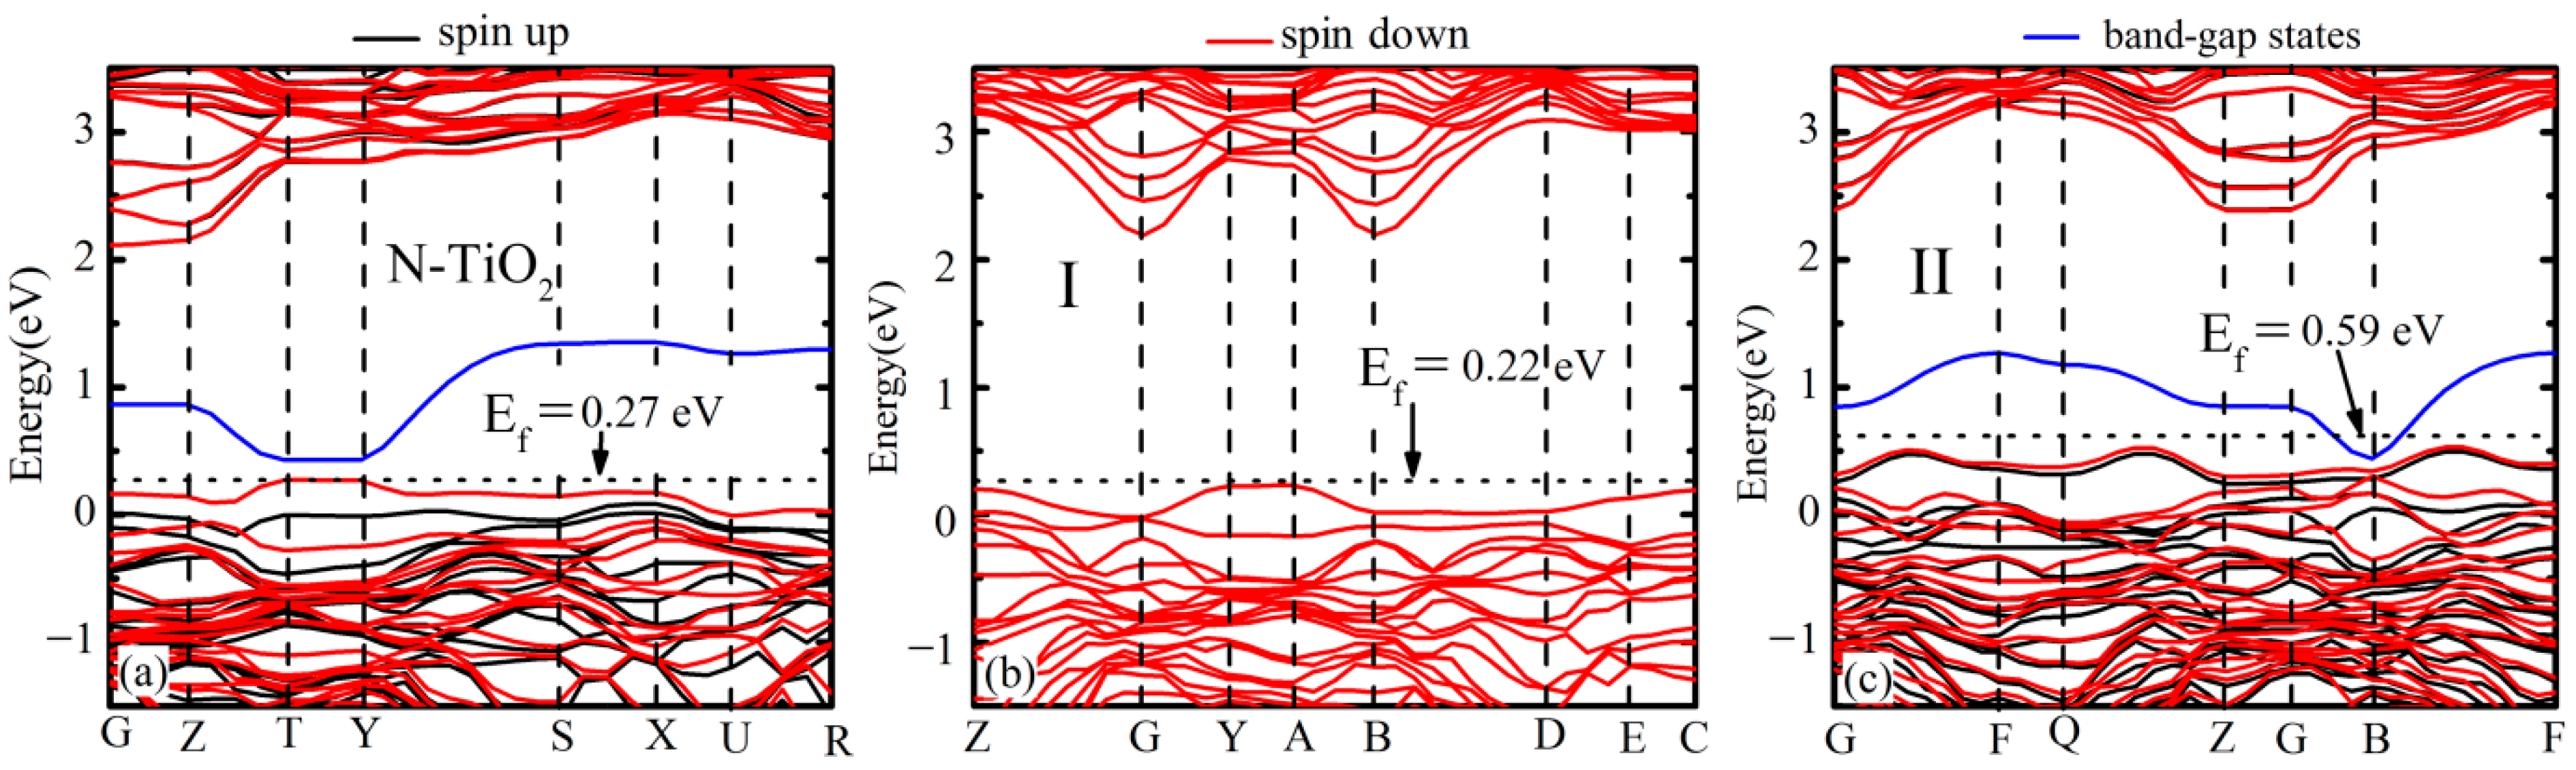
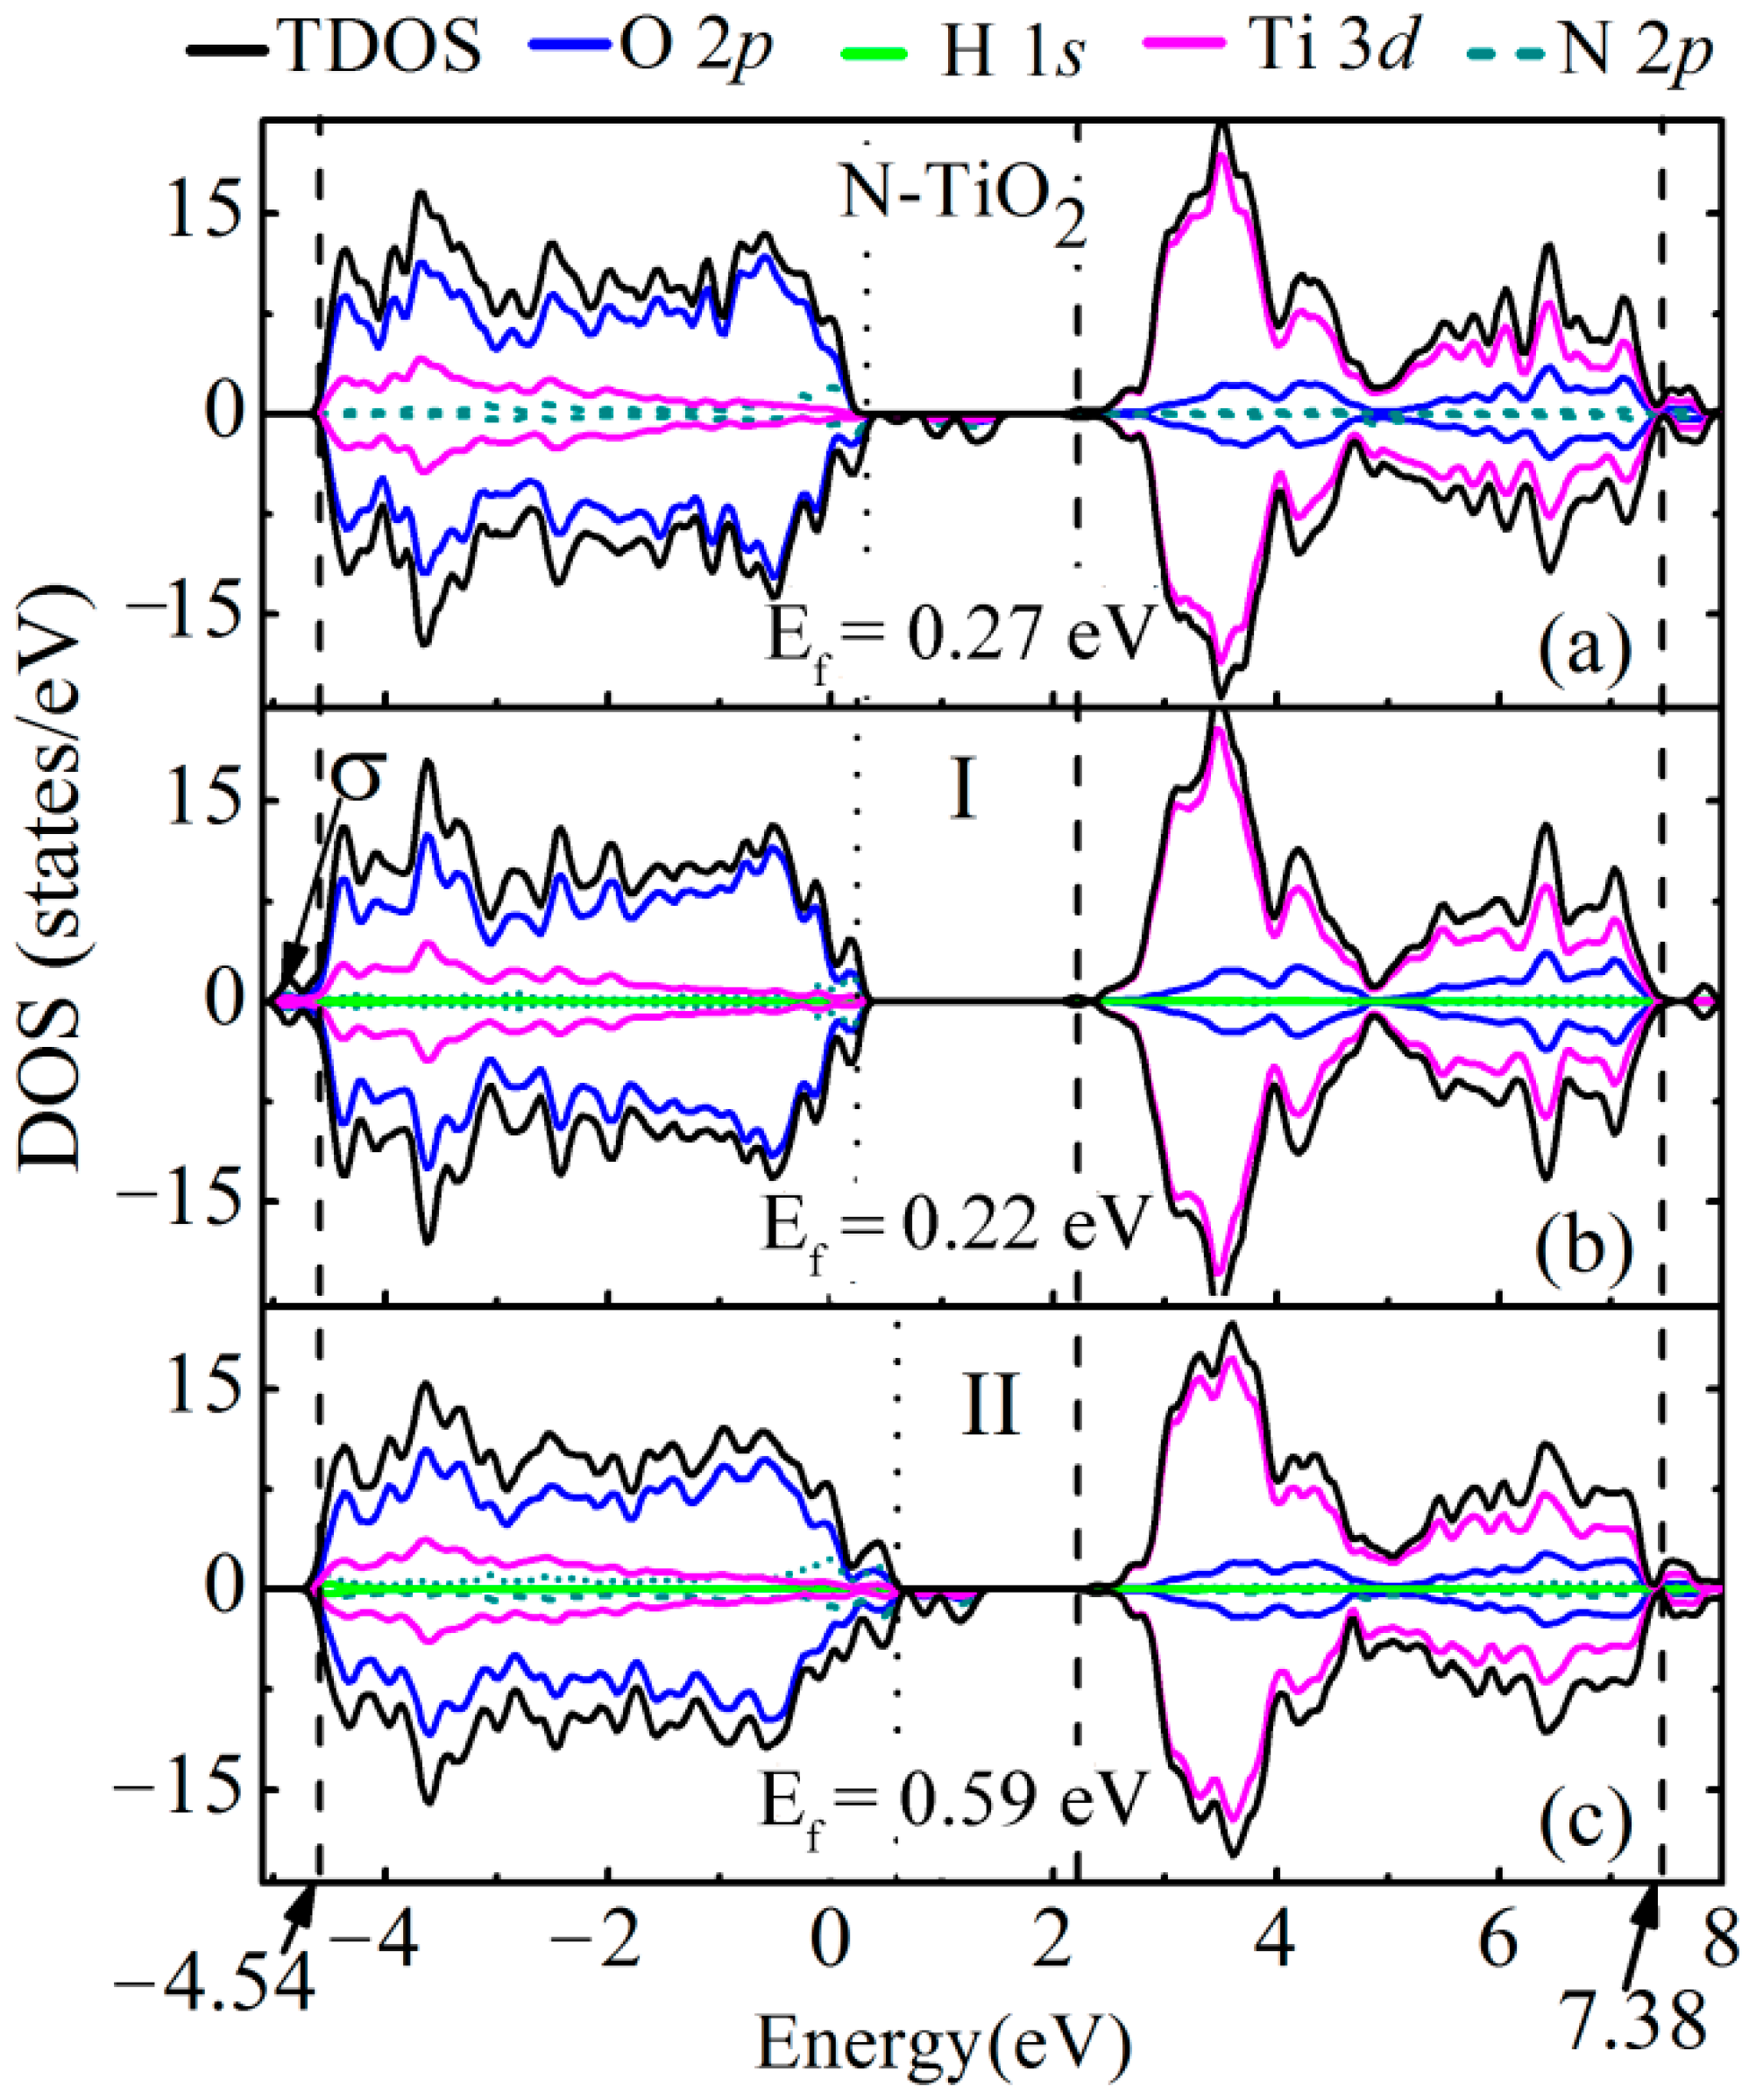
3.2. Electronic Band Structure and Density of States

As well known to all, the band-gap states, introduced by doping heteroatoms, has an essential impact on electronic properties of base materials, then tunes their photocatalytic behaviors. The shallow band-gap state levels, namely the ones close to the valence band (VB) edge (shallow acceptor level) or conduction band (CB) edge (shallow donor level), are able to facilitate the separation of photoexcited electron-hole pairs because they can capture photoexcited carriers [38,39]. For instance, the shallow acceptor level tends to ensnare photoexcited electrons, which could prevent the electrons from recombining with photogenerated holes, prolonging the life time of photogenerated holes, then accelerating the speed of photooxidation reaction. In addition, the band structure of catalysts plays an important role in extending the lifetime of photogenerated electron-hole pairs. For example, the flatter band leads to heavier carrier effective mass, since the effective mass is inversely proportional to the second derivative of the band energy with respect to momentum. The indirect energy band gap results in indirect transitions, which generally increase the electron-hole lifetime relative to direct transitions [40].
After optimizing the crystalline structures, we calculated their band structures (see Figure 2), total density of states (TDOS) and partial density of states (PDOS) (see Figure 3). As shown in Figure 3 and Figure S3, relative to TiO2, for each system, the CBM remains almost at the same position, whereas the VBM greatly shifts to a higher energy level, which satisfies the requirement of ideal doping pattern for TiO2 mentioned before. Moreover, as shown in Figure 2b, in sample I, no acceptor state emerges in the band gap, and the VBM shifts to higher energy by 0.22 eV, which is somewhat smaller than that in N-TiO2 (0.27 eV, as shown in Figure 2a). Hence, the complete hydrogenation makes the Eg of N-TiO2 slightly larger, which is consistent with most recent reports [31,32]. In addition, the H 1s states extend N 2p along with O 2p and Ti 3d states from −4.54 eV to the lower energy zone (see Figure 3b), which mainly corresponds to the σ bonding states. These results indicate that H implantation forms a strong chemical bond with N, which affects not only the electronic states of N but also some electronic states of Ti and O atoms neighboring to the N atoms.
For sample II (see Figure 2c and Figure 3c), the band-gap states retain the spreading characteristics, which are composed of Nu 2p, O 2p and Ti 3d states and originated from spin-down accepter states. This is very similar to the case in N-TiO2 (see Figure 3a). However, the VBM remarkably move to a higher energy by 0.59 eV, and the intensity of DOS near VB edge is significantly greater than that in the N-TiO2 system (see Figure 3a,c). Accordingly, compared to N-TiO2, the distance between VBM and band-gap states is pulled in, resulting in a great reduction of Eg, and these band-gap states become shallower acceptor states. The significantly narrowed Eg and the shallower acceptor states can increase the light response range, which were supported by experimental observation [29]. Furthermore, the shallower acceptor states also could act as electron trapping centers, believably promoting photogenerated electron-hole separation in space [38,39]. In addition, the electron leap from VB to CB in each system is indirect (as shown in Figure 2 and Figure S2). However, the electrons jump from VB to the band-gap states of N-TiO2 is different from that of sample II. In N-TiO2, the VBM and the bottom of impurity band in band gap at the same point. While in sample II, the VBM is higher than the top valence bands at B point, and the electrons could leap directly from VB to the band-gap states at B point, and then the holes move from the B point to the VBM, realizing the separation of photogenerated electron-hole pairs. Accordingly, the diffusion length and reaction time of the electron and hole excited increase in sample II. Furthermore, the impurity band in the band gap of sample II has a higher dispersion compared to N-TiO2, because the impurity band of N-TiO2 exhibits a flattened shape in some high symmetry directions of the reciprocal space. Therefore, partially hydrogenated N doping can improve the VL photocatalytic activity of TiO2.
Based on the optimized structure of sample II, the N dopant atom is located within a tetrahedron composed of H and three near-neighboring Ti atoms, and we speculate that hydrogenation enhances the 2s-2p hybridization of N, which in turn forms stronger chemical bonds with the surrounding cations. To prove this speculation, the PDOS of N 2s and 2p for N-TiO2 and sample I were analyzed. Furthermore, since H bonding with N plays an important role in system stability, the PDOS of H 1s were examined in hydrogenated systems as well. As displayed in Figure 4a, the density of N 2p states in spin-up channel is different from that in spin-down channel for N-TiO2, and there are some empty band-gap states ranging from 0.43 to 1.35 eV. For sample I, the band-gap states disappear, and the spin-up PDOS spectra is the same as the spin-down spectra (see Figure 4b). The H 1s states occur around −4.54 eV and have a strong coupling with N 2p and 2s states to form the N–H bond. In comparison with the N-TiO2, the N 2s and 2p orbital hybridization was enhanced after H implantation.
To examine the effect of Nu and Nh interactions on the VB edge states in sample II, we analyzed the PDOS of 2p of Nu and Nh (see Figure 4c). In comparison with the states in sample I, the occupied Nh 2p states together with H 1s are holistically pushed to higher energy region. Their density peak near VB edge becomes lower, while the density peak near −4.54 eV becomes higher. On the other hand, compared to N-TiO2, the density peak of occupied Nu 2p states near 0 eV becomes lower, and some occupied Nu 2p states appear at the range from 0.27 eV to 0.59 eV. In general, the interaction between Nh and Nu in sample II, shifts the occupied N (Nh and Nu) 2p states to higher energy region, which makes the VBM dramatically shift to a higher energy position and deeply mix with the band-gap states.

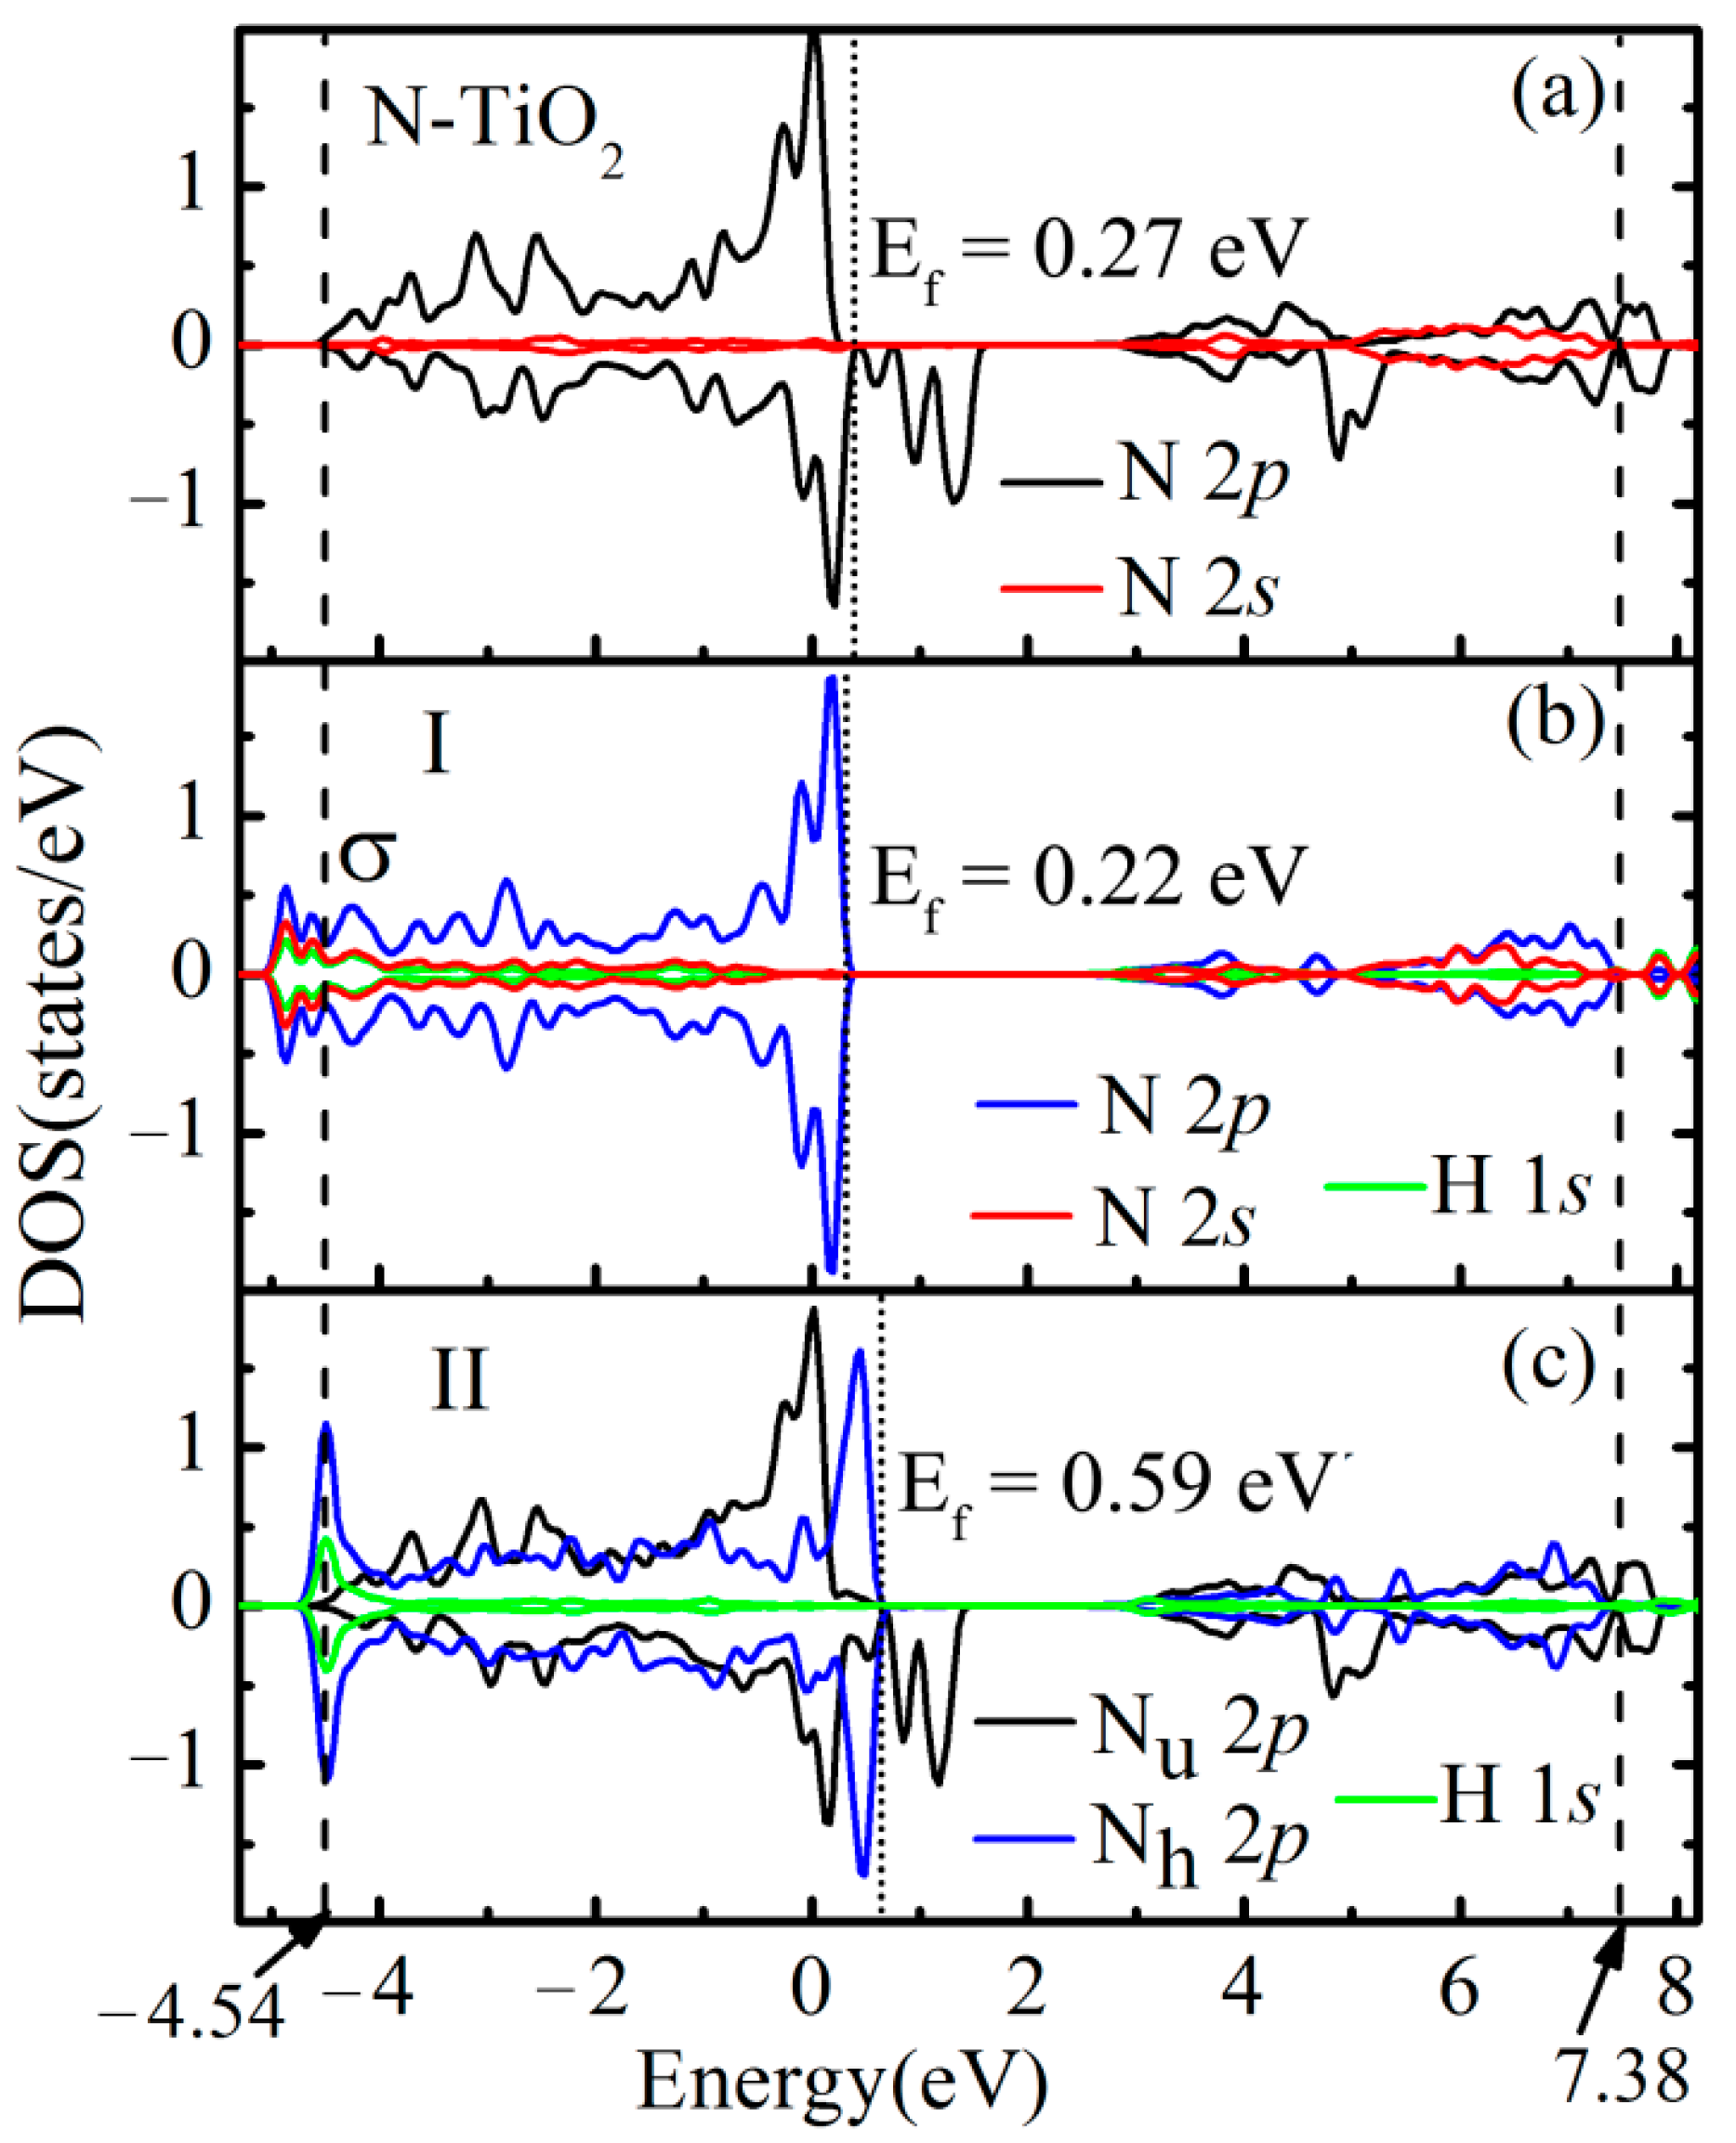
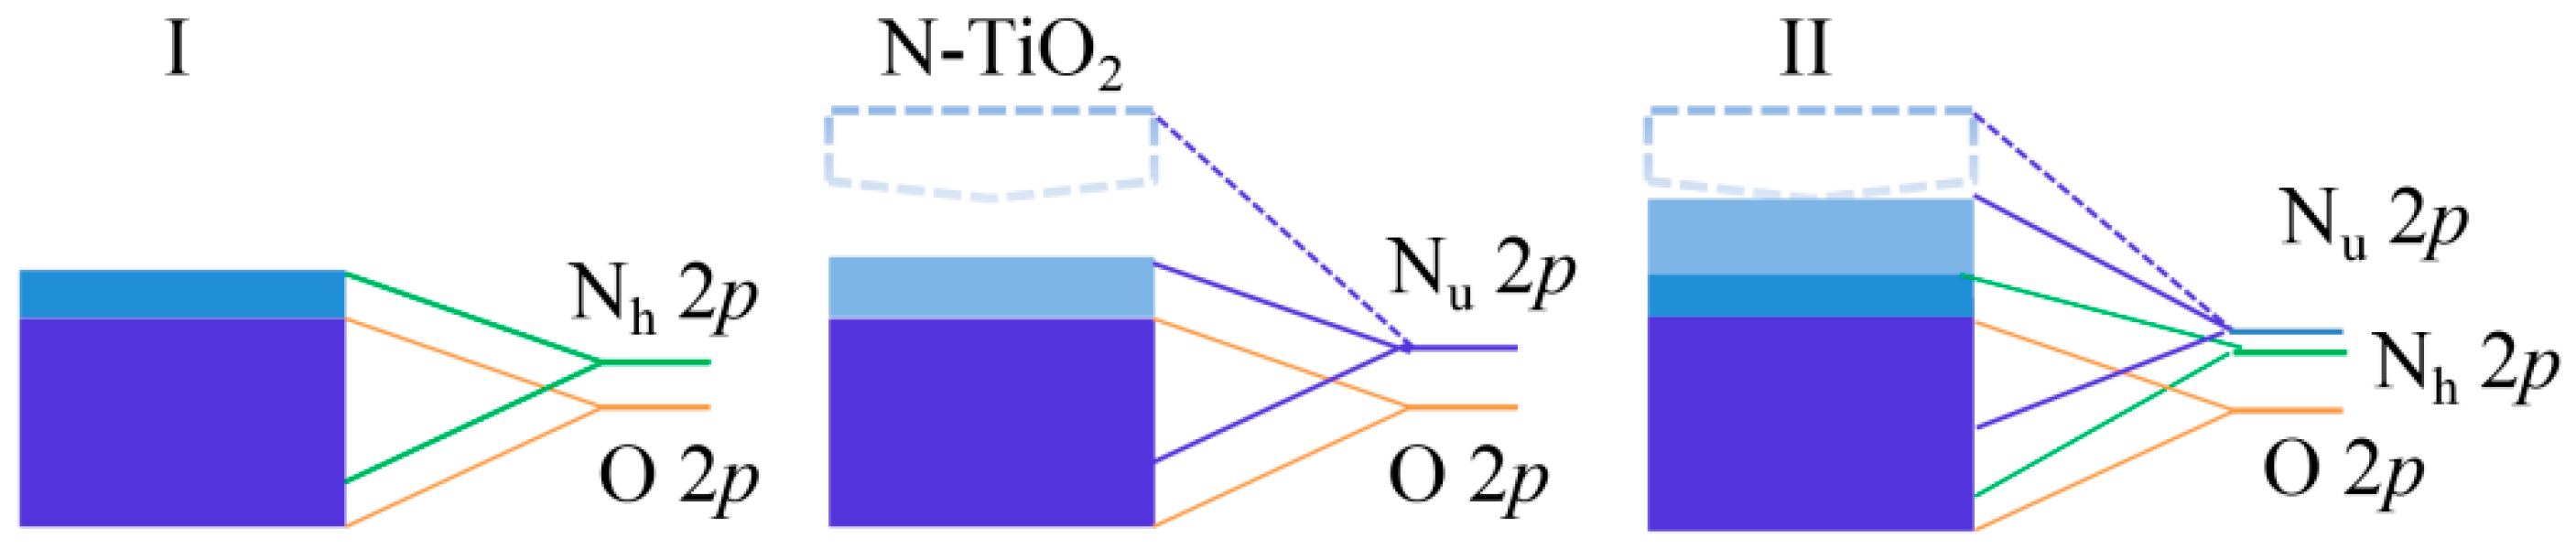
3.3. Orbital Analysis

To further investigate the effect of the hydrogenation on the carrier transmission property of N-TiO2, we examined the distributions of electronic states near the band edges via orbital analysis for sample I and II. The spin orbitals for the VBM and CBM of sample I are displayed in Figure 5a,b, respectively. It could be found that some VBM electron states localize at sites of N 2p orbitals, while the remainders disperse in regions of nonbonding O 2p orbitals. The distribution of the CBM is highly delocalized. These states are almost averagely distributed in the areas of nonbonding Ti 3d orbitals, where the nonbonding 3d orbitals of three Ti ions adjacent to N make a comparatively smaller contribution. For sample II, the interaction between the Nu and Nh slightly affects the distribution of electronic states near VB edges. As shown in Figure 5c, part VBM states assemble in the spaces of Nh 2p orbitals, while the other states distribute in the locations of Nu 2p and O 2p orbitals. The Nu 2p states have a less contribution to the VBM than Nh 2p states. As illustrated in Figure 5d, the orbitals related to band-gap states are mainly made of the 2p states of Nu atom, while the 2p states of O atom next to Nu also makes a tiny contribution to it. It is noted that the orbital distributions of band-gap states changes a little compared to that of N-TiO2 (see Figure 2 in [25]). The states for the CBM, as plotted in Figure 5e, are mainly diffused around the Ti atoms far from the Nh and Nu atoms, which is similar to the situation of sample I (see Figure 5b). Thus, we can conclude that the electron mobility in CBs is almost unaffected by the H incorporating, while the synergistic effects of Nu and Nh will optimize the hole transport by delocalizing the VB edge states.

3.4. Mulliken Population Analysis

Mulliken population analysis could help to further reveal the origin of the electronic structure changes of N-TiO2 induced by hydrogenation. The calculated data of all ions in N-TiO2, sample I, and sample II are listed in Table 2. In N-TiO2, the charges on N are −0.58 e, while the charges on the O ions in the O–Ti–N chain are varied from −0.68 e to −0.66 e. Among the three Ti atoms nearest to the doped N atom, two Ti have the net charge of +1.29 e, and the other one has the net charge of +1.31 e. After N bonded to H, the charges on N are noticeably increased to −0.86, and the H has the charges of +0.26 e in sample I. In addition, only the net charge number of some ions in the N–Ti–O chain changes slightly, e.g., from −0.67 e to −0.66 e for O atoms and from +1.33 e to +1.32 e for Ti atoms. In this system, the quantities of ions with unchanged net charge is five for Ti and nine for O, while there are four Ti ions and seven O ions whose net charges are unaffected in N-TiO2. Hence, the number of ions affected by the hydrogenated N decreases. Moreover, compared with the case of TiO2, the net charge of these affected ions in sample I does not change significantly (less than 0.01 e). In sample II, the net charges on H ions are still +0.26 e but the ones on Nh are reduced to −0.84, and the ones on Nu increase to −0.59 e. Additionally, there are only two Ti and two O ions with the unchanged net charges. Lots of O and Ti ions adjust their gain and loss of electrons, such as the charges on O are ranging from −0.65 to −0.68 and the ones on Ti are varied from +1.28 to +1.33. From these data, we learn that, the Nu and Nh can not only influence each other, but affect most of other ions through electron transfer.

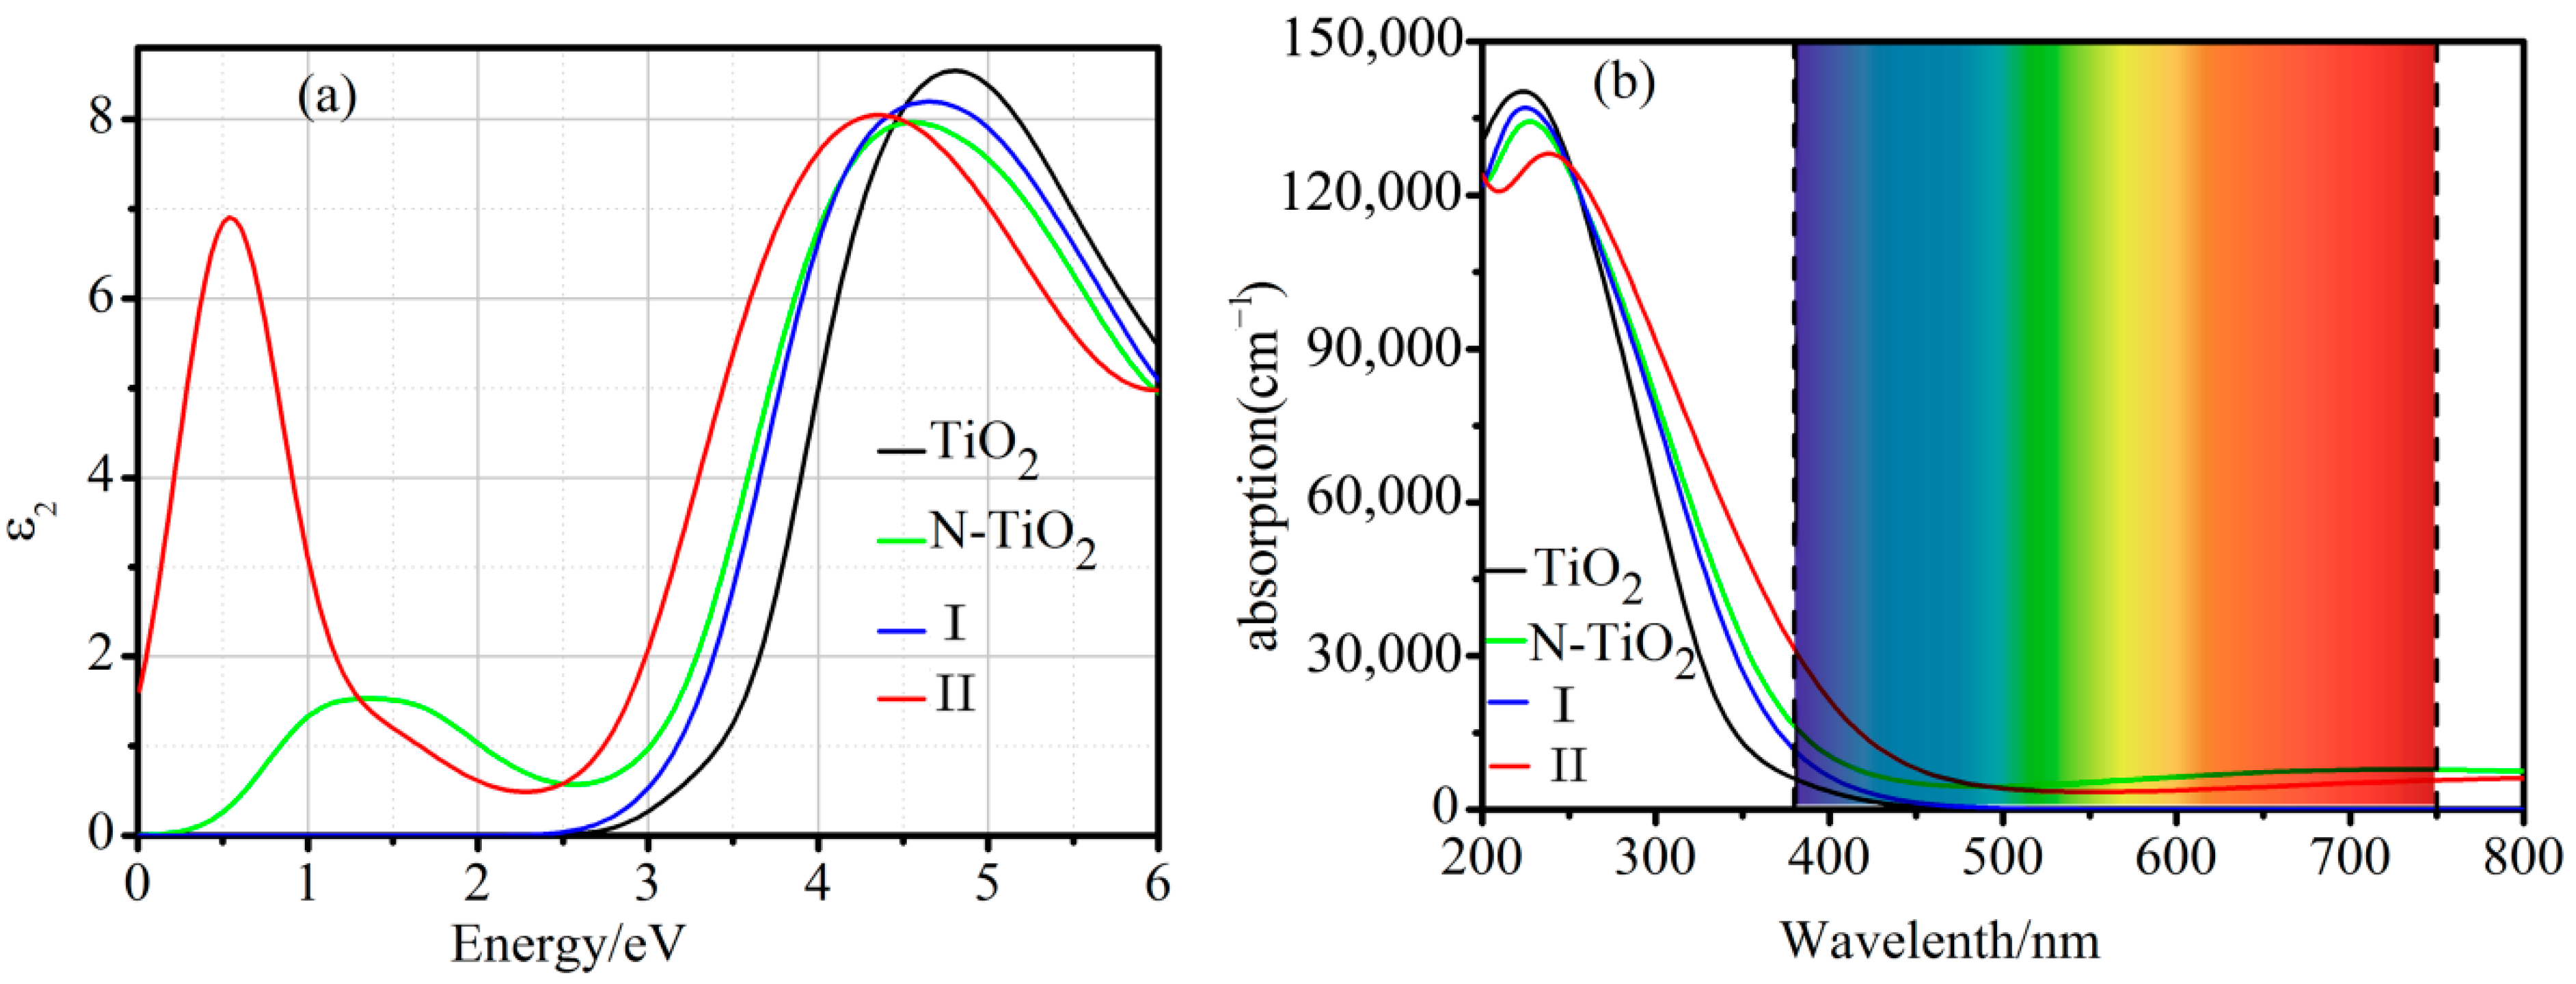
3.5. Optical Properties

As mentioned above, partially hydrogenation could narrow the band-gap of N-TiO2, hopefully improving its light absorption. To verify this speculation, here we explore the optical properties for all these three samples (N-TiO2, sample I, and sample II) by considering the imaginary part of the dielectric function (ε2) and absorption spectra. For a better comparison, we also considered the case of TiO2.
It is well known that, ε2 can directly reflect the probability that electrons absorb the energy of incident photons and then electrons jump from occupied states to unoccupied states [41]. According to Figure 6a, we can see that, for the N-TiO2, sample I, and sample II, the ε2 extend to low energy region with the order of sample I < N-TiO2 < sample II, consistent with the order of the variation of Eg for them. The maximum value of ε2 for sample II is slightly larger than that of ε2 for N-TiO2. Additionally, in TiO2 and sample I, there is only one intrinsic absorption peak originating from the electron transfer from VB to CB. For N-TiO2 and sample II, besides the intrinsic absorption peak, there is an extrinsic peak, which comes from the transition of electrons from VB to band-gap states. In N-TiO2, the extrinsic peak appears at about 1.35 eV, where the maximum value of the ε2 is 1.50. While the extrinsic peak occurs at about 0.55 eV, and the maximum value of the ε2 is 6.90 in sample II, due to the significantly elevated VBM and the larger intensity of DOS near VB edge. The significantly higher VBM scales down the energy required for the electron jump from the valence band to the band-gap states, resulting in the appearance of the extrinsic peak at a lower energy position. While the larger DOS intensity near the VB edge provides a relatively sufficient transition electrons from the VB to the band-gap states, leading to a higher maximum value of the ε2. This directly demonstrates that the band-gap state energy levels in sample II are shallower than that in N-TiO2, and due to the lower transition energy needed, the electrons jump from VB to band-gap states more easily, giving rise to a relatively higher photoexcited carrier concentration under solar irradiation. In addition, the shallower acceptor states not only serve as a bridge for electron transition from VB to CB, extending the photoresponse range, but also improve the electron-hole separation.
As displayed in Figure 6b, compared to TiO2, sample I shows a slight red shift in optical absorption edge, due to the tiny reduction of Eg. However, compared with N-TiO2, its light absorption range is reduced, ascribe to the completely hydrogenation which enlarges the Eg of N-TiO2. For sample II, the absorption edge extends to about 475 nm, showing a clear redshift of the optical absorption edge. Furthermore, for N-TiO2 and sample II, they all have absorption in the IR region due to electron transfer from VB to band-gap states (see Figure S4). However, sample II shows higher absorption intensity and wider absorption range in the IR region compared to N-TiO2. The change of optical absorption edge for all systems is consistent with the energy band diagrams in Figure 2, which is in agreement with the experimentally observed absorption edge shift of TiO2 films synthesized in different atmospheres [29]. By comparison, the partially hydrogenated N doping can not only extend the solar light absorption edge towards the VL area, but also greatly enhance the VL absorption. Therefore, partially hydrogenation is a promising approach to enhance the photocatalytic activity of N-TiO2 by improving the utilization ratio of solar energy.

3.6. Mechanism of Electronic Structure Change

The mechanism of electronic structure change in the hydrogenated N-TiO2 can be explained as follows. When the N is bonded to H, there are no unpaired electrons in sample I, and the band-gap states disappear. In this chemical environment, N 2s orbitals recombine with N 2p orbitals to generate new hybridized orbitals. The new hybridized orbitals are all easily overlapped with Ti 3d and H 1s orbitals to form stronger N–Ti and N–H bonds, which improve the σ bonding states (see Figure 4b). As a result, the local structures adjacent to N are distorted to some extent, and the stability of the sample I increases. The confinement of the stronger bond orbitals making the bonding electrons influence on the other ions weaker, the VBM is decreased compared to N-TiO2 (see Figure 7). Furthermore, the strong attraction between N core and H proton decreases the N–H bonding electronic energy level, and makes the N–H bonding states appear at lower energy region in VBs (see Figure 4b). In sample II, the overlap of Nu 2p orbitals with Nh 2p is larger than that of N 2p with O 2p in N-TiO2 under the same conditions, because 2p orbital of Nu and Nh have the similar energy levels (see Figure 7). Furthermore, the comparatively stronger delocalized unpaired electron enhances the interaction between Nu and Nh through the electron transferring among the ions, raising the energy levels of Nh 2p orbital (see Figure 7), as well as some O 2p and Ti 3d orbitals (see Figure 3c). Accordingly, the VBM is raised substantially and the intensity of the DOS near the VB edge becomes greater in comparation with that of N-TiO2.

3.7. Photocatalytic Property

In order to give a clear explanation for the effect of partially hydrogenation on the photocatalytic activity of N-TiO2, the schematic diagram of the mechanism of VL photocatalytic hydrogen generation from water splitting is provided in Figure 8. The synergistic effect of Nu and Nh significantly shifts up the energy of VBM, narrows the Eg, and delocalize the high energy electron states near VB edge, which have definitive influence on its VL absorption and photocatalytic performance. The remarkably lifted VBM mixing with the broadening band-gap states serves to promote the electron excitation from VB states to the band-gap states (see Figure 6a) and then to CB states by absorbing VL (see Figure 6b and Figure 8). Additionally, the delocalization of high energy electrons near VB edge with the wide band-gap states facilitates the separation of electron-hole pairs and increases the transport of photogenerated carriers to photocatalyst surface. The photogenerated electrons transferred to the surface reduce water to produce hydrogen, and the photogenerated holes transferred to the surface oxidize water to generate oxygen. Hence, the enhanced efficiency of carrier transition improve the VL photocatalytic activity of sample II. In this way, we can clearly understand the reasons why the N-TiO2 with H incorporation possesses higher VL photocatalytic activity than N-TiO2 [28].

4. Conclusions

In summary, completely and partially hydrogenated N-TiO2 are systematically investigated by the spin-polarized DFT calculations. The calculated results demonstrate that, with respect to N-TiO2, both the hydrogenated samples are energetically favorable under Ti-rich conditions. For completely hydrogenated N-TiO2, the band-gap states disappear and the Eg becomes a little larger (about 0.05 eV). As to the partially hydrogenated N-TiO2, the stronger interaction between Nh and Nu dramatically makes the VBM move to higher energy by 0.32 eV and increases the intensity of DOS near the VBM. The shift of VBM closes the distance between the band-gap states and VBM and forms the shallower acceptor states. The largely Eg reduction and the shallower acceptor states extend the light response range. Furthermore, the shallower acceptor states also serve to separate the photogenerated electron-hole pairs. Therefore, partially hydrogenation is able to further improve the VL photocatalytic activity of N-TiO2. Our findings provide a rational interpretation for the experimental observation of enhanced VL photocatalytic performance of N-TiO2 specimen with H incorporation, and suggest an avenue to improve catalytic activity for efficient photocatalytic water-splitting reaction.

Supplementary Materials

The following supporting information can be downloaded at: https://www.mdpi.com/article/10.3390/catal12020178/s1, Figure S1: The atomic structures of the H–O configurations; Figure S2: Band structure for TiO2; Figure S3: TDOS and PDOS for TiO2; Figure S4: The optical absorption for N-TiO2 and sample Ⅱ in visible light and IR region; Table S1: The calculated lattice parameters for N-TiO2; Table S2: Formation energies (Eform, in eV) for H–O and H–Ti configurations under various growth conditions.

Author Contributions

Data curation, D.Z.; Formal analysis, D.Z., X.T., D.Y. and L.J.; Funding acquisition, L.J.; Investigation, X.Q. and Z.T.; Project administration, L.J.; Software, Z.T.; Supervision, L.J.; Writing—original draft, D.Z., D.Y. and L.J. All authors have read and agreed to the published version of the manuscript.

Funding

This research was funded by National Natural Science foundation of China (Grants No. 11804006), the Henan Scientific Research Fund for Returned Scholars, Henan Key Program of Technology Research and Development (No. 202102210200), the Foundation for University Youth Key Teacher by the Henan Province (Grant No. 2019GGJS190), and the Research Incubation Fund of Anyang Normal University (No. AYNUKP-2017-A06).

Data Availability Statement

The data presented in this study are available in Supplementary Materials.

Acknowledgments

L.J. thanks Mingyan Chen (from HZWTECH) for help and discussions regarding this study.

Conflicts of Interest

The authors declare no conflict of interest.

References

  1. Fujishima, A.; Honda, K. Electrochemical Photolysis of Water at a Semiconductor Electrode. Nature 1972, 238, 37–38. [Google Scholar] [CrossRef] [PubMed]
  2. Takata, T.; Jiang, J.; Sakata, Y.; Nakabayashi, M.; Shibata, N.; Nandal, V.; Seki, K.; Hisatomi, T.; Domen, K. Photocatalytic water splitting with a quantum efficiency of almost unity. Nature 2020, 581, 411–414. [Google Scholar] [CrossRef] [PubMed]
  3. Ju, L.; Shang, J.; Tang, X.; Kou, L. Tunable Photocatalytic Water Splitting by the Ferroelectric Switch in a 2D AgBiP2Se6 Monolayer. J. Am. Chem. Soc. 2020, 142, 1492–1500. [Google Scholar] [CrossRef] [PubMed]
  4. Ju, L.; Qin, J.; Shi, L.; Yang, G.; Zhang, J.; Sun, L. Rolling the WSSe Bilayer into Double-Walled Nanotube for the Enhanced Photocatalytic Water-Splitting Performance. Nanomaterials 2021, 11, 705. [Google Scholar] [CrossRef]
  5. Cai, J.; Shen, J.; Zhang, X.; Ng, Y.H.; Huang, J.; Guo, W.; Lin, C.; Lai, Y. Light-Driven Sustainable Hydrogen Production Utilizing TiO2 Nanostructures: A Review. Small Methods 2019, 3, 1800184. [Google Scholar] [CrossRef] [Green Version]
  6. Ju, L.; Liu, P.; Yang, Y.; Shi, L.; Yang, G.; Sun, L. Tuning the photocatalytic water-splitting performance with the adjustment of diameter in an armchair WSSe nanotube. J. Energy Chem. 2021, 61, 228–235. [Google Scholar] [CrossRef]
  7. Singh, R.; Dutta, S. A review on H2 production through photocatalytic reactions using TiO2/TiO2-assisted catalysts. Fuel 2018, 220, 607–620. [Google Scholar] [CrossRef]
  8. Kumaravel, V.; Mathew, S.; Bartlett, J.; Pillai, S.C. Photocatalytic hydrogen production using metal doped TiO2: A review of recent advances. Appl. Catal. B Environ. 2019, 244, 1021–1064. [Google Scholar] [CrossRef]
  9. Suwannaruang, T.; Kidkhunthod, P.; Chanlek, N.; Soontaranon, S.; Wantala, K. High anatase purity of nitrogen-doped TiO2 nanorice particles for the photocatalytic treatment activity of pharmaceutical wastewater. Appl. Surf. Sci. 2019, 478, 1–14. [Google Scholar] [CrossRef]
  10. Zhang, J.; Zhou, P.; Liu, J.; Yu, J. New understanding of the difference of photocatalytic activity among anatase, rutile and brookite TiO2. Phys. Chem. Chem. Phys. 2014, 16, 20382–20386. [Google Scholar] [CrossRef]
  11. Khan, M.; Yi, Z.; Fawad, U.; Muhammad, W.; Niaz, A.; Zaman, M.I.; Ullah, A. Enhancing the photoactivity of TiO2 by codoping with silver and molybdenum: The effect of dopant concentration on the photoelectrochemical properties. Mater. Res. Express 2017, 4, 045023. [Google Scholar] [CrossRef]
  12. Chen, X.; Liu, L.; Yu, P.Y.; Mao Samuel, S. Increasing Solar Absorption for Photocatalysis with Black Hydrogenated Titanium Dioxide Nanocrystals. Science 2011, 331, 746–750. [Google Scholar] [CrossRef] [PubMed]
  13. Liu, B.; Zhao, X. The synergetic effect of V and Fe-co-doping in TiO2 studied from the DFT + U first-principle calculation. Appl. Surf. Sci. 2017, 399, 654–662. [Google Scholar] [CrossRef]
  14. Niu, M.; Zhang, J.; Cao, D. I, N-Codoping Modification of TiO2 for Enhanced Photoelectrochemical H2O Splitting in Visible-Light Region. J. Phys. Chem. C 2017, 121, 26202–26208. [Google Scholar] [CrossRef]
  15. Wang, D.; Zheng, Y.; Tian, J.; Jing, T.; Kan, W.; Hu, Y. Theoretical calculation and experiment study on the electronic structure, microstructures and photocatalytic activity of N–Al codoped TiO2. RSC Adv. 2017, 7, 52105–52110. [Google Scholar] [CrossRef] [Green Version]
  16. Zhao, Y.; Wang, W.; Li, C.; He, L. Electronic and photocatalytic properties of N/F co-doped anatase TiO2. RSC Adv. 2017, 7, 55282–55287. [Google Scholar] [CrossRef] [Green Version]
  17. Zhao, W.; Liu, S.; Zhang, S.; Wang, R.; Wang, K. Preparation and visible-light photocatalytic activity of N-doped TiO2 by plasma-assisted sol-gel method. Catal. Today 2019, 337, 37–43. [Google Scholar] [CrossRef]
  18. Avilés-García, O.; Espino-Valencia, J.; Romero-Romero, R.; Rico-Cerda, J.L.; Arroyo-Albiter, M.; Solís-Casados, D.A.; Natividad-Rangel, R. Enhanced Photocatalytic Activity of Titania by Co-Doping with Mo and W. Catalysts 2018, 8, 631. [Google Scholar] [CrossRef] [Green Version]
  19. Piątkowska, A.; Janus, M.; Szymański, K.; Mozia, S. C-,N- and S-Doped TiO2 Photocatalysts: A Review. Catalysts 2021, 11, 144. [Google Scholar] [CrossRef]
  20. Assadi, M.H.N.; Hanaor, D.A. The effects of copper doping on photocatalytic activity at (101) planes of anatase TiO2: A theoretical study. Appl. Surf. Sci. 2016, 387, 682–689. [Google Scholar] [CrossRef] [Green Version]
  21. Khaselev, O.; Turner John, A. A Monolithic Photovoltaic-Photoelectrochemical Device for Hydrogen Production via Water Splitting. Science 1998, 280, 425–427. [Google Scholar] [CrossRef] [PubMed]
  22. Gai, Y.; Li, J.; Li, S.-S.; Xia, J.-B.; Wei, S.-H. Design of Narrow-Gap TiO2: A Passivated Codoping Approach for Enhanced Photoelectrochemical Activity. Phys. Rev. Lett. 2009, 102, 036402. [Google Scholar] [CrossRef] [PubMed]
  23. Asahi, R.; Morikawa, T.; Ohwaki, T.; Aoki, K.; Taga, Y. Visible-Light Photocatalysis in Nitrogen-Doped Titanium Oxides. Science 2001, 293, 269–271. [Google Scholar] [CrossRef] [PubMed]
  24. Irie, H.; Watanabe, Y.; Hashimoto, K. Nitrogen-Concentration Dependence on Photocatalytic Activity of TiO2-xNx Powders. J. Phys. Chem. B 2003, 107, 5483–5486. [Google Scholar] [CrossRef]
  25. Zhao, D.; Huang, X.; Tian, B.; Zhou, S.; Li, Y.; Du, Z. The effect of electronegative difference on the electronic structure and visible light photocatalytic activity of N-doped anatase TiO2 by first-principles calculations. Appl. Phys. Lett. 2011, 98, 162107. [Google Scholar] [CrossRef]
  26. Yang, K.; Dai, Y.; Huang, B. Study of the Nitrogen Concentration Influence on N-Doped TiO2 Anatase from First-Principles Calculations. J. Phys. Chem. C 2007, 111, 12086–12090. [Google Scholar] [CrossRef]
  27. Esmat, M.; El-Hosainy, H.; Tahawy, R.; Jevasuwan, W.; Tsunoji, N.; Fukata, N.; Ide, Y. Nitrogen doping-mediated oxygen vacancies enhancing co-catalyst-free solar photocatalytic H2 production activity in anatase TiO2 nanosheet assembly. Appl. Catal. B Environ. 2021, 285, 119755. [Google Scholar] [CrossRef]
  28. Mi, L.; Xu, P.; Shen, H.; Wang, P.-N.; Shen, W. First-principles calculation of N:H codoping effect on energy gap narrowing of TiO2. Appl. Phys. Lett. 2007, 90, 171909. [Google Scholar] [CrossRef]
  29. Xu, P.; Mi, L.; Wang, P.-N. Improved optical response for N-doped anatase TiO2 films prepared by pulsed laser deposition in N2/NH3/O2 mixture. J. Cryst. Growth 2006, 289, 433–439. [Google Scholar] [CrossRef]
  30. Mi, L.; Zhang, Y.; Wang, P.-N. First-principles study of the hydrogen doping influence on the geometric and electronic structures of N-doped TiO2. Chem. Phys. Lett. 2008, 458, 341–345. [Google Scholar] [CrossRef]
  31. Pan, H.; Zhang, Y.-W.; Shenoy, V.B.; Gao, H. Effects of H-, N-, and (H, N)-Doping on the Photocatalytic Activity of TiO2. J. Phys. Chem. C 2011, 115, 12224–12231. [Google Scholar] [CrossRef]
  32. Li, M.; Zhang, J.; Guo, D.; Zhang, Y. Band gap engineering of compensated (N, H) and (C, 2H) codoped anatase TiO2: A first-principles calculation. Chem. Phys. Lett. 2012, 539–540, 175–179. [Google Scholar] [CrossRef]
  33. Russo, S.P.; Grey, I.E.; Wilson, N.C. Nitrogen/Hydrogen Codoping of Anatase: A DFT Study. J. Phys. Chem. C 2008, 112, 7653–7664. [Google Scholar] [CrossRef]
  34. Hongzhiwei Technology, D.S. Version 2021A, China. Available online: https://iresearch.net.cn/cloudSoftware (accessed on 1 November 2021).
  35. Segall, M.D.; Lindan, P.J.D.; Probert, M.; Pickard, C.J.; Hasnip, P.; Clark, S.; Payne, M.C. First-principles simulation: Ideas, illustrations and the CASTEP code. J. Phys. Condens. Matter 2002, 14, 2717–2744. [Google Scholar] [CrossRef]
  36. Monkhorst, H.J.; Pack, J.D. Special points for Brillouin-zone integrations. Phys. Rev. B 1976, 13, 5188–5192. [Google Scholar] [CrossRef]
  37. Shi, A.J.; Li, B.X.; Wan, C.R.; Leng, D.C.; Lei, E.Y. Hybrid density functional studies of C-anion-doped anatase TiO2. Chem. Phys. Lett. 2016, 650, 19–28. [Google Scholar] [CrossRef]
  38. Bagwasi, S.; Tian, B.; Zhang, J.; Nasir, M. Synthesis, characterization and application of bismuth and boron Co-doped TiO2: A visible light active photocatalyst. Chem. Eng. J. 2013, 217, 108–118. [Google Scholar] [CrossRef]
  39. Ibrahim, H.H.; Mohamed, A.A.; Ibrahim, I.A. Electronic and optical properties of mono and co-doped anatase TiO2: First principles calculations. Mater. Chem. Phys. 2020, 252, 123285. [Google Scholar] [CrossRef]
  40. Doustkhah, E.; Assadi, M.H.N.; Komaguchi, K.; Tsunoji, N.; Esmat, M.; Fukata, N.; Tomita, O.; Abe, R.; Ohtani, B.; Ide, Y. In situ Blue titania via band shape engineering for exceptional solar H2 production in rutile TiO2. Appl. Catal. B Environ. 2021, 297, 120380. [Google Scholar] [CrossRef]
  41. Zhu, H.X.; Liu, J.-M. First principles calculations of electronic and optical properties of Mo and C co-doped anatase TiO2. Appl. Phys. A 2014, 117, 831–839. [Google Scholar] [CrossRef]
Figure 1. The optimized supercell models for (a) completely and (b) partially hydrogenated N-TiO2 marked as samples I and II, respectively; the atomic sites of H (white ball), N (blue ball), O (red ball), and Ti (gray ball) are marked in (a) and (b), respectively.
Catalysts 12 00178 g001
Figure 2. Band structures for (a) N-TiO2, (b) sample I, and (c) sample II. The highest occupied level is chosen as the Fermi level Ef indicated with dotted line, and the Ef of TiO2 is used as the reference level which is set to 0 eV. This reference level is also employed in Figure 3 and Figure 4.
Catalysts 12 00178 g002
Figure 3. TDOS and PDOS for (a) N-TiO2, (b) sample I, and (c) sample II.
Catalysts 12 00178 g003
Figure 4. PDOS of N and H atoms in (a) N-TiO2, (b) sample I, and (c) sample II. PDOS of N 2s are enlarged three times for clarity.
Catalysts 12 00178 g004
Figure 5. The isosurfaces of spin orbitals for the bands of (a) VBM and (b) CBM of sample I; (c) VBM, (d) band-gap states, and (e) CBM of sample II. The atomic positions of H, N, O, and Ti are indicated. The isosurface value is set to 0.015 e3.
Catalysts 12 00178 g005
Figure 6. (a) The calculated imaginary part of dielectric function, and (b) optical absorption for TiO2, N-TiO2, sample I, and sample II.
Catalysts 12 00178 g006
Figure 7. Schematic diagram of the change of valence band edges for N-TiO2, sample I, and sample II. Different shades of blue represent the intensity of the electron density. The darker color stands for the greater electronic density. The blank area of the short dashed line box represents the band-gap states.
Catalysts 12 00178 g007
Figure 8. Schematic diagram of the mechanism of photocatalytic hydrogen production from water splitting by sample II using sun light.
Catalysts 12 00178 g008
Table 1. Formation energies (Eform, in eV) for N-TiO2, sample I, and sample II under various growth conditions.
EformConfiguration
N-TiO2Sample ⅠSample Ⅱ
Eform (Ti-rich)0.023−2.175−2.454
Eform (O-rich)5.0022.8057.504
Table 2. Net charges on all ions in N-TiO2, sample I, and sample II obtained through Mulliken population analysis. Positive (+) and negative (−) signs mean the loss and gain of electron, respectively. The numbers in parentheses represent the quantity of ions.
SystemTiONuNhH
N-TiO2+1.33 (4)
+1.29 (2)
+1.32 (1)
+1.31 (1)
−0.67 (7)
−0.66 (7)
−0.68 (1)
−0.58--
sample Ⅰ+1.33 (5)
+1.32 (3)
−0.67 (9)
−0.66 (6)
-−0.86+0.26
sample Ⅱ+1.33 (2)
+1.32 (1)
+1.30 (2)
+1.31 (1)
+1.29 (1)
+1.28 (1)
−0.67 (2)
−0.66 (8)
−0.68 (3)
−0.65 (1)
−0.59−0.84+0.26
Publisher’s Note: MDPI stays neutral with regard to jurisdictional claims in published maps and institutional affiliations.

