Article

Hydrogen-Rich Gas Production from Two-Stage Catalytic Pyrolysis of Pine Sawdust with Nano-NiO/Al2O3 Catalyst

School of Energy Engineering, Xi’an University of Science and Technology, Xi’an 710054, China
*
Author to whom correspondence should be addressed.
Catalysts 2022, 12(3), 256; https://doi.org/10.3390/catal12030256
Submission received: 20 December 2021 / Revised: 20 February 2022 / Accepted: 23 February 2022 / Published: 24 February 2022

Abstract

:
Hydrogen production from biomass pyrolysis is economically and technologically attractive from the perspectives of energy and the environment. The two-stage catalytic pyrolysis of pine sawdust for hydrogen-rich gas production is investigated using nano-NiO/Al2O3 as the catalyst at high temperatures. The influences of residence time (0–30 s) and catalytic temperature (500–800 °C) on pyrolysis performance are examined in the distribution of pyrolysis products, gas composition, and gas properties. The results show that increasing the residence time decreased the solid and liquid products but increased gas products. Longer residence times could promote tar cracking and gas-phase conversion reactions and improve the syngas yield, H2/CO ratio, and carbon conversion. The nano-NiO/A12O3 exhibits excellent catalytic activity for tar removal, with a tar conversion rate of 93% at 800 °C. The high catalytic temperature could significantly improve H2 and CO yields by enhancing the decomposition of tar and gas-phase reactions between CO2 and CH4. The increasing catalytic temperature increases the dry gas yield and carbon conversion but decreases the H2/CO ratio and low heating value.

1. Introduction

Hydrogen is a promising alternative energy source for the future because of its abundant resources, high energy conversion, and clean application [1,2,3]. Biomass is one enormous and renewable source of hydrogen, as biomass is generated by natural photosynthesis and becomes the carrier of the hydrogen [4,5,6,7]. Hydrogen production from biomass is an attractive way to solve the energy shortage and environmental pollution problems. The two pathways for hydrogen-rich gas from renewable biomass are as follows: thermochemical conversion and biological conversion [8,9]. The thermochemical conversion is a feasible option in terms of economic and technological considerations. The main thermochemical processes include pyrolysis, gasification, supercritical water gasification, and chemical looping [10,11,12]. Pyrolysis is one of the most promising thermochemical processes that can co-produce high-value solid, liquid, and gas products, including hydrogen [13].
Pyrolysis is a process that can convert biomass into char, tar, and gas products (H2, CO, CO2, CH4, etc.) under the heat and anoxic environment [14,15,16]. The pyrolysis process of biomass to hydrogen can be divided into a one-stage pyrolysis process and a two-stage pyrolysis process [17,18,19]. The one-stage pyrolysis process can directly produce hydrogen-rich gas from biomass pyrolysis in a reactor. Compared to the one-stage pyrolysis, the two-stage pyrolysis process adds another stage to produce hydrogen-rich gas through tar cracking or steam reforming of the products from the one-stage pyrolysis process. Therefore, the two-stage pyrolysis process can produce more hydrogen than the one-stage pyrolysis process due to the decomposition of heavy hydrocarbons [17,18]. In the two-stage pyrolysis process, the catalysts are commonly used for tar cracking, so the study of the catalyst for hydrogen production is of great significance.
The important factors, including biomass types, heating rate, and temperature, in the pyrolysis process have been studied by some researchers [20,21,22,23]. The fast pyrolysis of four different biomass types was examined by Eri et al. via detailed CFD modelling [23]. Their study showed that cellulose-rich biomass produced the highest bio-oil yield, and the generated char was mainly from the lignin and cellulose of the biomass. The effect of heating rate on pyrolysis products was investigated for 14 plant species by Safdari et al. [21]. Their results showed that a higher heating rate resulted in a higher tar yield, gas yield, and volatile yield. The effect of temperature on the biogas production from the pyrolysis of sewage sludge was investigated by Liu et al. [24]. It was found that high temperatures improved biogas production and especially increased the H2 yield. The effect of temperature on pyrolysis characteristics was examined by Xu et al. for a single biomass particle using experimental and simulation methods [20]. They found that the increasing temperatures decreased the char yield and increased the shrinkage rate of the particles. The influence of temperature on the pyrolysis yield of hardwood residues was investigated by Mazlan et al. using a moving bed [22]. The results presented that with the temperature increase, the bio-oil and gas yields increased, while the char yield decreased. However, the current study of biomass pyrolysis is limited to medium temperatures <600 °C—the high-temperature pyrolysis behaviour of the biomass, especially for hardwood residue, such as pine sawdust, is still unclear.
The catalytic pyrolysis of biomass has been investigated by using different types of catalysts [13,25]. Different types of zeolites, including HZSM-5, β-zeolite, and Y-zeolite, are widely used in biomass pyrolysis because of their unique distribution of pores and surface acidic sites [26,27]. Catalytic pyrolysis of paddy husk was examined by Naqvi et al. using MCM-22 and ITQ zeolites [28]. It was found the pyrolysis oil decreased with the zeolite catalysts due to the catalytic cracking of oil, such as decarboxylation. Metal catalysts, including Ni-based catalysts, Al2O3, CaCO3, and NaCO3, were also widely used in biomass pyrolysis [29]. The catalytic pyrolysis of municipal solid wastes was studied by Li et al. using Al2O3 as a catalyst in a fluidized bed reactor [30]. It was found that Al2O3 decreased the activation energy of the CO bond in the sample and improved the rate of decarboxylation, aromatization, and alkylation reactions. Six different Ni-based catalysts were studied by Liu et al. for syngas production from the pyrolysis of pine sawdust [31]. The results showed that Ni/magnesium slag achieved the best catalytic performance, which had a 95% tar conversion and a 1.46 Nm3/kg gas yield. Although different types of catalysts have been studied, the application of nano NiO/γ-Al2O3 in biomass pyrolysis has not been studied to our knowledge.
The main objective of this study is to study the high-temperature catalytic pyrolysis performance of pine sawdust for hydrogen-rich gas production using nano NiO/γ-Al2O3 as a catalyst in a two-stage moving bed. The pyrolysis performance was examined in terms of pyrolysis products’ distribution, gas composition, and gas properties. Firstly, the effects of residence time on pyrolysis performance were studied without catalysts. Moreover, the effect of catalytic temperature on pyrolysis performance was studied with nano NiO/γ-Al2O3.

2. Results and Discussion

2.1. Effect of Residence Time on Pyrolysis

The pyrolysis experiments of pine sawdust were performed at 850 °C without using catalysts or a catalytic bed. The different residence times (12 s, 17 s, 22 s, and 30 s) in the pyrolysis bed were obtained by changing the secondary feeding speed (x2). Their effects on pyrolysis performance are investigated in this section.

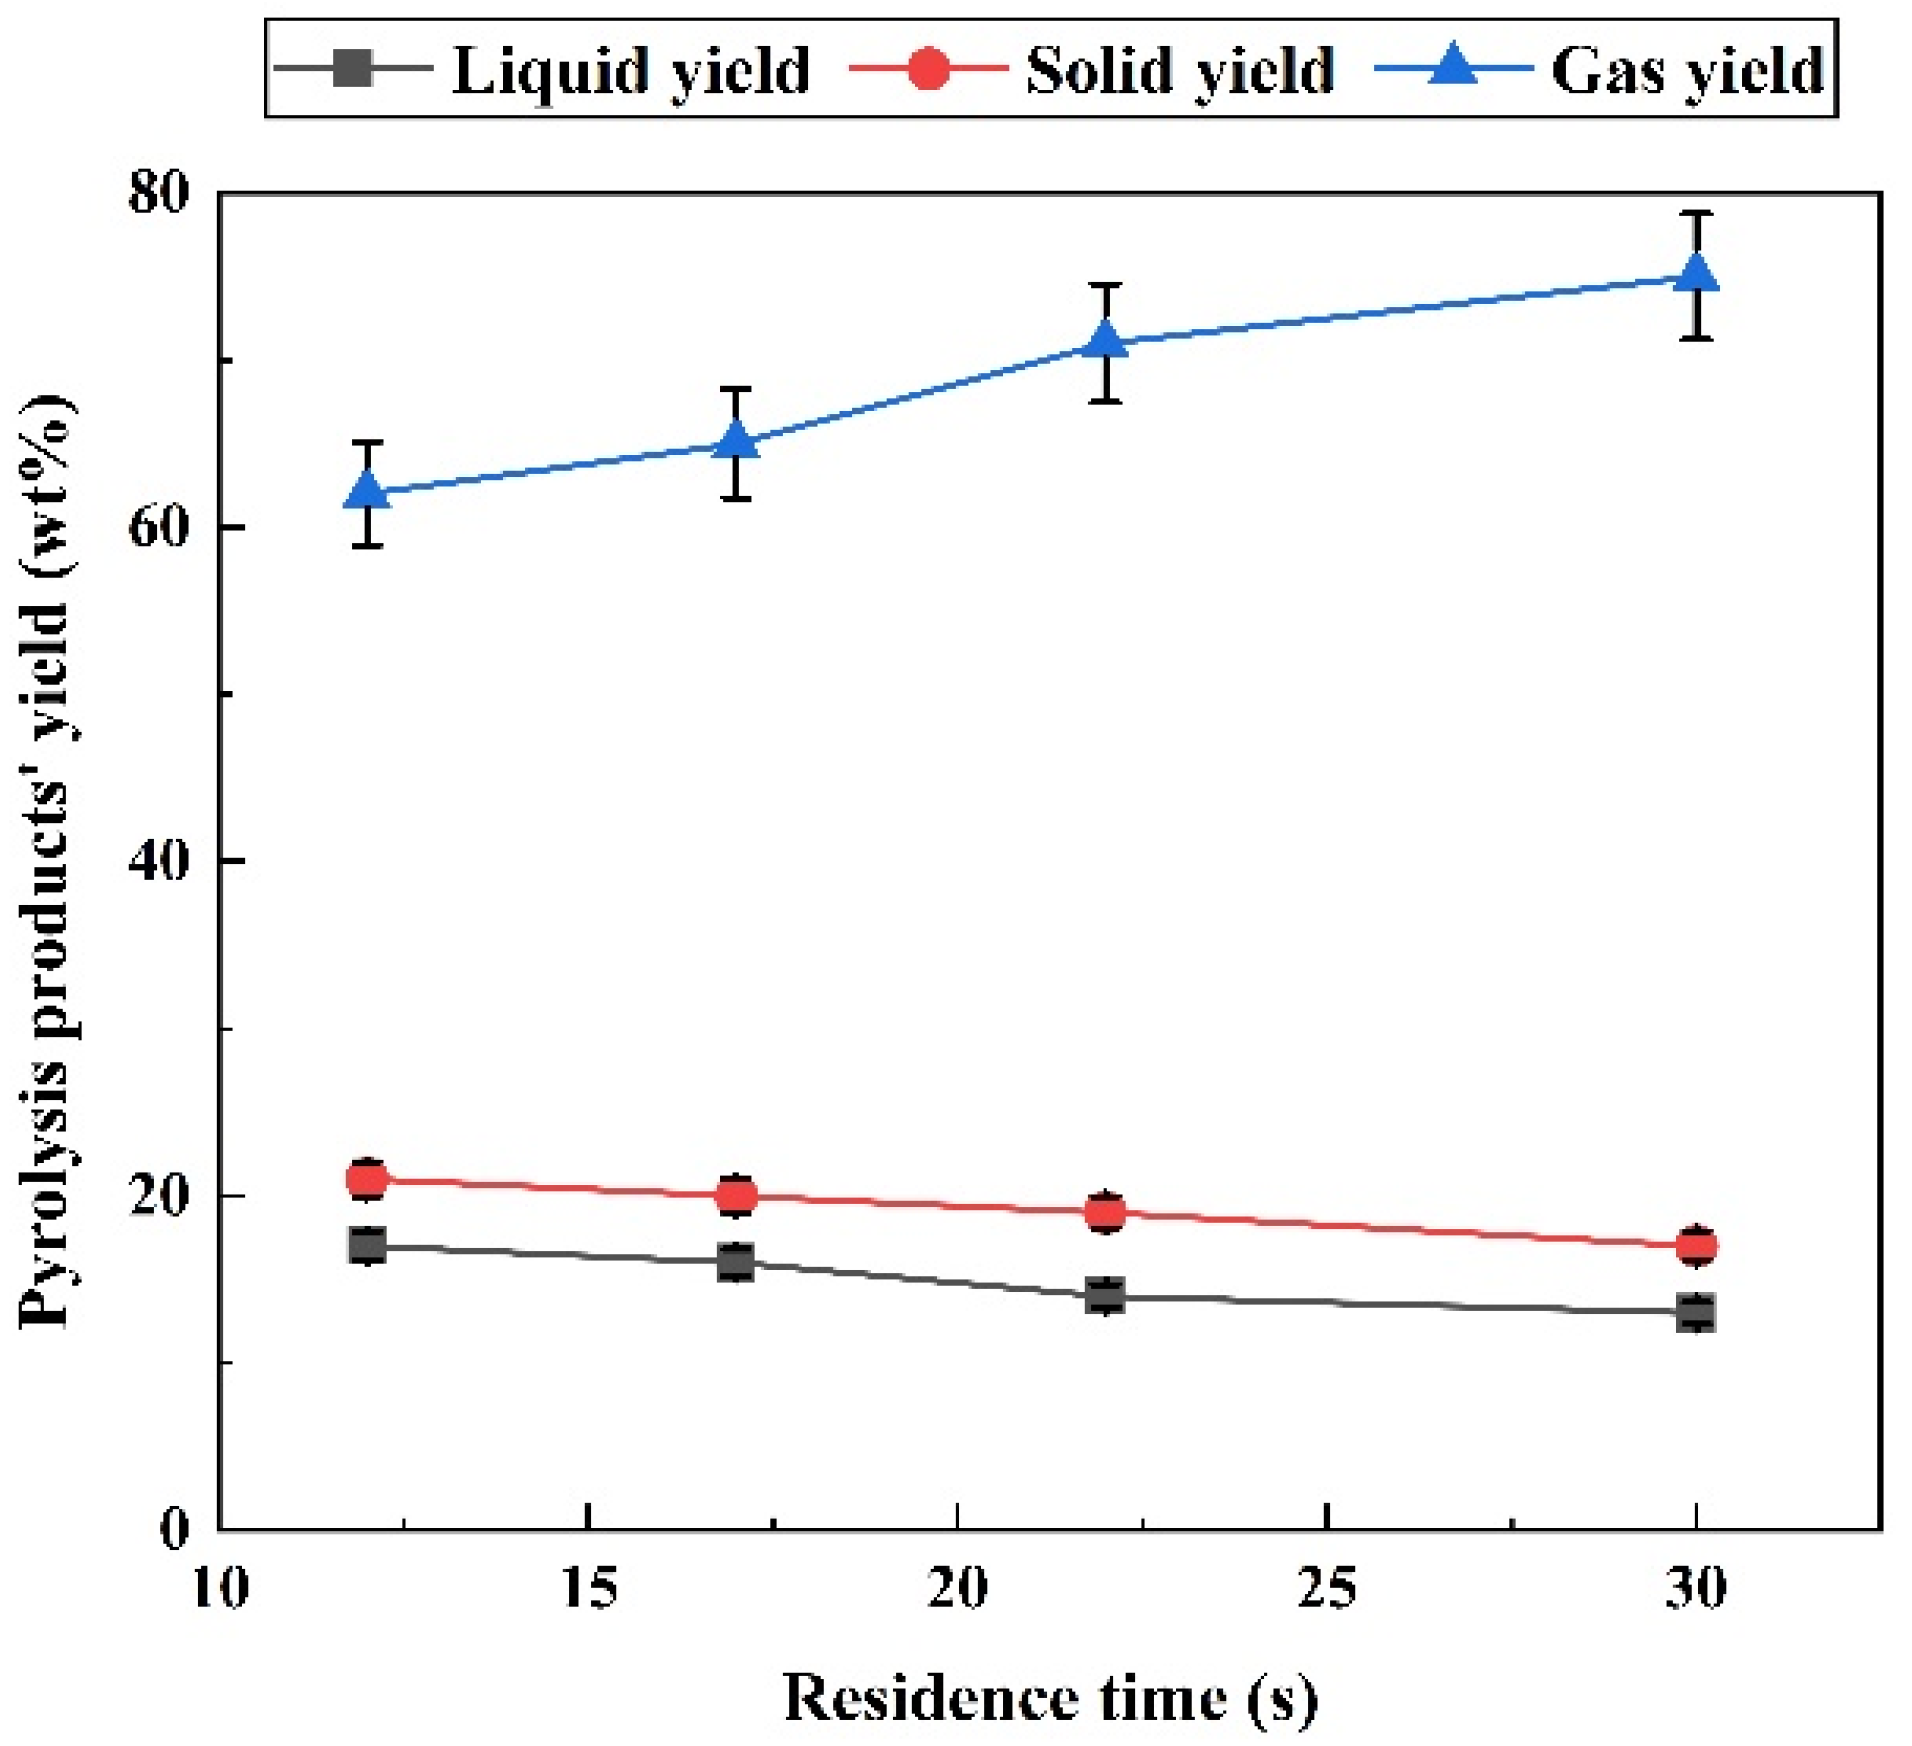
2.1.1. Effect of Residence Time on Pyrolysis Products Distribution

Figure 1 shows the influence of solid residence time (SRT) on the distribution of pyrolysis products. The proportion of gas yield increased rapidly from 61.79 wt% (SRT = 12 s) to 74.34 wt% (SRT = 30 s) with the prolonged residence time in the pyrolysis bed. However, the trend of liquid and solid yield was just the opposite. When SRT was 12 s, liquid and solid yields were 16.9 wt% and 21.31 wt%, respectively. However, when SRT was increased to 30 s, liquid and solid yields were decreased to 7.71 wt% and 16.78 wt%, respectively. The experimental results showed that the longer the residence time, the less liquid and solid yields there were and the more gas yields there was at the same temperature and heating rate.
The pyrolysis process can be generally divided into the following two stages: primary pyrolysis and secondary pyrolysis. During the primary pyrolysis, the biomass particles are heated up and converted into char, tar, and light gases (such as H2, CO, CO2, CH4, H2O, and other low hydrocarbons). With the increase in temperature, the secondary pyrolysis takes place. During the secondary pyrolysis, the tar is further thermally cracked into light gases, as seen in Equation (1). The gases released from the primary pyrolysis also undergo secondary gas-phase reactions (such as Equations (2) and (3)) and secondary solid-gas-phase reactions (such as Equation (2)). Hence, the increase in gas yield with residence time was mainly due to the thermal cracking of the tar and the secondary gas reactions.
Tar → CH4 + H2O + CnHm + H2
C + CO2 → 2CO
CO + H2O → CO2 + H2
CH4 + H2O → CO + 3H2
CH4 + CO2 → 2CO + 2H2
CnHm + 2nH2O → nCO2 + [2n + (m/2)]H2

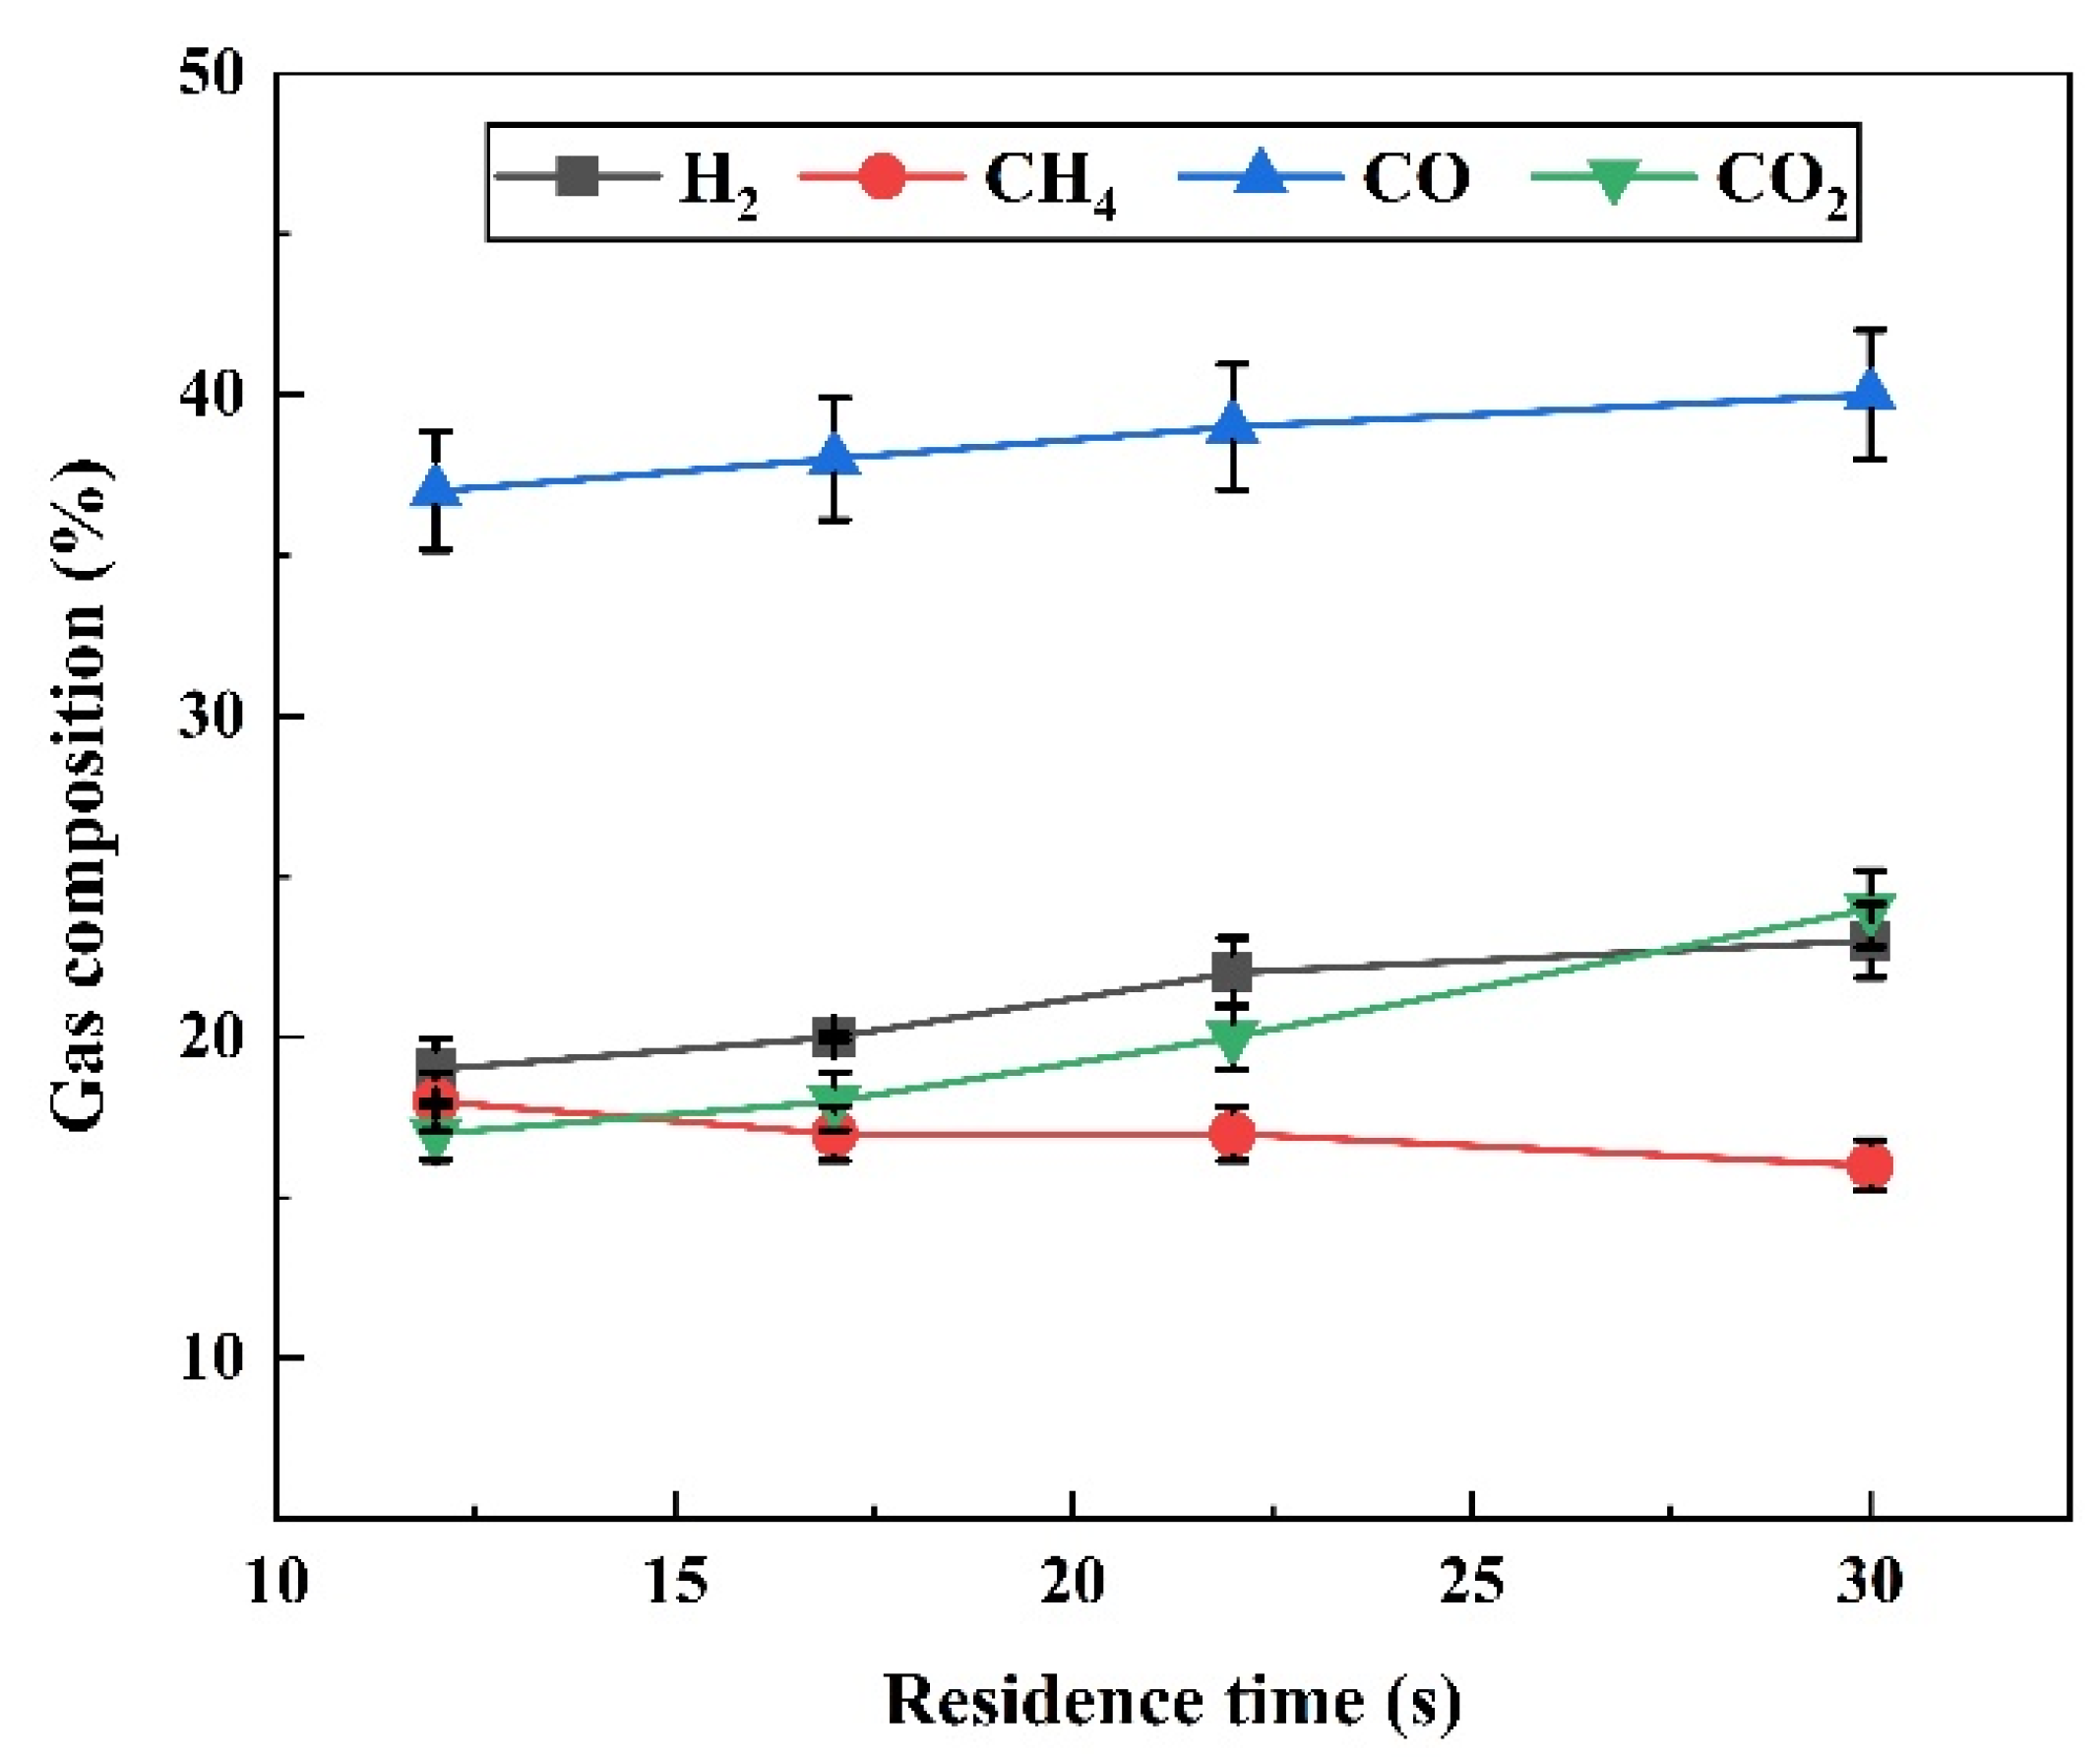
2.1.2. Effect of Residence Time on Gas Composition

The influence of residence time (SRT) on pyrolysis gas composition is shown in Figure 2. The main gas products of pine sawdust pyrolysis were H2, CO, CO2, and CH4. No C2 gas products or other hydrocarbons were measured in our experiments. With the increasing SRT, H2, CO, and CO2 all increased significantly, but the concentration of CH4 showed a downward trend. Specifically, as SRT increased from 12 s to 30 s, the CO2 content increased from 17.33% to 24.17%. This may be due to the reaction of CO with H2O (Equation (3)) and the heavy hydrocarbons cracking (Equation (6)), resulting in the formation of CO2.
However, the CH4 content decreased with the increase in SRT. When SRT was 12 s, the CH4 content was 18.54%, and when SRT was 30 s, it decreased to 16.74%. This may be attributed to the tar cracking (Equation (1)) and the secondary gas reactions (Equations (4) and (5)).
The CO content increased by 5% with the increase of SRT from 12 s to 30 s. Similarly, the concentration of H2 increased rapidly by 22% in the same range of SRT. The increase in H2 and CO was due to the formation of more H2 and CO by the tar cracking and the secondary gas reaction. Interestingly, the value of CO2 concentration exceeded the value of H2 concentration at 30 s. This could be a result of the secondary pyrolysis reactions using H2 as reactants, such as the reverse of dry methane reforming (Equation (7)) and hydrogasification (Equation (8)) [10,32].
2CO + 2H2 → CH4 + CO2
C + 2H2 → CH4

2.1.3. Effect of Residence Time on Gas Products Properties

The variation trend of the characteristic parameters of gas products with the residence time is shown in Table 1. The syngas (H2 + CO) content and H2/CO ratio increased by 11% and 16%, respectively, as SRT increased from 12 s to 30 s. In the SRT range of 12–30 s, the syngas content and H2/CO ratio reached their maximum (62.27% and 0.5897, respectively) at 30 s. Experimental data revealed the influence of SRT on syngas yield and composition. At a constant temperature, the longer the SRT, the greater the syngas yield and H2/CO ratio.
The dry gas yield and carbon conversion also increased with the increase of SRT, from 0.774 Nm3/kg and 65.48% (SRT = 12 s) to 1.12 Nm3/kg and 85.25% (SRT = 30 s), respectively. According to the equation of the carbon conversion (Equation (13)), the value of the carbon conversion is determined by the dry gas yield and the total composition of CO, CO2, and CH4. Although the CH4 composition decreased by 2 vol% with the residence time, the total composition of CO and CO2 increased by 10 vol%. Therefore, the total composition of CO, CO2, and CH4 increased by 8 vol% at the residence time of 12–30 s. Meanwhile, the dry gas yield increased by 0.35 Nm3/kg with the residence time. Because of the increase in dry gas yield and total composition of CO, CO2 and CH4, the carbon conversion increased with the residence time. This result indicated that the increase in SRT improved pyrolysis reactions, resulting in a rise in the pyrolysis gas yield and carbon conversion. The low heating value (LHV) of pyrolysis gas fluctuated in the range of 13.29–13.53 MJ/Nm3 with the change of residence time, indicating no significant association between the LHV and residence time.

2.2. Catalytic Effect of Nano-NiO/γ-A12O3

In this section, the pyrolysis bed was performed at 800 °C, and nano-NiO/γ-A12O3 was used as the catalyst for the catalytic bed. The catalytic bed was conducted at 500–800 °C under a weighted hourly space velocity of 0.4 h−1 to study the catalytic effect of nano-NiO/γ-A12O3.

2.2.1. Effect of Catalyst on Pyrolysis Products Yield

Figure 3 shows the effect of catalytic temperature on the pyrolysis products’ distribution of pine sawdust using nano-NiO/γ-A12O3. As seen, the gas yield with the catalyst at 500 °C significantly increased by 10.3 wt% compared to no catalyst. When the catalytic temperature rose from 500 °C to 800 °C, the gas yield increased from 75.4 wt% to 84.1 wt%. Meanwhile, the tar yield decreased with the increasing catalytic temperature. At 800 °C, the tar yield had decreased to 0.88 wt%, nearly zero. By contrast, the char almost kept stable at around 16 wt% regardless of catalyst and catalytic temperature. This is because the char yield was determined by the pyrolysis bed. In other words, the catalytic bed can only affect the tar and gas yield by the thermal decomposition of volatile organic gases and the catalytic reforming of gas products. The results showed that nano-NiO/γ-A12O3 had an excellent catalytic effect for tar removal, which can almost 100% remove tar at 800 °C. Under the catalytic effect of nano-NiO/γ-A12O3, the majority of the generated tar was converted into gas products.

2.2.2. Effect of Catalyst on Gas Composition

The effect of catalytic temperature on gas composition is presented in Figure 4. The generated gas products during catalytic pyrolysis were H2, CO, CH4 and CO2. With the catalyst of nano NiO/γ-A12O3, the content of H2 and CO increased, but the content of CH4 and CO2 decreased. With the catalytic temperature increased, the constant increase of H2 and CO and the decrease of CH4 and CO2 were observed at 500–800 °C. At 800 °C, the content of H2 and CO reached a maximum value of 35.9% and 48.3%, respectively. The values nearly doubled those of no catalyst. By contrast, the value of CO2 dramatically decreased from 34.3% (no catalyst) to 12.4% (500 °C), and further decreased to 9.1% (800 °C). The CH4 showed a similar decrease trend with the catalyst and catalytic temperature. The increase in H2 and CO can be attributed to the boosting of secondary decomposition of the tar (Equation (1)) and secondary gas reactions (Equations (4) and (5)) under the increasing catalytic temperature. Interestingly, the H2 composition did not keep increasing but remained almost stable at 600–800 °C. The results indicated the consumption of H2 occurred at a higher temperature, which may be a result of secondary pyrolysis reactions such as the reverse of dry methane reforming (Equation (7)) and hydrogasification (Equation (8)). The decrease in the CH4 and CO2 confirmed that secondary gas-phase reactions become more intensive with increasing catalytic temperature. The results revealed that nano NiO/γ-A12O3 improved the secondary gas reactions and increased the content of H2 and CO in gas products.

2.2.3. Effect of Catalyst on Properties of Gas Products

The influence of catalytic temperature on gas properties is shown in Table 2. The ratio of H2/CO under catalytic pyrolysis at 500 °C almost doubled to 1.00, compared to no catalyst. However, with the increasing catalytic temperature, the ratio of H2/CO decreased from 1.00 (500 °C) to 0.74 (800 °C). This indicated that the increased rate of CO was greater than that of H2 with catalytic temperature. Meanwhile, the syngas content in gas products significantly increased by 21.86%, with the catalyst at 500 °C. The value of syngas content steadily increased from 67.34% (500 °C) to 84.28% (800 °C) due to the tar cracking and gas-phase reactions. The dry gas yield and carbon conversion showed a similar trend. The numbers of dry gas yield and carbon conversion dramatically grew with the catalyst of nano-NiO/γ-A12O3, and the values kept increasing with the catalytic temperature. The results indicated that nano NiO/γ-A12O3 had an excellent catalytic effect for gas products, which improved syngas quality by changing the ratio of H2/CO.

3. Experimental Section

3.1. Sample Preparation

Pine sawdust was used as the feedstock in this study, which came from the furniture processing factory in Wuhan, China. The sawdust was air-dried and screened by a vibrating material screener, and it was sieved to a particle size of < 177 μm. The proximate analysis of the pine sawdust was measured according to the Chinese standard-GB/T 28731-2012. Ultimate analysis of the sample was carried out by an elemental analyzer (Vario Micro Cube, Elementar, Langenselbold, Germany). These results of pine sawdust are shown in Table 3.

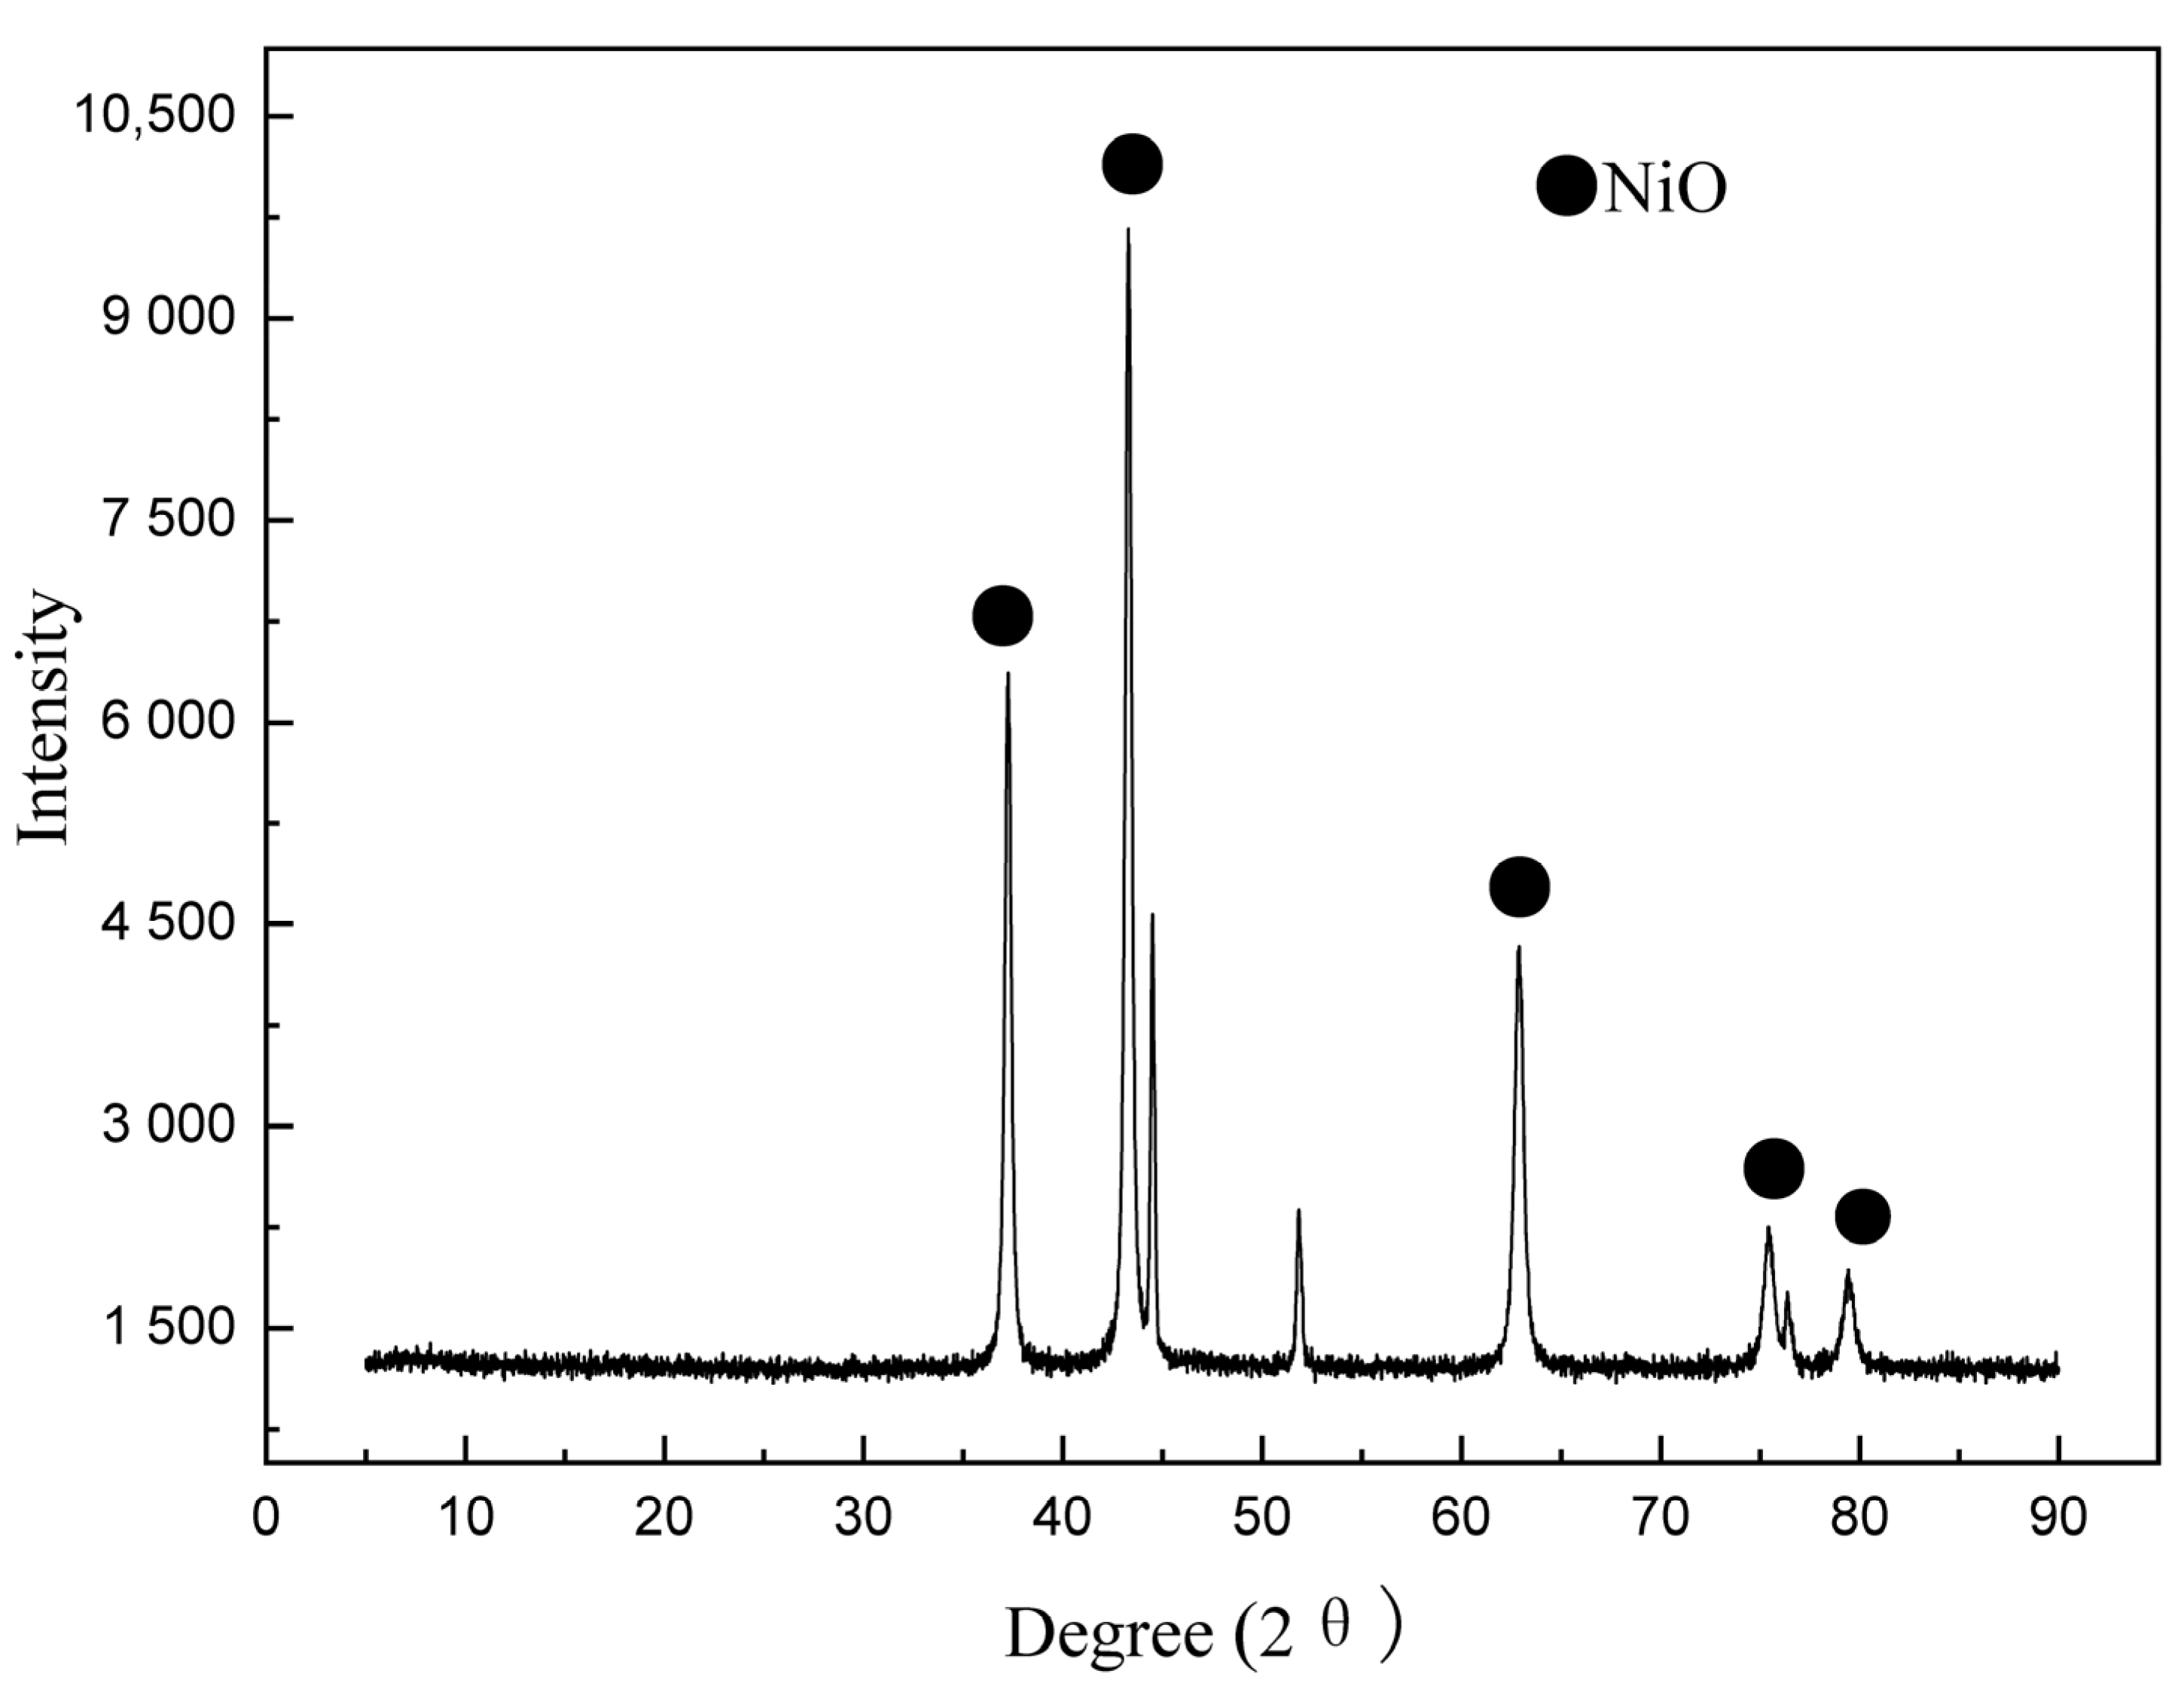
3.2. Catalyst Preparation and Characterization

Based on Li et al.’s study [33,34], the nano-NiO was prepared and then incorporated into the γ-Al2O3 support substrates by the deposition-precipitation method. Firstly, 0.08 mol of Ni(NO3)2·6H2O and 0.24 mol of CO(NH2)2 was accurately weighed and then dissolved into 150 mL deionized water in a beaker. After that, 32.64 g γ-Al2O3 supports were transferred into the breaker with the mixture solution. The glass vessel was sealed and placed in a heater with a magnetic stirrer, where the mixture was heated in an oil bath at 115 °C for 5 h. With the process of the reaction, the nickel precursor of light green was precipitated on the γ-Al2O3 supports. After the completion of the reaction, the light green solid spheres were washed to colourless by using deionized water for removing possible absorbed chemicals. The γ-Al2O3 supports with the nickel precursor were then dried in an oven at 90 °C for 5 h. The dried samples were calcined in a muffle furnace at 400 °C for 4 h in the air, where the nickel precursor was decomposed into nickel oxide. The final catalyst products (nano NiO/γ-Al2O3) were collected and obtained.
The crystalline structures of the catalyst samples were measured by a Bruker D8 Advance X-ray diffractometer. The surface area of the catalyst was examined by a surface area porosity analyzer (ASAP 2010, Micromeritics, Atlanta, GA, USA). Their XRD patterns are shown in Figure 5, and their surface properties are listed in Table 2. As shown in Figure 1, NiO was the main phase on the surface of the catalyst sample. The nanoparticles of NiO on the surface of the γ-Al2O3 were examined by a transmission electron microscopy (TEM). The TEM image of the nanoparticles of the NiO is presented in Figure 6. It can be seen from Figure 6 that the NiO particles had a small size at a range of 5–20 nm with spherical shapes. As seen in Table 4, the supported catalysts had a relatively high specific surface area. Compared to γ-Al2O3 supports, the BET surface area and pore volume of the catalyst were slightly smaller, possibly due to the blockage of the NiO particles on the surface of the support.

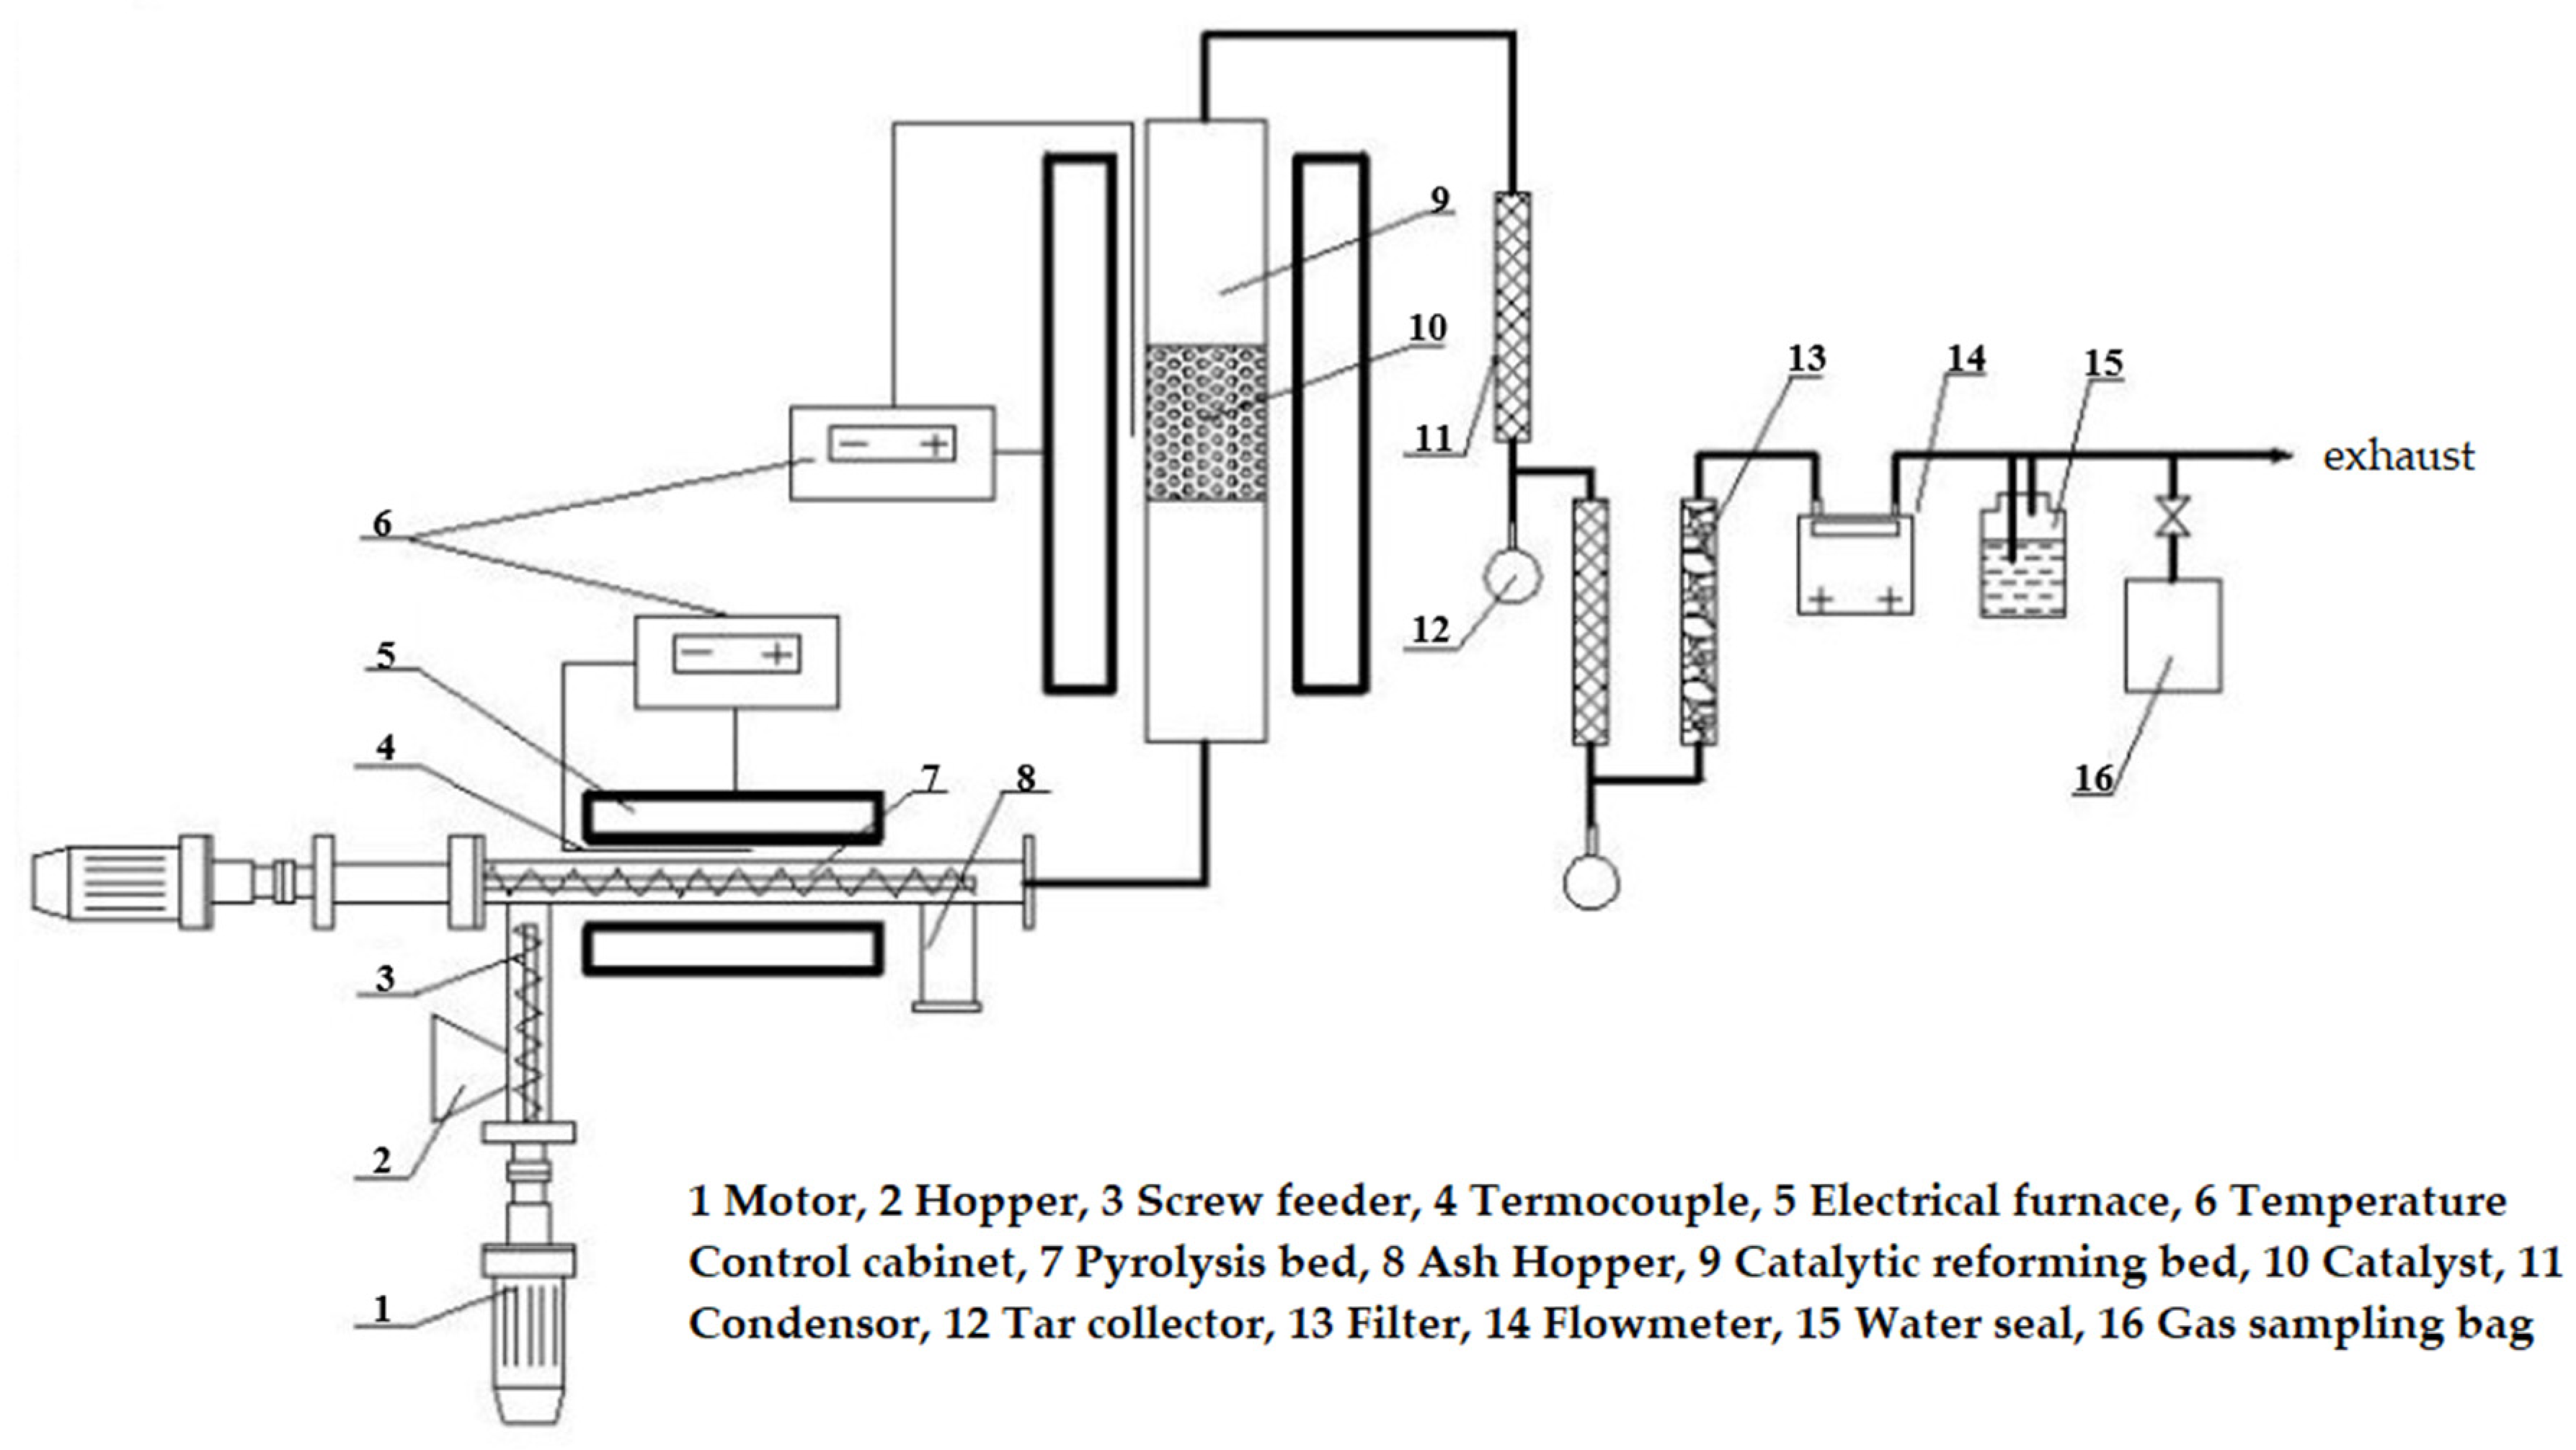
3.3. Experimental Apparatus and Procedures

A self-designed two-stage catalytic pyrolysis reactor was used for catalytic pyrolysis experiments in our study. It was mainly composed of a two-stage screw feeder, a horizontal pyrolysis moving bed, a temperature control system, a vertical catalytic reforming moving bed, and a gas cleaning and tar collecting system. The schematic diagram of the apparatus is shown in Figure 7.
The two-stage screw feeder system consists of two screw feeders. The screw feeder mainly includes the screw, motor, and hopper. The motor drove the rotation of the screw and then pushed the raw material forward. The primary screw feeder contained a hopper, and its end was connected to the pyrolysis reactor. A short distance was maintained between the screw end and the outlet of the feeder to achieve a good sealing performance by forming a material seal. According to the cold mode tests, the input mass of the feeder was determined by the speed of the primary screw feeder (x1). The secondary screw feeder was located in the pyrolysis bed, and its rotational speed determined the biomass moving velocity within the reactor. According to the cold mode experiment (tests at room temperature), the feeding rate of biomass (Y, g/h) can be calculated, according to the speed of the primary screw feeder (x1) and the secondary screw feeder (x2) as follows:
Y = 11.6737x1 + 0.6087x2.
As shown in Figure 8, the moving velocity of biomass particles in the pyrolysis bed (Vfeed) can be calculated by the speed of the secondary screw feeder (x2) as follows:
Vfeed = 0.03x2 − 0.722
The electric horizontal pyrolysis bed reactor with electric heating was used in this study. The horizontal pyrolysis bed reactor mainly consisted of a motor, screw feeder, and ash hopper. The reactor was made of acid and alkali resistant, high-temperature resistant stainless-steel material. The highest temperature the reactor can reach is 1000 °C, the size of the internal reaction tube was φ 80 × 1100 mm. The motor drove the rotation of the screw so that the biomass samples from the primary screw feeder moved forward and reacted in the pyrolysis reactor. Finally, the solid residue generated by the pyrolysis reactions fell into the ash hopper. An electric vertical tube reactor was used as the catalytic reforming bed. The reactor was made of high-temperature resistant stainless-steel material, with the designed highest temperature of 1000 °C, with an internal size of φ 60 × 1100 mm. It was filled with the catalyst inside and had a gas outlet on the top.
In the catalytic pyrolysis experiments, the pyrolysis bed and catalytic reforming bed were preheated, and around 300 g pine sawdust was set in the hopper. When the two reactors were heated to the required temperature, N2 was introduced for approximately half an hour to drain the oxygen from the system. After that, the two-stage screw feeder started feeding, at the primary feeding speed of 171 r/h and the secondary feeding speed of 300 r/h. The pyrolysis reactions of the pine sawdust took place in the pyrolysis bed at 700–900 °C. Then, the pyrolysis gas was inputted to the catalytic reforming reactor through the pipeline, and further cracked and reformed under the action of the catalyst. In the downstream, when the reformed gas passed the condensers under the ice water (~0 °C), most of the tar was condensed and collected by the collection impingers. The residual tar and impurities were absorbed and removed by the filters with quartz cotton. The output gas flow rate was recorded by the gas flowmeter. Finally, the gas passed through the water-sealed bottle and was then ignited and exhausted.
After the experiment ran for around 15 min in a steady state, the generated gas was collected by a gas sampling bag and analyzed by gas chromatography (GC 9800 T, Kechuang, Shanghai, China). The gas yield was counted by the gas flowmeter. After the experiment, the collected tar from the collection bottles was weighted. Solid residues were collected from the ash hopper for weighting and analysis. Each experiment was repeated three times, and the results were averaged and presented.

3.4. Data Analysis

(1)
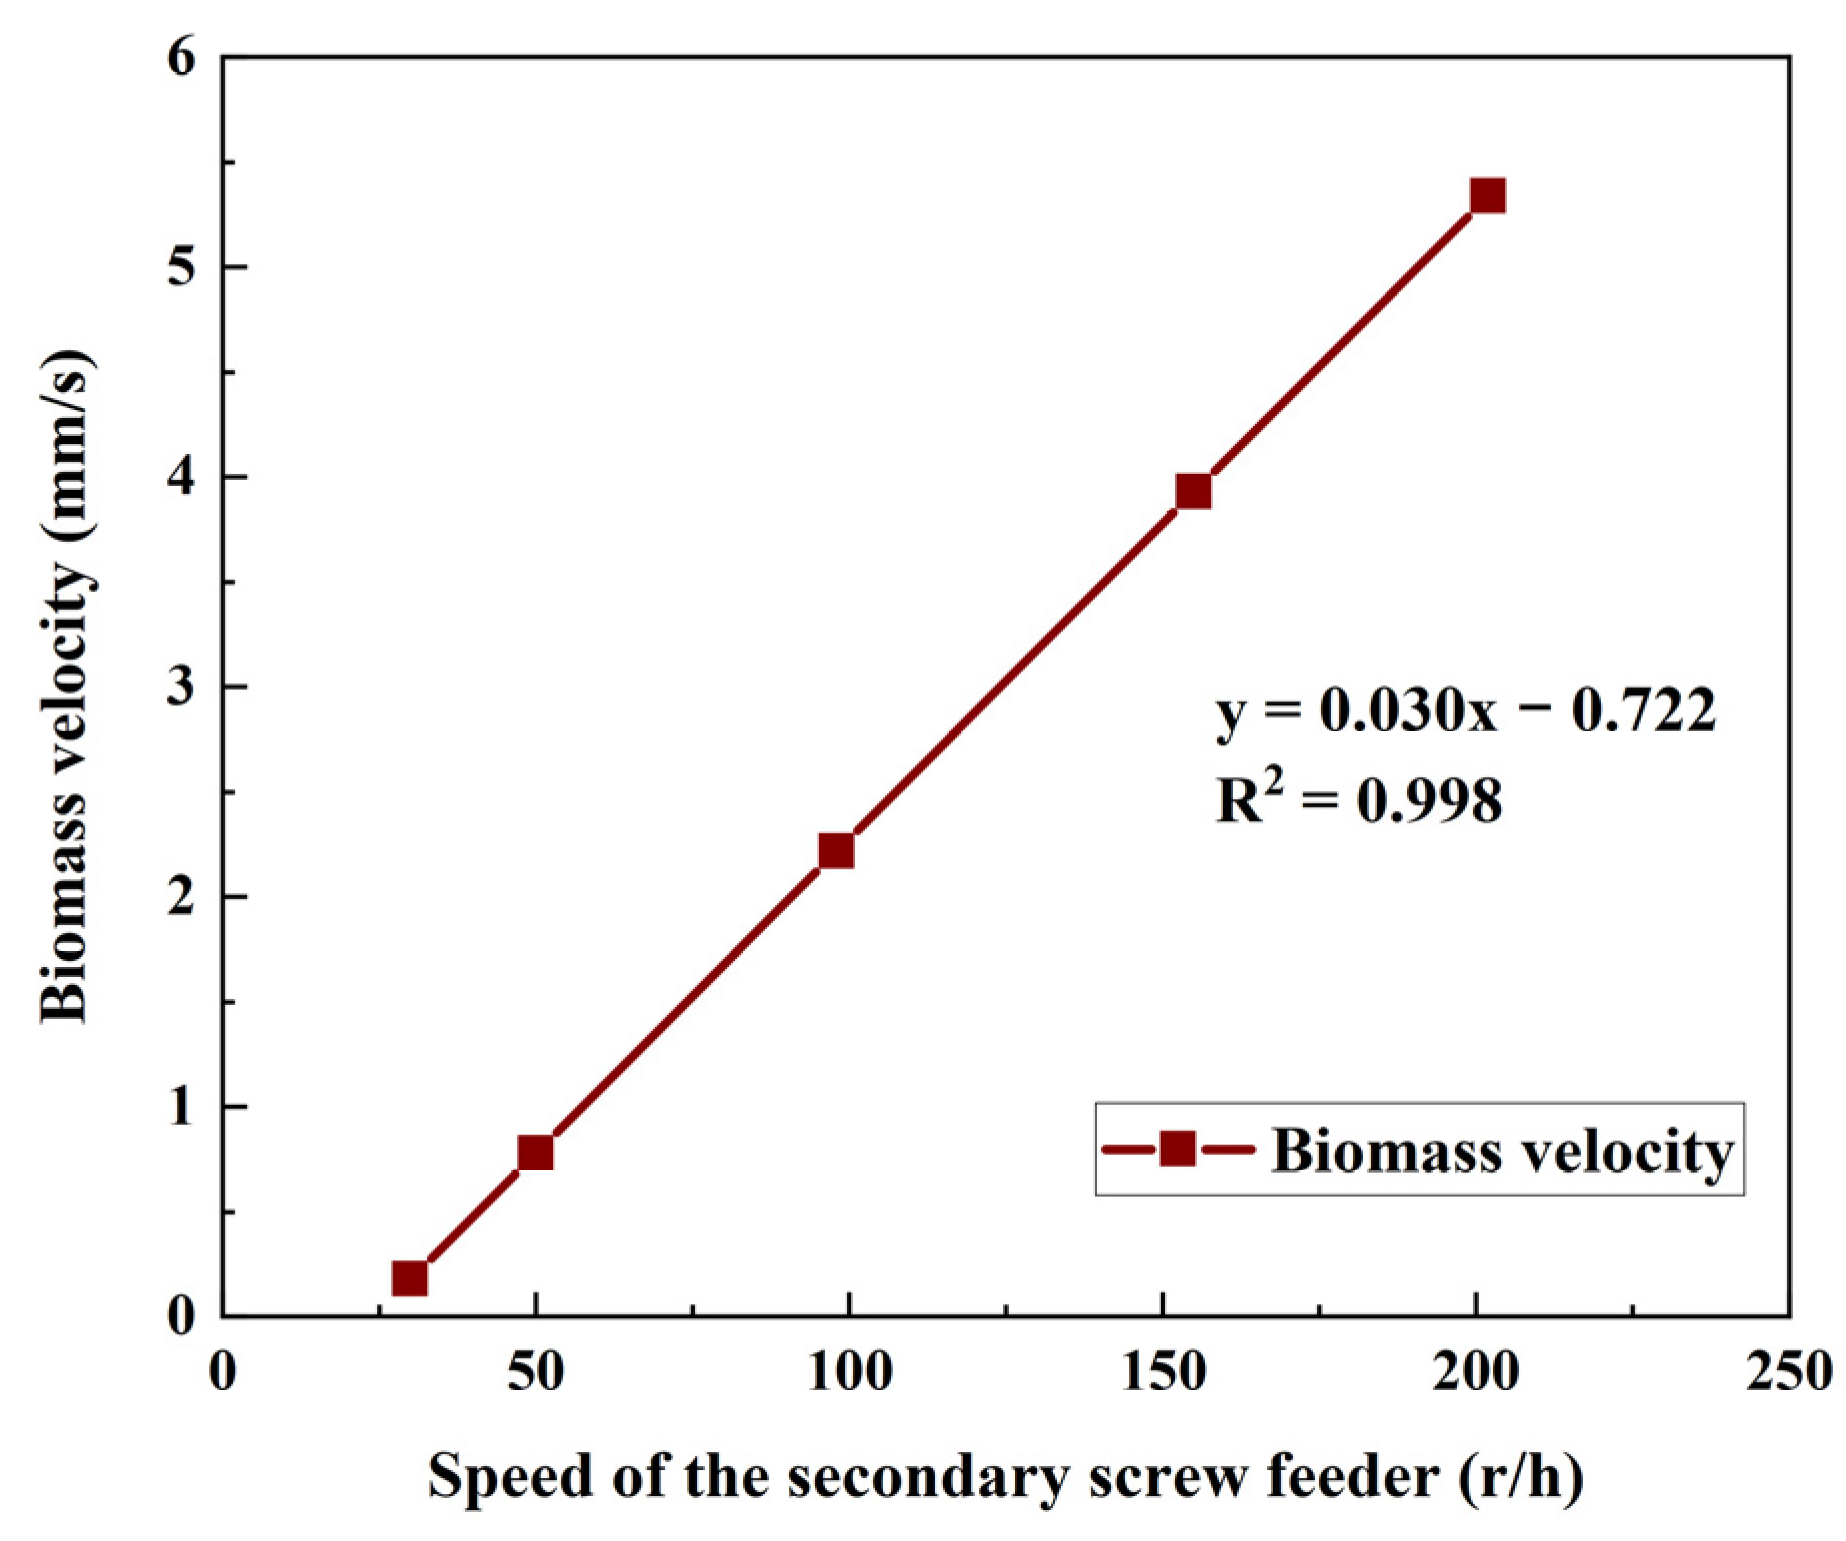
Residence time, t (s), was calculated by the ratio of the length of the pyrolysis reaction zone (250 mm) to the biomass moving velocity (Vfeed) in the reactor.
t = 250 0.03 x 2 0.722
(2)
Dry gas yield, GY (Nm3/kg), refers to the volume of gas that can be generated per kilogram of dried biomass, which was calculated by the following equation:
GY = Produced gas volume (Nm3) ÷ Dry biomass weight (kg)
(3)
Carbon conversion rate, ηc (%), refers to the ratio of carbon content in gas products to the carbon content in biomass, which was calculated by the following equation:
η c = CO + CO 2 + CH 4 22.4 × C × 12 G Y × 100 %
where C means the mass percentage of carbon in the ultimate analysis of samples, GY is the dry gas yield, CO, CO2, and CH4 are the volume ratio of CO, CO2, and CH4 in gas products.
(4)
The lower heating value of gas products (LHV, MJ/Nm3) was calculated by the following equation [36]:
LHV = CO × 12.63 + H2 × 10.78 + CH4 × 35.81
where CO, H2, and CH4 are their corresponding gas composition by volume in gas products.

4. Conclusions

Catalytic pyrolysis of pine sawdust was investigated with nano-NiO/γ-A12O3 in a two-stage catalytic pyrolysis reactor. The effects of residence time and catalytic temperature on the pyrolysis performance of pine sawdust were examined. The main conclusions were summarized as follows:
  • The longer residence time resulted in fewer solid and liquid products but more gas products. Longer residence time could promote tar cracking and gas-phase conversion reactions, improve the syngas yield, H2/CO ratio, and improve carbon conversion.
  • The catalyst of nano-NiO/γ-A12O3 had catalytic activity for tar removal, which could decrease tar yield to near zero at 800 °C.
  • The increasing catalytic temperature of nano-NiO/γ-A12O3 could significantly increase H2 and CO yields by improving the tar decomposition and the secondary gas reactions.
  • Increasing catalytic temperature improved dry gas yield and carbon conversion but decreased the H2/CO ratio and the low heating value.
However, the deactivation of the catalyst during the pyrolysis is key information for the catalyst, but it was not examined in this study. It will be further investigated in future work, particularly for catalyst evolution during the pyrolysis and its coking behaviour. Further investigation should also be undertaken using unmodified Al2O3 catalysts to compare with the catalyst of NiO/Al2O3.

Author Contributions

Conceptualization, T.X.; methodology, T.X.; software, X.Z. and J.X.; validation, T.X. and Y.W.; formal analysis, T.X. and X.Z.; investigation, T.X. and X.Z.; resources, T.X.; data curation, X.Z. and J.X.; writing—original draft preparation, T.X.; writing—review and editing, T.X. and Y.W.; visualization, X.Z. and J.X.; supervision, T.X.; project administration, T.X.; funding acquisition, Y.W. All authors have read and agreed to the published version of the manuscript.

Funding

This research was funded by National Natural Science Foundation of China (Grant No. 51634007), The Key Scientific and Technological Innovation Program of Shandong (Grant No. 2019JZZY020326), and the Natural Science Basic Research Program of Shaanxi (Program NO. 2021JLM-10).

Acknowledgments

The authors acknowledge the financial support from Xi’an University of Science and Technology.

Conflicts of Interest

The authors declare no conflict of interest.

References

  1. Zhou, L.; Sun, L.; Xu, L.; Wan, C.; An, Y.; Ye, M. Recent Developments of Effective Catalysts for Hydrogen Storage Technology Using N-Ethylcarbazole. Catalysts 2020, 10, 648. [Google Scholar] [CrossRef]
  2. Yin, H.; Yip, A.C.K. A Review on the Production and Purification of Biomass-Derived Hydrogen Using Emerging Membrane Technologies. Catalysts 2017, 7, 297. [Google Scholar] [CrossRef] [Green Version]
  3. Sun, Y.; He, J.; Yang, G.; Sun, G.; Sage, V. A Review of the Enhancement of Bio-Hydrogen Generation by Chemicals Addition. Catalysts 2019, 9, 353. [Google Scholar] [CrossRef] [Green Version]
  4. Tareen, W.U.K.; Dilbar, M.T.; Farhan, M.; Nawaz, M.A.; Durrani, A.W.; Memon, K.A.; Mekhilef, S.; Seyedmahmoudian, M.; Horan, B.; Amir, M. Present Status and Potential of Biomass Energy in Pakistan Based on Existing and Future Renewable Resources. Sustainability 2020, 12, 249. [Google Scholar] [CrossRef] [Green Version]
  5. Nie, Y.; Li, J.; Wang, C.; Huang, G.; Fu, J.; Chang, S.; Li, H.; Ma, S.; Yu, L.; Cui, X.; et al. A fine-resolution estimation of the biomass resource potential across China from 2020 to 2100. Resour. Conserv. Recycl. 2022, 176, 105944. [Google Scholar] [CrossRef]
  6. Li, Y.; Xing, B.; Ding, Y.; Han, X.; Wang, S. A critical review of the production and advanced utilization of biochar via selective pyrolysis of lignocellulosic biomass. Bioresour. Technol. 2020, 312, 123614. [Google Scholar] [CrossRef]
  7. Kang, Y.; Yang, Q.; Bartocci, P.; Wei, H.; Liu, S.S.; Wu, Z.; Zhou, H.; Yang, H.; Fantozzi, F.; Chen, H. Bioenergy in China: Evaluation of domestic biomass resources and the associated greenhouse gas mitigation potentials. Renew. Sustain. Energy Rev. 2020, 127, 109842. [Google Scholar] [CrossRef]
  8. Palma, V.; Ruocco, C.; Cortese, M.; Martino, M. Bioalcohol Reforming: An Overview of the Recent Advances for the Enhancement of Catalyst Stability. Catalysts 2020, 10, 665. [Google Scholar] [CrossRef]
  9. Ng, F.T.T.; Dalai, A.K. Catalysis for the Production of Sustainable Fuels and Chemicals. Catalysts 2020, 10, 388. [Google Scholar] [CrossRef] [Green Version]
  10. Xu, T.; Bhattacharya, S. Direct and two-step gasification behaviour of Victorian brown coals in an entrained flow reactor. Energy Convers. Manag. 2019, 195, 1044–1055. [Google Scholar] [CrossRef]
  11. Xu, T.; Bhattacharya, S. Entrained flow gasification behaviour of Victorian brown coal char at low temperature. Fuel 2018, 234, 549–557. [Google Scholar] [CrossRef]
  12. Xu, T.; Wu, Y.; Bhattacharya, S. Gasification kinetic modelling of Victorian brown coal chars and validity for entrained flow gasification in CO2. Int. J. Min. Sci. Technol. 2021, 31, 473–481. [Google Scholar] [CrossRef]
  13. Liu, J.; Hou, Q.; Ju, M.; Ji, P.; Sun, Q.; Li, W. Biomass Pyrolysis Technology by Catalytic Fast Pyrolysis, Catalytic Co-Pyrolysis and Microwave-Assisted Pyrolysis: A Review. Catalysts 2020, 10, 742. [Google Scholar] [CrossRef]
  14. Sekar, M.; Mathimani, T.; Alagumalai, A.; Chi, N.T.L.; Duc, P.A.; Bhatia, S.K.; Brindhadevi, K.; Pugazhendhi, A. A review on the pyrolysis of algal biomass for biochar and bio-oil—Bottlenecks and scope. Fuel 2021, 283, 119190. [Google Scholar] [CrossRef]
  15. Fahmy, T.Y.A.; Fahmy, Y.; Mobarak, F.; El-Sakhawy, M.; Abou-Zeid, R.E. Biomass pyrolysis: Past, present, and future. Environ. Dev. Sustain. 2020, 22, 17–32. [Google Scholar] [CrossRef]
  16. Xu, T.; Srivatsa, S.C.; Bhattacharya, S. In-situ synchrotron IR study on surface functional group evolution of Victorian and Thailand low-rank coals during pyrolysis. J. Anal. Appl. Pyrolysis 2016, 122, 122–130. [Google Scholar] [CrossRef]
  17. Park, K.-B.; Jeong, Y.-S.; Guzelciftci, B.; Kim, J.-S. Two-stage pyrolysis of polystyrene: Pyrolysis oil as a source of fuels or benzene, toluene, ethylbenzene, and xylenes. Appl. Energy 2020, 259, 114240. [Google Scholar] [CrossRef]
  18. Guzelciftci, B.; Park, K.-B.; Kim, J.-S. Production of phenol-rich bio-oil via a two-stage pyrolysis of wood. Energy 2020, 200, 117536. [Google Scholar] [CrossRef]
  19. Muhammad, I.; Manos, G. Improving the Conversion of Biomass in Catalytic Pyrolysis via Intensification of Biomass-Catalyst Contact by Co-Pressing. Catalysts 2021, 11, 805. [Google Scholar] [CrossRef]
  20. Xu, Y.; Zhai, M.; Guo, H.; Qi, H.; Zou, X.; Jin, S.; Dong, P. High-Temperature Pyrolysis Characteristics for a Single Biomass Particle. Energy Fuels 2019, 33, 11153–11162. [Google Scholar] [CrossRef]
  21. Safdari, M.-S.; Amini, E.; Weise, D.R.; Fletcher, T.H. Heating rate and temperature effects on pyrolysis products from live wildland fuels. Fuel 2019, 242, 295–304. [Google Scholar] [CrossRef]
  22. Mazlan, M.A.F.; Uemura, Y.; Osman, N.B.; Yusup, S. Fast pyrolysis of hardwood residues using a fixed bed drop-type pyrolyzer. Energy Convers. Manag. 2015, 98, 208–214. [Google Scholar] [CrossRef]
  23. Eri, Q.; Wang, B.; Peng, J.; Zhao, X.; Li, T. Detailed CFD modelling of fast pyrolysis of different biomass types in fluidized bed reactors. Can. J. Chem. Eng. 2018, 96, 2043–2052. [Google Scholar] [CrossRef]
  24. Liu, Y.; Chen, T.; Gao, B.; Meng, R.; Zhou, P.; Chen, G.; Zhan, Y.; Lu, W.; Wang, H. Comparison between hydrogen-rich biogas production from conventional pyrolysis and microwave pyrolysis of sewage sludge: Is microwave pyrolysis always better in the whole temperature range? Int. J. Hydrogen Energy 2021, 46, 23322–23333. [Google Scholar] [CrossRef]
  25. Sun, L.; Wang, Z.; Chen, L.; Yang, S.; Xie, X.; Gao, M.; Zhao, B.; Si, H.; Li, J.; Hua, D. Catalytic Fast Pyrolysis of Biomass into Aromatic Hydrocarbons over Mo-Modified ZSM-5 Catalysts. Catalysts 2020, 10, 1051. [Google Scholar] [CrossRef]
  26. Rahman, M.; Liu, R.; Cai, J. Catalytic fast pyrolysis of biomass over zeolites for high quality bio-oil—A review. Fuel Processing Technol. 2018, 180, 32–46. [Google Scholar] [CrossRef]
  27. Mihalcik, D.J.; Mullen, C.A.; Boateng, A.A. Screening acidic zeolites for catalytic fast pyrolysis of biomass and its components. J. Anal. Appl. Pyrolysis 2011, 92, 224–232. [Google Scholar] [CrossRef]
  28. Naqvi, S.R.; Uemura, Y.; Yusup, S.; Sugiura, Y.; Nishiyama, N. In situ catalytic fast pyrolysis of paddy husk pyrolysis vapors over MCM-22 and ITQ-2 zeolites. J. Anal. Appl. Pyrolysis 2015, 114, 32–39. [Google Scholar] [CrossRef]
  29. Li, Q.; Faramarzi, A.; Zhang, S.; Wang, Y.; Hu, X.; Gholizadeh, M. Progress in catalytic pyrolysis of municipal solid waste. Energy Convers. Manag. 2020, 226, 113525. [Google Scholar] [CrossRef]
  30. Li, S.; Sanna, A.; Andrésen, J.M. Influence of temperature on pyrolysis of recycled organic matter from municipal solid waste using an activated olivine fluidized bed. Fuel Processing Technol. 2011, 92, 1776–1782. [Google Scholar] [CrossRef]
  31. Liu, Y.; Yu, H.; Liu, J.; Chen, D. Catalytic characteristics of innovative Ni/slag catalysts for syngas production and tar removal from biomass pyrolysis. Int. J. Hydrogen Energy 2019, 44, 11848–11860. [Google Scholar] [CrossRef]
  32. Karcz, A.; Porada, S. Formation of C1-C3 hydrocarbons during pressure pyrolysis and hydrogasification in relation to structural changes in coal. Fuel 1995, 74, 806–809. [Google Scholar] [CrossRef]
  33. Li, J.; Yan, R.; Xiao, B.; Liang, D.T.; Lee, D.H. Preparation of Nano-NiO Particles and Evaluation of Their Catalytic Activity in Pyrolyzing Biomass Components. Energy Fuels 2008, 22, 16–23. [Google Scholar] [CrossRef]
  34. Li, J.; Yan, R.; Xiao, B.; Liang, D.T.; Du, L. Development of Nano-NiO/Al2O3 Catalyst to be Used for Tar Removal in Biomass Gasification. Environ. Sci. Technol. 2008, 42, 6224–6229. [Google Scholar] [CrossRef]
  35. Xu, T.; Xu, J.; Wu, Y. Hydrogen-Rich Gas Production from Two-Stage Catalytic Pyrolysis of Pine Sawdust with Calcined Dolomite. Catalysts 2022, 12, 131. [Google Scholar] [CrossRef]
  36. Sripada, P.; Xu, T.; Kibria, M.; Bhattacharya, S. Comparison of entrained flow gasification behaviour of Victorian brown coal and biomass. Fuel 2017, 203, 942–953. [Google Scholar] [CrossRef]
Figure 1. Effect of residence time on the distribution of pyrolysis products of pine sawdust at 850 °C without catalyst.
Catalysts 12 00256 g001
Figure 2. Effect of residence time on pyrolysis gas composition of pine sawdust at 850 °C without catalyst.
Catalysts 12 00256 g002
Figure 3. Effect of catalytic temperature on the distribution of pyrolysis products of pine sawdust.
Catalysts 12 00256 g003
Figure 4. Effect of catalytic temperature on pyrolysis gas composition of pine sawdust.
Catalysts 12 00256 g004
Figure 5. XRD patterns of nano-NiO/γ-A12O3.
Catalysts 12 00256 g005
Figure 6. The TEM image of the nanoparticles of the NiO.
Catalysts 12 00256 g006
Figure 7. Schematic diagram of the two-stage catalytic pyrolysis reactor [35].
Catalysts 12 00256 g007
Figure 8. The relationship between biomass velocity and speed of the secondary screw feeder [35].
Catalysts 12 00256 g008
Table 1. Effect of residence time on properties of gas products.
Residence Time (s)12172230
Syngas (H2 + CO) (%)56.3158.1059.6462.27
H2/CO (−)0.510.530.560.58
LHV (MJ/Nm3)13.4013.2913.5313.43
Dry gas yield (Nm3/kg)0.770.840.881.12
Carbon conversion (wt%)65.4872.5778.0385.25
Table 2. Effect of catalytic temperature on properties of gas products.
Catalytic Temperature (°C)No Catalyst500600700800
H2/CO (−)0.471.000.860.770.74
Syngas (H2 + CO) (%)45.4867.3476.8181.8484.28
Dry gas yield (Nm3/kg)0.360.580.620.780.97
Carbon conversion (wt%)34.2343.5748.0360.6773.06
LHV (MJ/Nm3)12.414.5914.2013.7312.70
Table 3. The properties of pine sawdust (air-dry basis).
SampleProximate Analysis (wt%)Ultimate Analysis (wt%)
MoistureVolatileFixed CarbonAshCHNS
Pine sawdust9.1862.2315.7711.8246.365.752.260.35
Table 4. The surface properties of γ-A12O3 and nano-NiO/γ-A12O3.
SamplesBET Surface Area
(m2/g)
Micropore Surface Area (m2/g)External Surface Area (m2/g)Pore Volume (cm2/g)
Support, γ-A12O3130.213.6117.20.42
Nano-NiO/γ-A12O3125.210.3114.90.39
Publisher’s Note: MDPI stays neutral with regard to jurisdictional claims in published maps and institutional affiliations.

