Article

Green Synthesis of Magnetite-Based Catalysts for Solar-Assisted Catalytic Wet Peroxide Oxidation

Departamento de Ingeniería Química y Química Física, Instituto Universitario de Investigación del Agua, Cambio Climático y Sostenibilidad (IACYS), Universidad de Extremadura, 06006 Badajoz, Spain
*
Author to whom correspondence should be addressed.
Catalysts 2022, 12(3), 271; https://doi.org/10.3390/catal12030271
Submission received: 17 January 2022 / Revised: 21 February 2022 / Accepted: 25 February 2022 / Published: 28 February 2022

Abstract

:
A novel synthesis method under green philosophy for the preparation of some magnetite-based catalysts (MBCs) is presented. The synthesis was carried out in aqueous media (i.e., absence of organic solvents) at room temperature with recovery of excess reactants. Terephthalic acid (H2BDC) was used to drive the synthesis route towards magnetite. Accordingly, bare magnetite (Fe3O4) and some hybrid magnetite-carbon composites were prepared (Fe3O4-G, Fe3O4-GO, and Fe3O4-AC). Graphene (G), graphene oxide (GO), and activated carbon (AC) were used as starting carbon materials. The recovered H2BDC and the as-synthetized MBCs were fully characterized by XRD, FTIR, Raman spectroscopy, XPS, SQUID magnetometry, TGA-DTA-MS, elemental analysis, and N2-adsorption-desorption isotherms. The recovered H2BDC was of purity high enough to be reused in the synthesis of MBCs. All the catalysts obtained presented the typical crystalline phase of magnetite nanoparticles, moderate surface area (63–337 m2 g−1), and magnetic properties that allowed their easy separation from aqueous media by an external magnet (magnetization saturation = 25–80 emu g−1). The MBCs were tested in catalytic wet peroxide oxidation (CWPO) of an aqueous solution of metoprolol tartrate (MTP) under simulated solar radiation. The Fe3O4-AC materials showed the best catalytic performance among the prepared MBCs, with MTP and total organic carbon (TOC) removals higher than 90% and 20%, respectively, after 3 h of treatment. This catalyst was fairly successfully reused in nine consecutive runs, though minor loss of activity was observed, likely due to the accumulation of organic compounds on the porous structure of the activated carbon and/or partial oxidation of surface Fe2+ sites.

Graphical Abstract

1. Introduction

Magnetite-based nanoparticles (NPs) find many applications in several areas such as biomedicine [1,2,3] and catalysis [4]. Taking advantage of their magnetic properties that allow easy, fast, and cost-effective recovery from the reaction medium, together with their chemical stability, low toxicity, and relatively low cost, a number of magnetite-based catalysts (MBCs) have been proposed to degrade aqueous organic pollutants by different advanced oxidation processes (AOPs) [5]. AOPs are chemical or photochemical processes that trigger the formation of short-lived reactive species (notably hydroxyl radicals, HO) able to degrade water pollutants. By far, since 2008, the most studied AOPs using MBCs have been heterogeneous Fenton and photo-Fenton processes, also called catalytic wet peroxide oxidation (CWPO) [6,7]. Although the mechanism of H2O2 decomposition over magnetite (Fe3O4) has not been fully elucidated yet, there is general agreement that surface ≡Fe2+ provokes the decomposition of H2O2 into HO [6,7,8]. Regeneration of surface ≡Fe2+ is typically the limiting step that controls the overall process efficiency. When radiation is applied (i.e., heterogeneous photo-Fenton process), the reduction rate of ≡Fe3+ is favored, increasing the formation rate of HO [7]. To enhance the catalytic properties of bare magnetite in CWPO reactions, several solids have been used to prepare supported or composite materials [6]. Among them, some carbon materials (e.g., activated carbon, biochar, carbon nanotubes, graphene, graphene oxide, or graphitic carbon nitride) have been investigated because of their high surface area and surface chemistry properties [7,8]. In addition to providing a greater surface area, favoring the dispersion of magnetite, and increasing the adsorption of organic contaminants, carbon structures may promote electron injection towards magnetite, thus enhancing the regeneration of ≡Fe2+ sites. Moreover, some carbon materials exhibit catalytic activity in CWPO by themselves [8].
Magnetite can be found in natural minerals or be artificially synthetized [6,7,9]. Synthesis methods are preferred in catalysis to obtain tailored magnetite and MBCs meeting specific properties such as surface area, porosity, particle size, or morphology. The most common synthesis procedures followed to prepare magnetic iron oxide NPs are sol-gel [10], hydrothermal or solvothermal reactions [11,12], thermal decomposition [13,14,15,16], and co-precipitation [17,18,19,20]. Similarly, magnetite-carbon composites are obtained by co-precipitation and hydrothermal and sol-gel syntheses [5]. Temperatures around 80–90 °C were applied to prepare graphene or activated carbon composites by co-precipitation [21,22], whereas a N2 stream at 90 °C was needed to prepare magnetic activated carbon composites by precipitation [23]. Magnetic activated carbon composites have also been prepared by activation of biowaste in the presence of iron salts in N2 atmosphere and at temperatures as high as 400–800 °C [24]. Generally, all these methods involve the use of organic solvents, moderate to high temperatures, and/or chemical reagents (e.g., H2O2, NaNO2, and Na2SO3). Even a more environmentally friendly method reported for the synthesis of magnetite NPs using vegetable extracts required moderate temperature (i.e., 80 °C) [25]. Therefore, the search for more sustainable and economic synthesis methods for MBCs is required to overcome the hurdle for the scale-up and optimization of processes catalyzed by these materials [26,27].
This work presented a novel, environmentally friendly synthesis method of MBCs based on a terephthalate intermediate as structure director. Green chemistry philosophy towards circular use of resources was applied with an almost full recovery of the synthesis mediator, terephthalic acid (H2BDC). The method was successfully used to prepare bare magnetite and different carbon-magnetite composites with activated carbon, graphene, and graphene oxide. Herein, fully characterization of the prepared MBCs and their use as catalysts in solar assisted-CWPO of aqueous solution of the drug metoprolol tartrate (MTP) were reported. Emphasis was placed on catalyst stability, separability, recovery, and reusability.

2. Results and Discussion

2.1. Synthesis of MBCs

Table 1 shows main conditions used for MBCs synthesis, mass yield (i.e., ratio of solid obtained with respect to its theoretical weight), and percentage of terephthalic acid recovered after the synthesis. In Table 1, G stands for graphene nanoplatelets, GO for graphene oxide, and AC for activated carbon. Subscript R refers to both recovered H2BDC in each batch synthesis and a MBC sample (Fe3O4-ACR) synthetized with H2BDC recovered from a previous synthesis batch. Typically, synthesis batches were designed to obtain c.a. 0.4 g Fe3O4 in each MBC sample (see Section 3.2). In addition, batches intended to procure higher amounts of catalyst were also carried out for comparative purposes. They are designated with the subscript L (i.e., larger amount). As seen in Table 1, the mass yield observed after the synthesis of most of the MBC samples was near 100%, meaning almost full utilization of the limiting reagent (i.e., iron salt) and carbonaceous support. The lower yield observed for the Fe3O4-GO composite might be related to the acidic character of GO in aqueous suspension being relatively instable in alkaline solution [28]. The separation of magnetic particles by an external magnet during the washing steps of the synthesis procedure was complete and no turbidity was observed in the washing solution. The use of H2BDC was crucial for successful synthesis of MBCs. Thus, preliminary tests demonstrated that magnetite was not formed at the conditions given in Table 1 but the absence of terephthalic acid. Therefore, it can be hypothesized that H2BDC mediates the generation of magnetite through the formation of a terephthalic intermediate, which favors the oxidation of Fe2+ at alkaline conditions with subsequent precipitation of Fe3O4 according to the following simplified set of reactions:
3 FeCl2 + 3 H2BDC + NaOH(ex) → 3 [Fe-BDC]*(s) + 6 HCl + NaOH(ex)
3 [Fe-BDC]*(s) + OH(ex) → Fe3O4(s) + 3 BDC2− + OH(ex)
After separation of the magnetic particles, the aqueous media contained terephthalate (see Reaction (2)) that was almost completely recovered after acidification with HCl to pH < 3 according to:
BDC2− + HCl(ex) → H2BDC(s) + HCl(ex)
The percentage of H2BDC recovered in any synthesis batch was higher than 95%, as shown in Table 1. The recovered solid was dried and characterized to confirm its purity. Figure 1 shows the X-ray diffraction (XRD) patterns (A) and Fourier-transformed infrared (FTIR) spectra (B) of pure and recovered terephthalic acid. All the diffraction peaks observed are ascribable to triclinic terephthalic acid indexed in the ICCD® (PDF 00-031-1916) with main contributions at 17.4 (110), 25.2 (011), and 27.9° (200) [29]. No other crystalline phases were found in the solid obtained [30]. Moreover, the FTIR spectra of pure H2BDC and recovered samples showed similar profiles with matching bands indicating also similar chemical structure. The broad band at 2250–3250 cm−1 can be attributed to stretching vibration of the –OH (carboxyl group) while other main bands located at 1680, 1575–1420, and 1285 cm−1 can be assigned to stretching vibrations of –C=O (carboxylic group), –C=C–, and –C–H bonds (aromatic structure), and–C–OH (acid), respectively [29,31]. In order to fully characterize the solid recovered (H2BDC-R), elemental analysis was performed and compared with that of pure terephthalic acid (H2BDC-t). As shown in Table 2, the percentages of C, H, and O found in the recovered solid were very close to the theoretical values of pure H2BDC. Another proof of the purity of the sample recovered after the synthesis of MBCs was obtained by dissolving the obtained solid in ultrapure water and analyzing the solution by HPLC, resulting in peak integration that did not differ by more than 2% from the calibration curve obtained with pure H2BDC. Additionally, the presence of iron compounds in the solid recovered was ruled out after the analysis of iron at ppb level in the aqueous solution prepared in ultrapure water.
All these characterization results pointed out the purity level of the terephthalic acid recovered. Accordingly, some subsequent synthesis batches were performed with the recovered solid and the required amount of make-up pure H2BDC. As an example, Table 1 shows the MBC labelled as Fe3O4-ACR. Both, the mass yield and the percentage of terephthalic recovered were as high as those for its homologous Fe3O4-AC sample obtained with pure commercial H2BDC only. Furthermore, characterization results of both MBC samples were very alike, as demonstrated by techniques shown in Section 2.2.
Another key aspect of the MBCs considered in this work is their easy preparation in large quantities, which eventually would lead to a scalable synthesis. As an example, the synthesis procedure proposed was successfully carried out in 1.4 L of total volume to obtain 13.7 g of a Fe3O4-ACL composite, which featured the same characteristics as its counterpart obtained at lower mass scale. See Table 1 for mass yield (99.9%) and terephthalic acid recovery (96%) and Section 2.2 for XRD patterns and textural properties of MBC samples.
In summary, the soft experimental conditions, the use of water as a solvent, the low toxicity of the materials used [32,33,34], and the efficient use of reagents and recovery of terephthalic acid are in clearly line of greener synthesis methods to obtain more environmentally friendly materials to be applied in large-scale processes [35,36,37,38].

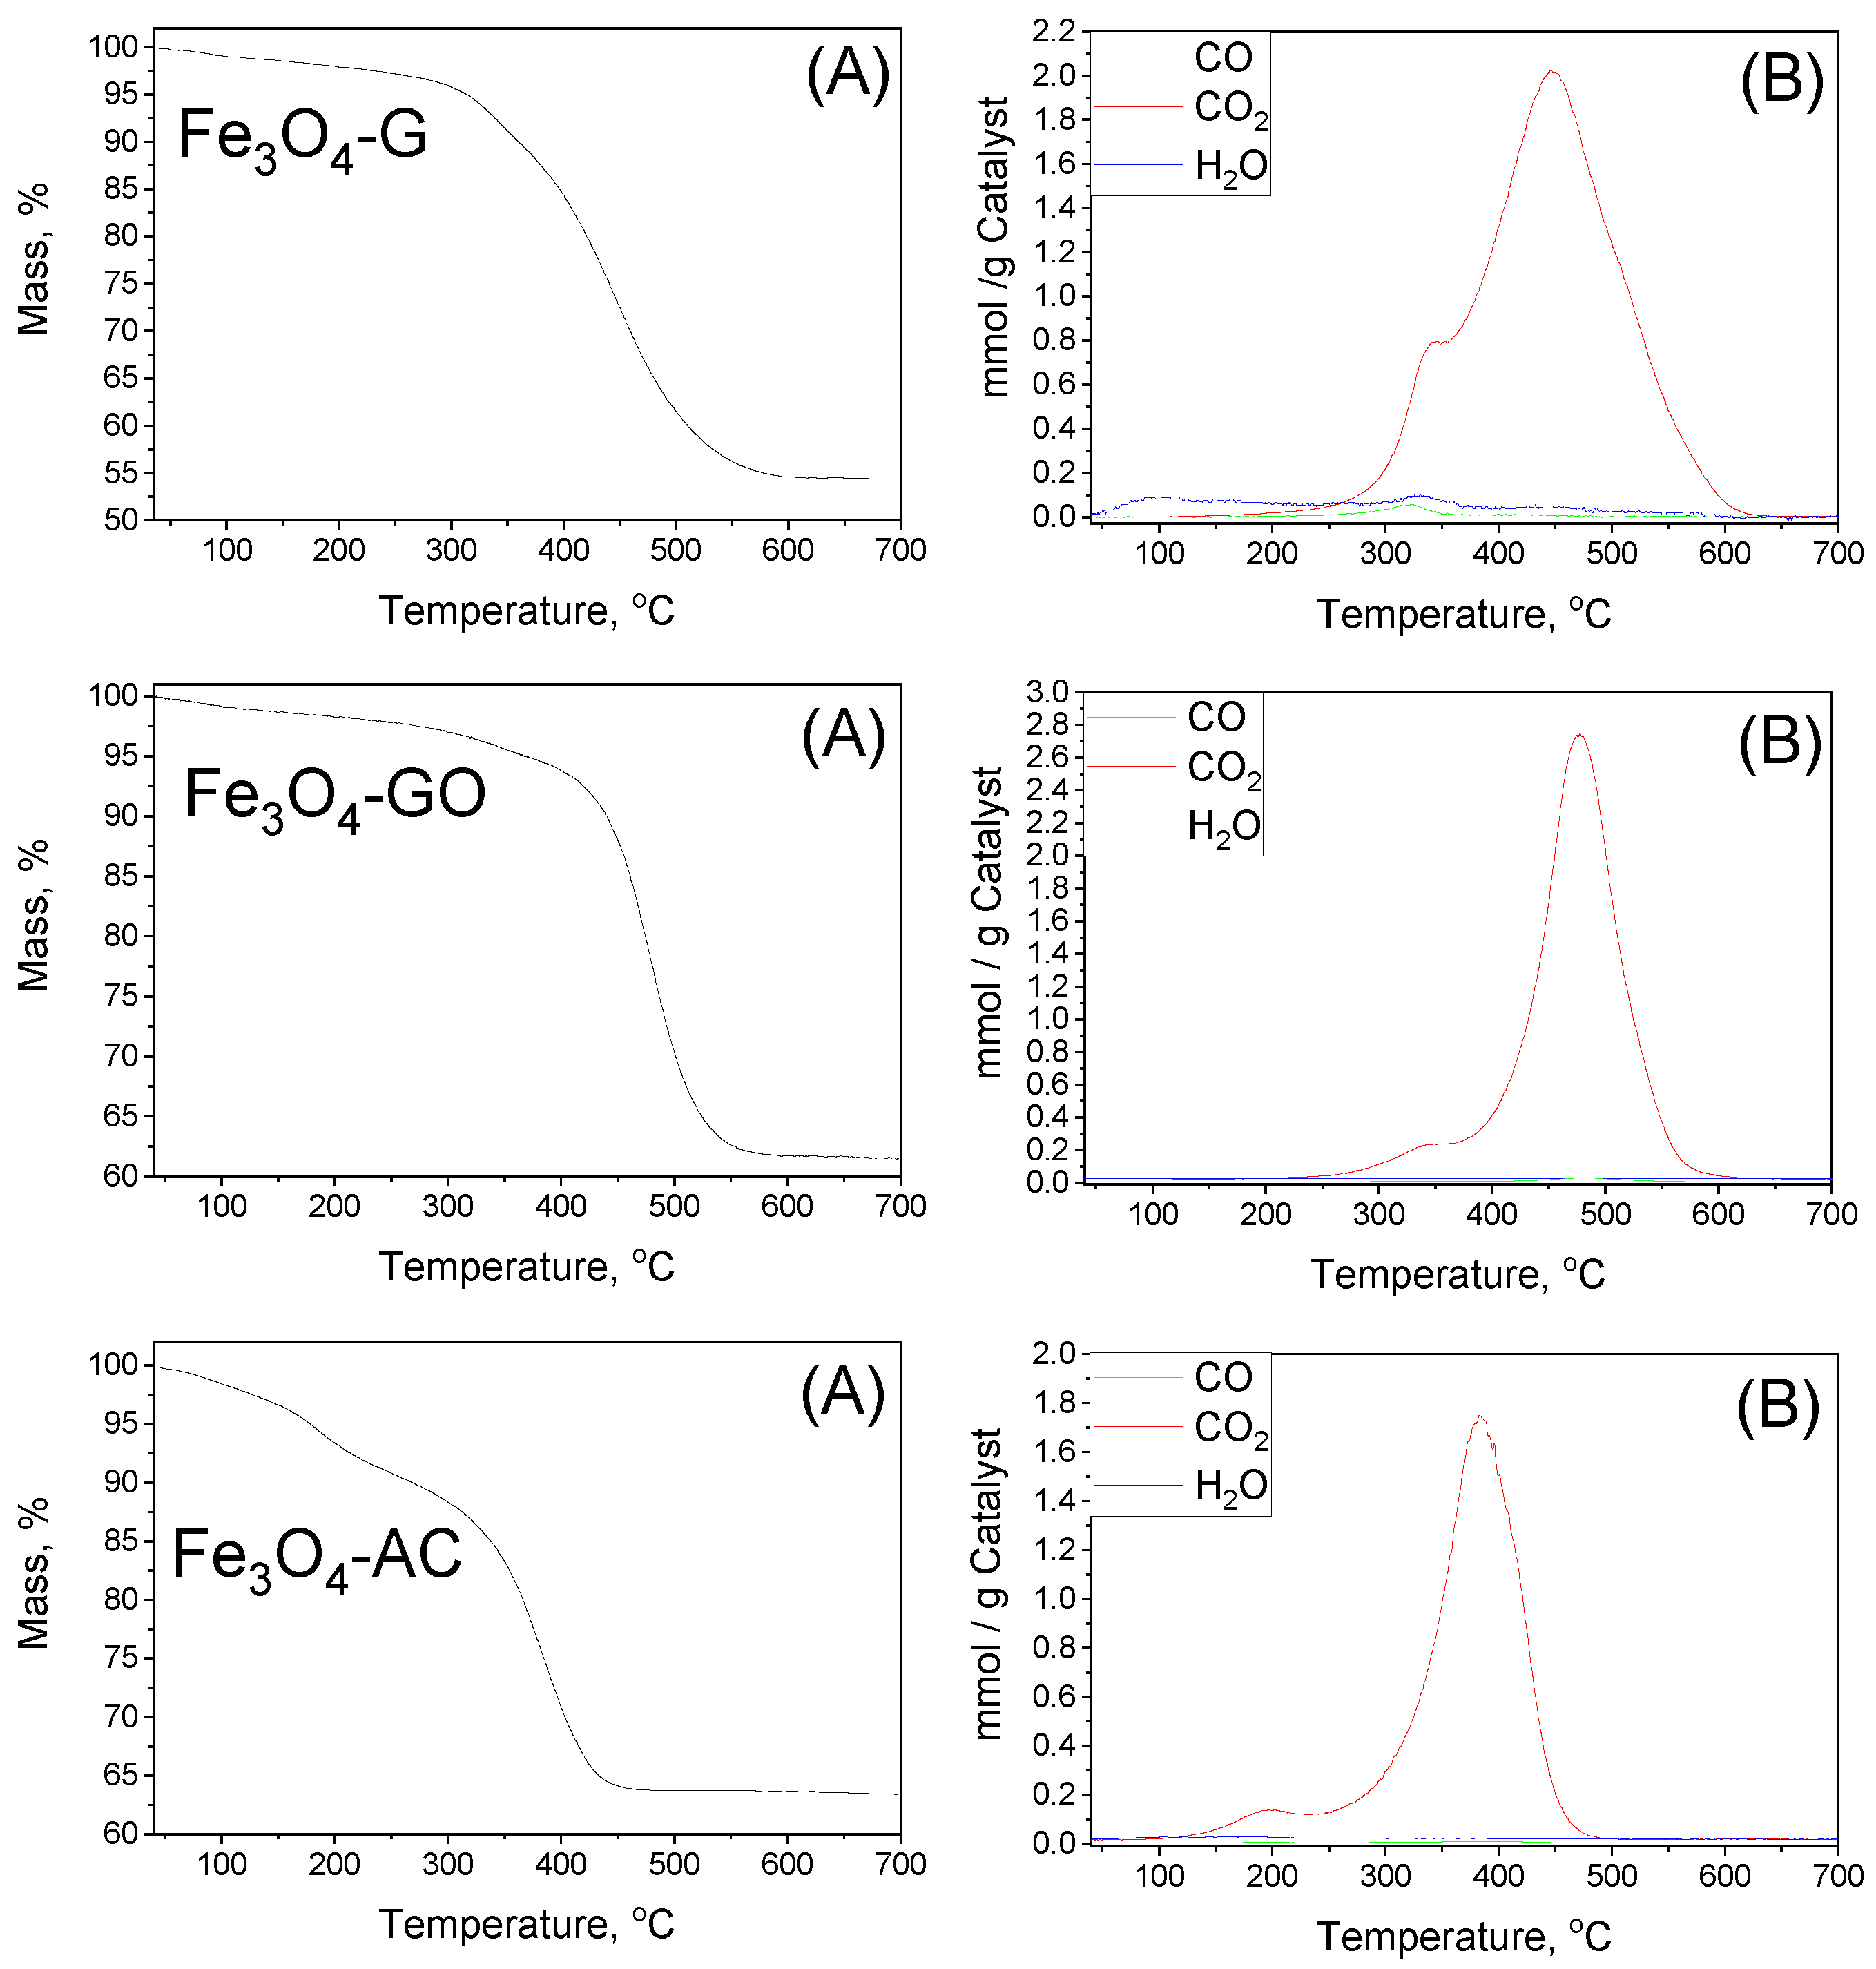
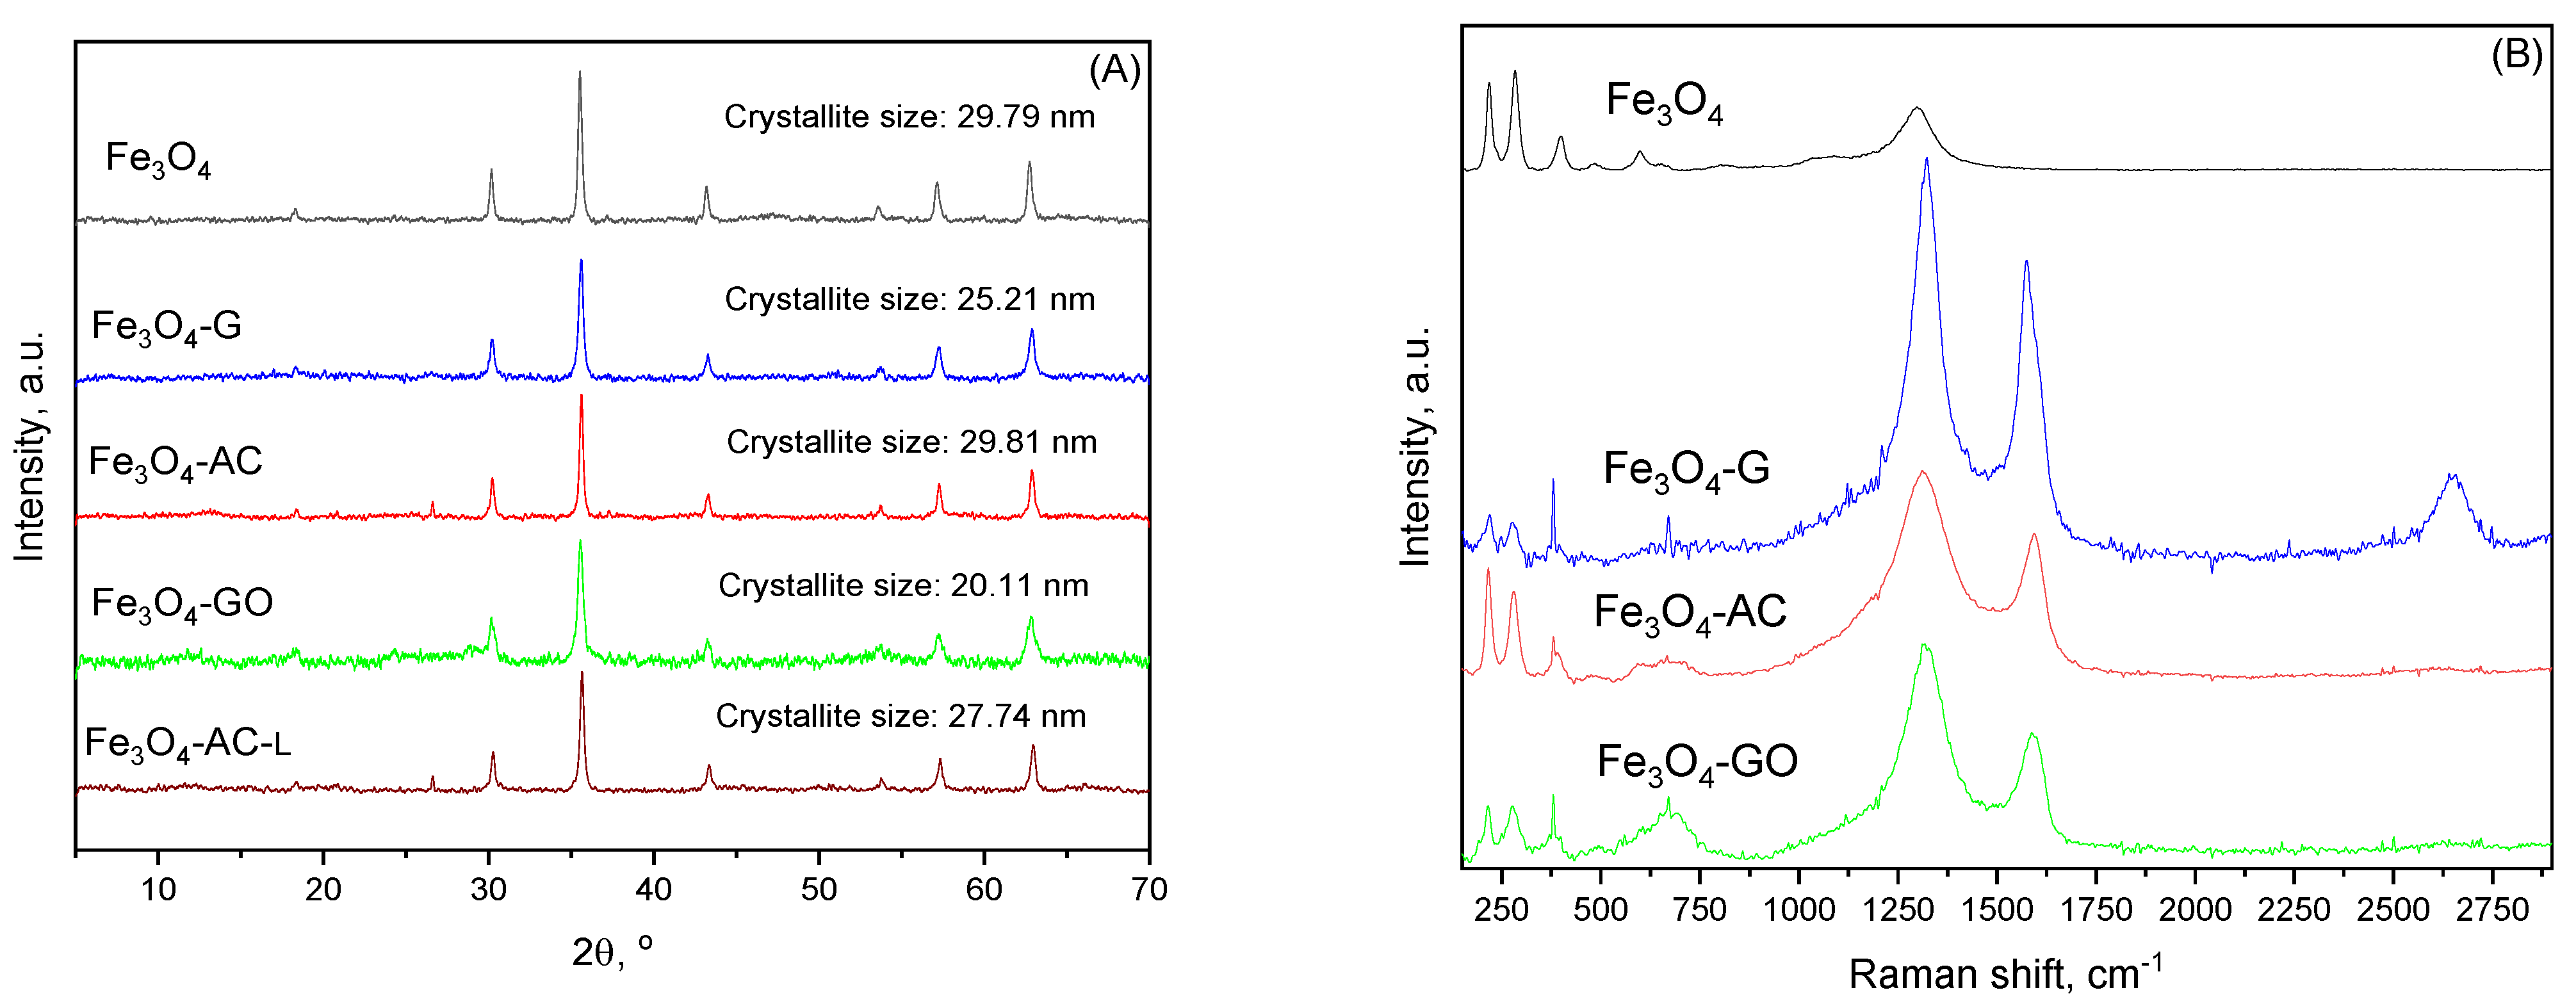
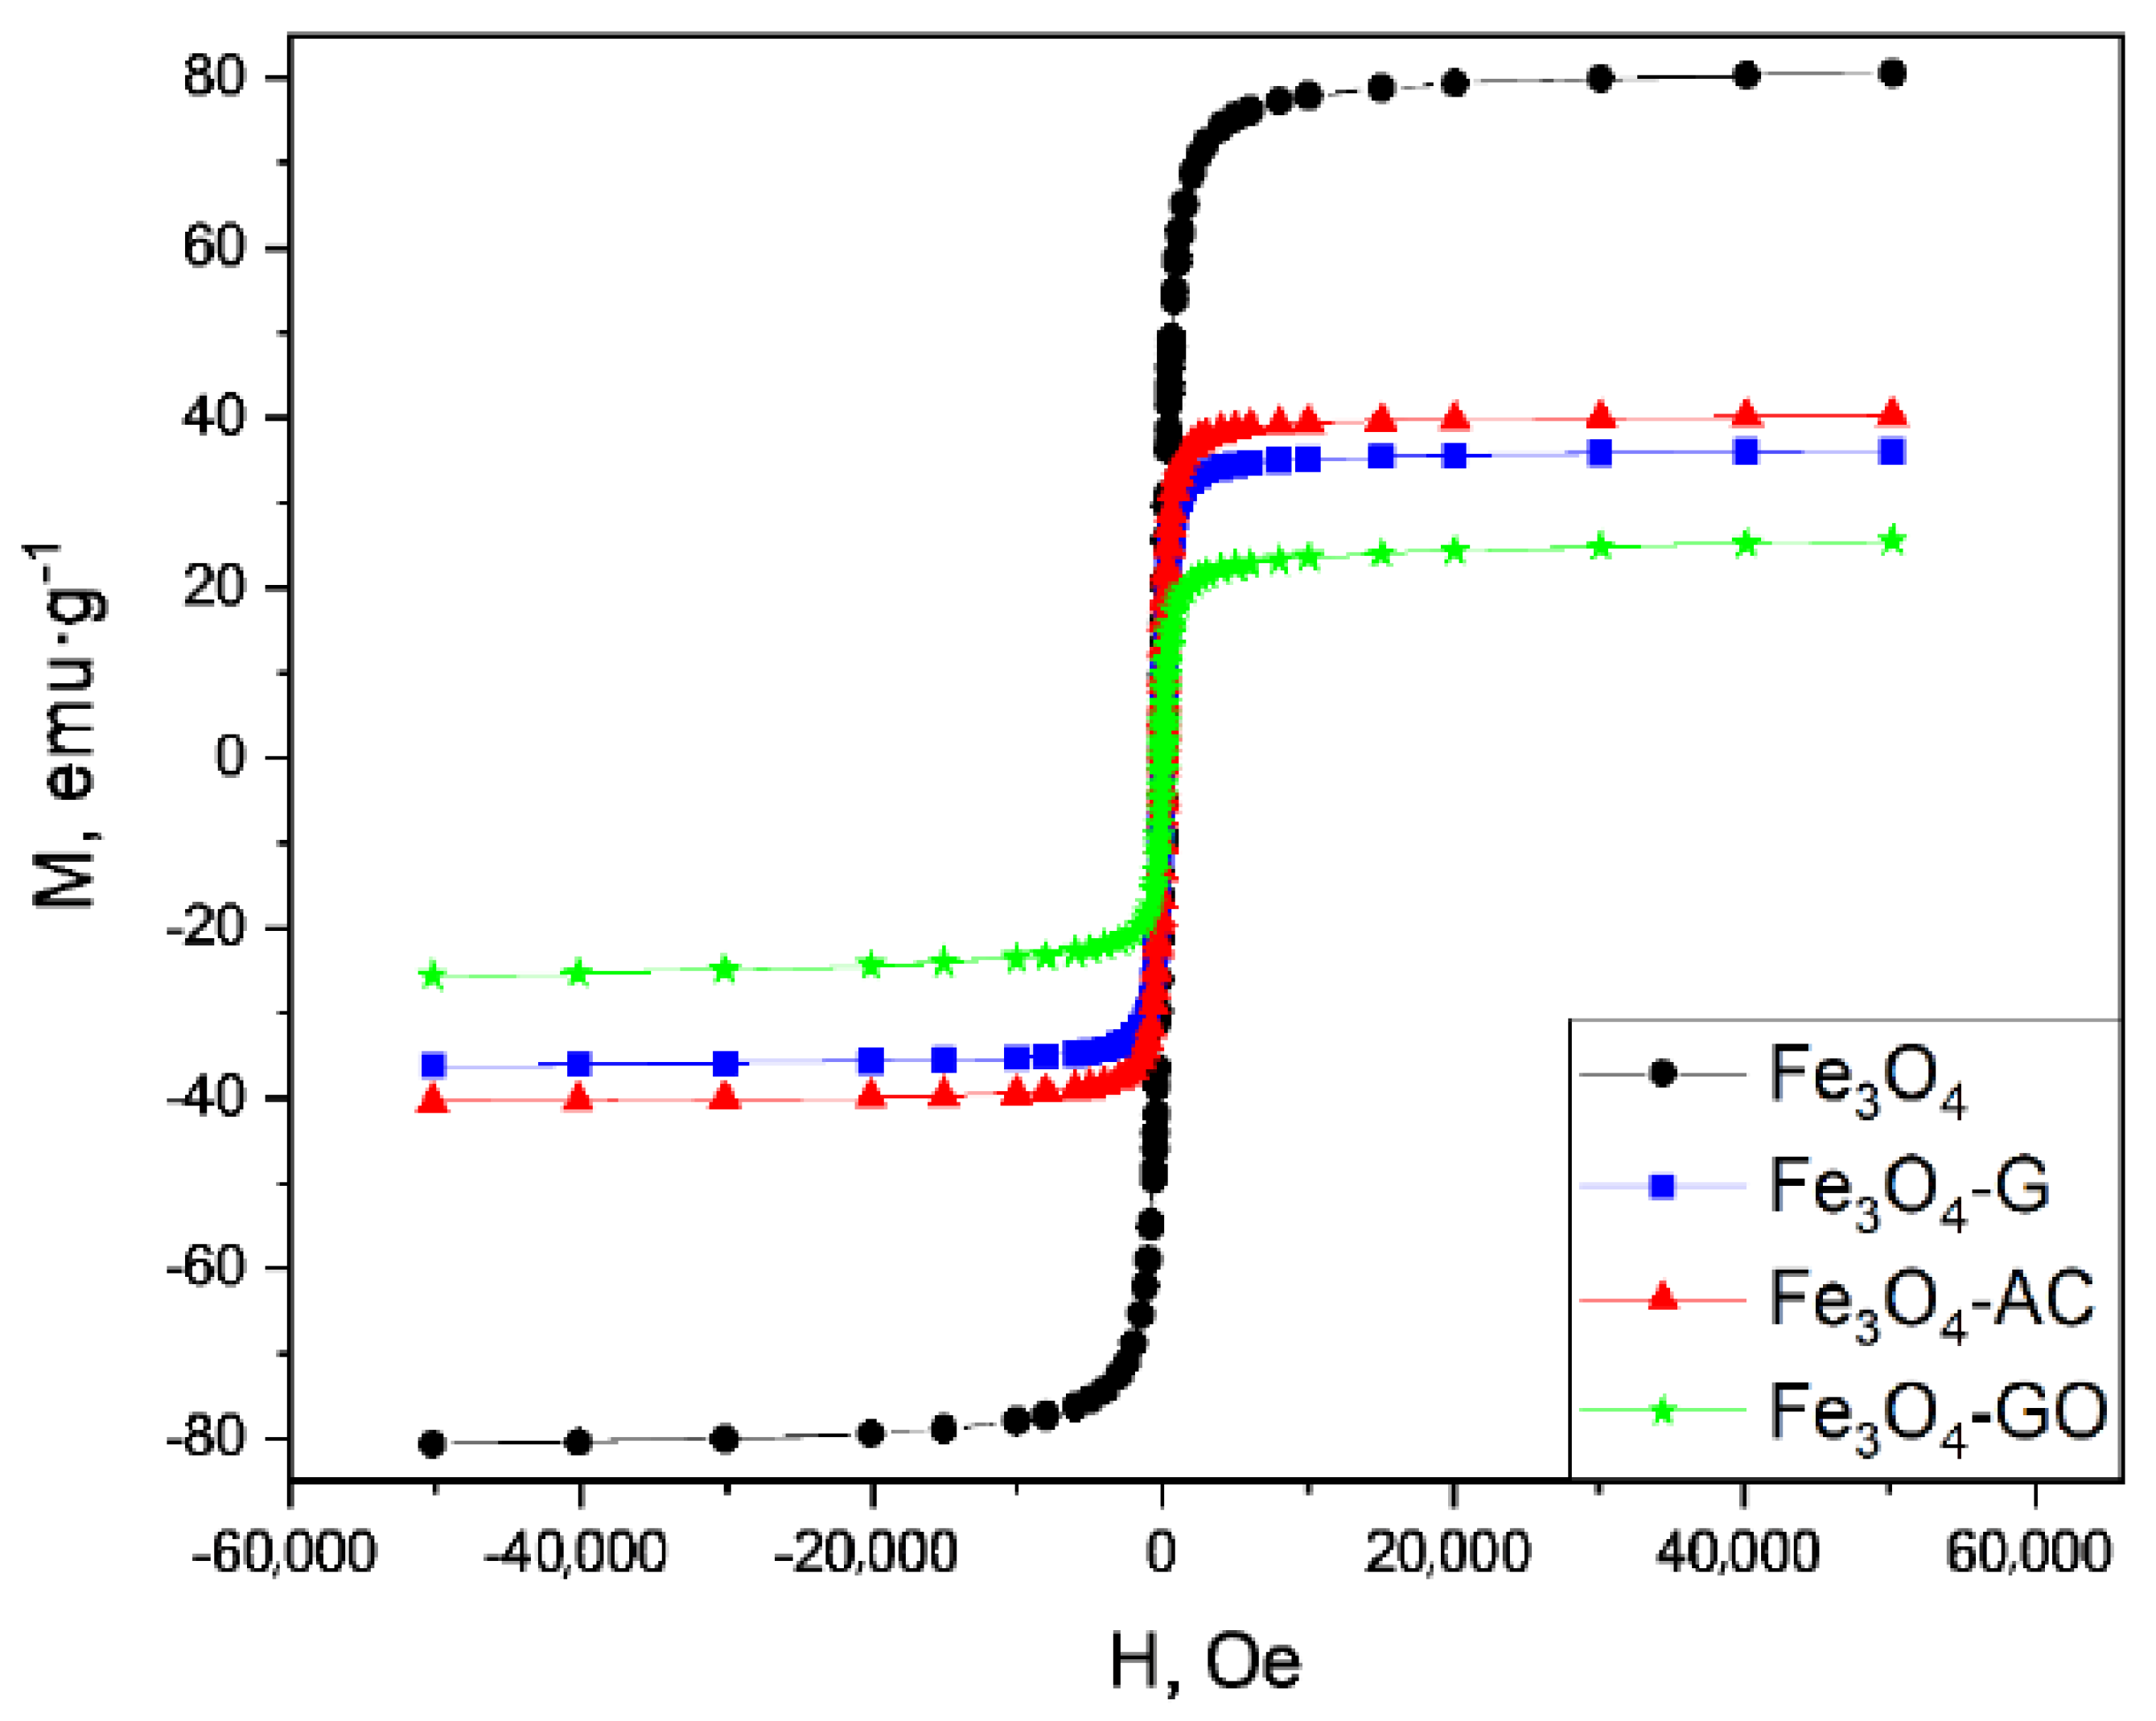
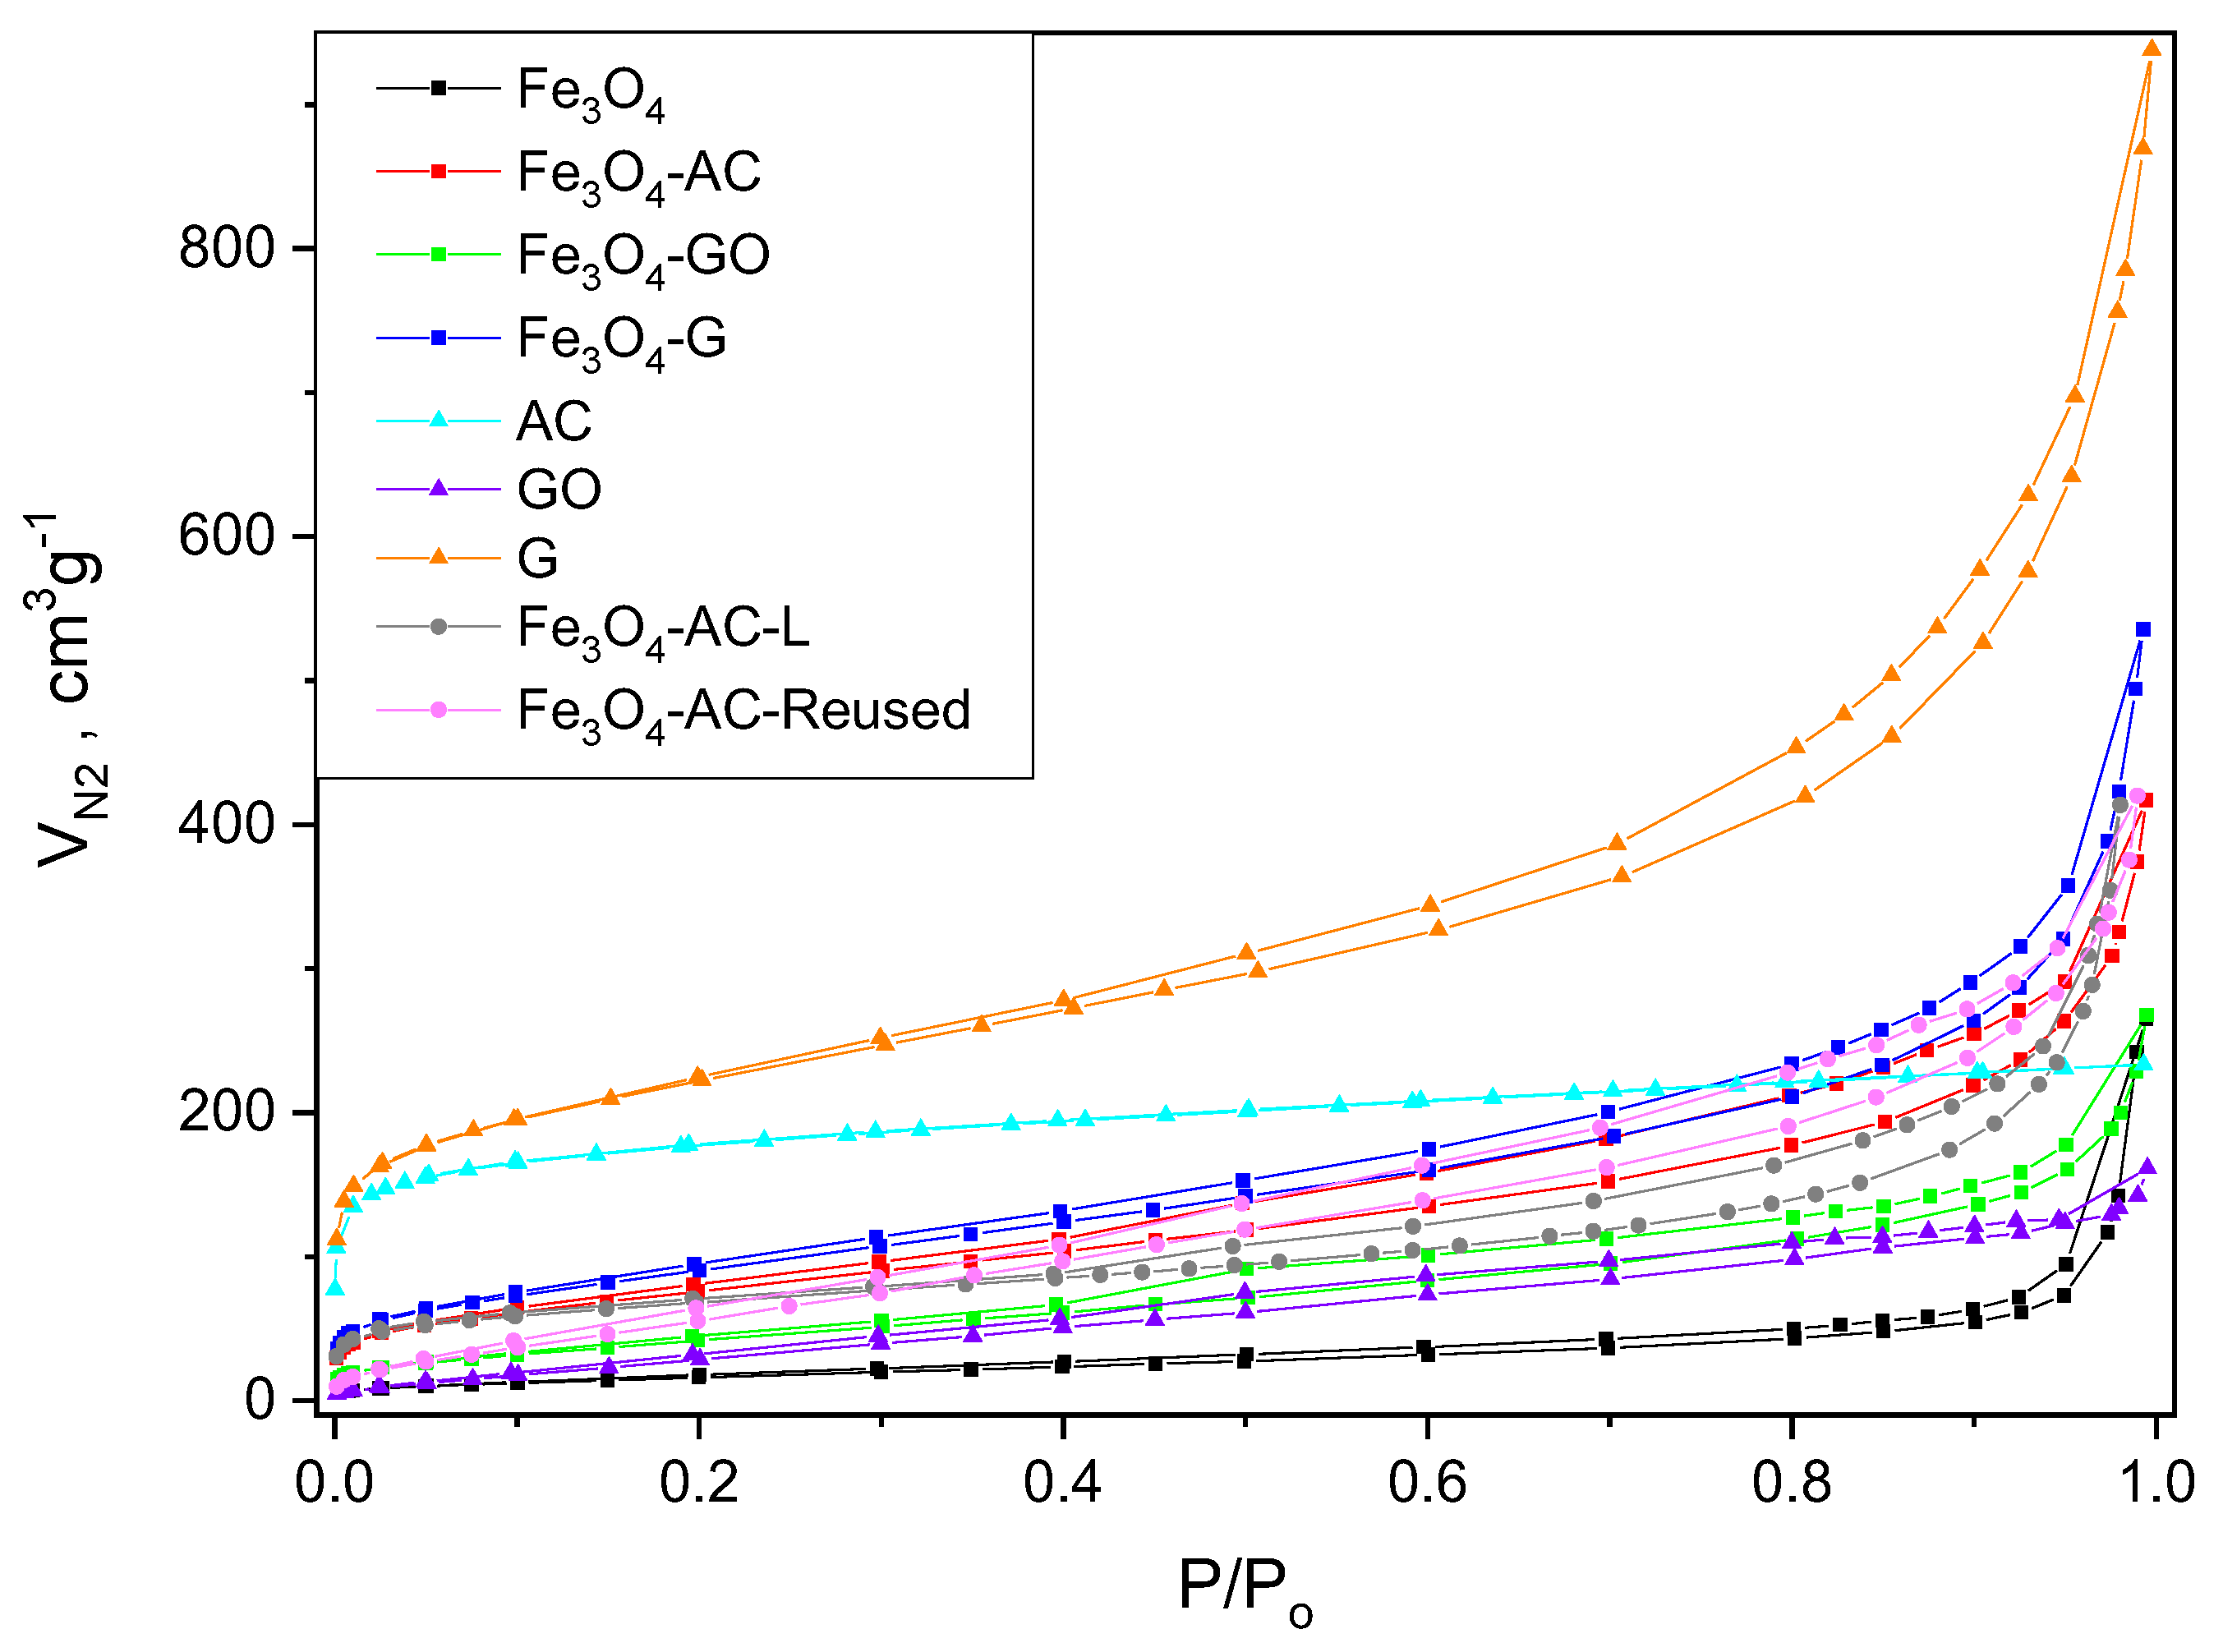
2.2. Characterization of MBCs

Elemental analysis (C, H, N) of the as-synthetized MBCs is presented in Table 3 together with the percentage of iron (also calculated as wt.% of Fe3O4), and the percentage of carbon calculated from the amounts of CO and CO2 detected by TGA-DTA-MS.
The bare iron material prepared (i.e., Fe3O4 sample) showed a very low carbon content as measured by elemental analysis and TGA-DTA-MS, indicating that most of the terephthalic acid precursor was removed during the washing procedure. This agrees with the high level of terephthalic acid recovered after the synthesis procedure. On the other hand, the carbon-containing MBCs presented carbon percentages that are consistent with their expected carbon content taking into account the relative amounts of carbon in G (90 wt.%), GO (53 wt.%), and AC (70 wt.%). Besides, the theoretical iron content of these composites is c.a. 41 wt.%, which is close to the actual values for Fe3O4-G and Fe3O4-AC samples. However, the Fe3O4-GO sample exhibited a somewhat higher iron content, which might be due to the modification of graphene oxygen groups during the synthesis method. The percentages of carbon in MBC samples were also corroborated by thermogravimetric and differential thermal analysis coupled to mass spectrometry (TGA-DTA-MS). The evolution of overall mass loss and CO, CO2, and H2O released upon heating in air flow are presented in Figure 2. The first mass loss event observed up to 150 °C can be ascribed to humidity, being more noticeable for the Fe3O4-GO sample. Then, there was another weight loss at 200–300 °C with liberation of H2O, CO, and CO2 that could be attributable to the decomposition of labile surface oxygen groups from the carbonaceous structure like carboxylic acids, with a greater presence in the GO material [39,40]. At higher temperatures, desorption of more stable oxygen groups and oxidation of the carbon materials takes place. The residue remaining after the TG analysis would most likely be composed of completely oxidized iron and ashes from carbonaceous materials (mostly in AC support).
At this point, it should be mentioned that the presence of minor amounts of residual terephthalic acid in MBC samples cannot be discarded. Sublimation of terephthalic acid took place as an endothermic process at 300–400 °C according with the TGA-DTA of pure H2BDC (Figure 3) in which neither CO2 nor CO were detected.
Regarding the crystalline structure of MBC samples, Figure 4 shows the XRD patterns (A) and Raman spectra (B) of some as-synthetized materials. The main reflection peaks observed in XRD at 2θ 30.2°, 35.5°, 43.2°, 53.6°, 57.1°, and 62.7° are fully ascribable to the cubic structure of magnetite according to PDF 01-075-0449 pattern file of the ICCD®. The presence of other iron species like maghemite would be evidenced by two additional peaks at 23.8° and 26.1° that do not appear in the patterns of Figure 4A [41]. Thus, although the presence of maghemite in the samples cannot be fully discarded, its content would be negligible. The XRD patterns also pointed out that the Fe3O4-GO sample presented the lowest crystallinity among the prepared MBCs with wider peaks even having a high percentage of iron. The crystallite size of magnetite in the materials was determined by the Scherrer’s equation from the (311) diffraction peak at 35.5° and the values obtained are shown in Figure 4A. As seen, they ranged from 20.1 nm for Fe3O4-GO to 29.8 nm for Fe3O4 and Fe3O4-G samples.
The Raman spectrum of the Fe3O4 sample showed their typical bands of magnetite at 630–660 cm−1 with a broad band around 1300 cm−1, also ascribable to a second-order peak of magnetite-like materials. Besides, traces of other iron oxide and hydroxide phases were deduced by the presence of the peaks at 219, 281, and 398 cm−1. Nevertheless, it should be kept in mind that the formation of these structures by oxidation during Raman analyses due to the heating of the laser beam cannot be discarded [42]. In addition to these bands related to iron species, the spectra of carbon-containing MBCs showed carbon D and G bands at 1309 and 1595 cm−1 respectively. Typically, the intensity ratio ID/IG from the areas of the corresponding bands are related to the frequency of defects in different carbon materials. In this case, the presence of the magnetite band at 1300 cm−1 overlapped with the D contribution, making the ID/IG ratio quantification difficult. Nonetheless, it can be easily noticed that the spectrum of the Fe3O4-G sample exhibited higher intensity of the G band, due to multi-layer arrangement, and the presence of the 2D band at 2646 cm−1 [40].
FTIR spectra of MBC samples is presented in Figure 5. This characterization technique might help discriminate between magnetite and maghemite. The intense band located at 570 cm−1 is ascribable to Fe–O–Fe from magnetite while the broad shoulder up to 750 cm−1 can be assigned to partially oxidized magnetite on the surface, with a stoichiometry approaching maghemite [43,44]. On the other hand, the bands located at 640 cm−1 and 725 cm−1, clearly visible in the spectra of Fe3O4-G and Fe3O4-GO samples but very subtle in that of Fe3O4-AC, suggest the presence of maghemite in the surface to some extent. In any case, the relative intensity of these IR bands and the findings from XRD results point out a minor contribution of maghemite to total iron oxide content in the synthetized samples. No important peaks were observed in the region between 2000–1000 cm−1 of the FTIR spectrum of the Fe3O4 sample, which indicates the lack of organic compounds on the surface [45]. Then, residual H2BDC remaining in the catalyst after the synthesis was expected to be of low significance. On the other hand, for the carbon composites the visible bands in the same wavenumber range can be most likely ascribed to different surface oxygen groups in the carbon structures, which are less abundant in the graphene composite [46,47]. Nevertheless, the presence of minor amounts of residual H2BDC in carbon MBCs, which was revealed in stability tests (see Section 2.3), is also consistent with FTIR results.
Magnetization hysteresis loops of some MBC samples are plotted in Figure 6, where it can be seen that saturation magnetization (MS) ranged from 25.6 emu g−1 (Fe3O4-GO) to 80.6 emu g−1 (Fe3O4). This latter value is in the typical range of magnetite NPs, which exhibit saturation magnetization from 60 to 90 emu g−1 depending on the morphology and particle size. In general, the higher the particle size, the higher the MS [44,48,49]. The Fe3O4 sample synthetized here, with crystal size near 30 nm, showed a saturation magnetization slightly higher than values reported for other magnetite samples with similar particle size [48]. On the other hand, the carbon-Fe3O4 hybrid materials presented lower saturation magnetization values. While the MS values observed for Fe3O4-G (36.1 emu g−1) and Fe3O4-AC (38.7 emu g−1) are consistent with the percentage of iron in these materials as determined by WDXRF (see Table 3), the saturation magnetization of the Fe3O4-GO composite was somewhat lower despite its higher content of iron. This can be explained by the smaller magnetite crystal size (see Figure 4A) and the possible presence of other iron species to some extent.
Finally, some main textural parameters obtained by N2 adsorption-desorption isotherms plotted in Figure 7 are summarized in Table 4. The results of the carbonaceous materials used as precursors have been added to the table for comparative purposes. First, it is apparent that the Fe3O4 sample displayed a type IV isotherm with a hysteresis loop typical of mesoporous materials, with a moderate surface area and very low micropore volume. On the other hand, the combination of magnetite with carbonaceous structures led to composites with higher surface areas according to the porous structure of the supports. These results are consistent with other magnetic-carbon composites reported in the literature [50]. Then, the largest BET area was obtained for Fe3O4-G followed by Fe3O4-AC and Fe3O4-GO. The values of surface area observed for Fe3O4-AC and Fe3O4-G samples with respect to their corresponding carbon supports (i.e., AC and G, respectively) were found proportional to the carbon content in the composite material.

2.3. Stability of MBCs in Water

The stability of the as-synthetized materials in water was studied at different conditions. First, long-term runs were carried out for 7 days in ultrapure water buffered solution at MBC concentration of 1 g L−1. Table 5 summarizes data of pH, concentration of H2BDC, Fe, and total organic carbon (TOC) after some experiments. Regardless of the pH, the concentration of H2BDC in solution after the runs carried out with the Fe3O4 sample was only about 1 mg L−1, which agrees with a small presence of residual terephthalate in the catalyst after the synthesis procedure (see FTIR results). On the other hand, the values of H2BDC in solution observed when carbon MBCs were brought into contact with water were significantly larger and they increased with the aqueous pH. This suggests that some amount of H2BDC adsorbed onto the carbonaceous materials can be favourably desorbed at alkaline conditions. If results of H2BDC recovery shown in Table 1 are considered, the maxima concentration of H2BDC observed after stability tests (i.e., at pH = 8–10) accounted for 78%, 62%, and 42% of the maximum releasable H2BDC from Fe3O4-G, Fe3O4-GO, and Fe3O4-AC, respectively. This proves alkaline desorption as a good alternative to remove residual H2BDC from the catalysts. Then, a sample of Fe3O4-AC was subjected to an additional washing step in NaOH solution (pH 10) and used in catalytic activity tests for comparative purposes (see Section 2.4).
A comparison between the concentration of H2BDC expressed as mg C L−1 (TOCH2BDC) and the actual TOC values provides an insight into the leaching of carbon moieties from the materials. In general, DiffTOC was within the experimental error range of the analytical method (i.e., ±0.5 mg L−1) suggesting that released carbon belonged mostly to H2BDC. However, much larger DiffTOC values were observed for Fe3O4-GO at neutral and alkaline conditions. This can be related to the instability of GO in water and its reaction in alkaline media resulting in the release of humic-like structures to aqueous solution [28]. Iron was analyzed in aqueous solution as dissolved iron (sample filtered through 0.45 μm PET membrane) and total iron (sample obtained by separation of the solid with a magnet). For samples from Fe3O4 runs, very low values of iron concentration were found, being no more than 0.2% of the maximum releasable amount according to the catalyst composition. The difference between total and dissolved iron was low, but still appreciable, especially at high pH. This can be due to some instability of the material at alkaline conditions likely because of partial transformation of magnetite into goethite or maghemite in a dissolution-precipitation process [51]. This effect was also observed for Fe3O4-AC to a similar extent. However, the difference between total and dissolved iron greatly increased in tests performed with graphene-based materials. In the case of Fe3O4-G, at pH 8 and 10, values of total Fe higher than 4 mg L−1 suggest the formation of iron oxide precipitates. Additionally, mechanical breakdown of the small particles (i.e., the graphene used as starting material had a particle size less than 2 µm) must be considered. Finally, in the case of Fe3O4-GO, regardless of pH, a higher amount of total iron as solid structures (>4 mg L−1) was detected compared with dissolved iron (<0.15 mg L−1). A combination of the above-mentioned effects together with the intrinsic instability of GO in water might be responsible of such iron leaching from the catalyst [28,51].
A key aspect in the performance of a catalyst is its stability under actual reaction conditions. The MBCs here prepared were intended for CWPO processes. Thus, the stability of the materials in the presence of O2 and H2O2 under simulated solar radiation was explored. For that, MBC samples were brought into contact with ultrapure water under agitation for 30 min. Then, oxygen was bubbled, H2O2 was added (if necessary), and the aqueous suspension was irradiated for 3 h. Table 6 shows the concentration of H2BDC, TOC, and pH after some tests. Dissolved iron and total iron were always lower than 0.05 mg L−1 and 0.1 mg L−1, respectively. In this regard, it should be noticed that lower solid loadings were used (0.2 g L−1) compared with the previous long-term assays summarized in Table 5.
In general, from Table 6 the desorption of some terephthalic acid from the materials during the initial 30 min dark stage (see H2BDC data at time 0) can be noticed. This effect was particularly evident for the Fe3O4-G sample. The amount of H2BDC in solution remained practically unchanged after the treatment with Rad + O2 experiments but decreased significantly in Rad + O2 + H2O2 runs as a result of H2BDC oxidation by HO generated in photo-Fenton reactions [52]. Contrarily, TOC increased especially in Rad + O2 + H2O2 runs because of breakdown of terephthalate molecule into smaller organic acids (see pH drops in Table 6) and HO attack to carbon structures. In any case, Fe3O4-AC resulted in the highest stability among the three carbon MBCs synthesized in this work.

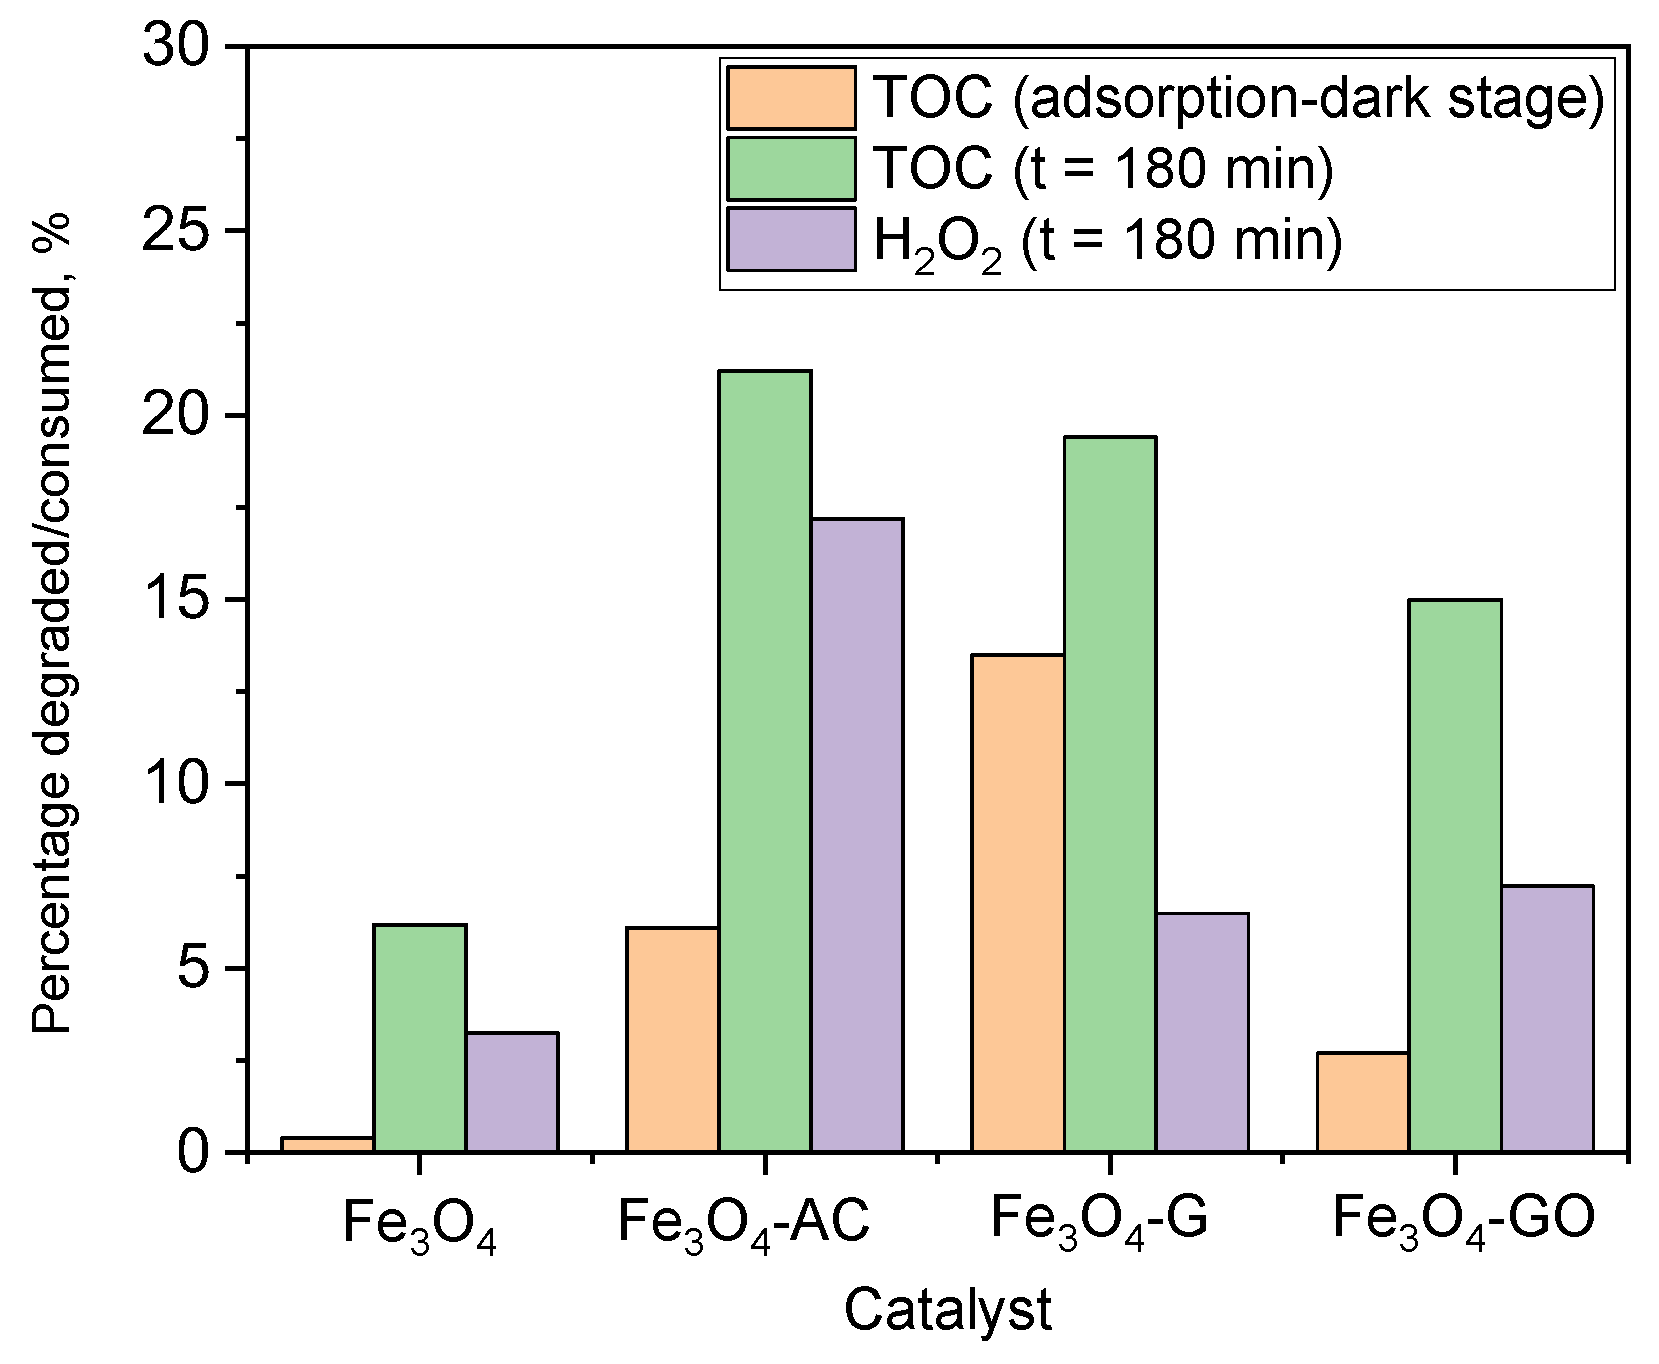
2.4. Catalytic Activity of MBCs in CWPO Processes

The catalytic activity of the as-prepared MBCs was studied for the degradation of MTP by heterogeneous Fenton and photo-Fenton processes. According to the accepted mechanism for these AOPs, the following reactions can be considered [7]:
≡Fe2+ + H2O2 → ≡Fe3+ + OH + HO
≡Fe3+ + H2O2 → ≡Fe2+ + H+ + HO2
HO2 + OH → H2O + O2•−
where ≡Fe3+ and ≡Fe2+ represents the iron species on the catalyst surface. On the other hand, iron oxides can act as photocatalysts in the presence of UV-vis radiation:
≡Fe3+/≡Fe2+ + hυ → ≡Fe3+/≡Fe2+ + h+ + e
e− + O2 → O2•−
2 O2•− + 2H+ → H2O2 + O2
e (O2•−) + H2O2 → OH + HO (+ O2)
Moreover, radiation favors the regeneration of ≡Fe2+ on the catalyst surface, increasing the generation of hydroxyl radicals:
≡Fe3+ + hυ + OH → ≡Fe2+ + HO
The hydroxyl radicals generated through Reactions (4), (10), and (11) will be the main ones responsible for MTP degradation in aqueous media.
The evolution of MTP during dark CWPO and photo-CWPO using the four materials is depicted in Figure 8. It should be noticed that prior to oxidation runs, adsorption experiments in the dark were carried out to establish an adequate time for MTP adsorption equilibrium. This was nearly reached in 30 min using any of the four MBCs (not shown), with MTP removals of 17% for Fe3O4-G, 12% for Fe3O4-AC, 8% for Fe3O4-GO, and less than 3% for Fe3O4. In addition, blank experiments of MTP with H2O2 both in the presence and absence of simulated solar radiation were carried out and negligible MTP removal was observed. As is apparent from Figure 8A, the catalytic activity of Fe3O4 in dark CWPO at room temperature (i.e., 20 °C) was rather low with only 5% of MTP conversion in 3 h, likely due to a slow ≡Fe3+/≡Fe2+ redox cycle (Reaction (5)) [53]. The presence of carbon structures in MBCs increased their adsorption capacity (see decrease in MTP concentration from −30 to 0 min in Figure 8) and the reaction rate of MTP removal to some extent (see data from 0 to 180 min in Figure 8A). However, the activity was still unsatisfactory for practical applications at the mild conditions of this work (i.e., ambient temperature and initial pH 7) with less than 35% overall MTP removal and negligible mineralization (i.e., TOC removal) in 3 h. In this sense, it is well-known that optimum pH for Fenton reactions is near 3 and that higher temperature (i.e., 50–90 °C) would be also required to increase the efficiency of the catalytic activity of MBCs [6]. As expected from Reactions (7)–(11), simulated solar radiation greatly enhanced the process efficiency. Thus, MTP removals between 40% and 95% were observed depending on the MBC used (Figure 8B). In this case, the beneficial effect of carbon structures over bare Fe3O4 goes beyond the increase in the adsorption capacity of MTP. Table 7 shows the pseudo-first-order apparent rate constant of MTP removal for the four synthetized materials. As shown, the best results in terms of MTP removal rate were found for Fe3O4-GO and Fe3O4-AC composites.
TOC adsorbed onto the catalysts during the initial dark stage and overall TOC removal after the 180 min photo-treatment are presented in Figure 9. It is apparent that overall TOC removal achieved in the process catalyzed by Fe3O4 was rather low though significantly increased using the carbon composites. Thus, the highest TOC removal (21%) was obtained with the Fe3O4-AC catalyst.
An efficient use of H2O2 is a key aspect in the performance of CWPO processes. In this work, the efficient use of H2O2 was examined by a mineralization efficiency factor defined as TOC removed (mol C) per mol of H2O2 consumed, η-TOC-H2O2. According to the stoichiometry of the theoretical reaction between MTP and H2O2 to yield CO2 and H2O (i.e., mineralization), a η-TOC-H2O2 value of 0.38 mol C/mol H2O2 was calculated. This represents the maximum attainable efficiency factor. As can be seen in Table 7, actual η-TOC-H2O2 values were well below this maximum because of inefficient H2O2 decomposition and HO reactions (e.g., H2O2 auto-scavenging effect, termination steps of the free radical reaction mechanism, and HO reactions with carbon materials). Comparing the different MBCs, the highest efficiency was achieved with Fe3O4-G, likely due to its higher surface area and MTP adsorption capacity. Moreover, higher inefficient consumption of H2O2 was expected for Fe3O4-AC according to previous studies [54].
As discussed before, the degradation of MTP takes place mainly through the attack of hydroxyl radicals formed from H2O2 decomposition. Several steps are expected until complete MTP mineralization, which involve the formation of different intermediate compounds. The final degradation step intermediates are usually short-chain organic acids like oxalic, acetic, and formic acids [55,56]. As shown in Table 8, noticeable concentrations of these acids were found after 3 h of treatment, being formic acid predominant. It should be pointed out that oxalic acid might be fast degraded during iron-photocatalytic treatments through the ligand-charge-metal transition mechanism, which also favor mineralization and reduce the iron leaching [57,58]. Total iron and terephthalic acid released into the reaction medium were also analyzed and presented in Table 8. As observed, the concentration of total iron was lower than 0.12 mg L−1 regardless of the material used. At such low concentrations, contribution of homogeneous photo-Fenton reactions to MTP degradation was negligible. The amount of H2BDC remaining in solution after CWPO runs was also small, the highest value found in the Fe3O4-G run being in agreement with results discussed in Section 2.3.

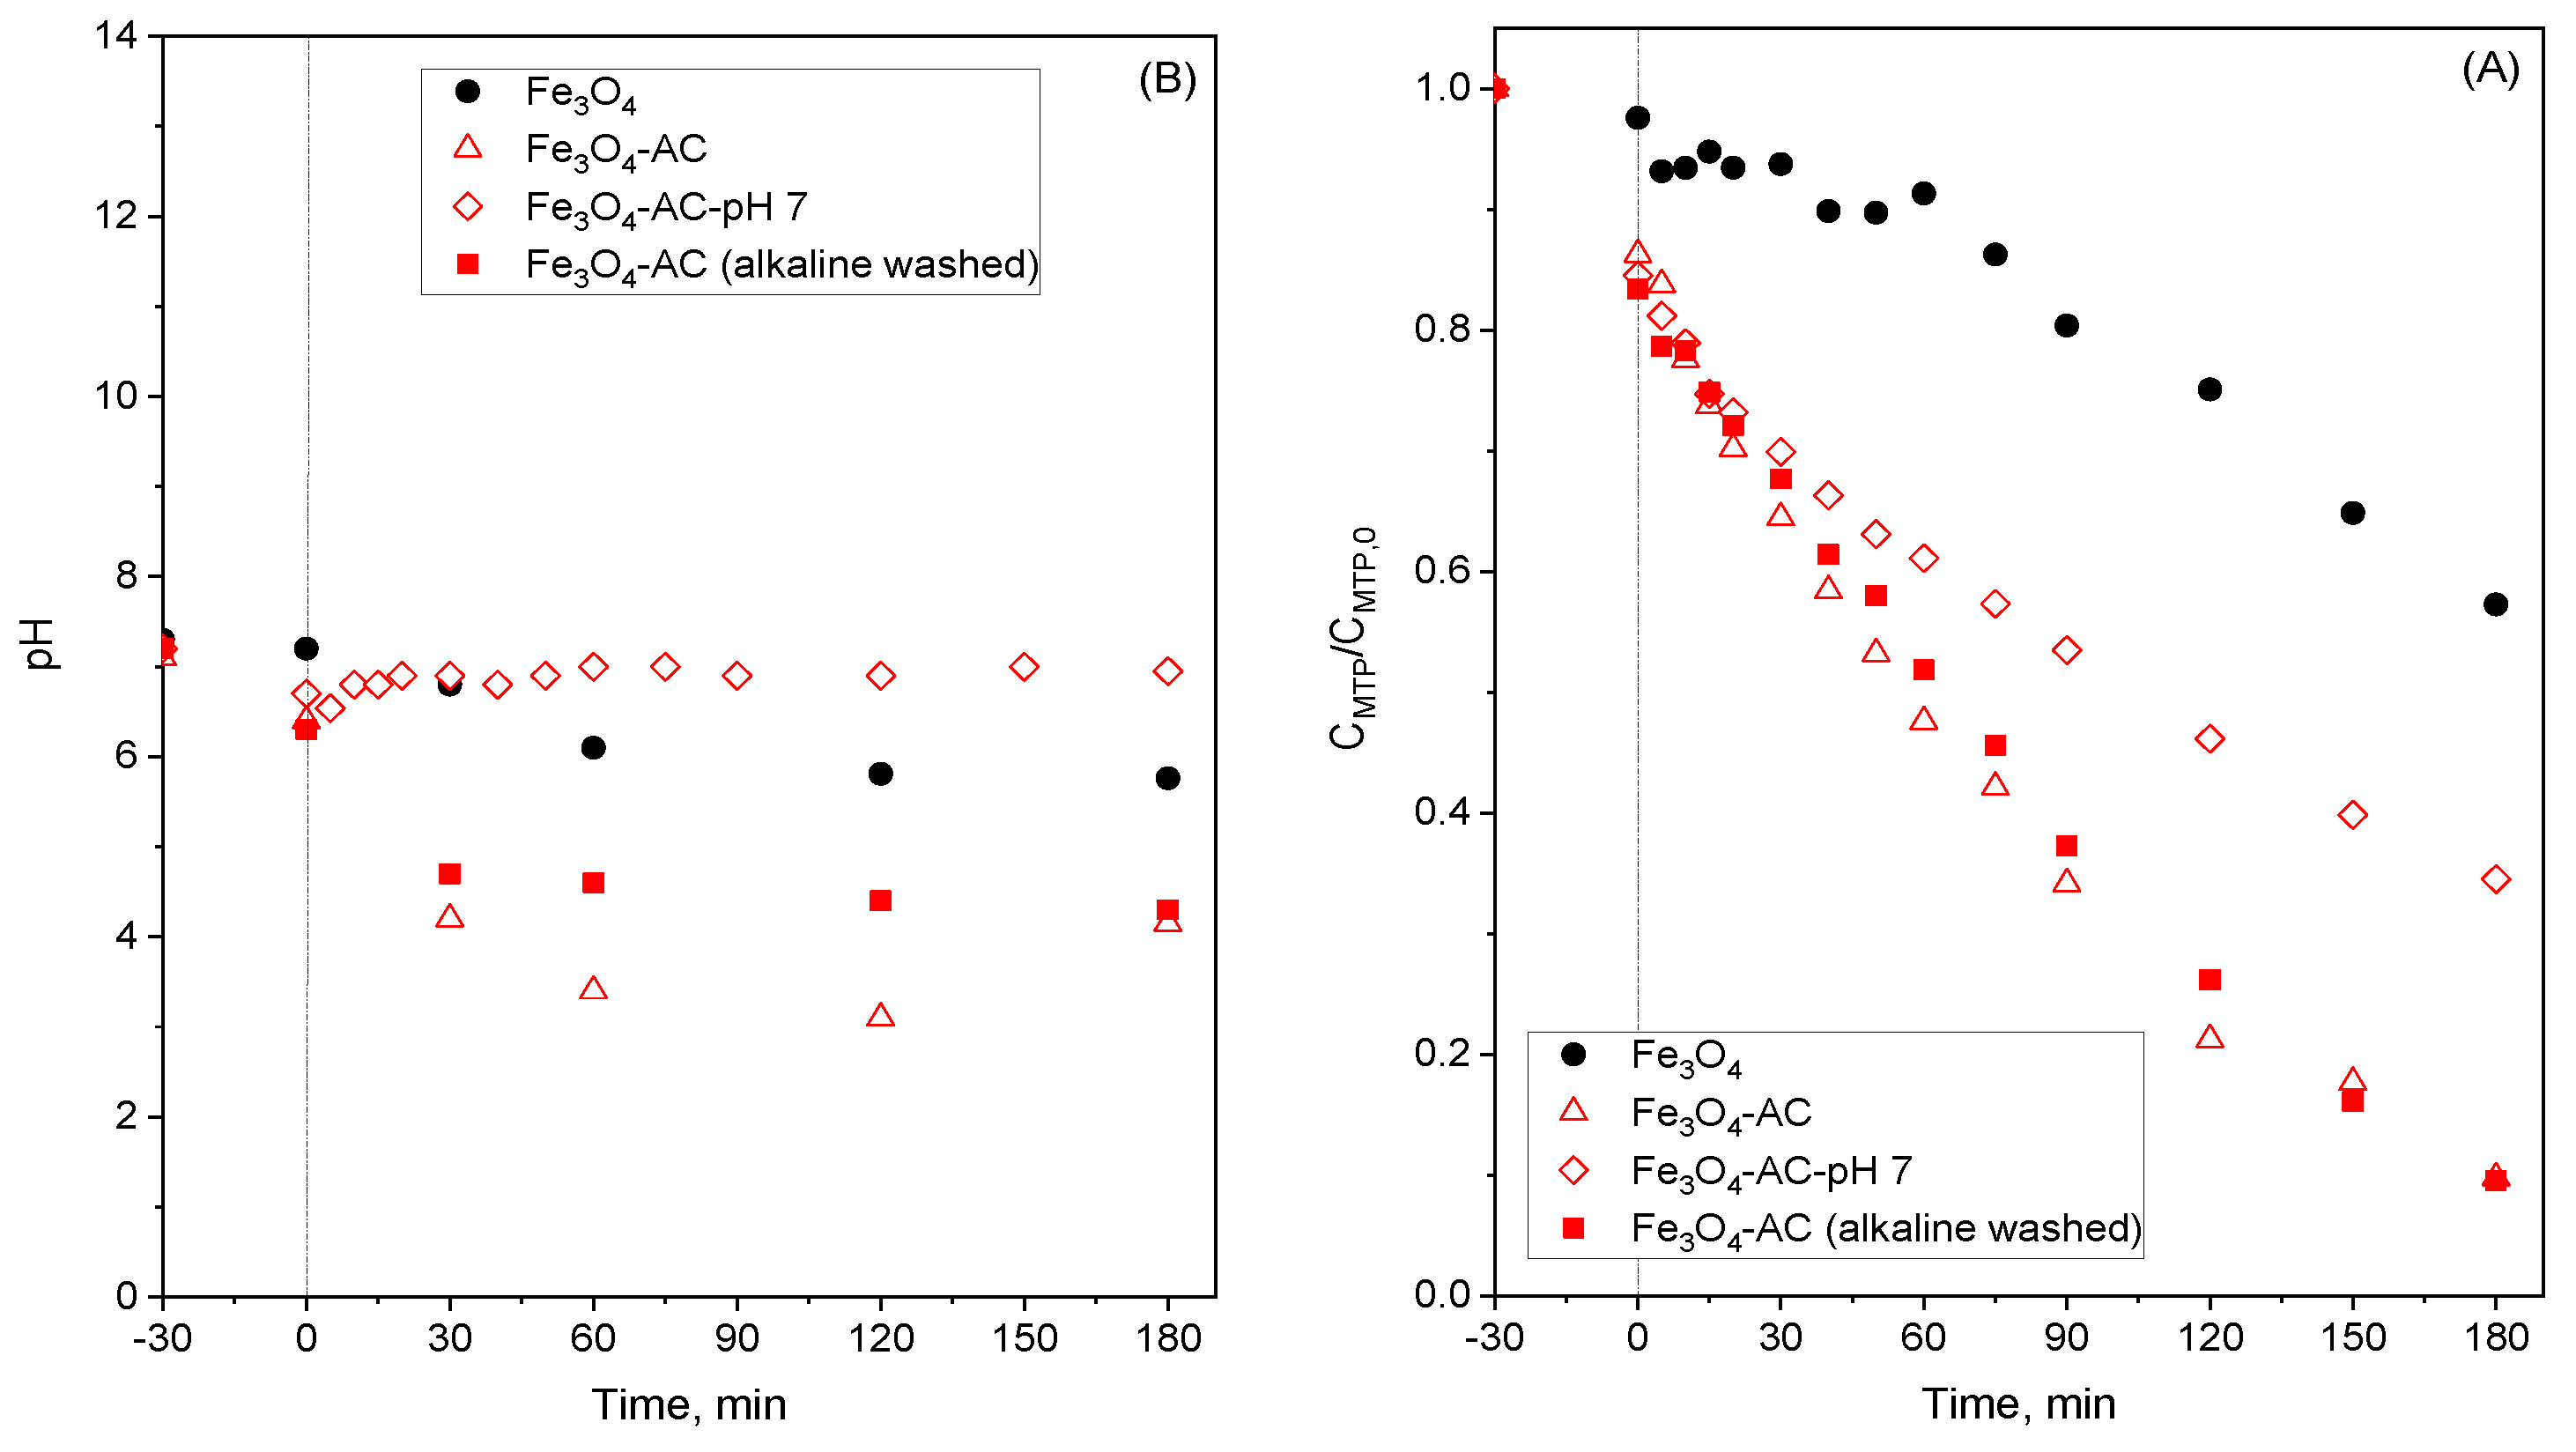
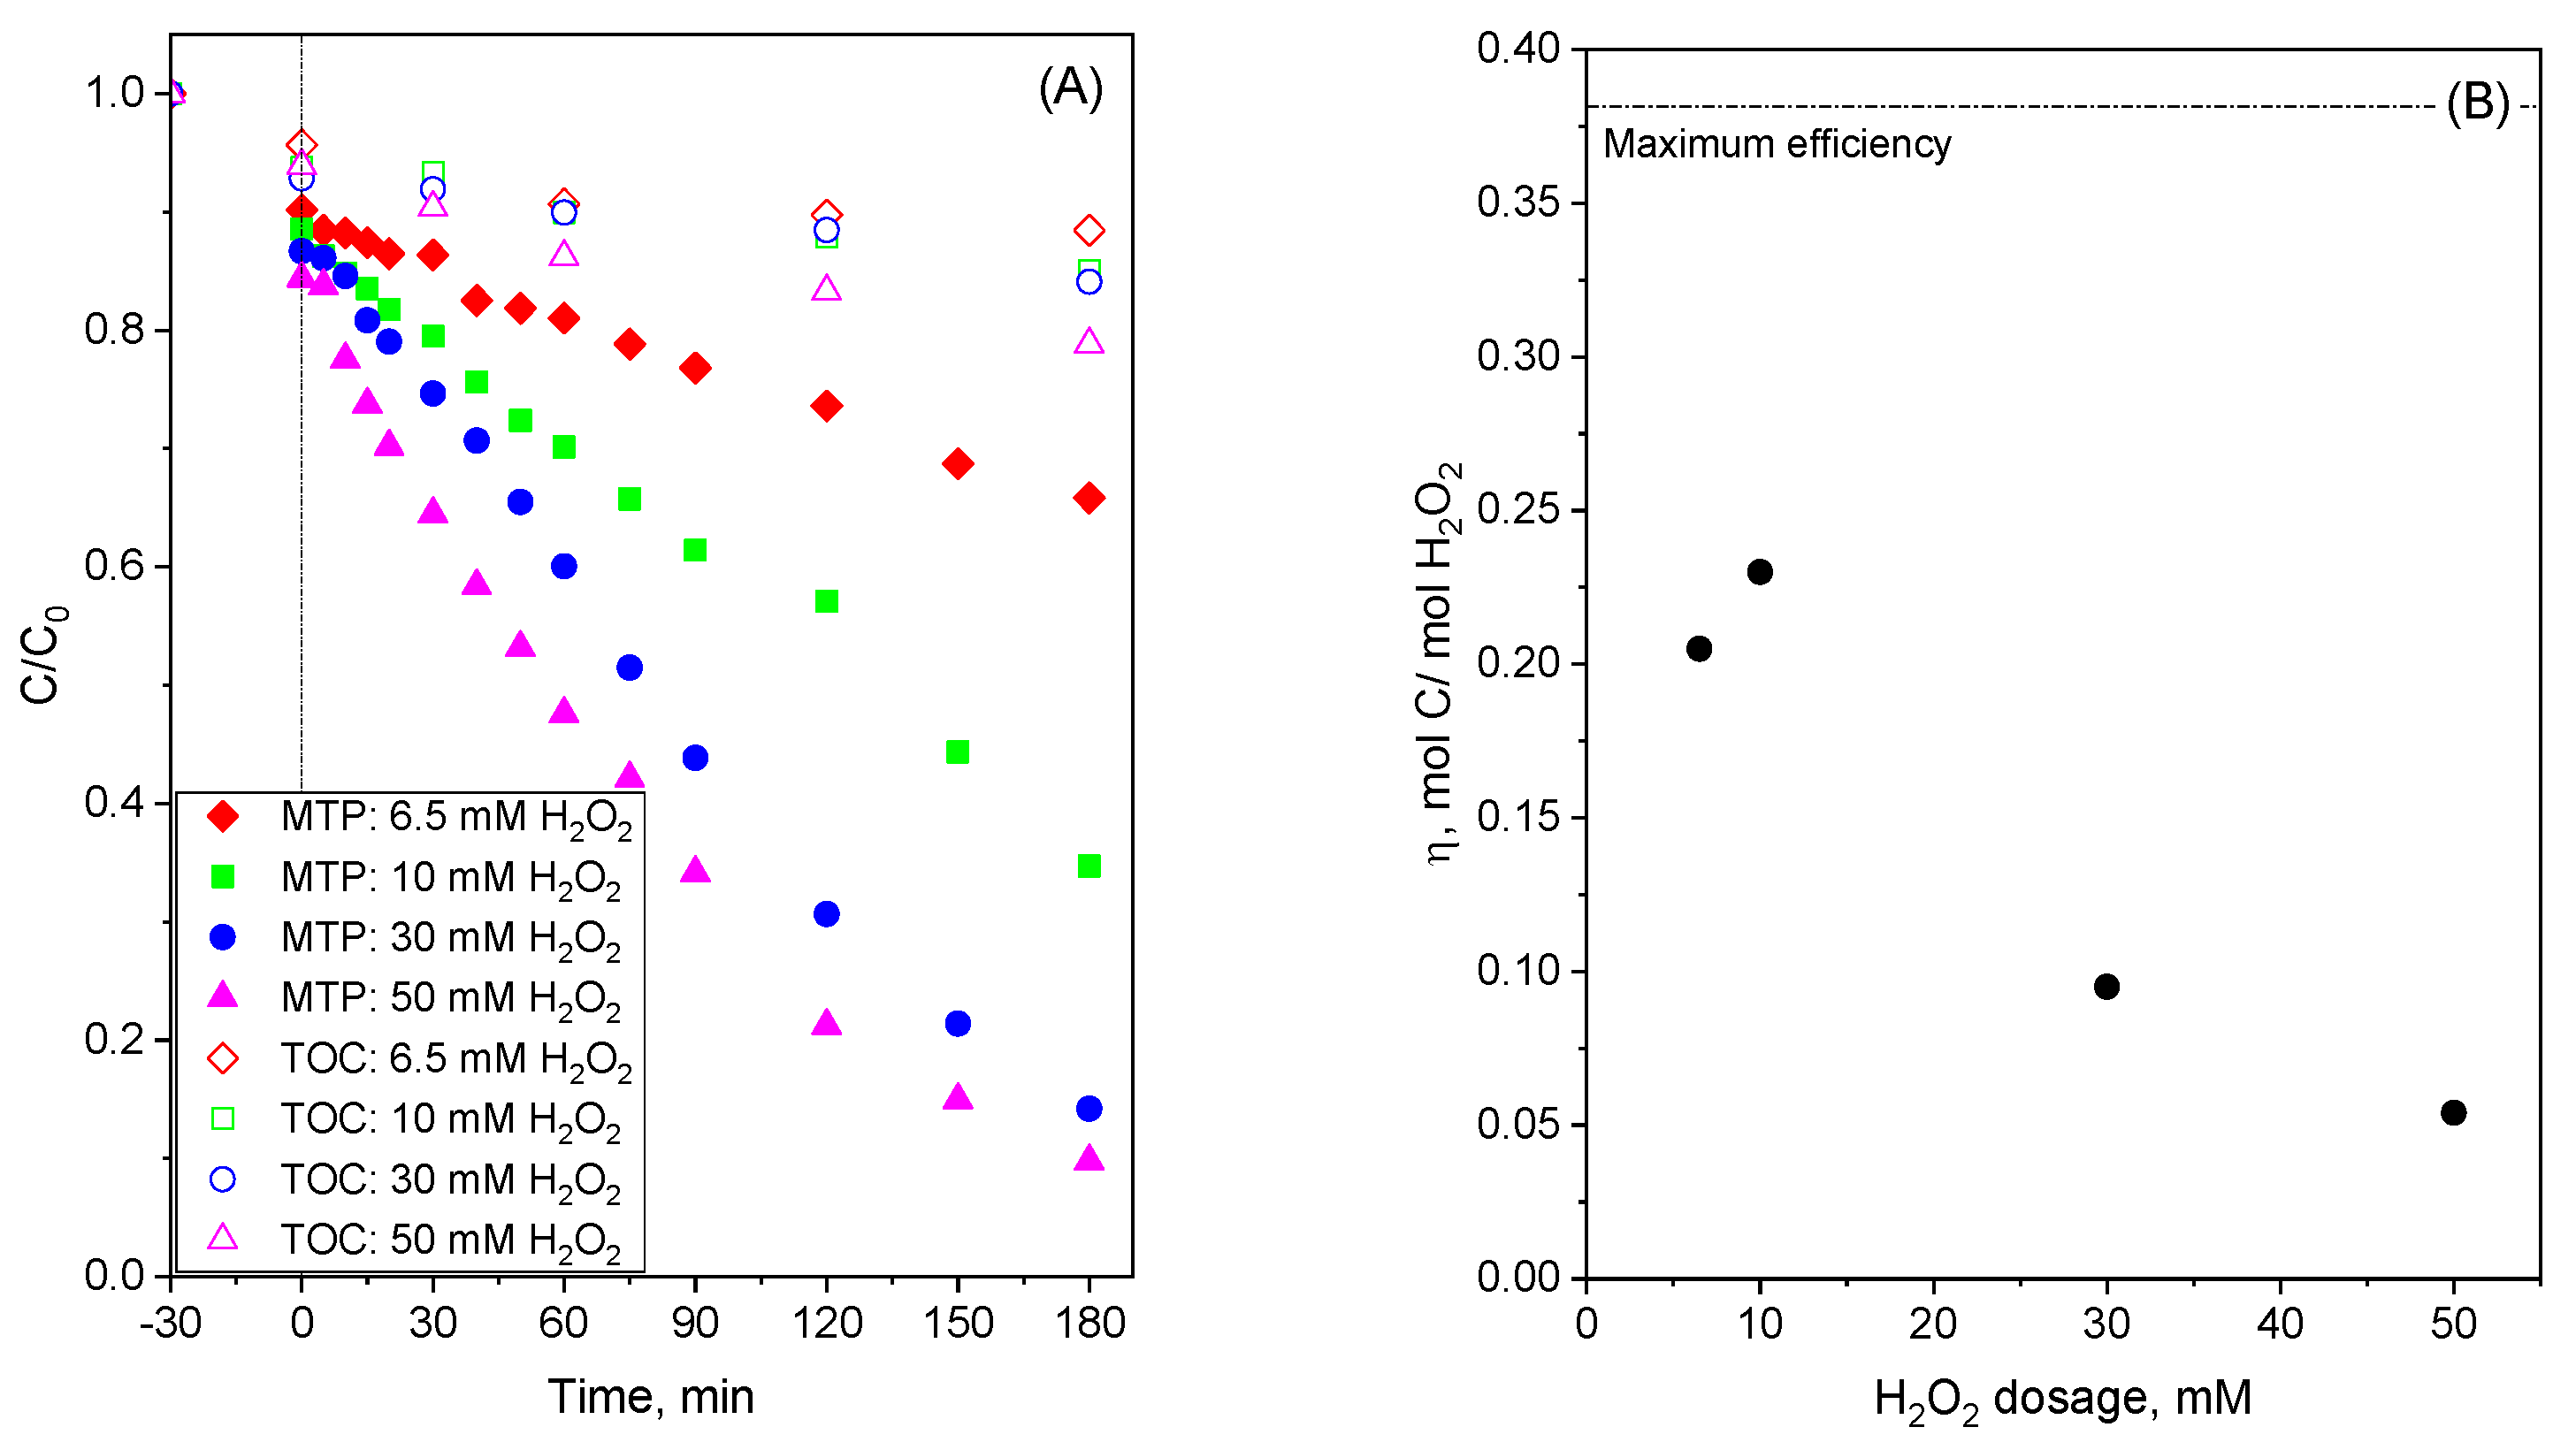
2.5. Improved Use of Fe3O4-AC Catalyst

In view of the above results, Fe3O4-AC was the most promising catalyst among the MBCs here studied due to higher MTP and TOC conversions and greater stability in CWPO as well as lower cost of the carbonaceous material (laboratory prices from the suppliers indicate that G and GO are about 4 and 300 times more expensive than AC, respectively). Nevertheless, improvement of the catalyst synthesis and the optimization of CWPO treatment conditions (e.g., pH, temperature, H2O2 dosage, treatment time, etc.) might eventually lead to a substantial enhancement of the catalyst performance. In line with this, the impact of further purification of the Fe3O4-AC catalyst, its performance in CWPO treatment at circumneutral pH, and the effect of H2O2 dose were examined.
One of the key aspects of this work is the development of a green synthesis of MBCs with full recovery of the terephthalic acid use a mediator in the procedure. Although relatively low amounts of H2BDC remained on the catalyst after the synthesis, a further washing step with NaOH solution (pH = 10) and rinsing water to remove retained H2BDC to a higher extent proved useful. In Figure 10, MTP removal rate and pH evolution during CWPO experiments using the material without the additional alkaline washing step (Fe3O4-AC) and after treatment with aqueous NaOH (Fe3O4-AC-alkaline washed) are presented. Similar evolution of MTP and a slightly smaller drop in the initial pH during CWPO demonstrated that the process efficiency was not greatly affected by the additional washing step but no accumulation of H2BDC during the experiment with the Fe3O4-AC-alkaline catalyst was observed.
To assess the catalytic process performance of Fe3O4-AC in the CWPO of MTP at circumneutral pH, an experiment was completed controlling the pH at 7 throughout the run. Figure 10 shows that MTP removal rate was somewhat slower than in the corresponding pH-free experiment (notice decrease of pH up to 3.5–4) but still higher than that observed with bare Fe3O4. This is a promising result with this material because one of the main drawbacks of CWPO technologies is a relatively low efficiency at circumneutral pH [59].
Another important fact found when carbonaceous materials are used as catalysts or supports in CWPO is the inefficient consumption of H2O2 under certain conditions [60,61]. In this sense, the dosage of H2O2 applied plays a crucial role. Theoretically, the optimum H2O2 dose (stoichiometric dose) to be applied for mineralization of MTP (i.e., complete conversion to CO2, H2O and NO3) is 89 mol H2O2/mol MTP (as metoprolol tartrate). Since the experiments carried out in this work were completed with an MTP initial concentration of 50 mg L−1 (i.e., 0.073 mM), the theoretical initial concentration of H2O2 to mineralize MTP was calculated as 6.5 mM. Photo-CWPO experiments with initial H2O2 concentration in the 6.5–50 mM range were performed, and the obtained results are presented in Figure 11 and Table 7. Although the rate of MTP removal was clearly influenced by the H2O2 dose (the higher the H2O2 concentration the higher the apparent rate constant kapp-MTP) minor differences were observed in TOC removal. As a consequence, the mineralization efficiency reached a maximum value (η-TOC-H2O2 = 0.23 mol C/mol H2O2) for an initial concentration of H2O2 10 mM (Figure 11B). Still, this efficiency value is far from the theoretical 0.38 mol C/mol H2O2 due to the refractory nature of some MTP degradation intermediates and the auto-scavenging effect of H2O2, which also reacts with HO and other reactive oxygen species [62].

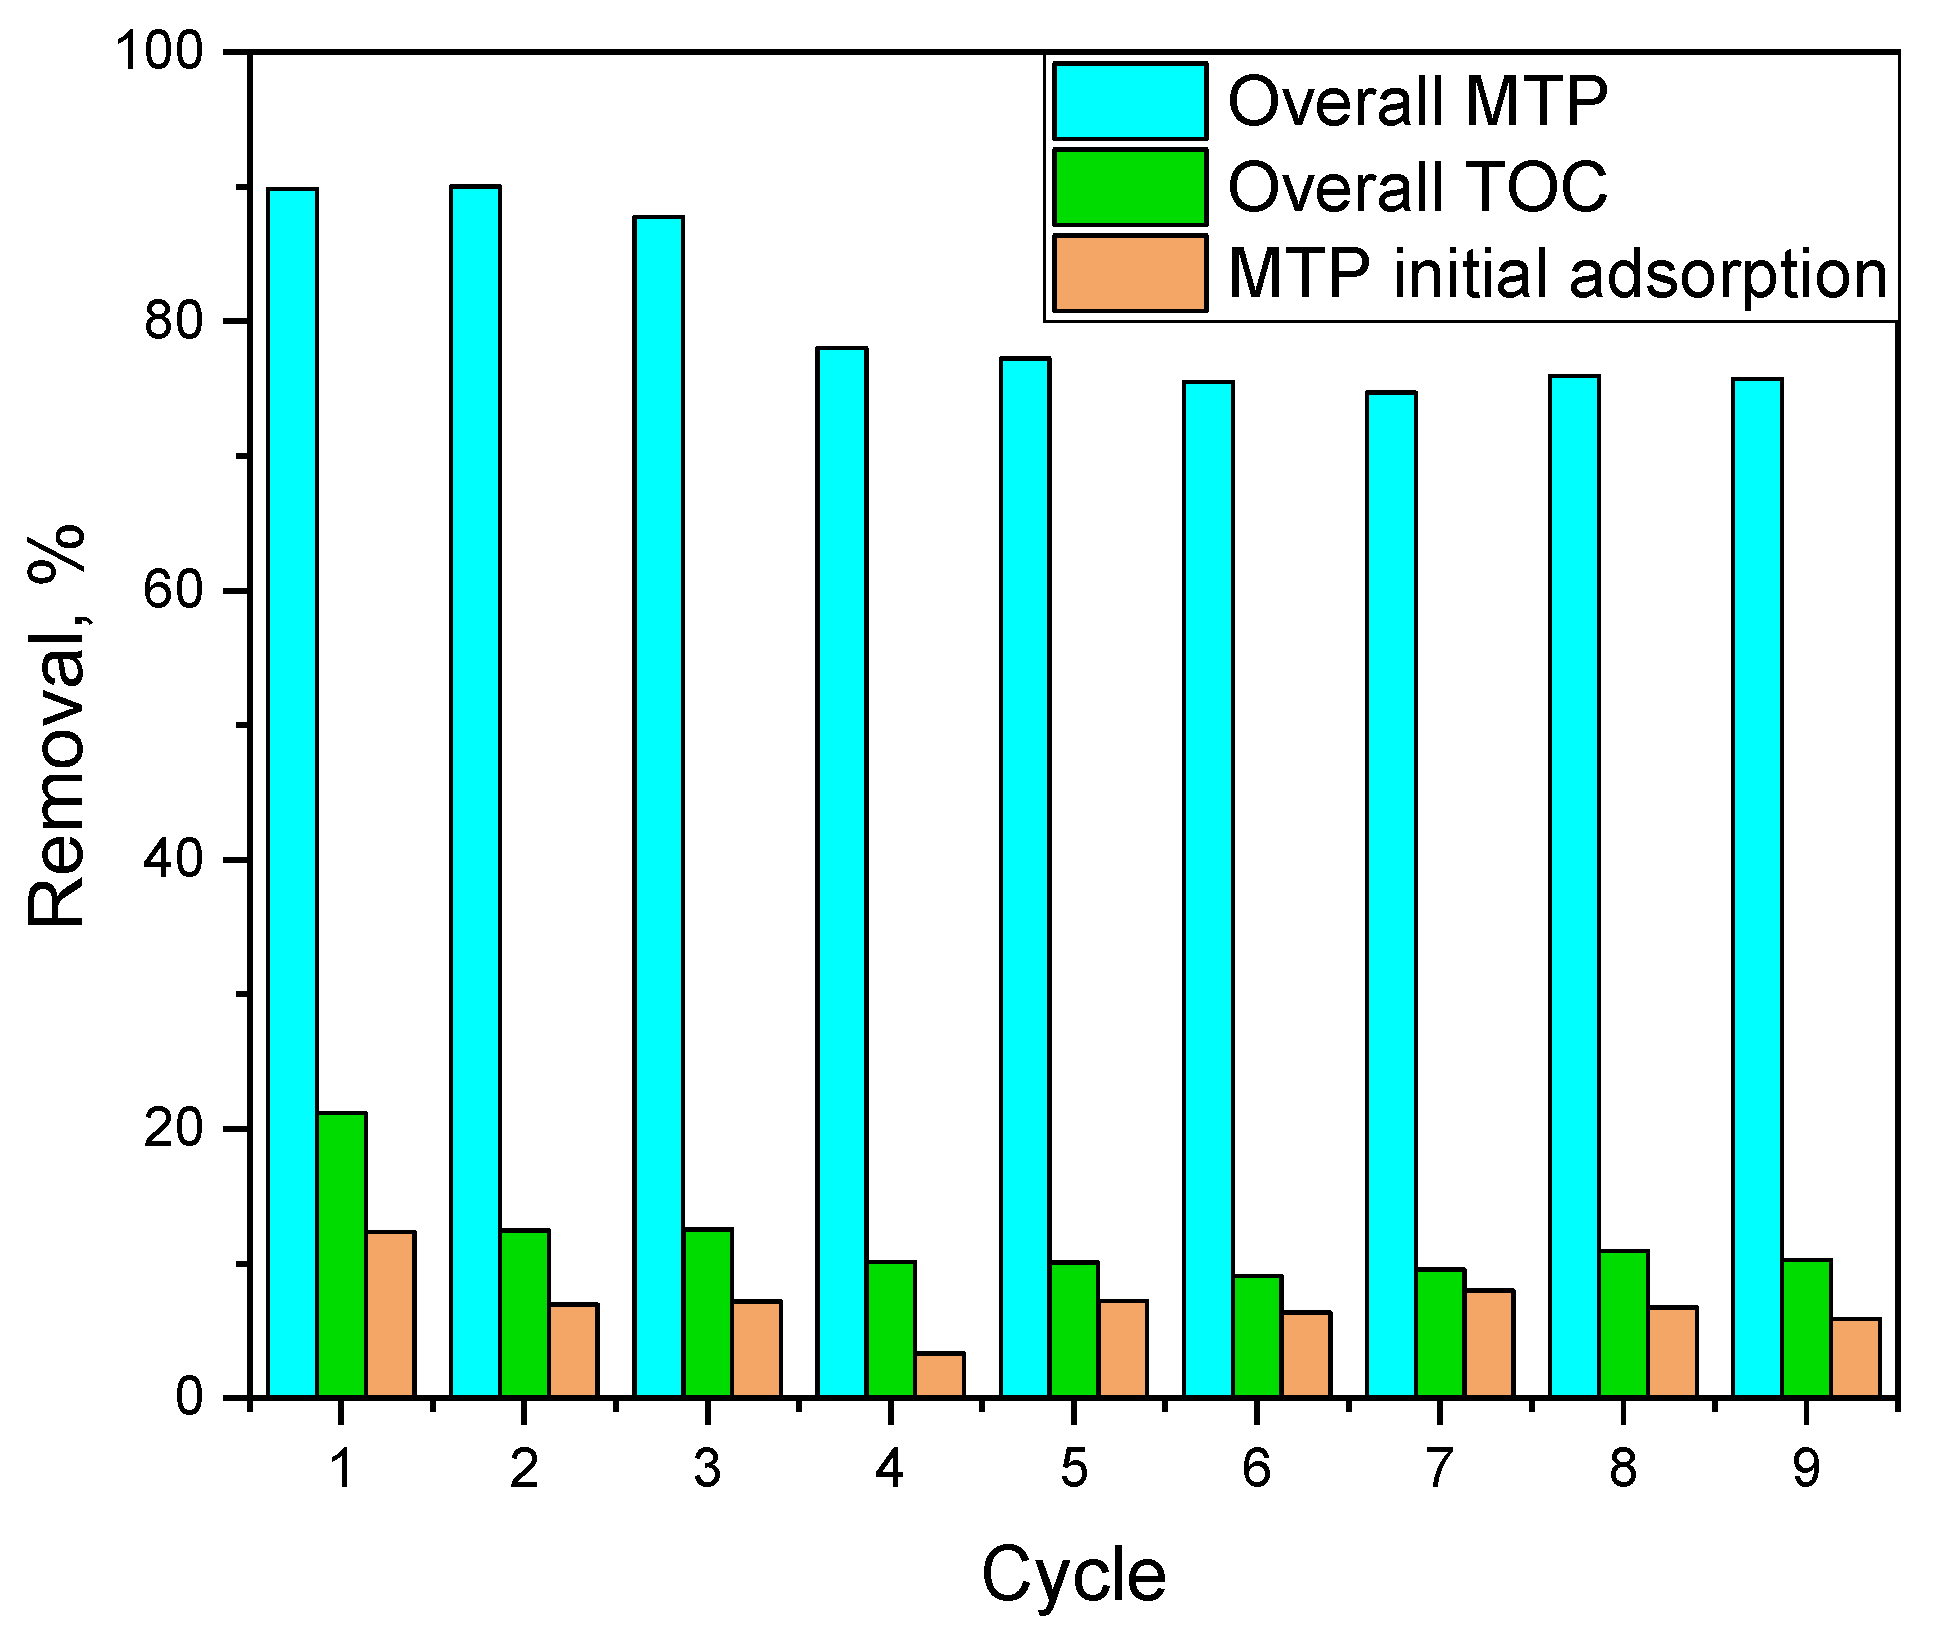
2.6. Reuse of Fe3O4-AC Catalyst

One of the main challenges in developing a catalyst is to ensure good long-term performance. To study the reusability of the Fe3O4-AC catalyst, nine consecutive CWPO runs were carried out. The catalyst was recovered with an external magnet after each run and used in the next one without further treatment. Total iron and H2BDC concentrations at the end of each cycle were always lower than 0.15 mg L−1 and 0.5 mg L−1, which proved good catalyst stability. Figure 12 shows overall MTP and TOC removals by solar assisted CWPO. Additionally, the percentage of MTP adsorbed onto the catalysts after the initial dark stage is presented. It can be seen that overall removal of MTP dropped from 90 to ca. 75% after nine cycles, with a similar trend for TOC (from 21% to 10%). This loss of catalytic performance took place within the first four cycles mainly. It can be related to the loss of the adsorption capacity of the catalyst for MTP, which decreased from 12% (first cycle) to c.a. 6% (from second to ninth cycles). The analysis of the N2 adsorption-desorption isotherm of a catalyst sample after the fifth cycle, when the main drop in catalytic activity had already been observed, confirmed a decrease in BET surface area and especially in micropore volume (see Table 4), which are mainly responsible for the adsorption phenomena in activated carbons. This effect is usually related to the presence of organic matter occupying micropores, although may also be due to the collapse of micropores walls due to the oxidation environment of CWPO. In this line, the elemental analysis of the reused catalyst showed an increase in the contents of carbon (from 32% to 40%), nitrogen (from 0.2% to 0.4%), and hydrogen (from 0.7% to 1.2%). Besides, although the presence of adsorbed organic matter in carbonaceous materials is difficult to confirm by FTIR due to the overlapping of various bands, in Figure 5, two visible bands in the reused sample, located at 1160 cm−1 and 1725 cm−1, suggest the presence of phenolic and carboxyl moieties adsorbed onto the carbon surface [63]. These results points to the presence of organic compounds (i.e., MTP and degradation products) adsorbed onto the catalyst surface.
On the other hand, at the oxidizing conditions applied in CWPO, some ≡Fe2+ active sites might be oxidized to ≡Fe3+, thus lowering the catalytic activity and the saturation magnetization to some extent. Accordingly, the saturation magnetization decreased from 38.7 to 32.9 emu g−1 after the repetitive use of the catalyst, which might be related to the partial transformation of surface magnetite into maghemite. The oxidation state of iron was studied by means of X-ray photoelectron spectroscopy (XPS). The high-resolution spectra of Fe 2p spectral region is presented in Figure 13 for fresh and reused catalysts. The peak positions of Fe 2p3/2 and Fe2p1/2 and the satellite signals are consistent with the existence of magnetite and other ≡Fe3+ species in both samples. The spectra were curve-fitted to a combination of Gaussian-Lorentzian functions using a Shirley-type background for peak analysis according to Grosvenor et al. [64]. The ratio between the areas of the Fe3+ and Fe2+ peaks in the Fe 2p3/2 zone slightly changed from 4.78 (fresh Fe3O4-AC) to 4.97 (reused Fe3O4-AC in nine consecutive CWPO runs), which confirmed that the oxidation takes place to a low extent. Despite these structural changes in the catalyst, its catalytic activity was maintained from the fourth run onwards and was still easily separable with a magnet.

3. Materials and Methods

3.1. Materials

Terephthalic acid (1,4-benzenedicarboxylic acid, C6H4(COOH)2, purity ≥ 98%, H2BDC in this work), iron (II) chloride tetrahydrate (FeCl2·4H2O; purity ≥ 98%), metoprolol tartrate ((C15H25NO3)2·C4H6O6, MTP, purity ≥ 99%), sodium hydroxide (NaOH, purity ≥ 98% purity), hydrochloric acid (HCl, 37 wt.% ), hydrogen peroxide (H2O2, 30 wt.%), and phosphoric acid (H3PO4, 85.5 wt.%) were used as received from commercial suppliers (Sigma-Aldrich and Panreac, Bogotá, Colombia) without any further purification. Ultrapure water (UP) was produced by a Milli-Q academic system (Millipore, Burlington, MA, USA). Commercial Darco 12–20 granular activated carbon (AC) from Sigma-Aldrich was milled to obtain particle size < 125 µm prior use (specific surface area 650 m2 g−1); commercial xGnP graphene nanoplatelets (GP) from Sigma-Aldrich were used as received (particle size < 2 μm, thickness few nm, specific surface area 750 m2 g−1); and graphene oxide powder (GO) from Graphenea (particle size < 25–28 µm, specific surface area > 100 m2 g−1) were used for catalyst synthesis.

3.2. Synthesis of MBCs

Magnetite and composite catalysts were prepared by the novel procedure described in the Spanish Patent Application P202030544, based in green synthesis philosophy with non-toxic reagents, low energy consumption, and reagents recovery. Four materials were synthesized: bare magnetite (Fe3O4) and three carbon magnetic composites (Fe3O4-AC, Fe3O4-G, and Fe3O4-GO). Following the procedure depicted in Figure 13, 1 g of FeCl2·4H2O was dissolved in 50 mL of deionized water (solution A). Then, if required, 0.3 g of AC, GP or GO were added and dispersed into solution A by means of 15 min ultrasonication at ambient temperature. For the synthesis of bare magnetite (i.e., Fe3O4 sample), no solid was dispersed into solution A. On the other hand, 0.835 g of H2BDC were dissolved in 20 mL of aqueous NaOH 1 M (solution B). Subsequently, solution A was mechanically stirred at 800 rpm and solution B was added dropwise during 1 min. The mixture was kept at ambient temperature and 800 rpm for 24 h to allow for the formation of the MBC. After that, the solid was separated by means of a neodymium external magnet and then repeatedly washed with 200 mL of deionized water to ensure a solid free of precursors. Iron and terephthalic acid were measured in the washing waters until negligible values were obtained. The solid was finally dried overnight at 60 °C, milled, and kept in a desiccator until use. The alkaline solution obtained after the magnetic separation of the catalyst contained terephthalate, Na+, and Cl with traces (ppm level) of non-reacted Fe2+ or Fe3+ ions. Addition of concentrated HCl solution (37 wt.%) to pH < 3 led to the precipitation of H2BDC (solubility 0.0015 g/100 mL at 20 °C and pH = 3). This solid was recovered by filtration and reused as shown in Figure 14. A sample of recovered H2BDC was dried at 100 °C for 24 h and characterized to determine its composition.

3.3. Characterization of Catalysts

The study of the crystalline phase of solids by X-ray diffraction (XRD) was carried out on a powder Bruker D8 Advance XRD diffractometer with a Cu Kα1 radiation (λ = 1.541 Ǻ) coupled to a linear detector VANTEC (aperture 3°). The data sets were collected in the range of 2θ = 5°–70° with a step size of 0.01° and 0.5 s of sampling per point. Thermogravimetric and differential thermal analyses (TGA-DTA) were carried out with a thermobalance STA 449 F3 Jupiter-Netzsch coupled to a mass spectrometer QMS 403D Aëolos III-Netzsch SETSYS Evolution-16 (SETARAM, Lyon, France) apparatus using 100 mL min−1 of argon and oxygen (80/20, v/v) at a heating rate of 10 °C min−1, from 40 °C to 950 °C. Nitrogen adsorption-desorption isotherms were used to study the BET surface area and pore volume of the materials. The equipment used to acquire them at −196 °C was an Autosorb iQ2-C Series (Quantachrome, Boynton Beach, FL, USA) apparatus. Before analysis, the samples were degassed at 150 °C for 10 h under a residual pressure < 10−2 mbar. The t-plot method was applied to determine the volume of micropores. The mass percentages of nitrogen, hydrogen, and carbon solid samples were determined with a C-H-N-S TRUSPEC MICRO elemental analyzer (LECO). Wavelength dispersive X-ray fluorescence spectroscopy (WDXRF) was performed using a S8 Tiger (Bruker, Karlsruhe, Germany) apparatus to quantify the amount of iron in the samples. Magnetic measurements were performed using a Quantum Design MPMS XL-7 Superconducting Quantum Interference Device (SQUID). Fourier-transformed infrared spectroscopy (FTIR) was carried out using the KBr pellet method on a Nicolet iS10 spectrometer. Sampling resolution was set at 1 cm−1 and 32 scans from 400 to 4000 cm−1 wavenumber range. Surface chemical composition was studied by X-ray photoelectron spectroscopy (XPS) on a PHI VersaProbe II Scanning XPS Microprobe spectrometer equipped with scanning monochromatic X-ray Al Kα radiation (200 μm area analyzed, 52.8 W and 15 kV and hν = 1486.6 eV) as the excitation source and a multi-channel hemispherical electron analyzer (pass energy of 29.35 eV). Binding energies were calibrated to the C 1 s peak from the carbon signal at 284.8 eV. Raman spectra were acquired using an excitation laser source (λ = 630 nm) on a Thermo Scientific Nicolet Almega XR dispersive Raman spectrometer.

3.4. Stability Tests

The stability of MBCs in water was tested at different pH (4, 6, 7, 8, and 10) in a 0.01-M phosphate-buffered solution. The experiments were carried out in a thermostatic orbital shaker at 25 °C. MBC samples (1 g L−1) were suspended into 20 mL of buffered solution and kept in 50 mL stoppered glass bottles under stirring for 7 days. After that, the solid was separated by an external magnet and the liquid phase analyzed to determine dissolved and total iron, H2BDC, TOC, and pH. Additionally, catalyst stability was also studied at oxidizing conditions. Typically, MBC samples (0.2 g L−1) were suspended into 250 mL of ultrapure water in a 300 mL borosilicate glass vessel and allowed for homogenization for 30 min. Then, if required, H2O2 was added to achieve 50 mM concentration. The vessel was placed in the chamber of a solar box (Suntest CPS+, Atlas Material Testing Technology LLC, Madrid, Spain) equipped with a 1500 W air-cooled Xe lamp. The overall irradiance (λ= 300–800 nm) at the photoreactor level was measured with an UV-Vis spectroradiometer (Black Comet C, StellarNet Inc., Tampa, FL, USA), resulting in 581.4 W m−2. The temperature of the simulator chamber was controlled at 40 °C. The experimental set-up has been described in previous works [52,65]. The vessel content was irradiated for 3 h under oxygen bubbling (10 L h−1). After that time, the solid was magnetically separated and dissolved and total iron, H2BDC, TOC, and pH were analyzed in liquid samples.

3.5. Catalytic Activity Tests

CWPO activity tests of magnetic solids in water were performed in a 300-mL borosilicate glass vessel provided with magnetic agitation and liquid sampling. Typically, the vessel was charged with 0.25 L of MTP solution (50 mg L−1) prepared in ultrapure water (Milli-Q) at pH 7 and 0.2 g L−1 of MBC. The suspension was stirred for 30 min for homogenization and MTP adsorption purposes. Then, the reactor vessel was placed in the solar box described above and the required amount of H2O2 was added. Immediately, the lamp was turned on if illumination was required. Samples were periodically withdrawn from the reactor, filtered through 0.45 μm PET membranes, and analyzed for MTP, pH, H2O2, TOC, H2BDC, and dissolved iron. Aliquots of selected samples were analyzed for total iron (non-filtered samples) after separating the catalyst particles with a magnet. The reutilization of the Fe3O4-AC sample was studied by performing nine consecutive runs under illumination. At the end of each run, the catalyst was separated magnetically with an external magnet and used without further treatment in the next cycle with a fresh MTP solution.

3.6. Analytical Methods for Reaction Monitoring

Total iron concentration was evaluated spectrophotometrically at 565 nm by Spectroquant® iron test (Merck 1.14761.0001). Measurements of pH were taken with a pH-meter (Crison GLP21+). Hydrogen peroxide in liquid samples was also measured using the method proposed by Eisenberg [66]. All the spectrophotometric measurements were carried out on a Helios α spectrophotometer from Thermo Spectronic using 1 cm path length cuvettes. TOC was determined on filtered samples using a Shimadzu apparatus (TOC-V CSH model). H2BDC and MTP concentrations were analyzed by a gradient method on a HPLC apparatus provided with a UV-Vis detector set at 225 nm (HP 1100 Series chromatograph, Agilent Technologies, Santa Clara, CA, USA). A Kromasil C-18 column (5 μm, 150 mm length, 4 mm diameter) was used as stationary phase while the mobile phase consisted of a mixture of 0.1% vol. o-phosphoric acid in ultrapure water (solvent A) and acetonitrile (solvent B) at a constant flowrate of 1 mL min−1. The mobile phase program used for the analysis was as follows: start at 20% B; 0–6 min, linear gradient of B in A (20%–27.5% B); 6–7 min, hold at 27.5% B, 7–8 min, linear gradient (27.5%–20% B); 8–9 min, hold at 20% B. The retention times were 3.4 min (H2BDC) and 4.1 min (MTP).

4. Conclusions

The synthesis method proposed in this work allowed obtaining mesoporous magnetite and magnetized carbonaceous materials of high purity, with excellent magnetic properties that facilitate their separation, and acceptable textural properties for their possible application as catalysts in different processes. The method proved to be easily scalable, possible to carry out at ambient conditions, and have a high percentage recovery of one of the main reagents (i.e., terephthalic acid), which can be reused into a new synthesis, thus falling within the philosophy of green synthesis to obtain environmentally friendly materials.
The materials thus obtained, bare magnetite and three carbonaceous composites (prepared from activated carbon, graphene and graphene oxide), were active for photo-CWPO, as demonstrated treating an aqueous solution of MTP. Fe3O4-G and Fe3O4-GO showed low stability compared with Fe3O4 and Fe3O4-AC. Moreover, the latter presented catalytic activity much superior to bare Fe3O4. MTP and TOC conversions higher than 90% and 20%, respectively, were achieved after 3 h of treatment with Fe3O4-AC at initial aqueous pH 7 (pH dropped to c.a 4). At circumneutral pH (pH was controlled at about 7 throughout the process) MTP removal was still moderate (>60%), this being a typical limiting issue in photo-Fenton treatments. The best efficiency in the use of H2O2 was 0.23 mol C eliminated per mol H2O2 consumed, which is about a 60% of the maximum attainable efficiency. Fe3O4-AC could be easily reused in a nine-consecutive CWPO experiment recovering the catalyst with a magnet after each cycle. Moderate catalyst deactivation was observed mainly due to the blockage of some micropores and/or loss of Fe2+ catalytic sites. Nevertheless, deactivation from the fourth cycle onwards was negligible and magnetic separability remained quite satisfactory.

Author Contributions

Conceptualization, P.M.Á. and A.R.; methodology, J.L.; validation, J.F.G.-A.; investigation, J.L., A.R., J.F.G.-A. and P.M.Á.; data curation, J.L.; writing—original draft preparation, J.L. and A.R.; writing—review and editing, A.R. and P.M.Á.; supervision, P.M.Á.; project administration, P.M.Á.; funding acquisition, P.M.Á. and J.F.G.-A. All authors have read and agreed to the published version of the manuscript.

Funding

This research was funded by the Junta de Extremadura (GR18014-Reserch Group) and the Agencia Estatal de Investigación (AEI) of Spain through the project PID2019-104429RB-I00/AEI/10.13039/501100011033, co-financed by the European Funds for Regional Development (FEDER, UE).

Acknowledgments

The authors thank the SAIUEX service of the University of Extremadura for the characterization analyses. Jorge López Gallego is also grateful to the Ministerio de Educación, Cultura y Deporte of Spain for a FPU grant (reference number FPU16/03629).

Conflicts of Interest

The authors declare no conflict of interest.

References

  1. Arias, L.S.; Pessan, J.P.; Vieira, A.P.M.; De Lima, T.M.T.; Delbem, A.C.B.; Monteiro, D.R. Iron Oxide Nanoparticles for Biomedical Applications: A Perspective on Synthesis, Drugs, Antimicrobial Activity, and Toxicity. Antibiotics 2018, 7, 46. [Google Scholar] [CrossRef] [PubMed] [Green Version]
  2. Gupta, A.K.; Gupta, M. Synthesis and Surface Engineering of Iron Oxide Nanoparticles for Biomedical Applications. Biomaterials 2005, 26, 3995–4021. [Google Scholar] [CrossRef] [PubMed]
  3. Cotin, G.; Piant, S.; Mertz, D.; Felder-Flesch, D.; Begin-Colin, S. Iron Oxide Nanoparticles for Biomedical Applications: Synthesis, Functionalization, and Application; Elsevier Ltd.: Amsterdam, The Netherlands, 2018. [Google Scholar] [CrossRef]
  4. Nasir Baig, R.B.; Verma, S.; Nadagoud, M.N.; Varma, R.S. Advancing Sustainable Catalysis with Magnetite. Surface Modification and Synthetic Applications. Aldrichimica Acta 2016, 49, 35–41. [Google Scholar]
  5. Masudi, A.; Harimisa, G.E.; Ghafar, N.A.; Jusoh, N.W.C. Magnetite-Based Catalysts for Wastewater Treatment. Environ. Sci. Pollut. Res. 2020, 27, 4664–4682. [Google Scholar] [CrossRef]
  6. Muñoz, M.; de Pedro, Z.M.; Casas, J.A.; Rodríguez, J.J. Preparation of Magnetite-Based Catalysts and Their Application in Heterogeneous Fenton Oxidation-A Review. Appl. Catal. B Environ. 2015, 176–177, 249–265. [Google Scholar] [CrossRef] [Green Version]
  7. Thomas, N.; Dionysiou, D.D.; Pillai, S.C. Heterogeneous Fenton Catalysts: A Review of Recent Advances. J. Hazard. Mater. 2021, 404, 124082. [Google Scholar] [CrossRef] [PubMed]
  8. Ribeiro, R.S.; Silva, A.M.T.; Figueiredo, J.L.; Faria, J.L.; Gomes, H.T. Catalytic Wet Peroxide Oxidation: A Route towards the Application of Hybrid Magnetic Carbon Nanocomposites for the Degradation of Organic Pollutants. A Review. Appl. Catal. B Environ. 2016, 187, 428–460. [Google Scholar] [CrossRef]
  9. Lai, L.; He, Y.; Zhou, H.; Huang, B.; Yao, G.; Lai, B. Critical Review of Natural Iron-Based Minerals Used as Heterogeneous Catalysts in Peroxide Activation Processes: Characteristics, Applications and Mechanisms. J. Hazard. Mater. 2021, 416, 125809. [Google Scholar] [CrossRef] [PubMed]
  10. Teja, A.S.; Koh, P.Y. Synthesis, Properties, and Applications of Magnetic Iron Oxide Nanoparticles. Prog. Cryst. Growth Charact. Mater. 2009, 55, 22–45. [Google Scholar] [CrossRef]
  11. Zhang, Z.J.; Chen, X.Y.; Wang, B.N.; Shi, C.W. Hydrothermal Synthesis and Self-Assembly of Magnetite (Fe3O4) Nanoparticles with the Magnetic and Electrochemical Properties. J. Cryst. Growth 2008, 310, 5453–5457. [Google Scholar] [CrossRef]
  12. Nidheesh, P.V. Heterogeneous Fenton Catalysts for the Abatement of Organic Pollutants from Aqueous Solution: A Review. RSC Adv. 2015, 5, 40552–40577. [Google Scholar] [CrossRef]
  13. Peng, S.; Wang, C.; Xie, J.; Sun, S. Synthesis and Stabilization of Monodisperse Fe Nanoparticles. J. Am. Chem. Soc. 2006, 128, 10676–10677. [Google Scholar] [CrossRef] [PubMed]
  14. Ge, J.; Hu, Y.; Biasini, M.; Dong, C.; Guo, J.; Beyermann, W.P.; Yin, Y. One-Step Synthesis of Highly Water-Soluble Magnetite Colloidal Nanocrystals. Chem.-A Eur. J. 2007, 13, 7153–7161. [Google Scholar] [CrossRef] [PubMed]
  15. Li, Z.; Chen, H.; Bao, H.; Gao, M. One-Pot Reaction to Synthesize Water-Soluble Magnetite Nanocrystals. Chem. Mater. 2004, 16, 1391–1393. [Google Scholar] [CrossRef]
  16. Lu, X.; Niu, M.; Qiao, R.; Gao, M. Superdispersible PVP-Coated Fe3O4 Nanocrystals Prepared by a “One-Pot” Reaction. J. Phys. Chem. B 2008, 112, 14390–14394. [Google Scholar] [CrossRef] [PubMed]
  17. Mizukoshi, Y.; Shuto, T.; Masahashi, N.; Tanabe, S. Preparation of Superparamagnetic Magnetite Nanoparticles by Reverse Precipitation Method: Contribution of Sonochemically Generated Oxidants. Ultrason. Sonochem. 2009, 16, 525–531. [Google Scholar] [CrossRef] [Green Version]
  18. Nedkov, I.; Merodiiska, T.; Slavov, L.; Vandenberghe, R.E.; Kusano, Y.; Takada, J. Surface Oxidation, Size and Shape of Nano-Sized Magnetite Obtained by Co-Precipitation. J. Magn. Magn. Mater. 2006, 300, 358–367. [Google Scholar] [CrossRef]
  19. Qu, S.; Yang, H.; Ren, D.; Kan, S.; Zou, G.; Li, D.; Li, M. Magnetite Nanoparticles Prepared by Precipitation from Partially Reduced Ferric Chloride Aqueous Solutions. J. Colloid Interface Sci. 1999, 215, 190–192. [Google Scholar] [CrossRef] [PubMed]
  20. Ozkaya, T.; Toprak, M.S.; Baykal, A.; Kavas, H.; Köseoǧlu, Y.; Aktaş, B. Synthesis of Fe3O4 Nanoparticles at 100 °C and Its Magnetic Characterization. J. Alloys Compd. 2009, 472, 18–23. [Google Scholar] [CrossRef]
  21. Kobyliukh, A.; Olszowska, K.; Godzierz, M.; Kordyka, A.; Kubacki, J.; Mamunya, Y.; Pusz, S.; Stoycheva, I.; Szeluga, U. Effect of Graphene Material Structure and Iron Oxides Deposition Method on Morphology and Properties of Graphene/Iron Oxide Hybrids. Appl. Surf. Sci. 2022, 573, 151567. [Google Scholar] [CrossRef]
  22. Ioffe, M.; Long, M.; Radian, A. Systematic Evaluation of Activated Carbon-Fe3O4 Composites for Removing and Degrading Emerging Organic Pollutants. Environ. Res. 2021, 198, 111187. [Google Scholar] [CrossRef]
  23. Lopes, K.L.; de Oliveira, H.L.; Serpa, J.A.S.; Torres, J.A.; Nogueira, F.G.E.; de Freitas, V.A.A.; Borges, K.B.; Silva, M.C. Nanomagnets Based on Activated Carbon/Magnetite Nanocomposite for Determination of Endocrine Disruptors in Environmental Water Samples. Microchem. J. 2021, 168, 106366. [Google Scholar] [CrossRef]
  24. Rodríguez-Sánchez, S.; Ruíz, B.; Martínez-Blanco, D.; Sánchez-Arenillas, M.; Díez, M.A.; Marco, J.F.; Gorria, P.; Fuente, E. Towards Advanced Industrial Waste-Based Magnetic Activated Carbons with Tunable Chemical, Textural and Magnetic Properties. Appl. Surf. Sci. 2021, 551, 149407. [Google Scholar] [CrossRef]
  25. Stan, M.; Lung, I.; Soran, M.L.; Leostean, C.; Popa, A.; Stefan, M.; Lazar, M.D.; Opris, O.; Silipas, T.D.; Porav, A.S. Removal of Antibiotics from Aqueous Solutions by Green Synthesized Magnetite Nanoparticles with Selected Agro-Waste Extracts. Process Saf. Environ. Prot. 2017, 107, 357–372. [Google Scholar] [CrossRef]
  26. Jiang, Y.; Wang, W.N.; Biswas, P.; Fortner, J.D. Facile Aerosol Synthesis and Characterization of Ternary Crumpled Graphene-TiO2-Magnetite Nanocomposites for Advanced Water Treatment. ACS Appl. Mater. Interfaces 2014, 6, 11766–11774. [Google Scholar] [CrossRef] [PubMed]
  27. Kim, S.E.; Kim, K.W.; Lee, S.W.; Kim, S.O.; Kim, J.S.; Lee, J.K. Synthesis and Characterization of TiO2-Coated Magnetite Clusters (NFe3O4@TiO2) as Anode Materials for Li-Ion Batteries. Curr. Appl. Phys. 2013, 13, 1923–1927. [Google Scholar] [CrossRef]
  28. Dimiev, A.M.; Alemany, L.B.; Tour, J.M. Graphene Oxide. Origin of Acidity, Its Instability in Water, and a New Dynamic Structural Model. ACS Nano 2013, 7, 576–588. [Google Scholar] [CrossRef]
  29. Cabrera-Munguia, D.A.; León-Campos, M.I.; Claudio-Rizo, J.A.; Solís-Casados, D.A.; Flores-Guia, T.E.; Cano Salazar, L.F. Potential Biomedical Application of a New MOF Based on a Derived PET: Synthesis and Characterization. Bull. Mater. Sci. 2021, 44, 245. [Google Scholar] [CrossRef]
  30. Cosimbescu, L.; Merkel, D.R.; Darsell, J.; Petrossian, G. Simple but Tricky: Investigations of Terephthalic Acid Purity Obtained from Mixed PET Waste. Ind. Eng. Chem. Res. 2021, 60, 12792–12797. [Google Scholar] [CrossRef]
  31. Varaprasad, K.; Pariguana, M.; Raghavendra, G.M.; Jayaramudu, T.; Sadiku, E.R. Development of Biodegradable Metaloxide/Polymer Nanocomposite Films Based on Poly-ε-Caprolactone and Terephthalic Acid. Mater. Sci. Eng. C 2017, 70, 85–93. [Google Scholar] [CrossRef]
  32. Ball, G.L.; McLellan, C.J.; Bhat, V.S. Toxicological Review and Oral Risk Assessment of Terephthalic Acid (TPA) and Its Esters: A Category Approach. Crit. Rev. Toxicol. 2011, 42, 28–67. [Google Scholar] [CrossRef] [PubMed]
  33. Hoshi, A.; Yanai, R.; Kuretani, K. Toxicity of Terephthalic Acid. Chem. Pharm. Bull. 1968, 16, 1655–1660. [Google Scholar] [CrossRef] [Green Version]
  34. Zhang, X.X.; Sun, S.L.; Zhang, Y.; Wu, B.; Zhang, Z.Y.; Liu, B.; Yang, L.Y.; Cheng, S.P. Toxicity of Purified Terephthalic Acid Manufacturing Wastewater on Reproductive System of Male Mice (Mus Musculus). J. Hazard. Mater. 2010, 176, 300–305. [Google Scholar] [CrossRef]
  35. Wang, D.; Yang, P.; Zhu, Y. Growth of Fe3O4 Nanoparticles with Tunable Sizes and Morphologies Using Organic Amine. Mater. Res. Bull. 2014, 49, 514–520. [Google Scholar] [CrossRef]
  36. Kumar, S.R.; Raja, M.M.; Mangalaraj, D.; Viswanathan, C.; Ponpandian, N. Surfactant Free Solvothermal Synthesis of Monodispersed 3D Hierarchical Fe3O4 Microspheres. Mater. Lett. 2013, 110, 98–101. [Google Scholar] [CrossRef]
  37. Li, Y.; Jiang, R.; Liu, T.; Lv, H.; Zhou, L.; Zhang, X. One-Pot Synthesis of Grass-like Fe3O4 Nanostructures by a Novel Microemulsion-Assisted Solvothermal Method. Ceram. Int. 2014, 40 Pt A, 1059–1063. [Google Scholar] [CrossRef]
  38. Haw, C.Y.; Mohamed, F.; Chia, C.H.; Radiman, S.; Zakaria, S.; Huang, N.M.; Lim, H.N. Hydrothermal Synthesis of Magnetite Nanoparticles as MRI Contrast Agents. Ceram. Int. 2010, 4, 1417–1422. [Google Scholar] [CrossRef]
  39. Figueiredo, J.L.; Pereira, M.F.R.; Freitas, M.M.A.; Órfão, J.J.M. Modification of the Surface Chemistry of Activated Carbons. Carbon N. Y. 1999, 37, 1379–1389. [Google Scholar] [CrossRef]
  40. Pastrana-Martínez, L.M.; Morales-Torres, S.; Likodimos, V.; Falaras, P.; Figueiredo, J.L.; Faria, J.L.; Silva, A.M.T. Role of Oxygen Functionalities on the Synthesis of Photocatalytically Active Graphene–TiO2 Composites. Appl. Catal. B Environ. 2014, 158–159, 329–340. [Google Scholar] [CrossRef]
  41. Ruíz-Baltazar, A.; Esparza, R.; Rosas, G.; Pérez, R. Effect of the Surfactant on the Growth and Oxidation of Iron Nanoparticles. J. Nanomater. 2015, 2015, 240948. [Google Scholar] [CrossRef]
  42. Pop, D.; Buzatu, R.; Moacă, E.A.; Watz, C.G.; Cîntă-Pînzaru, S.; Tudoran, L.B.; Nekvapil, F.; Avram, Ș.; Dehelean, C.A.; Crețu, M.O.; et al. Development and Characterization of Fe3O4@Carbon Nanoparticles and Their Biological Screening Related to Oral Administration. Materials 2021, 14, 3556. [Google Scholar] [CrossRef]
  43. Daou, T.J.; Grenèche, J.M.; Pourroy, G.; Buathong, S.; Derory, A.; Ulhaq-Bouillet, C.; Donnio, B.; Guillon, D.; Begin-Colin, S. Coupling Agent Effect on Magnetic Properties of Functionalized Magnetite-Based Nanoparticles. Chem. Mater. 2008, 20, 5869–5875. [Google Scholar] [CrossRef]
  44. Rizzuti, A.; Dassisti, M.; Mastrorilli, P.; Sportelli, M.C.; Cioffi, N.; Picca, R.A.; Agostinelli, E.; Varvaro, G.; Caliandro, R. Shape-Control by Microwave-Assisted Hydrothermal Method for the Synthesis of Magnetite Nanoparticles Using Organic Additives. J. Nanopart. Res. 2015, 17, 408. [Google Scholar] [CrossRef]
  45. Niemeyer, J.; Chen, Y.; Bollag, J.-M. Characterization of Humic Acids, Composts, and Peat by Diffuse Reflectance Fourier-Transform Infrared Spectroscopy. Soil Sci. Soc. Am. J. 1992, 56, 135. [Google Scholar] [CrossRef]
  46. Moreno-Castilla, C.; López-Ramón, M.V.; Carrasco-Marín, F. Changes in Surface Chemistry of Activated Carbons by Wet Oxidation. Carbon N. Y. 2000, 38, 1995–2001. [Google Scholar] [CrossRef]
  47. Pakuła, M.; Świa̧tkowski, A.; Walczyk, M.; Biniak, S. Voltammetric and FT-IR Studies of Modified Activated Carbon Systems with Phenol, 4-Chlorophenol or 1,4-Benzoquinone Adsorbed from Aqueous Electrolyte Solutions. Colloids Surfaces A Physicochem. Eng. Asp. 2005, 260, 145–155. [Google Scholar] [CrossRef]
  48. Komarneni, S.; Hu, W.; Noh, Y.D.; Van Orden, A.; Feng, S.; Wei, C.; Pang, H.; Gao, F.; Lu, Q.; Katsuki, H. Magnetite Syntheses from Room Temperature to 150 °C with and without Microwaves. Ceram. Int. 2012, 38, 2563–2568. [Google Scholar] [CrossRef]
  49. Mascolo, M.C.; Pei, Y.; Ring, T.A. Room Temperature Co-Precipitation Synthesis of Magnetite Nanoparticles in a Large Ph Window with Different Bases. Materials 2013, 6, 5549–5567. [Google Scholar] [CrossRef] [Green Version]
  50. Ianos̗, R.; Păcurariu, C.; Mihoc, G. Magnetite/Carbon Nanocomposites Prepared by an Innovative Combustion Synthesis Technique—Excellent Adsorbent Materials. Ceram. Int. 2014, 40 Pt B, 13649–13657. [Google Scholar] [CrossRef]
  51. He, Y.T.; Traina, S.J. Transformation of Magnetite to Goethite under Alkaline pH Conditions. Clay Miner. 2007, 42, 13–19. [Google Scholar] [CrossRef]
  52. López, J.; Chávez, A.M.; Rey, A.; Álvarez, P.M. Insights into the Stability and Activity of MIL-53(Fe) in Solar Photocatalytic Oxidation Processes in Water. Catalysts 2021, 11, 448. [Google Scholar] [CrossRef]
  53. Sun, H.; Xie, G.; He, D.; Zhang, L. Ascorbic Acid Promoted Magnetite Fenton Degradation of Alachlor: Mechanistic Insights and Kinetic Modeling. Appl. Catal. B Environ. 2020, 267, 118383. [Google Scholar] [CrossRef]
  54. Carbajo, J.; Quintanilla, A.; Garcia-Costa, A.L.; González-Julián, J.; Belmonte, M.; Miranzo, P.; Osendi, M.I.; Casas, J.A. The Influence of the Catalyst on the CO Formation during Catalytic Wet Peroxide Oxidation Process. Catal. Today 2021, 361, 30–36. [Google Scholar] [CrossRef]
  55. Rey, A.; Quiñones, D.H.; Álvarez, P.M.; Beltrán, F.J.; Plucinski, P.K. Simulated Solar-Light Assisted Photocatalytic Ozonation of Metoprolol over Titania-Coated Magnetic Activated Carbon. Appl. Catal. B Environ. 2012, 111–112, 246–253. [Google Scholar] [CrossRef]
  56. Quiñones, D.H.; Rey, A.; Álvarez, P.M.; Beltrán, F.J.; Plucinski, P.K. Enhanced Activity and Reusability of TiO2 Loaded Magnetic Activated Carbon for Solar Photocatalytic Ozonation. Appl. Catal. B Environ. 2014, 144, 96–106. [Google Scholar] [CrossRef]
  57. Pliego, G.; Garcia-Muñoz, P.; Zazo, J.A.; Casas, J.A.; Rodriguez, J.J. Improving the Fenton Process by Visible LED Irradiation. Environ. Sci. Pollut. Res. 2016, 23, 23449–23455. [Google Scholar] [CrossRef]
  58. García-Muñoz, P.; Zussblatt, N.P.; Pliego, G.; Zazo, J.A.; Fresno, F.; Chmelka, B.F.; Casas, J.A. Evaluation of Photoassisted Treatments for Norfloxacin Removal in Water Using Mesoporous Fe2O3-TiO2 Materials. J. Environ. Manag. 2019, 238, 243–250. [Google Scholar] [CrossRef]
  59. Oller, I.; Malato, S. Photo-Fenton Applied to the Removal of Pharmaceutical and Other Pollutants of Emerging Concern. Curr. Opin. Green Sustain. Chem. 2021, 29, 100458. [Google Scholar] [CrossRef]
  60. Domínguez, C.M.; Ocón, P.; Quintanilla, A.; Casas, J.A.; Rodriguez, J.J. Highly Efficient Application of Activated Carbon as Catalyst for Wet Peroxide Oxidation. Appl. Catal. B Environ. 2013, 140–141, 663–670. [Google Scholar] [CrossRef]
  61. Rey, A.; Hungria, A.B.; Duran-Valle, C.J.; Faraldos, M.; Bahamonde, A.; Casas, J.A.; Rodriguez, J.J. On the Optimization of Activated Carbon-Supported Iron Catalysts in Catalytic Wet Peroxide Oxidation Process. Appl. Catal. B Environ. 2016, 181, 249–259. [Google Scholar] [CrossRef]
  62. Rey, A.; Bahamonde, A.; Casas, J.A.; Rodríguez, J.J. Selectivity of Hydrogen Peroxide Decomposition towards Hydroxyl Radicals in Catalytic Wet Peroxide Oxidation (CWPO) over Fe/AC Catalysts. Water Sci. Technol. 2010, 61, 2769–2778. [Google Scholar] [CrossRef] [PubMed]
  63. Maity, D.; Choo, S.G.; Yi, J.; Ding, J.; Xue, J.M. Synthesis of magnetite nanoparticles via a solvent-free thermal decomposition route. J. Magn. Magn. Mater. 2009, 321, 1256–1259. [Google Scholar] [CrossRef]
  64. Grosvenor, A.P.; Kobe, B.A.; Biesinger, M.C.; Mcintyre, N.S. Investigation of multiplet splitting of Fe 2p XPS spectra and bonding in iron compounds. Surf. Interface Anal. 2004, 36, 1564–1574. [Google Scholar] [CrossRef]
  65. Chávez, A.M.; Rey, A.; Beltrán, F.J.; Álvarez, P.M. Solar Photo-Ozonation: A Novel Treatment Method for the Degradation of Water Pollutants. J. Hazard. Mater. 2016, 317, 36–43. [Google Scholar] [CrossRef] [PubMed]
  66. Eisenberg, G.M. Colorimetric Determination of Hydrogen Peroxide. Ind. Eng. Chem.-Anal. Ed. 1943, 15, 327–328. [Google Scholar] [CrossRef]
Figure 1. XRD patterns of recovered H2BDC and ICCD PDF 00-031-1916 file (A). FTIR spectra of pure and recovered H2BDC (B).
Catalysts 12 00271 g001
Figure 2. TGA-DTA-MS in air: (A) mass loss, and (B) gases released.
Catalysts 12 00271 g002
Figure 3. TGA-DTA of terephthalic acid in air.
Catalysts 12 00271 g003
Figure 4. XRD patterns (A) and Raman spectra (B) of the as-synthetized MBCs.
Catalysts 12 00271 g004
Figure 5. FTIR spectra of the as-synthetized materials.
Catalysts 12 00271 g005
Figure 6. Magnetization vs. applied magnetic field at 25 °C.
Catalysts 12 00271 g006
Figure 7. N2 adsorption-desorption isotherms.
Catalysts 12 00271 g007
Figure 8. Evolution of MTP normalized concentration during (A) dark CWPO and (B) simulated solar radiation-assisted CWPO. Conditions: CMTP,0 = 50 mg L−1, CMBC = 0.2 g L−1, pH0 = 7, T(A) = 20 °C, T(B) = 40 °C, CH2O2,0 = 50 Mm, Irradiance = 581 Wm−2.
Catalysts 12 00271 g008
Figure 9. Percentages of TOC removal and H2O2 depletion during photo-CWPO of MTP. Conditions: CMTP,0= 50 mg L−1, CMBC= 0.2 g L−1, pH0 = 7, T= 40 °C, CH2O2,0= 50 mM, Irradiance= 581 W m−2.
Catalysts 12 00271 g009
Figure 10. Evolution of MTP (A) and pH (B) during photo-CWPO processes with Fe3O4 and Fe3O4-AC materials. Conditions: CMTP,0 = 50 mg L−1, CMBC = 0.2 g L−1, pH0 = 7, T = 40 °C, CH2O2,0 = 50 mM, Irradiance = 581 W m−2.
Catalysts 12 00271 g010
Figure 11. (A) MTP and TOC removals and (B) efficiency of H2O2 use in MTP mineralization. Effect of H2O2 dosage. Conditions: CMTP,0 = 50 mg L−1, CMBC = 0.2 g L−1, pH0 = 7, T = 40 °C, Irradiance = 581 W m−2.
Catalysts 12 00271 g011
Figure 12. Percentage removals of MTP and TOC during CWPO runs reusing the Fe3O4-AC catalyst. Conditions: CMTP,0= 50 mg L−1, CMBC= 0.2 g L−1, pH0 = 7, T= 40 °C, Irradiance= 581 W m−2.
Catalysts 12 00271 g012
Figure 13. High-resolution XPS spectra of Fe 2p region of fresh and reused Fe3O4-AC catalyst after CWPO.
Catalysts 12 00271 g013
Figure 14. Green synthesis of MBCs.
Catalysts 12 00271 g014
Table 1. Synthesis conditions, yield, and H2BDC recovery in the preparation of some MBCs.
MBCCarbon Mass (g)VNaOH (mL)VTotal (mL)H2BDC (g)FeCl2·4H2O (g)T (°C)Yield (%)(H2BDC)R (%)
Fe3O4-20700.8351.02099.999
Fe3O4-G0.320700.8351.02099.598
Fe3O4-GO0.320700.8351.02097.197
Fe3O4-AC0.320700.8351.02099.996
Fe3O4-ACR0.320700.8351.02099.996
Fe3O4-ACL6400140016.7202099.996
Table 2. Elemental analysis of recovered H2BDC.
SampleC (wt.%)H (wt.%)N (wt.%)O (wt.%)
H2BDC-t57.843.640.0038.52
H2BDC-R57.503.590.0338.88
Table 3. Elemental analysis, WDXRF, and TG results of some MBCs.
Elemental AnalysisWDXRFTGA-DTA-MS
MBCC (wt.%)H (wt.%)N (wt.%)Fe (wt.%)Fe3O4 (wt.%)C (wt.%)
Fe3O40.730.000.0072.36100.00<0.5
Fe3O4-G37.000.470.1144.8962.0438.55
Fe3O4-GO22.000.910.0055.2876.4023.22
Fe3O4-AC32.000.710.2145.8563.3634.25
Table 4. Textural properties of the as-synthetized MBCs and their carbonaceous supports.
SampleSBET
(m2g−1)
SEXT
(m2g−1)
VMICRO
(cm3g−1)
VTOTAL
(cm3g−1)
G7605140.1181.122
GO1421220.0240.220
AC644370.3030.361
Fe3O463590.0050.374
Fe3O4-G3372710.0480.764
Fe3O4-GO1641310.0360.353
Fe3O4-AC2822130.0520.578
Fe3O4-AC-L2401810.0290.641
Fe3O4-AC-Reused2552550.0010.801
Table 5. Results from MBCs long-term stability tests at different pH.
MBCpH0pHfH2BDC (mg L−1)TOCH2BDC
(mg L−1)
TOC
(mg L−1)
(1) DiffTOC
(mg L−1)
(2) Fe
(mg L−1)
Fe3O44.004.610.930.540.920.380.18/0.12
6.006.131.040.600.58−0.020.37/0.28
7.007.060.910.531.100.580.99/0.16
8.007.960.980.570.810.241.34/0.26
10.009.731.020.591.200.611.69/0.11
Fe3O4-G4.004.458.224.755.160.410.19/0.17
6.006.0127.0115.6115.790.180.39/0.10
7.006.9331.5318.2218.360.140.42/0.16
8.007.7030.6217.6918.951.26>4.00/0.16
10.009.5731.7418.3419.851.51>4.00/0.17
Fe3O4-GO4.004.594.462.582.25−0.33>4.00/0.12
6.006.0814.488.379.631.26>4.00/0.09
7.006.9019.6011.3213.932.61>4.00/0.10
8.007.6322.1012.7714.952.18>4.00/0.14
10.008.4320.7712.0016.184.18>4.00/0.11
Fe3O4-AC4.004.553.301.912.240.330.19/0.19
6.006.069.955.756.170.430.16/0.16
7.007.0213.257.668.170.510.28/0.17
8.007.6217.119.899.06−0.830.34/0.11
10.008.6519.4811.2510.61−0.640.43/0.11
(1) Difference between actual TOC and theoretical TOC calculated from H2BDC concentration (TOCH2BDC). (2) Fe analyzed after separation with a magnet/after filtration.
Table 6. Results from MBCs stability tests under oxidizing conditions.
MBCTestTime
(min)
H2BDC
(mg L−1)
TOC
(mg L−1)
pH
Fe3O4Rad+O200.230.127.38
1800.290.527.35
Rad+O2+H2O200.240.117.37
1800.000.557.30
Fe3O4-GRad+O203.100.167.21
1803.181.276.10
Rad+O2+H2O203.140.177.20
1801.562.526.50
Fe3O4-GORad+O200.530.527.05
1801.021.236.35
Rad+O2+H2O200.600.547.03
1800.002.055.92
Fe3O4-GORad+O200.760.107.63
1800.780.456.32
Rad+O2+H2O201.270.117.65
1800.000.655.84
Table 7. Pseudo-first-order apparent kinetic constants for MTP degradation and efficiency of H2O2 utilization in photo-CWPO runs.
SampleConditionskapp-MTP
(min−1)
R2η-TOC-H2O2
(mol C/mol H2O2)
Fe3O450 mM H2O2, pH0 72.5 × 10−30.9560.074
Fe3O4-G50 mM H2O2, pH0 76.0 × 10−30.9970.129
Fe3O4-GO50 mM H2O2, pH0 79.1 × 10−30.9980.079
Fe3O4-AC50 mM H2O2, pH0 79.6 × 10−30.9970.054
Fe3O4-AC50 mM H2O2, pH 7 (*)5.1 × 10−30.9960.026
Fe3O4-AC6.5 mM H2O2, pH0 71.7 × 10−30.9980.205
Fe3O4-AC10 mM H2O2, pH0 74.1 × 10−30.9910.230
Fe3O4-AC30 mM H2O2, pH0 77.4 × 10−30.9740.095
(*) pH controlled during the run at 7.0.
Table 8. Concentrations of short-chain organic acids, iron, and terephthalic acid after photo-CWPO runs.
MBCCAcetic acid
(mg L−1)
CFormic acid
(mg L−1)
COxalic acid
(mg L−1)
Fe
(mg L−1)
CH2BDC
(mg L−1)
Fe3O40.442.850.860.120.23
Fe3O4-G2.4212.52.160.063.40
Fe3O4-GO2.1010.22.330.071.06
Fe3O4-AC1.9713.43.650.060.88
Publisher’s Note: MDPI stays neutral with regard to jurisdictional claims in published maps and institutional affiliations.

