Article

Mixed Oxides Derived from Hydrotalcites Mg/Al Active in the Catalytic Transfer Hydrogenation of Furfural to Furfuryl Alcohol

by
Raquel López-Asensio
1,
Juan Antonio Cecilia-Buenestado
1,*,
Concepción Herrera-Delgado
2,
María Ángeles Larrubia-Vargas
2,
Cristina García-Sancho
1,
Pedro Jesús Maireles-Torres
1 and
Ramón Moreno-Tost
1,*
1
Departamento de Química Inorgánica, Cristalografía y Mineralogía (Unidad Asociada al ICP-CSIC), Campus de Teatinos, Universidad de Málaga, 29071 Málaga, Spain
2
Departamento de Ingeniería Química, Facultad de Ciencias, Campus de Teatinos, Universidad de Málaga, 29071 Málaga, Spain
*
Authors to whom correspondence should be addressed.
Catalysts 2023, 13(1), 45; https://doi.org/10.3390/catal13010045
Submission received: 6 November 2022 / Revised: 3 December 2022 / Accepted: 20 December 2022 / Published: 26 December 2022
(This article belongs to the Special Issue Metal Oxide Catalysts: Synthesis and Applications)

Abstract

:
Herein, a family of Mg/Al hydrotalcites was synthesized as catalytic precursors of MgAlOx mixed oxides. Both hydrotalcites and mixed oxides were characterized and the mixed oxides were tested in the reduction of furfural to yield furfuryl alcohol by MPV reaction using isopropanol as hydrogen donor. Different catalytic parameters were tested, such as the type of alcohol, calcination temperature of the hydrotalcite, and reaction temperature. Furfural and isopropanol were adsorbed on the MgAl-3 catalyst to follow the species adsorbed on the catalyst by FTIR analysis. The results showed that the isopropanol was activated as isopropoxide and furfural changed the adsorption site with increasing temperature but maintaining the h1-conformation. The catalytic performances were associated with the basicity of the catalysts and the deactivation processes have been attributed to the existence of adsorbed species on the surface, mainly due to furfural-derived compounds. The catalysts were reused in three consecutive cycles showing a sharp drop of catalytic activity. To recover the activity, the catalysts were calcined at 500 °C but the activity was only partially recovered. The XPS analysis after reactivation showed that the catalyst surface was modified due to the segregation of hydroxides of Mg and Al.

1. Introduction

Lignocelullosic biomass is a non-edible source with high potential to obtain chemicals, which can only be obtained from fossil fuels. Lignocellulosic biomass is composed of the biopolymers lignin, hemicellulose, and cellulose [1,2]. The hydrolysis of hemicellulose generates monomers of sugars, mainly pentoses, which can be converted into furfural [2].
Furfural has been synthesized industrially since 1921 when Quaker Oats Co. produced furfural from oat hulls [3]. Since this date, its production has been gradually increasing, reaching an annual production of around 370,000 ton/year [4]. Nowadays, furfural is considered one of most promising platform molecules since it can be the starting point for the synthesis of resins, solvents, biofuels and so on [5,6]. This versatility arises from the presence of an α,β-unsaturated aldehyde with C=O and C=C bonds that provides high reactivity to furfural, favoring a wide range of reactions, such as oxidation reactions, hydrogenation, ring opening and decarboxylation [7].
The furfural hydrogenation can be carried out both in gas and liquid phase using a transition metal [8,9,10,11,12] and hydrogen as reductant. The use of hydrogen presents a number of disadvantages such as high pressures of working which could cause safety issues, and increased equipment costs [13]. Moreover, molecular hydrogen has the disadvantage of depending on fossil resources [14].
Meerwein-Ponndorf-Verley (MPV) reaction is a highly sustainable process to reduce ketones or aldehydes to alcohols. MPV is a very attractive reaction since it displays many favorable features such as high selectivity, mild conditions, and uses safe, relatively inexpensive and nontoxic reducing agents [15,16,17]. The MPV reaction takes place via hydride transfer from a secondary alcohol to a carbonyl group of a ketone or aldehyde through six-membered intermediate by coordination to a Lewis acidic metal center [18,19], mainly aluminum alkoxides [20,21,22,23], obtaining satisfactory results. However, the use of homogeneous catalysts, such as alkoxides, also displays limitations related with the high sensibility of these alkoxides to the moisture as well as the increase in the costs attributed to separation and purification processes. In order to increase the sustainability of the MPV reaction, the use of metal oxides as active phase has emerged to replace the alkoxides. Thus, several solid acid catalysts based on aluminum [24,25], zirconium [26,27,28,29], hafnium [27,30], tin [31,32,33], and even iron [34] have been successfully evaluated in the MPV reaction.
Several authors have pointed out that the incorporation of basic sites has a beneficial effect in the MPV reaction. In this sense, several authors have reached high conversion values in the reduction of cinnamaldehyde, citronellal, citral or crotonaldehyde using MgO-Al2O3 or Fe2O3-Al2O3 mixed oxides [35,36,37,38,39]. In all cases, these mixed oxides have been synthesized from layered double hydroxides (LDHs), also named hydrotalcites, whose chemical formulae is M(1-x)2+ Mx3+ (OH)2)x+ (Ax/m)x− nH2O. These structures are formed by metal hydroxide sheets where the M2+ cations (Mg2+, Fe2+, Ni2+, Cu2+, Zn2+, Co2+) are partially replaced by M3+ cations (Al3+, Fe3+, Cr3+), which generate deficiencies of positive charge in the sheets that must be counterbalanced with the incorporation of anions, mainly CO32−, in the interlayer space [40]. The calcination of the hydrotalcites leads to mixed oxide species with high specific surface areas, which imply a high amount of available active sites.
The aim of this research is the synthesis of Mg-Al hydrotalcites with a Mg2+/Al3+ molar ratio in the range of 1–4. These materials were calcined to obtain their respective mixed oxides, which were used as catalysts in the furfural reduction through the MPV reaction. Previous research has reported the MPV reduction of furfural using zeolites [41,42,43] or mesoporous silicas with heteroatoms incorporated into their framework to create Lewis acid sites [29,44]. The high reactivity of these catalysts leads to uncontrolled side reactions since furfural is reduced to furfuryl alcohol. Then, furfuryl alcohol can react with another furfuryl alcohol or the sacrificing alcohol forming difurfuryl ether or alkyl-furfuryl ether [29,41,44] (Scheme 1).

2. Results and Discussion

2.1. Characterization of the Catalysts

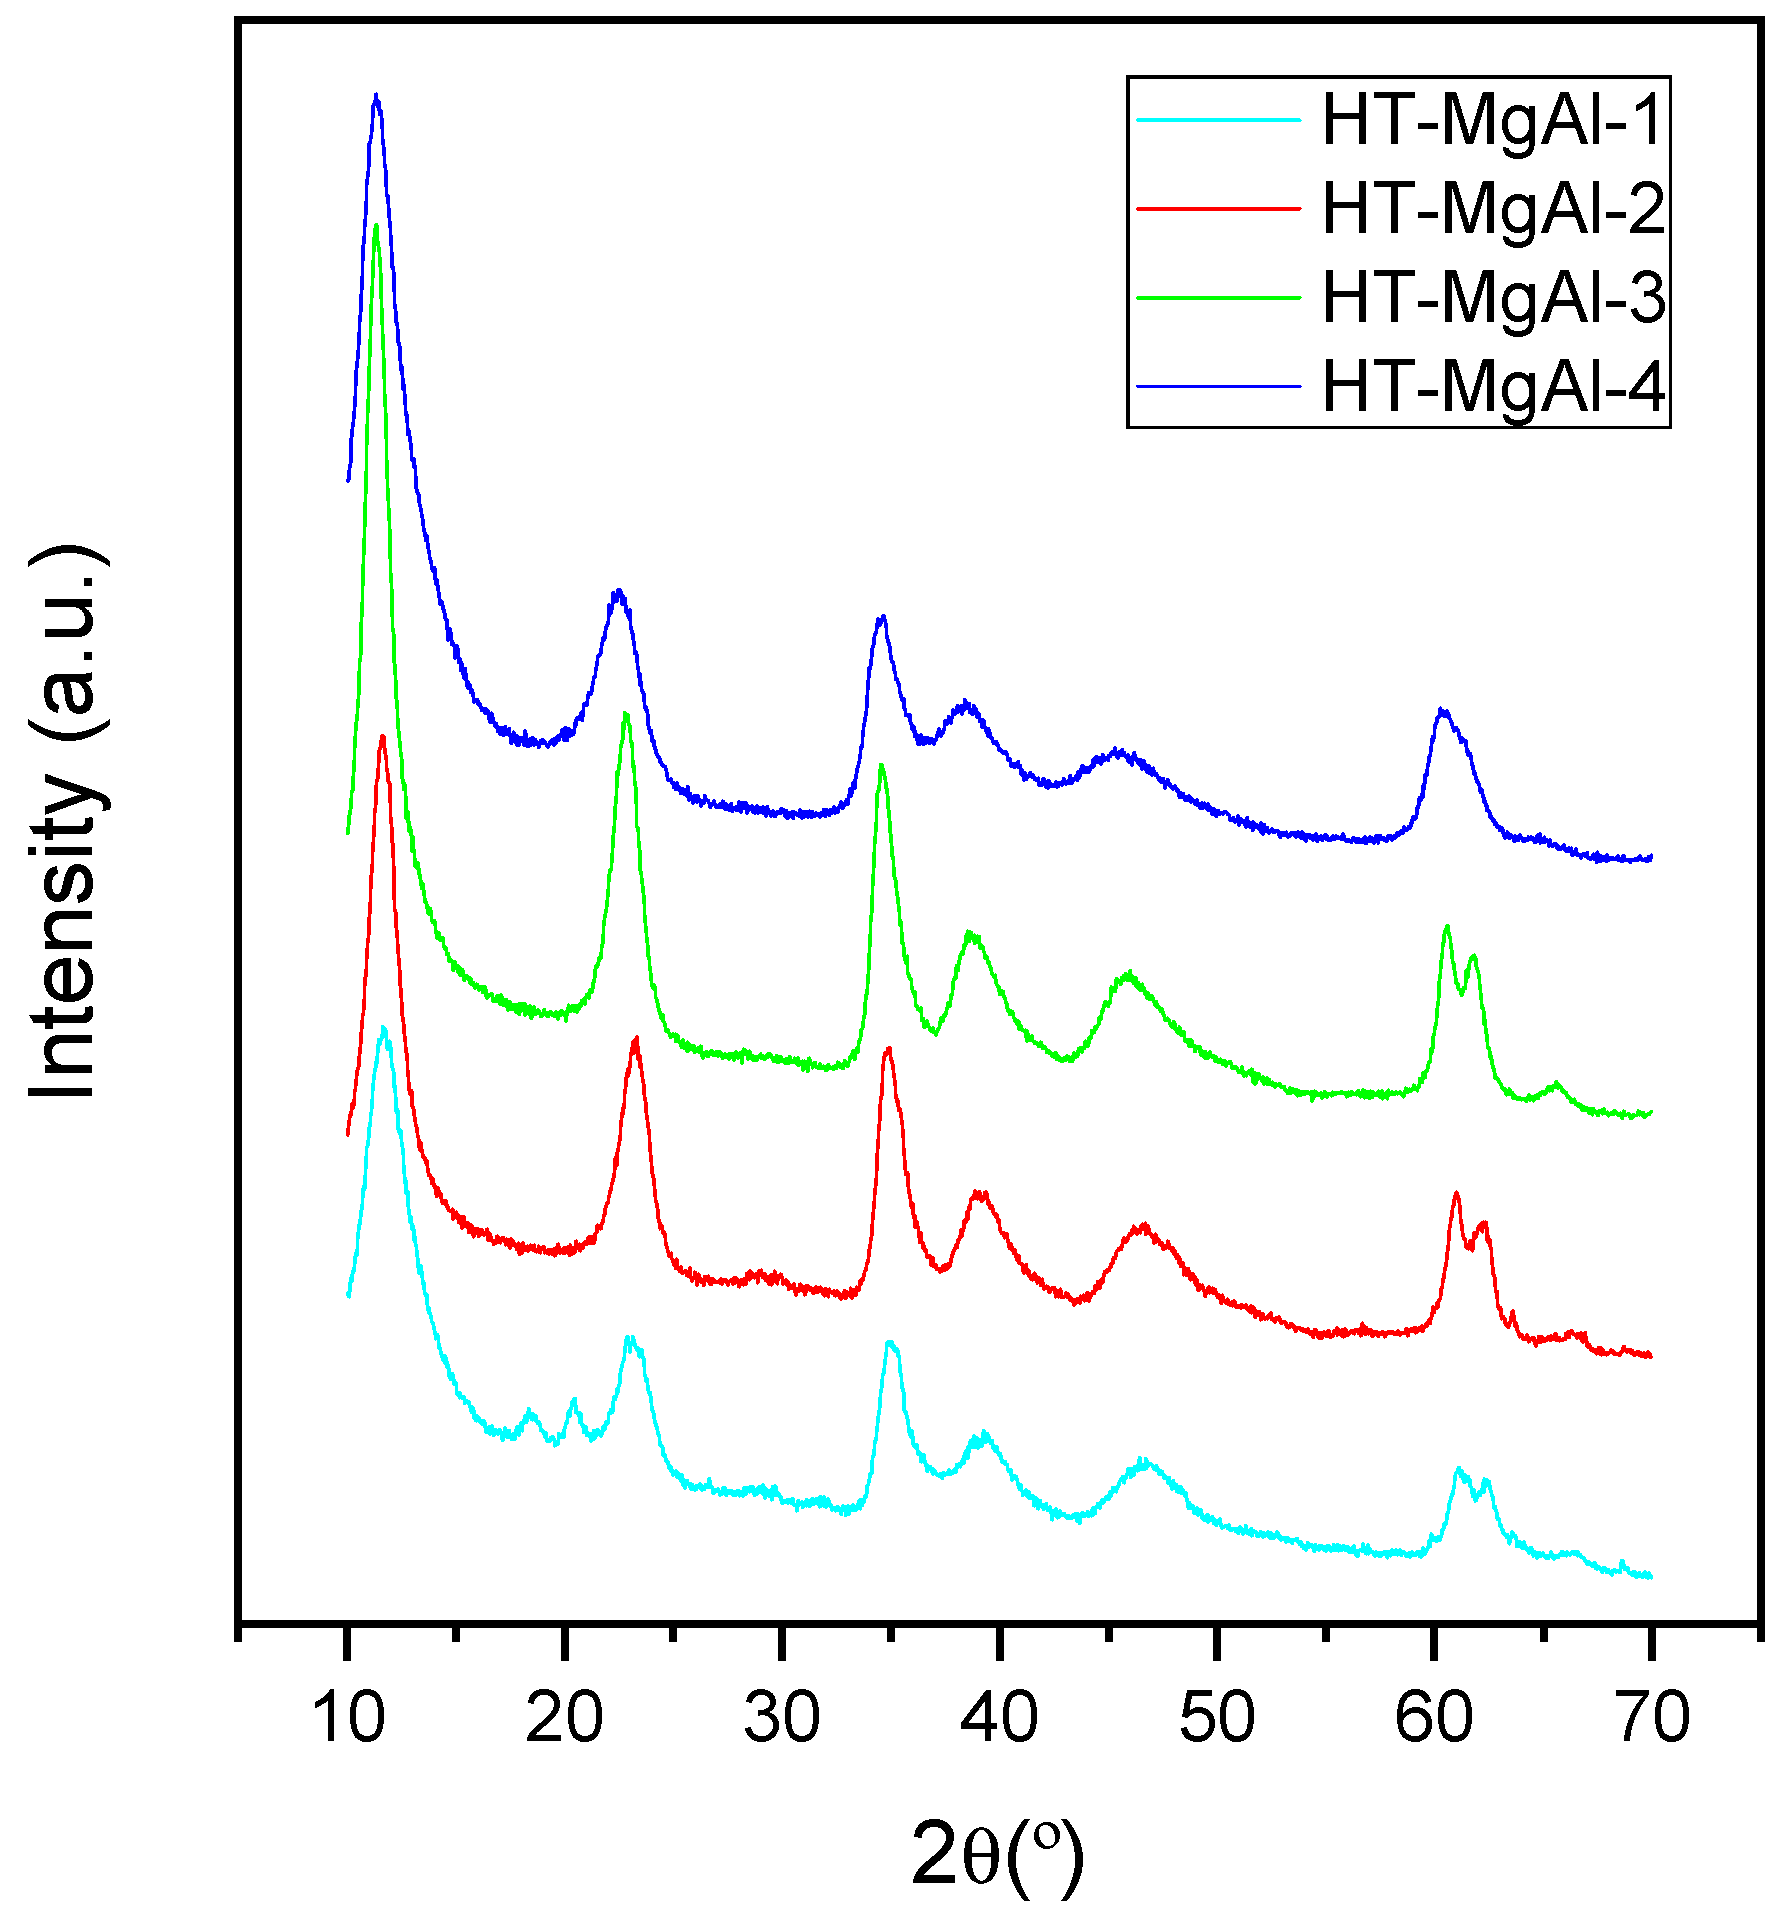
The X-ray diffractograms of the MgAl-hydrotalcites (Figure 1) show diffraction peaks located at 2θ (°) = 11.5, 23.3, 34.7, 38.7, 45.8, 60.6 and 61.8 attributed to layered double hydroxides (ICSD: 98-008-1963). Among them, the peaks located at 11.5, 23.3 and 34.7° correspond to the (003), (006) and (009) planes, which confirm the formation of well-defined crystalline sheets with rhombohedral symmetry [45,46]. In all cases, the hydrotalcites did not show phase segregation such as Mg(OH)2 or Al(OH)3 except the HT-MgAl-1 which showed the typical diffraction peaks ascribed to the hydroxide of aluminum (ICSD: 01-085-1049) at 18.3 and 20.5°, indicating that hydrotalcite phase was accompanied by aluminum hydroxide. On the other hand, it is also noteworthy that the diffraction peaks are narrower and more intense according as the Mg increases, reaching the maximum crystallinity for Mg/Al molar ratio or 3.
The cell parameters were determined by the Rietveld method, and the crystal size was estimated by the Williamson-Hall method (Table 1). The unit cell parameter (a) is the distance between two metal ions within the layers. This data was determined from the d-spacing of the (110) reflection (a = 2d110). The c parameter is three times the distance between adjacent hydroxide and it has been also calculated from the (003) reflection (c = 3d003). From Table 1, it can be observed that the c parameter was reduced as the Mg2+ increases, probably due to stronger coulombic interactions between the positively charged layers and the anions located in the interlayer spacing. In the case of a parameter, a slight increase can be observed when a higher proportion of Mg2+ is incorporated. This fact can be attributed to the difference between the ionic radius of the Mg2+ (0.72 Å) and Al3+ (0.53 Å).
The particle size estimated by the Williamson-Hall method reveals that all hydrotalcites have a small particle size, below 15 nm in the c direction.
In order to choose the appropriate calcination temperature to obtain their respective metal oxides, TG/DTA analysis were performed (Figure 2A,B). Both TG and DTA follow similar trend to those shown for other hydrotalcites reported in the literature [45,47,48,49]. All hydrotalcites display a first water loss below 215 °C attributed to the physisorbed water on the surface as well as the water located within the interlayer space of the hydrotalcites. The second weight loss, which ended between 380 and 420 °C, was related to the dehydroxylation of the brucite sheets and the decomposition of the carbonate species located within the interlayer space. Above 500 °C, the brucite-type laminar structure collapsed forming its respective metal mixed oxides. Therefore, the calcination temperature selected to obtain the active phase was 500 °C.
The weight losses are shown in Table 2 and the DTG plots are shown in Figure 2B. In general, three main contributions in weight loss can be depicted for the pristine hydrotalcites. The first one, at the lowest temperature, was higher for the HT-MgAl-1 sample than for the rest. This fact could be attributed to the presence of segregated Al(OH)3. Indeed, the DTG plot of this sample showed a peak with a shoulder at a higher temperature whereas the other hydrotalcites only showed a single peak. This means that more than one thermal process is occurring for the HT-MgAl-1 sample for this first weight loss. As the Mg/Al ratio increased, the weight loss shifted to lower temperatures and the percentage also decreased in the order HT-MgAl-2 > HT-MgAl-3 > HT-MgAl-4. It is therefore likely that the sample with a Mg/Al molar ratio of 2 may also have aluminum hydroxide not detected by XRD analysis. The opposite was true for the second weight loss. The sample with the lowest Mg/Al ratio showed the lowest weight loss. This fact means that the amount of carbonates in the interlayer region was lower for this hydrotalcite. This experimental fact could explain the high value of c parameter, which is considered a signal of the attraction between the layers. Thus, as the carbonates’ concentration decreased, the attraction of the layers reduced, and the positively neighboring charged layers repelled each other.
The X-ray diffractograms (Figure 3) of the calcined hydrotalcites show only three broad diffraction peaks located at 2θ (°) = 36.7, 42.9 and 63.3 assigned to the presence of MgO phase in the form of periclase (ICSD: 98-002-6958). Moreover, the absence of diffraction peaks attributed to Al2O3 species is also noticeable, which suggests a high dispersion of the crystals of this phase; in spite of that the HT-MgAl-1 sample presented Al(OH)3.
For all mixed oxides, the MgO crystals were below 10 nm, and the Al2O3 particles must show an amorphous structure or crystals lower than 5 nm.
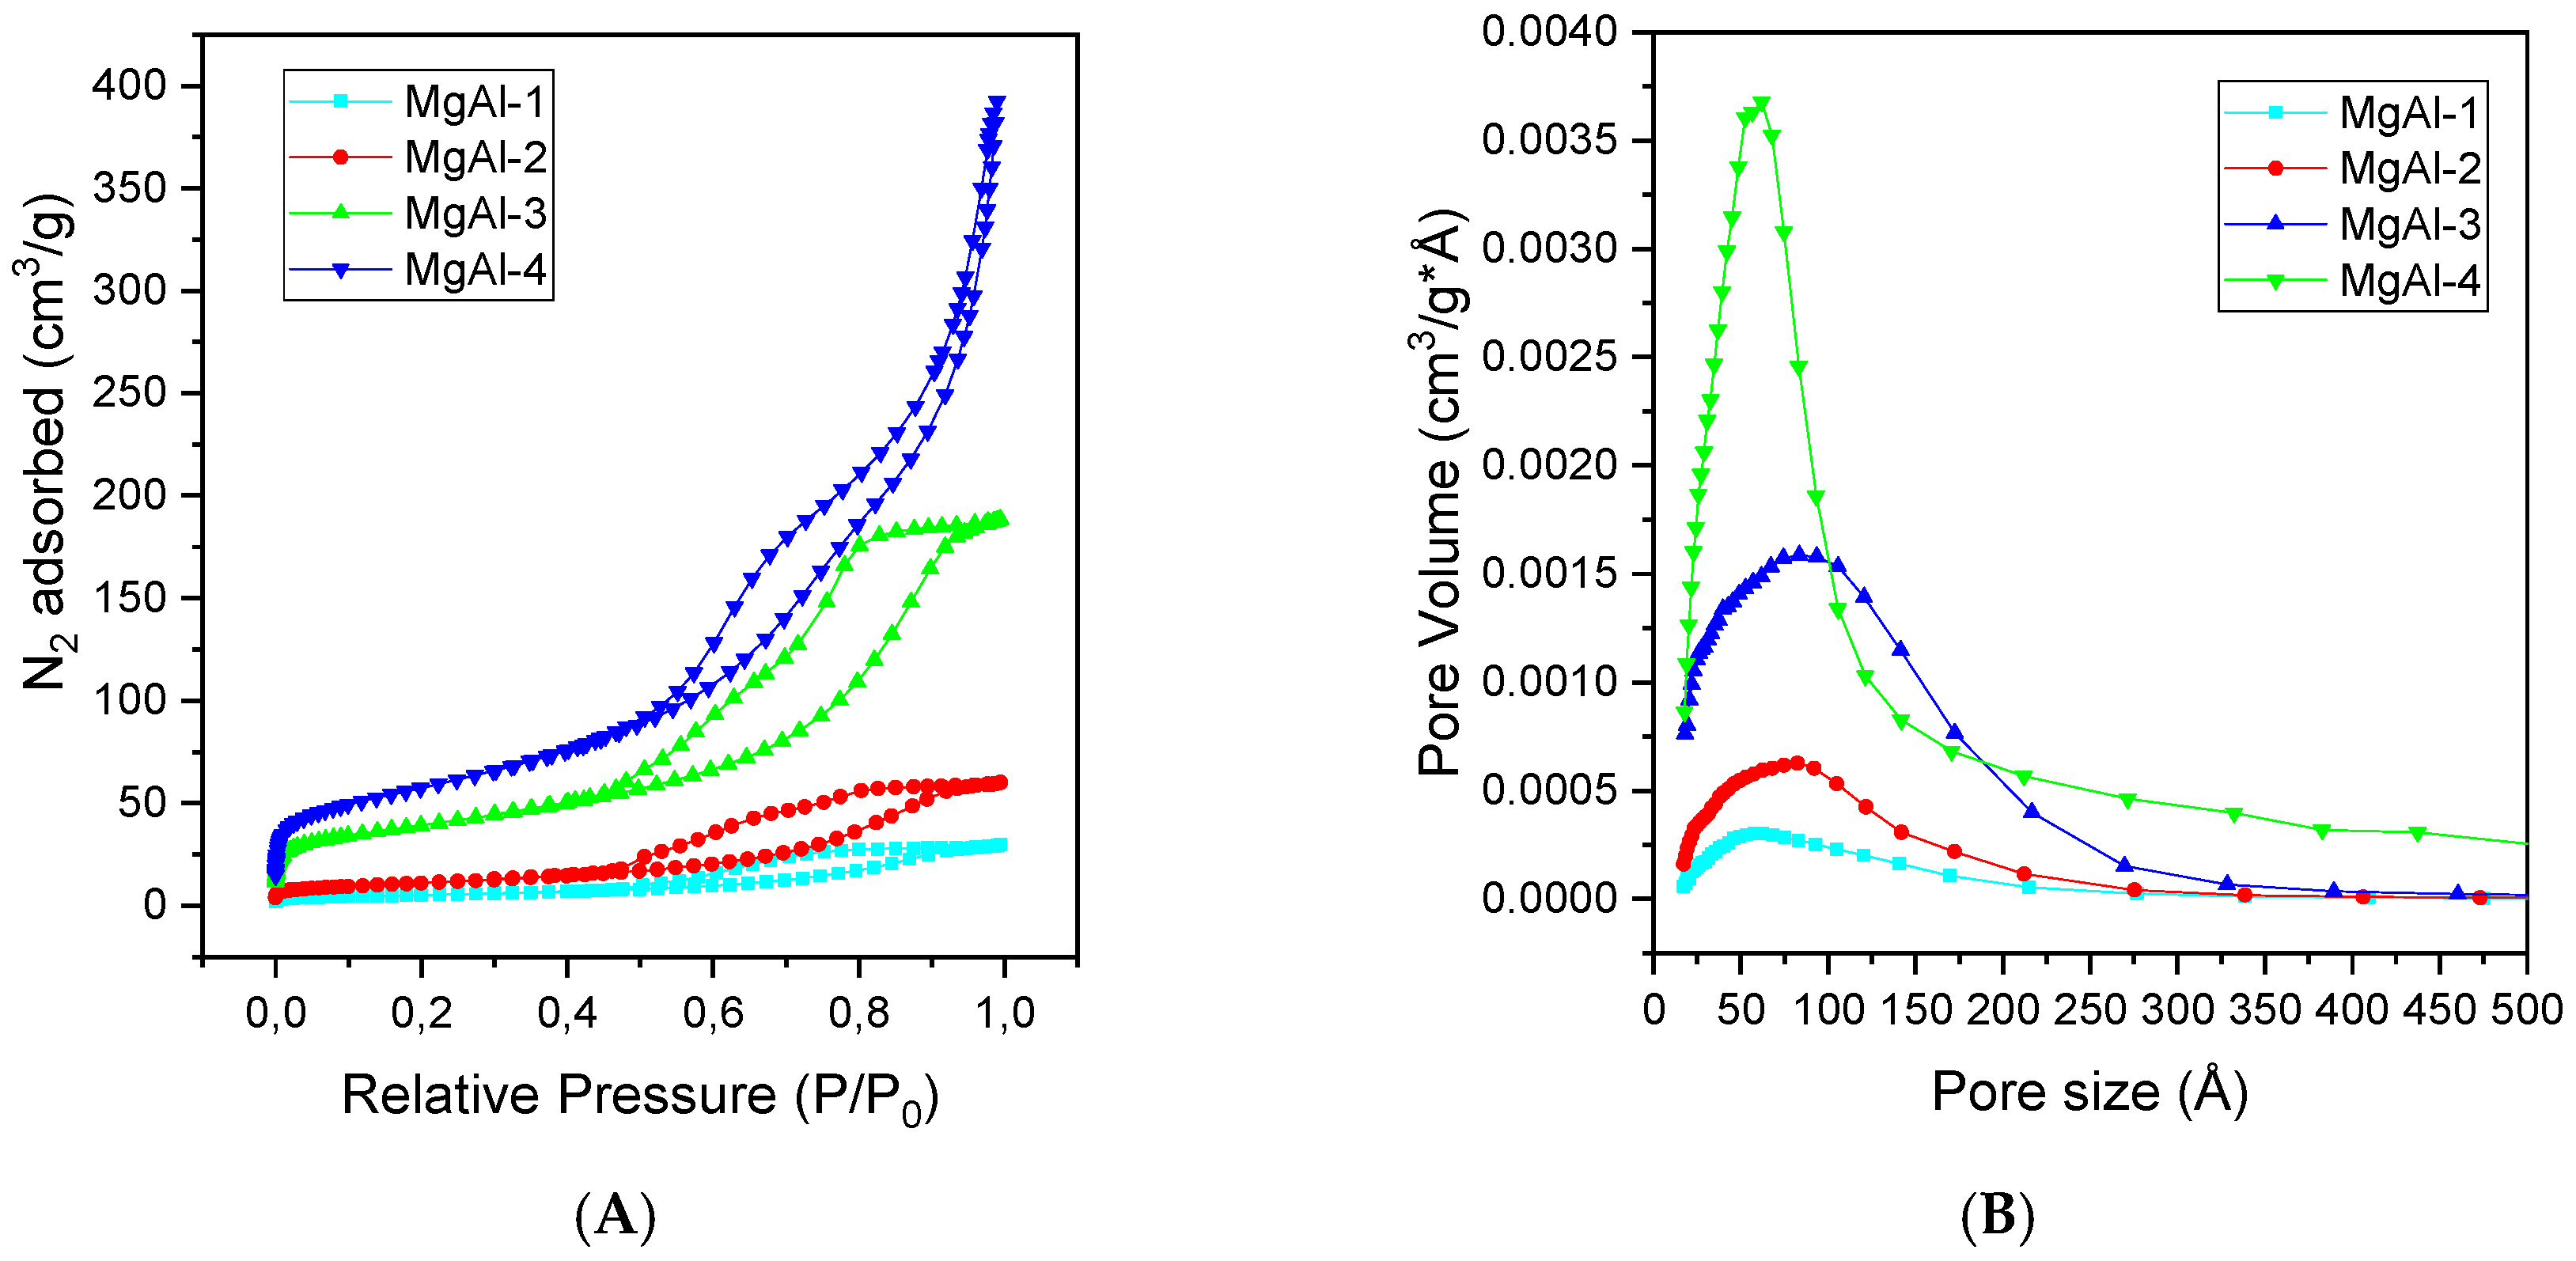
The textural properties of the mixed oxides MgAlOx were estimated by N2 adsorption-desorption at −196 °C. N2 adsorption-desorption isotherms (Figure 4A) of the mixed oxides can be considered as Type IV according to the IUPAC classification, which is ascribed to mesoporous materials. With regards to the hysteresis loop, MgAl-1, MgAl-2 and MgAl-3 can be classified as H2b being associated with pore blocking, but the size distribution of neck widths is now much larger. The hysteresis loop of MgAl-4 catalyst can be considered as H3, which is given by non-rigid aggregates of plate-like particles that are not completely filled with pore condenser [50]. The specific surface area was determined using the BET equation (Table 3). These data show how the SBET values increase according as the Mg2+ increases, reaching the highest values for the MgAl-4, at 205 m2g−1. It is likely that the presence of aluminum hydroxide could explain the low values of surface area measured for the mixed oxides MgAl-1 and MgAl-2, respectively, that it was transformed to highly dispersed alumina. It is well known [51] that the growth of hydrotalcite crystals follows the process known as “house of cards structure” in which crystals are stacked without following a predefined ordering. When hydrotalcites are calcined, the emission of gases (CO2 and H2O) generates part of the porosity [52,53] of the mixed oxides whereas the aforementioned structure generates the larger pores. This is observed in the pore size distributions which are wide and extend up to approximately 150–200 nm.
Finally, the pore size distribution was estimated by the BJH model for the adsorption branch of the N2 isotherm (Figure 4B) and it shows a wide distribution of sizes in the range of mesopores typically of the mixed oxides obtained after the calcination of hydrotalcites.
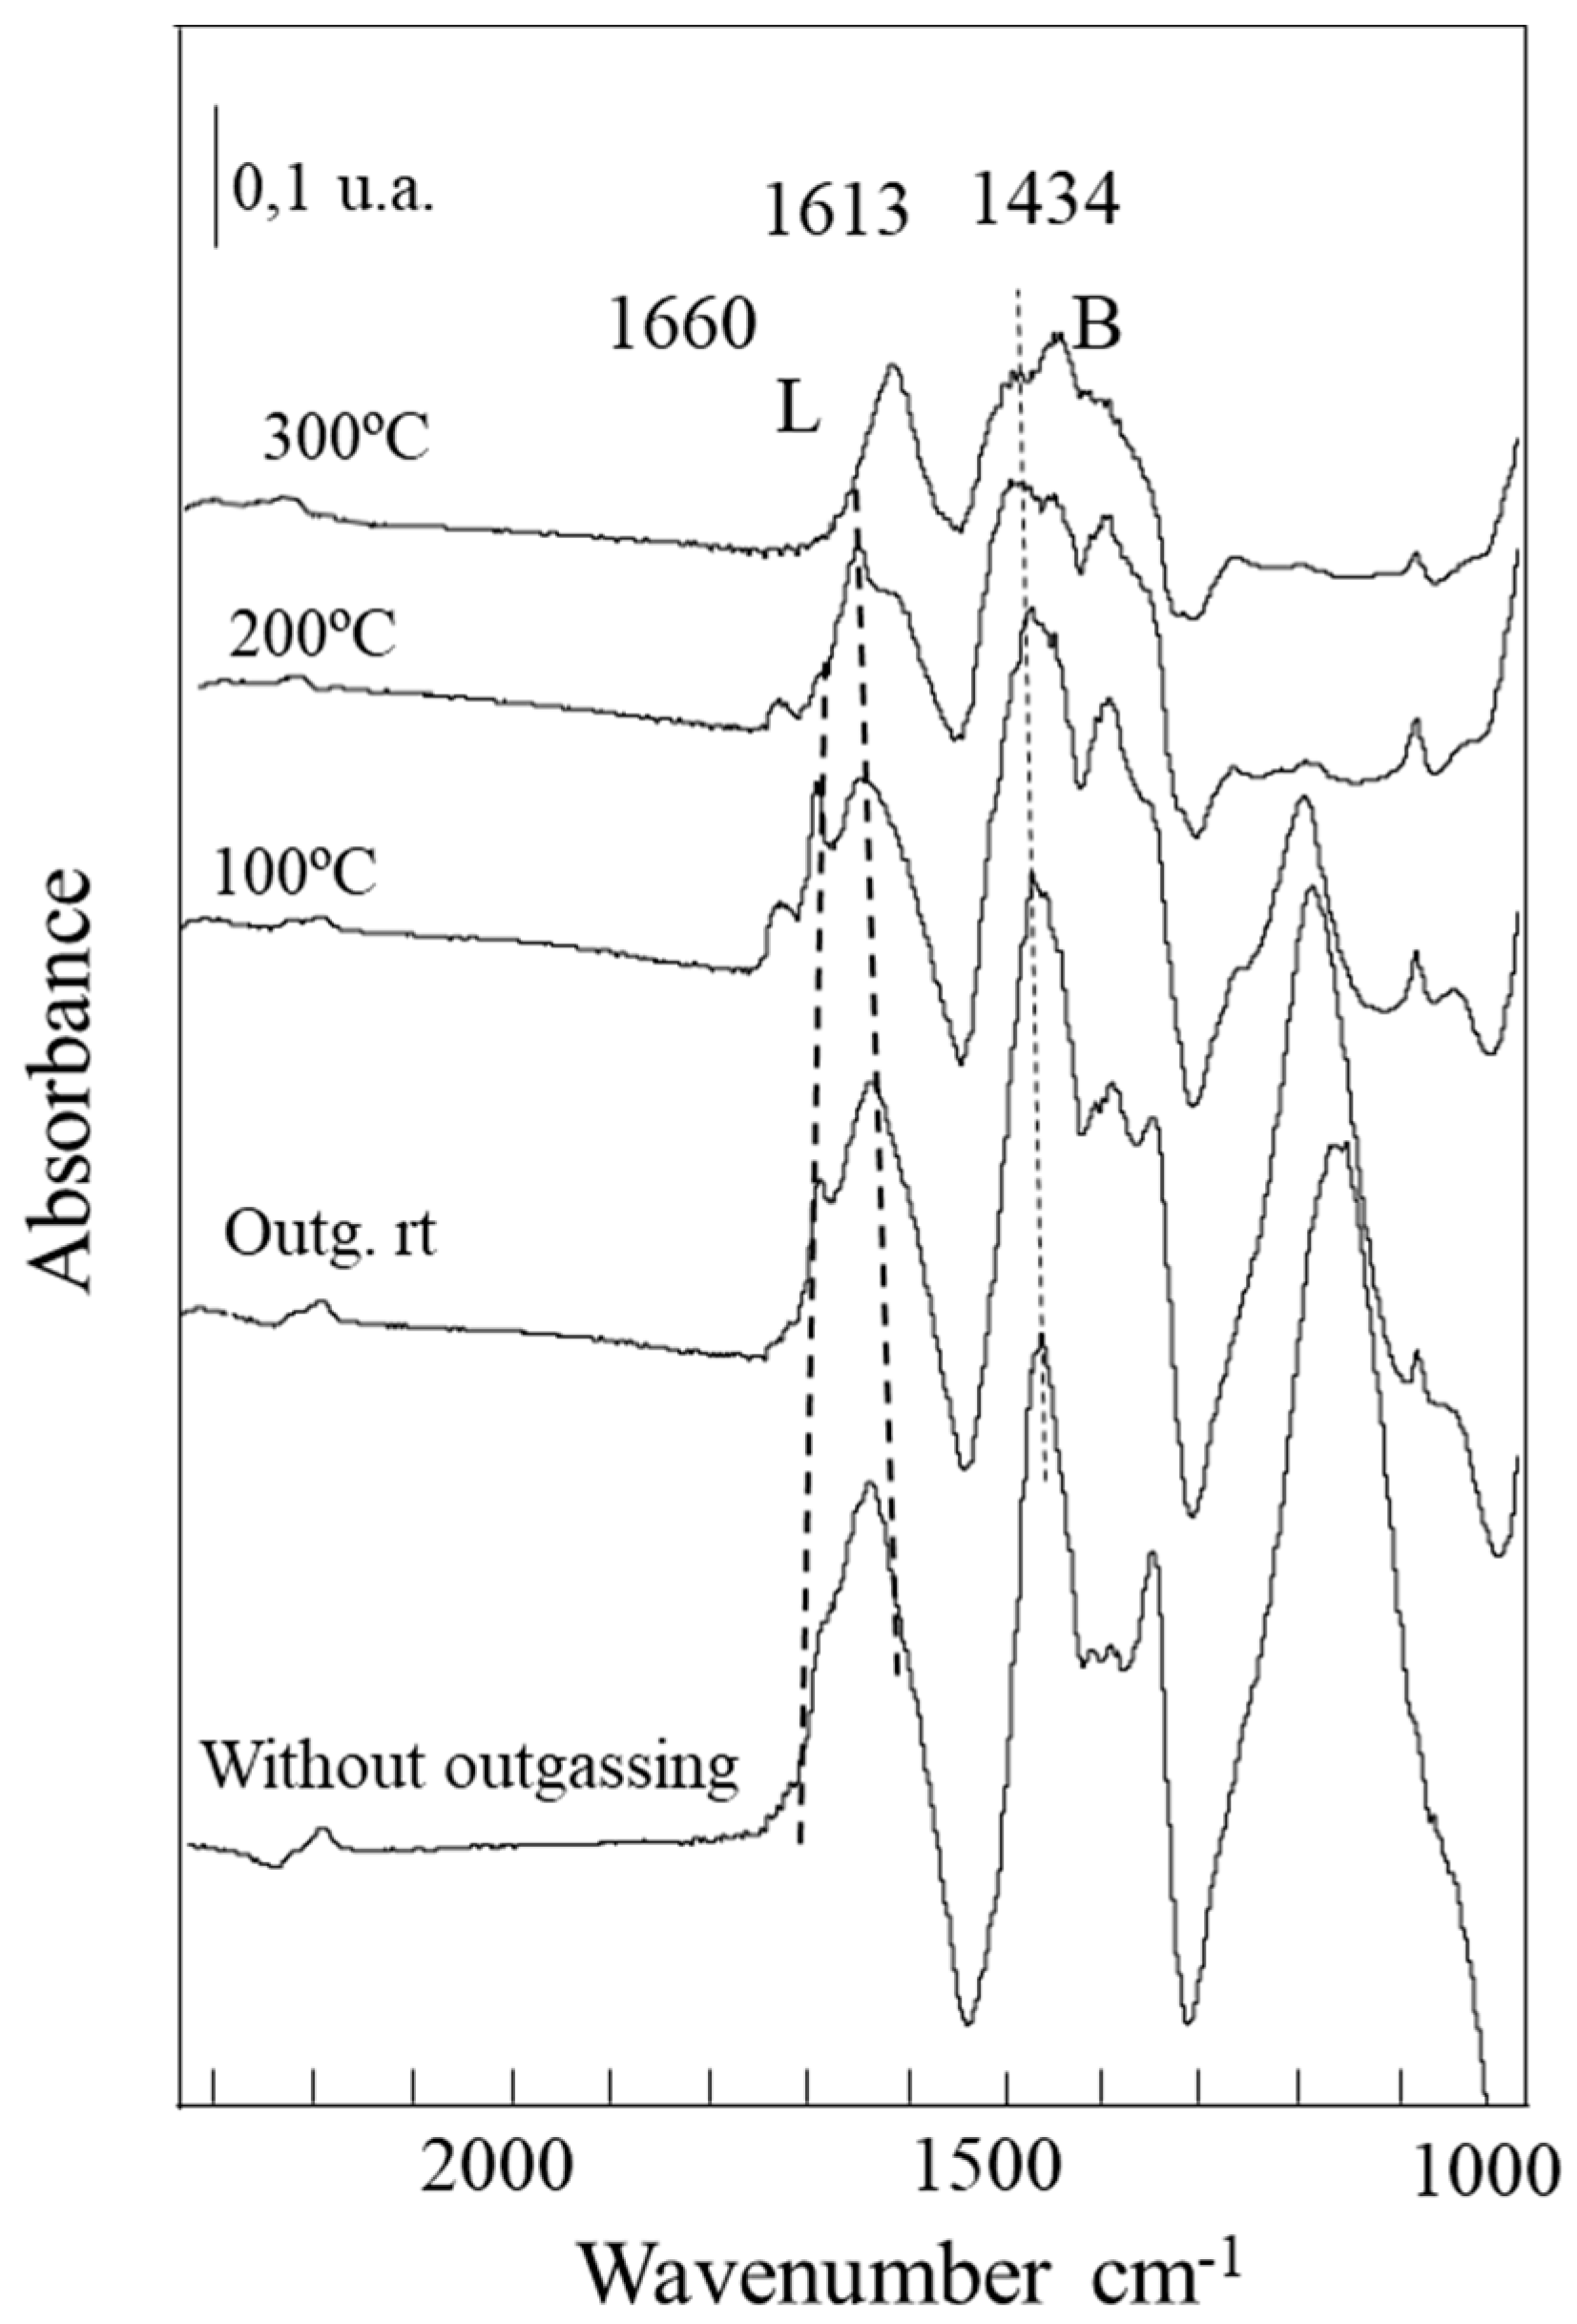
The amount of basic sites was determined by CO2-TPD (Figure 5 and Table 3). The desorption profiles reveal some features related to the Mg/Al molar ratio. Firstly, the MgAl-1 catalyst did not show a desorption peak centered roughly at 600 °C. Therefore, the MgAl-1 catalyst showed not only the lowest amount of basic sites, probably due to the presence of segregated alumina on its surface, but also the lowest strength of basic sites. Secondly, the band spanning from 100 °C to 400 °C shows a low temperature peak whose intensity increases with the Mg/Al molar ratio, accompanied by successive overlapping bands that shift at higher temperatures and an increase in intensity. These facts reveal that this band was the sum of different basic sites giving rise to a broad spectrum of basic sites with different strengths, from low to medium strength. These basic sites [54] have been ascribed to the presence of –OH Brönsted basic sites and Mg-O pairs, respectively. Finally, the peak at high temperature (c.a. 600 °C) was the major contribution to the basicity of the catalysts with the highest Mg/Al molar ratio, representing approximately 60% of the total basicity. These strong basic sites are correlated to the presence of oxide anions [54] on the surface of the catalysts. This distribution of basic sites was also observed for Padmasri et al. [55] for MgAl hydrotalcite calcined at 500 °C and Di Cosimo et al. [54]. Unfortunately, the analysis of acidity by means of the NH3-TPD analysis was inconclusive as the TCD signal was too low to be analyzed, indicating that ammonia adsorption was below the detection limit of the equipment in spite of some segregated alumina phase that might be dispersed on the surface of the catalysts. Anyway, the acidity of MgAl-3 catalyst was analyzed by FTIR spectroscopy after adsorbing NH3 (Figure 6).
Therefore, investigations of the adsorption of ammonia (Figure 6) by infrared spectroscopy were directed especially to the forms of the bond of the molecules with the surface. The spectral characteristics of an ammonia molecule are essentially different from those of an ammonium ion, providing for clear differentiation of such complexes by IR spectroscopy.
In the NH bending region the stronger band is observed as quite broad at 1459–1392 cm−1 (shifting a little bit after outgassing) with a maximum at 1434 cm−1 and is typically due to ammonia adsorbed on Brönsted acid sites (asymmetric NH4+ bending) and the intensity decreases with increasing desorption temperature. After desorption at 100 °C, this band practically disappears. The peak at 1660 cm−1 is due to NH4+ deformation; this peak changes appreciably only at high temperatures. Other behavior is observed for the peak at 1613 cm−1; this peak is associated with Lewis acidity and remains until desorption at 200 °C. The bands at 3382, 3358, 3217, 3167 cm−1 are due to N-H stretching of coordinated ammonia. The bands at 1613 cm−1 and in the region 1250–1200 cm−1 (not shown) are due to N-H asymmetric and symmetric deformation. The multiplicity of these bands suggests that more than one different coordinated species was formed. The adsorption of ammonia confirms that both the Lewis and the Bronsted type are present at the surface of the catalyst.
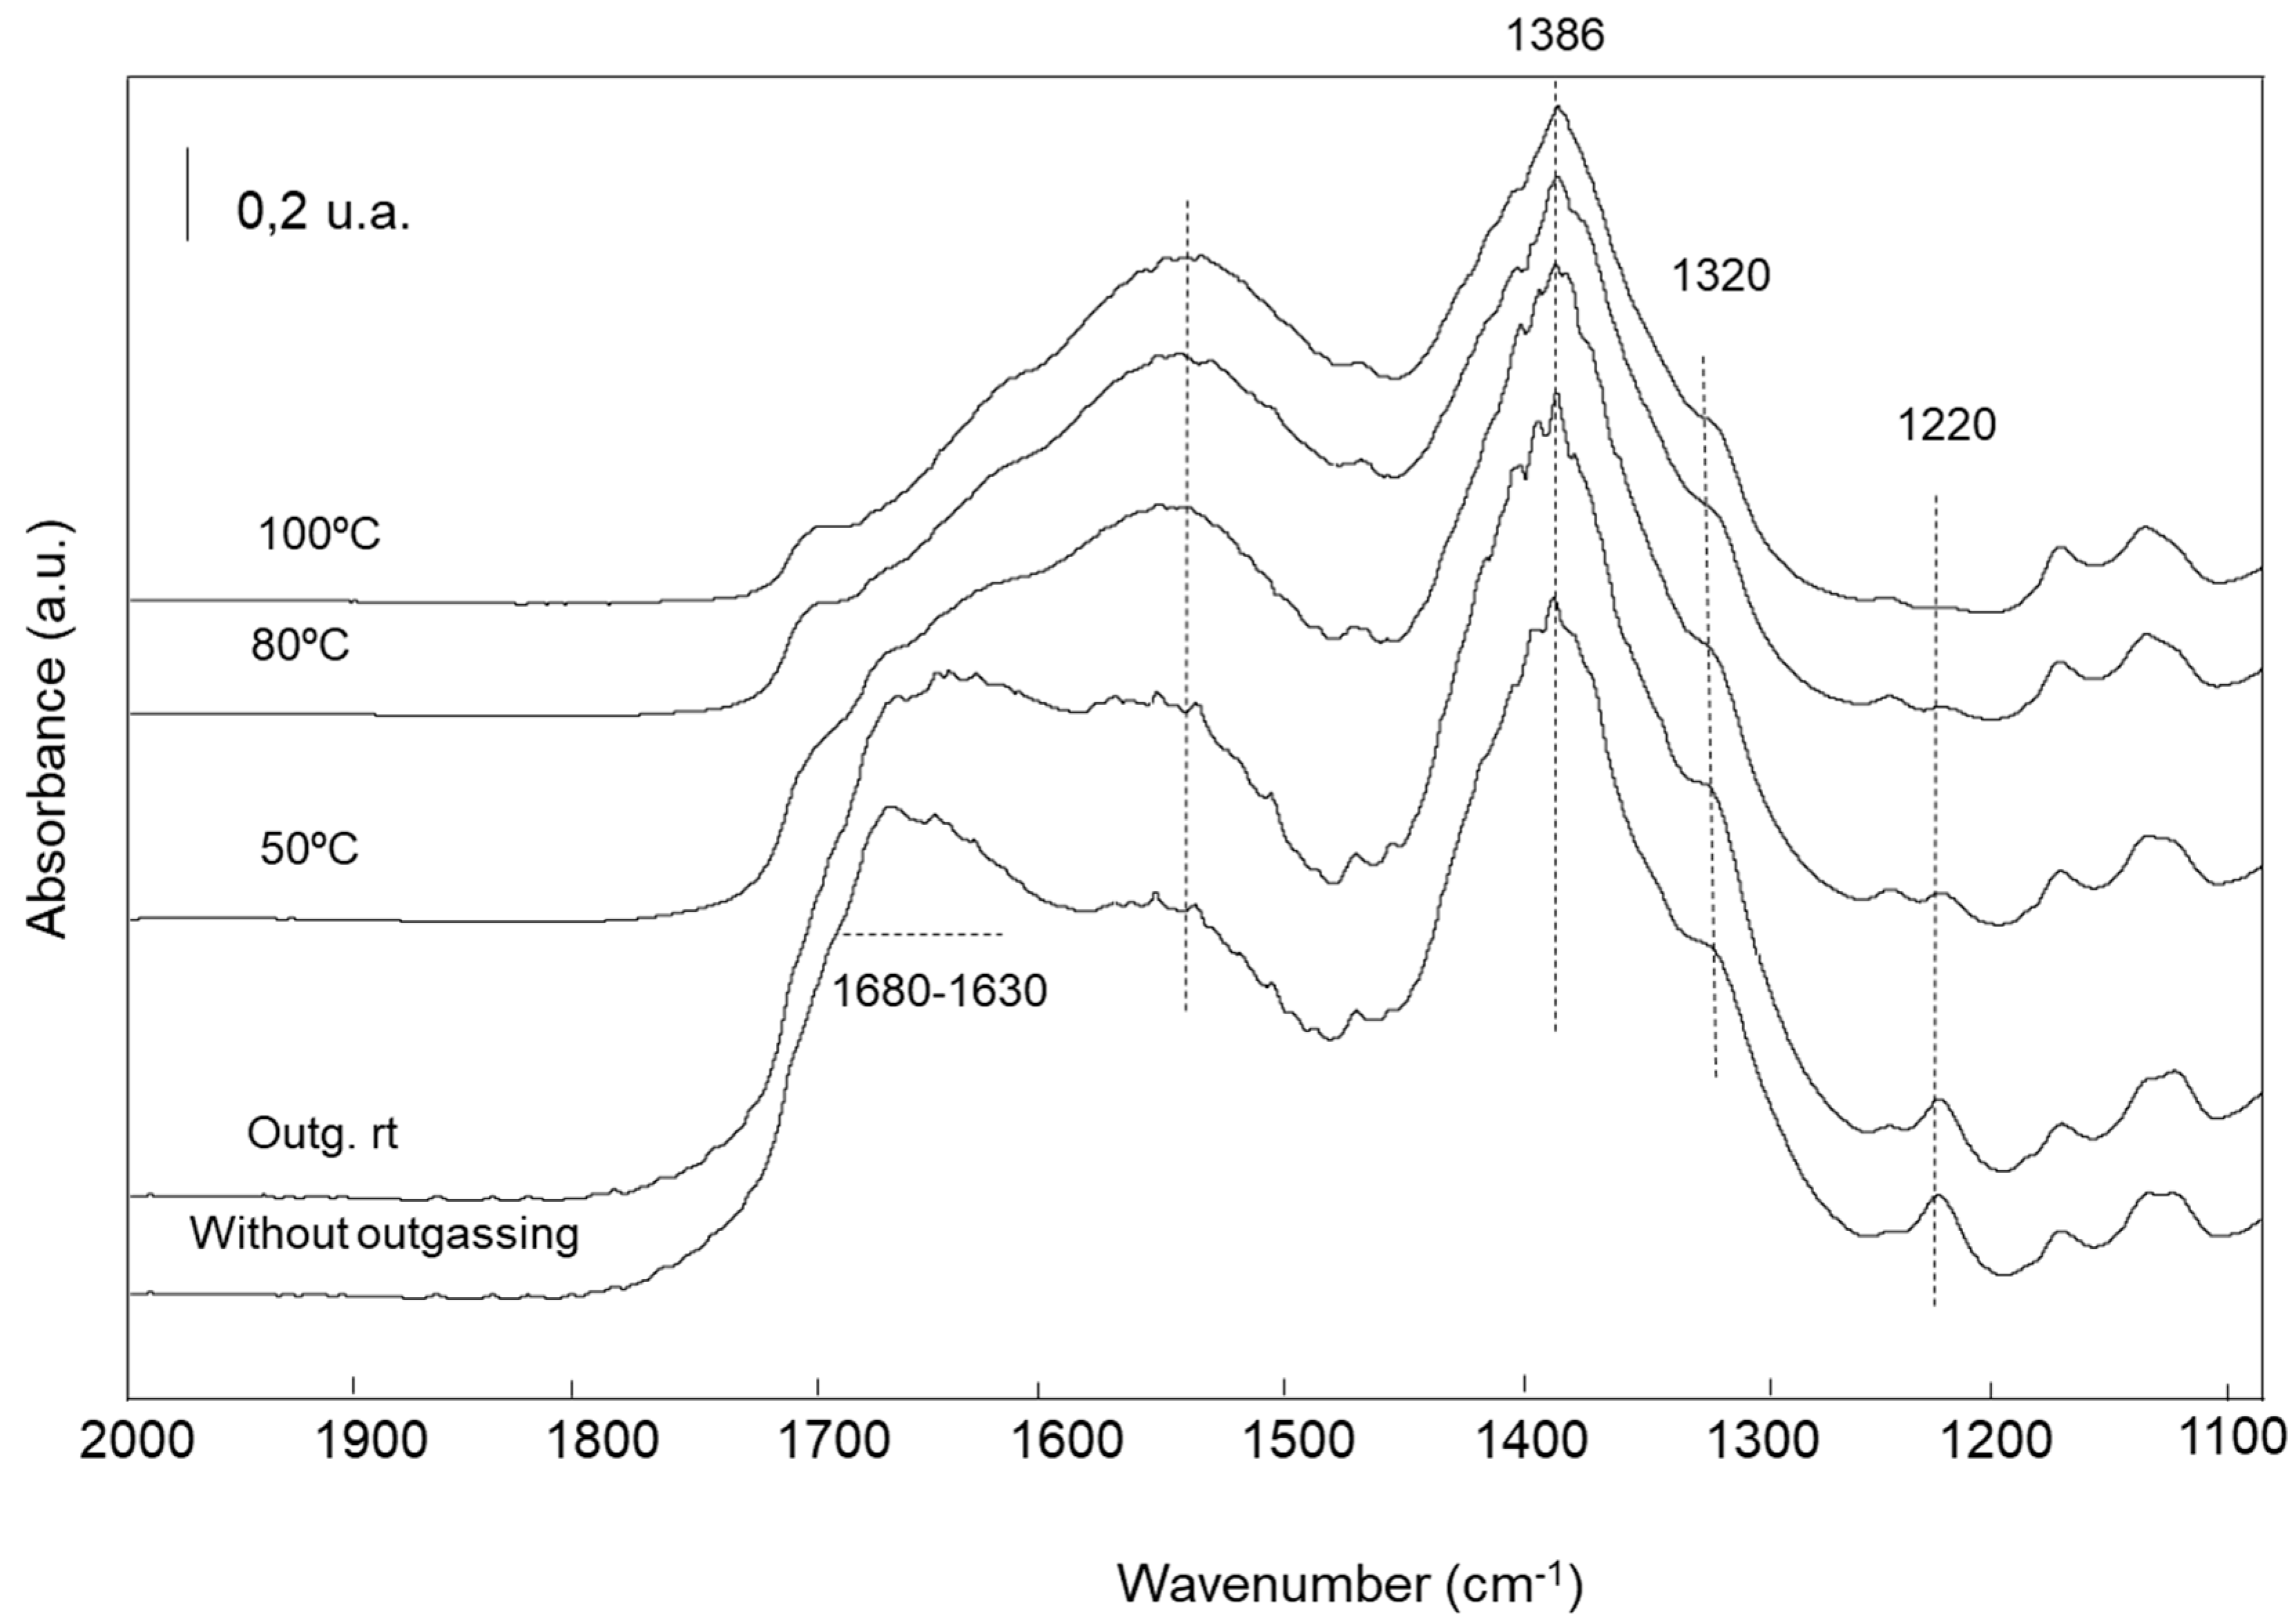
The basicity was also evaluated after the adsorption of CO2 on the surface of MgAl-3 catalyst (Figure 7). Overlapping broad infrared bands were observed in the spectra of the sample after CO2 adsorption at room temperature in the 1700–1500 cm−1 and 1470–1200 cm−1 ranges, indicating that three species of adsorbed CO2 were detected corresponding to the presence of different surface basic oxygen atoms. Thus, unidentate and bidentate carbonate formation requires high-medium strength basic sites meanwhile bicarbonate formation takes place on low-strength basic sites. Unidentate carbonates exhibit a symmetric O-C-O stretching at 1360–1400 cm−1 and an asymmetric O-C-O stretching at 1510–1560 cm−1. Bidentate carbonates show a symmetric O-C-O stretching at 1320–1340 cm−1 and an asymmetric O-C-O stretching at 1610–1630 cm−1. Bicarbonates shows a C-OH bending mode at 1220 cm−1 as well as symmetric and asymmetric O-C-O stretching modes at 1480 cm−1 and 1650 cm−1, respectively [54]. Similar spectra were obtained after outgassing at the subsequent temperatures showing that after outgassing at 80 °C bicarbonate species (band at 1220 cm−1) disappears and unidentate and bidentate carbonate species remain after evacuation at 100 °C. Therefore, these results confirm the wide variety of basic sites on the surface of MgAl-3. We can extrapolate those results to the other catalysts since the TPD-CO2 profiles were similar.
In order to evaluate the surface chemical composition of the MgAl-x catalysts, XPS measurements were carried out. As shown in Table 4, the surface of the catalysts was not enriched with Mg or Al as the molar ratio is close to the nominal values. Moreover, the carbon content was too low, except the MgAl-3 catalyst, demonstrating that the thermal treatment was enough to achieve the decarbonation of the hydrotalcites.
The binding energies of the different elements are displayed in Table 5. The Al 2p core level spectra displays a contribution close to 74 eV attributed to Al3+ species in the form of oxide, and the Mg 2p core level spectra also exhibits an only contribution, located about 49.7 eV, ascribed to Mg2+ cation in an oxidic environment. In the case of O 1s core-level spectra, the coexistence of two contributions is noteworthy, the low binding energy contribution was due to the presence of the oxide anion and the contribution of higher binding energy was due to the presence of surface hydroxyls [56]. In addition, the C 1s core level spectra also showed two contributions located at 284.8 and roughly at 290 eV that have been assigned to the adventitious carbon and the presence of carbonate species, probably originated by the contact with the atmosphere.

2.2. Catalytic Activity of MgAl-x Catalysts

2.2.1. Influence of the Alcohol in the Catalytic Activity of MgAl-x Catalysts

Once knowing the structure of the catalysts and their acid-basic properties, they were tested in the FUR reduction to FOL by means of the MPV reaction. This reaction relies on the formation of a six-membered cycle between the carbonyl compound and the alcohol, as hydrogen donor, a direct transfer taking place of the hydrogen bonded to C-α from the alcohol to the carbonyl group. For the formation of this cycle, the participation of both an acid and basic site is necessary. Lewis acid sites provide the electron deficient centers for the adsorption of the electron rich oxygen of the alcohol and carbonyl group, and the basic sites attract the hydrogen of the hydroxyl group of the alcohol weakening the O-H bond in the alcohol. Finally, the hydrogen is transferred to the carbonyl group giving rise to the corresponding alcohol and the alcohol of the hydrogen donor becomes a carbonyl group. On the other hand, the hydrodeoxygenation of FOL to yield 2-methylfurane (2-MF) needs the cooperation of metal sites along with Lewis acid sites [57,58,59]. The absence of a metallic center (M0) impedes the hydrodeoxygenation reactions of FOL to yield 2-MF. This is the reason why the reaction was stopped at FOL and 2-MF with MgAl-x catalysts was not detected for all the tested conditions. Therefore, after the characterization of the MgAl-x catalysts, it was expected that they were active in this reaction given the presence of both acid and basic sites on their surface.
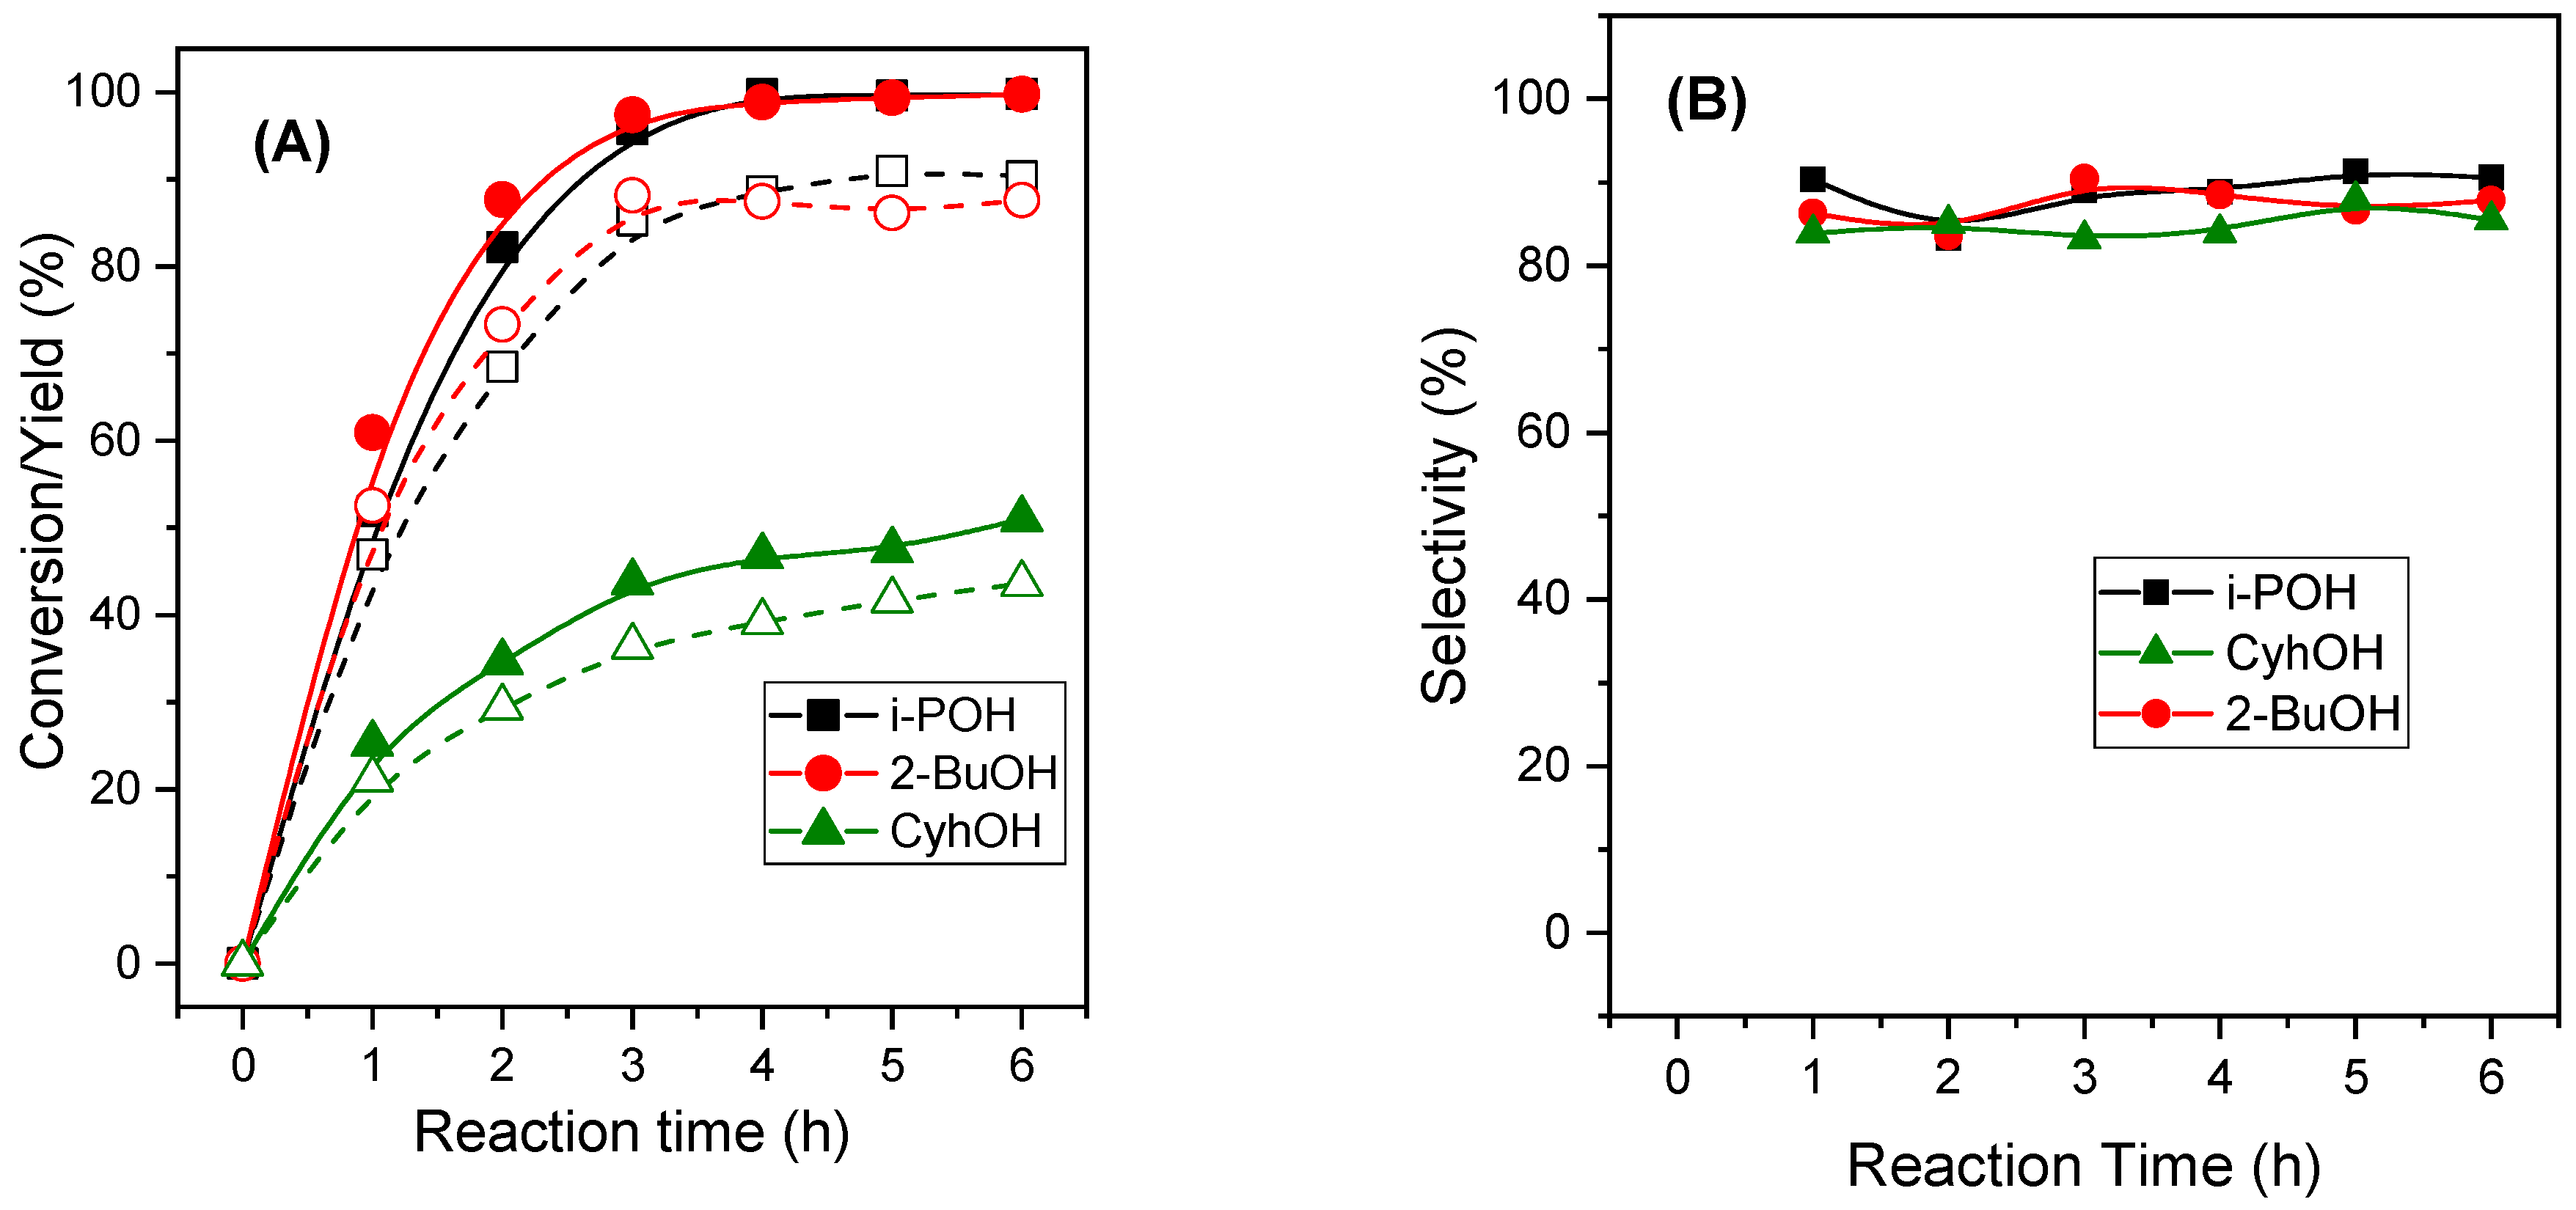
Initially, the influence of the alcohol was evaluated with the MgAl-3 catalyst at 110 °C. In bibliography, the catalytic transfer of hydrogen has been evaluated using primary, secondary and tertiary alcohols. Among them, the secondary alcohols have shown to be more effective than the primary and tertiary ones, mainly, due to two reasons. Firstly, the reduction potential of the secondary alcohol [60,61] is lower than the primary one favoring the oxidation of the alcohol to carbonyl and the second reason is related to the higher stability of the secondary than the primary carbocation [62]. Tertiary alcohols are not suitable for the reduction of FUR due to the absence of H in the C-αposition [60]. Therefore, three different secondary alcohols have been tested, namely, isopropyl alcohol, 2-butanol and cyclohexanol, discarding for this study the primary and tertiary alcohols. The results are present in Figure 8.
The secondary alcohols were active in the reduction of FUR obtaining the best catalytic results when the i-POH and 2-BuOH were the sacrificial alcohols, although the three alcohols were very selective to FOL. The cyclohexanol showed a moderated activity ascribed to the high boiling point of this alcohol (168 °C) compared to the reaction temperature (110 °C) and steric hindrance to form the cycle intermediate with the FUR on the surface of the catalyst [63]. The 2-BuOH and i-POH showed a very similar efficiency both for FUR conversion and FOL yield, achieving 100% FUR conversion and 90% FOL yield after 4 h of reaction. He et al. [60] reported a lower FUR conversion in 2-BuOH than in i-POH with NiO nanoparticles catalyst. This fact was attributed to the long carbon chain of 2-BuOH which exerted a steric hindrance. Li et al. [61] also reported a lower activity of the CuNi nanoparticles derived from MOF solids when the reaction was carried out in 2-BuOH due to the hydrophobicity exerted by the carbon chain of the 2-BuOH. On the other hand, Puthiaraj et al. [63] observed no significant differences in FUR conversion and FOL selectivities when they studied the catalytic activity of Pd supported on nitrogen-doped porous carbons and the reaction was carried out in both 2-BuOH and i-POH. In our experiments, differences in the carbon chain did not appear to significantly affect the activity of the catalyst, so this catalyst provided the right environment to allow the six-membered cyclic transition state necessary for the reduction of FUR. So, for the following experiments, i-POH was selected as solvent and hydrogen donor.

2.2.2. Influence of the Calcination Temperature of MgAl-3 Catalysts

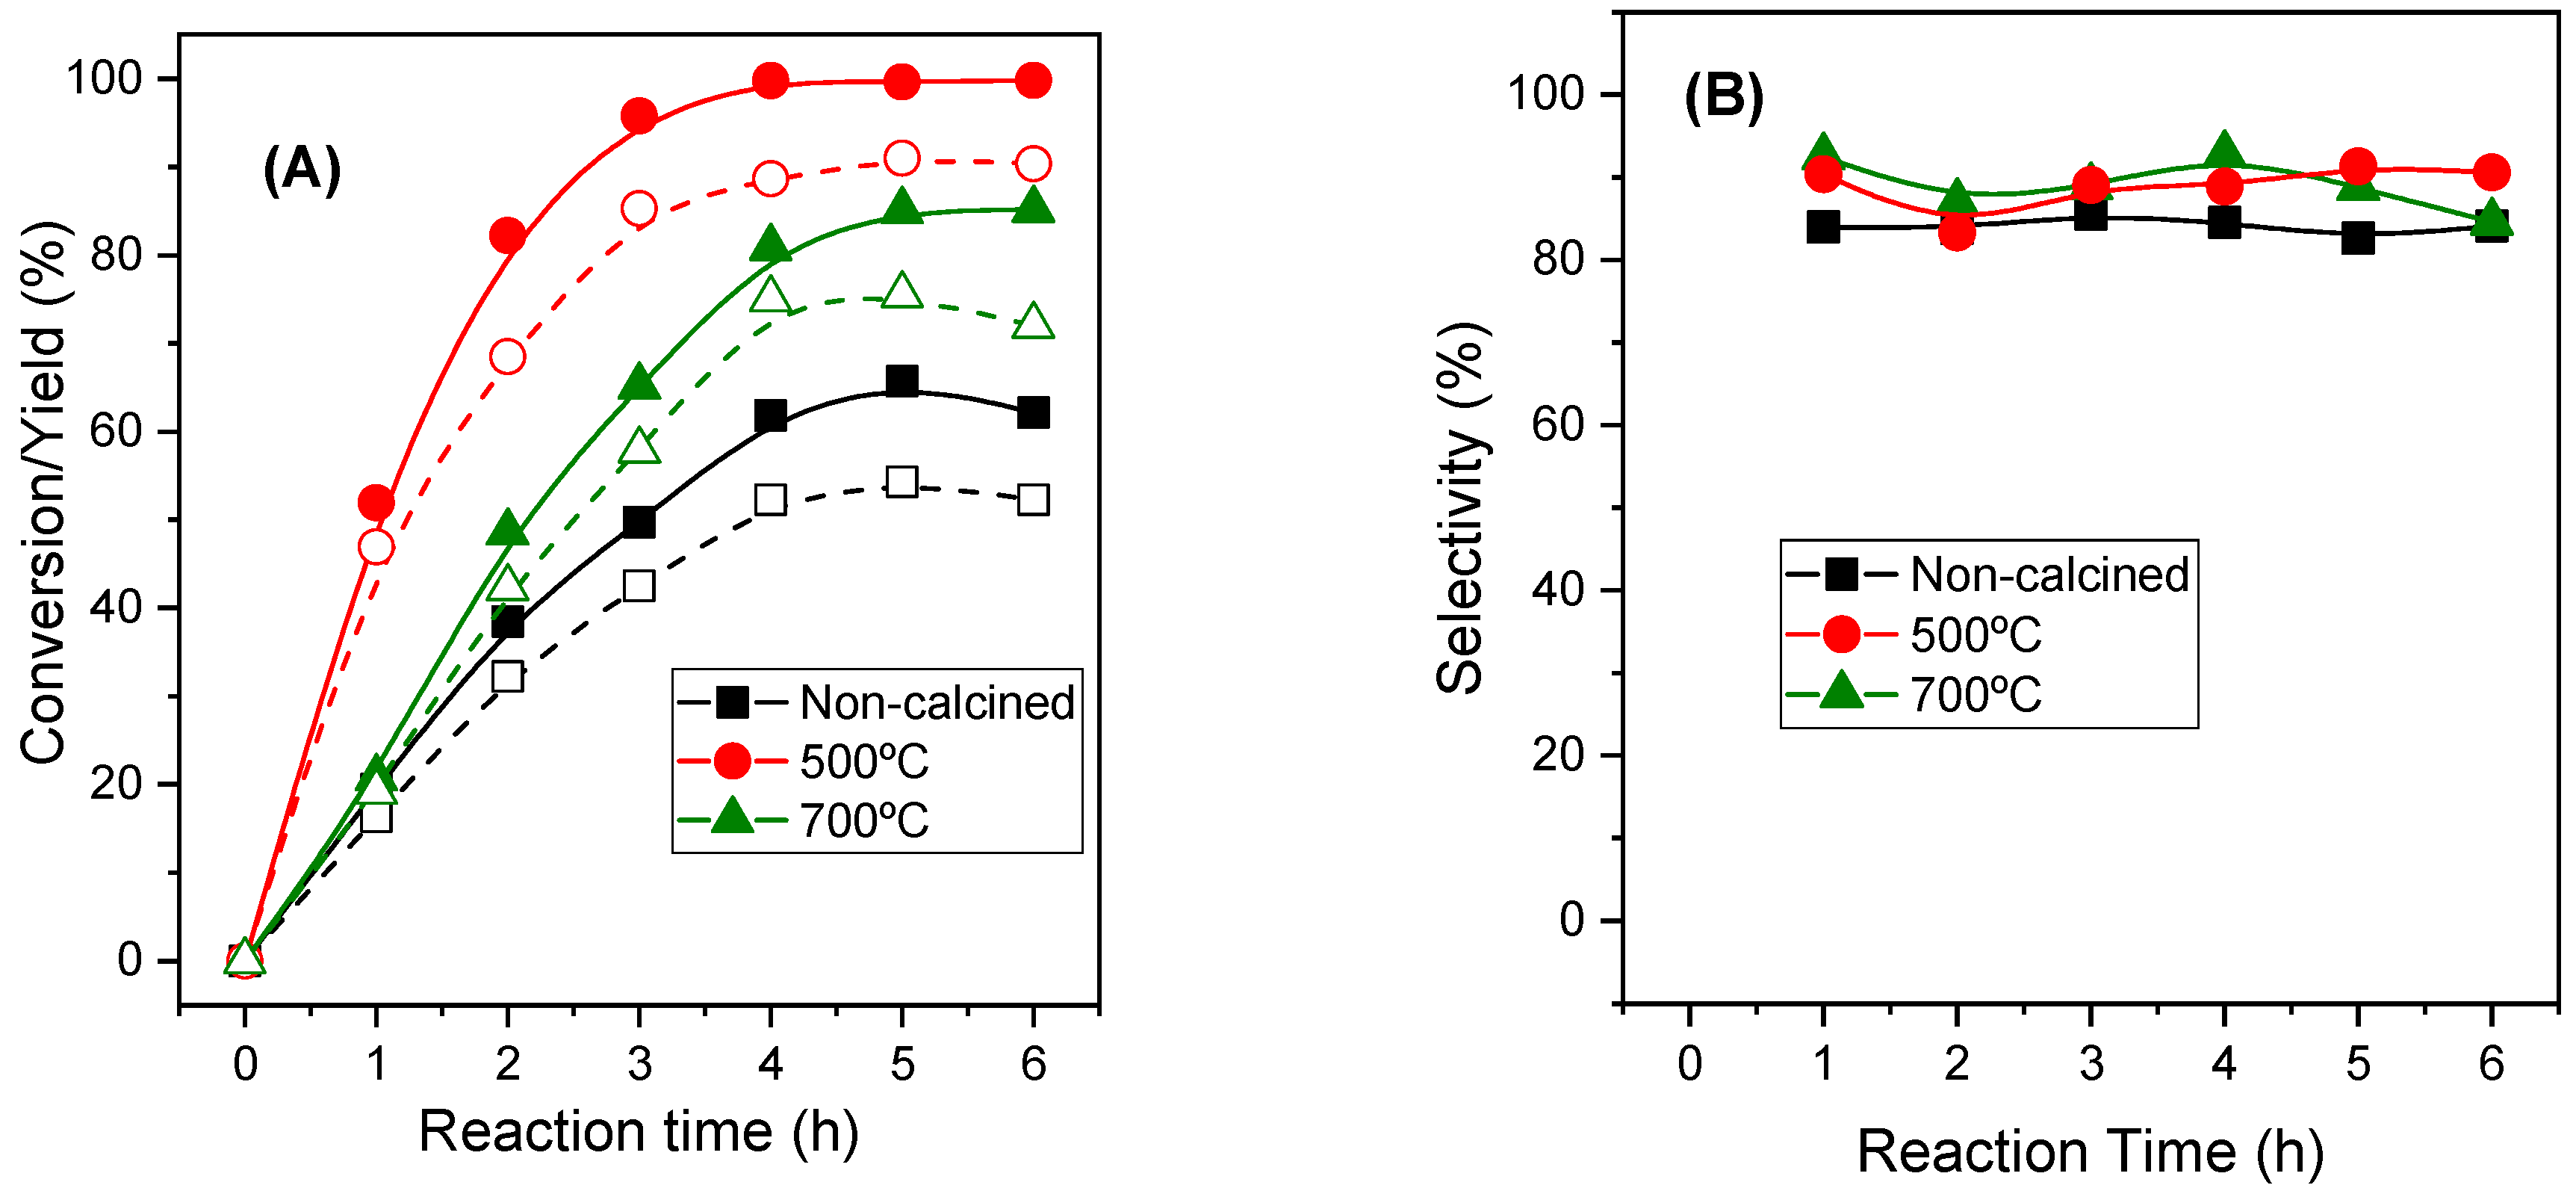
As it is well known, the calcination temperature of the hydrotalcite affects the structural and acid-basic properties of the generated mixed oxides, therefore, the effect of the calcination temperature (Figure 9) on the catalytic activity of the MgAl-3 catalyst was studied.
Figure 9 reflects the criticality of the correct selection of the calcination temperature on the catalytic activity of the mixed oxides. The thermal analysis of the hydrotalcites (Figure 2) showed that at about 500 °C decarbonation and dehydroxylation processes finished and therefore the mixed oxides were obtained (Figure 3). Uncalcined hydrotalcite displayed worse textural properties in relation to the specific surface area and pore volume [64]. In addition, the calcination process also affects the nature of the acidic and basic sites since such thermal treatment is aimed at the presence of strong basic sites capable of abstracting H from the alcohol and sufficient Lewis acid sites to coordinate the oxygens of both FUR and i-POH. On the other hand, high calcination temperatures lead to the formation of MgAl2O4 spinel with a lower SBET and pore volume compared with the periclase structure of the mixed oxides [65]. Therefore, thermal treatment at 500 °C generated mixed oxides with the required textural and acid-base properties for the MPV reaction of the FUR.

2.2.3. Influence of the Mg/Al Molar Ratio

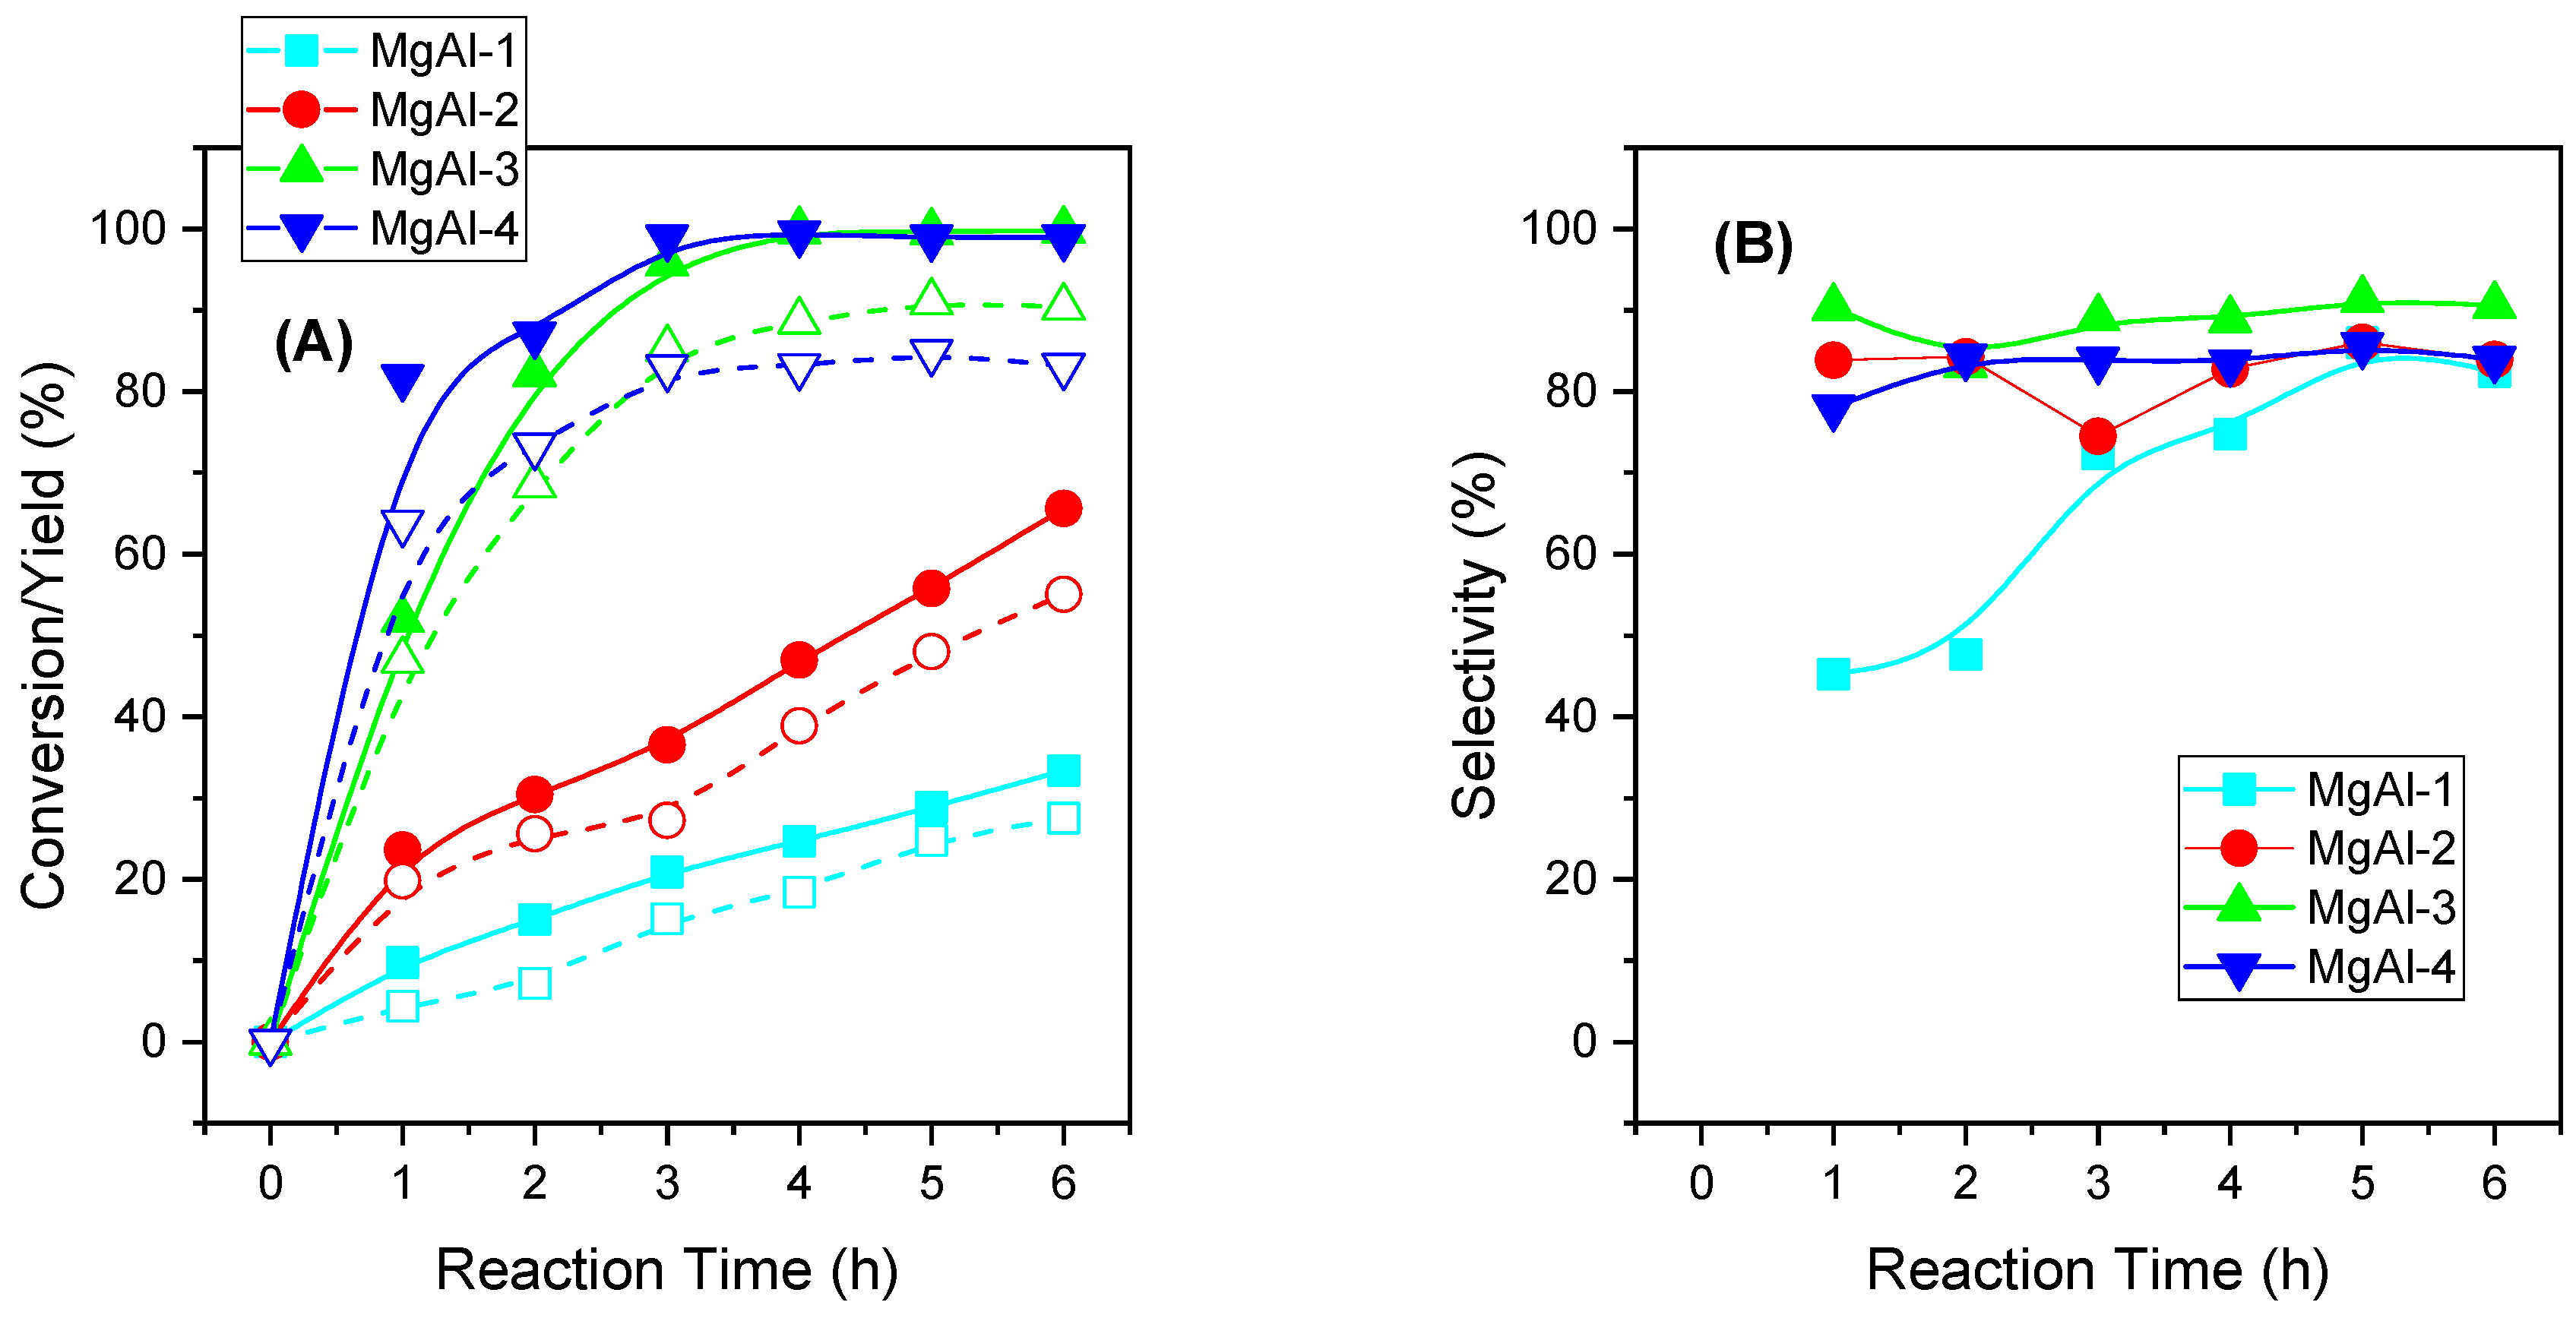
Once both the best temperature of calcination and alcohol were selected, the next experiments were focused on the influence of the Mg/Al molar ratio of the calcined hydrotalcites in the catalytic activity. Thus, the MgAl-x catalysts were assayed at 110 °C during 6 h (Figure 10).
The catalytic activity of the MgAl-x catalysts shows a clear relationship between the Mg/Al molar ratio and the FUR conversion. As the Mg/Al molar ratio increased, the FUR conversion also increased. Surface analysis of the catalysts showed that the surface was enriched in Al as the Mg/Al molar ratio decreased (Table 4). Although Al3+ is a Lewis center that could coordinate the oxygen of the i-POH as well as the FUR, it must require the cooperation of the basic sites on the surface to act as centers that abstract the proton from the alcohol and then transfer it to the carbonyl group of the FUR and therefore, the reduction of the carbonyl group would take place. Thus, the conversion of the FUR followed the same trend as the catalyst basicity: MgAl-4 > MgAl-3 > MgAl-2 > MgAl-1. The initial TOF (Turn Over Frequency) was determined as a function of the concentration of basic sites after 1 h of reaction and the same trend was observed as previously shown, thus, the catalysts showed the trend: MgAl-4 (45.1 h−1) > MgAl-3 (41.5 h−1) > MgAl-2 (35.9 h−1) > MgAl-1 (19.4 h−1). Gyngazova et al. [66] observed the same trend when the CTH reaction of FUR was carried out with methanol and alkaline earth catalysts, showing that the activity depended on the basicity of the catalysts. On the other hand, catalysts with Mg/Al molar ratio of 3 and 4 showed a similar behavior after 2 h of reaction although the MgAl-3 was more selective to FOL. The chromatographic analysis (GC-FID) of the reaction products discarded the formation of other compounds except FOL. In bibliography, ethers between the alcohol and FOL [67], acetals formed by the reaction FUR and i-POH [63] and other products such as tetrahydrofufuryl alcohol (THFA), derived from the over-hydrogenation of the furan ring, and even 2-MF [68] obtained from HDO reaction, have been detected. So, the loss of carbon balance could be attributed to the formation of carbon-based compounds as humins. The formation of those compounds was observable because of the dark color of the solution after reaction, which demonstrated the presence of substances with chromophores in their molecular composition. The Other Compounds yield was low for all catalysts, below 10 mol%, except for MgAl-4, which was above 20 mol% on average. This catalyst showed the highest concentration of strong basic sites, which could cause a higher formation of carbonaceous compounds, reducing the FOL yield. Thus, these results highlighted the need for a precise adjustment of the acid-basic properties of the catalysts to achieve high FUR conversion with a high selectivity to the target product.

2.2.4. Reutilization of the MgAl-x Catalysts

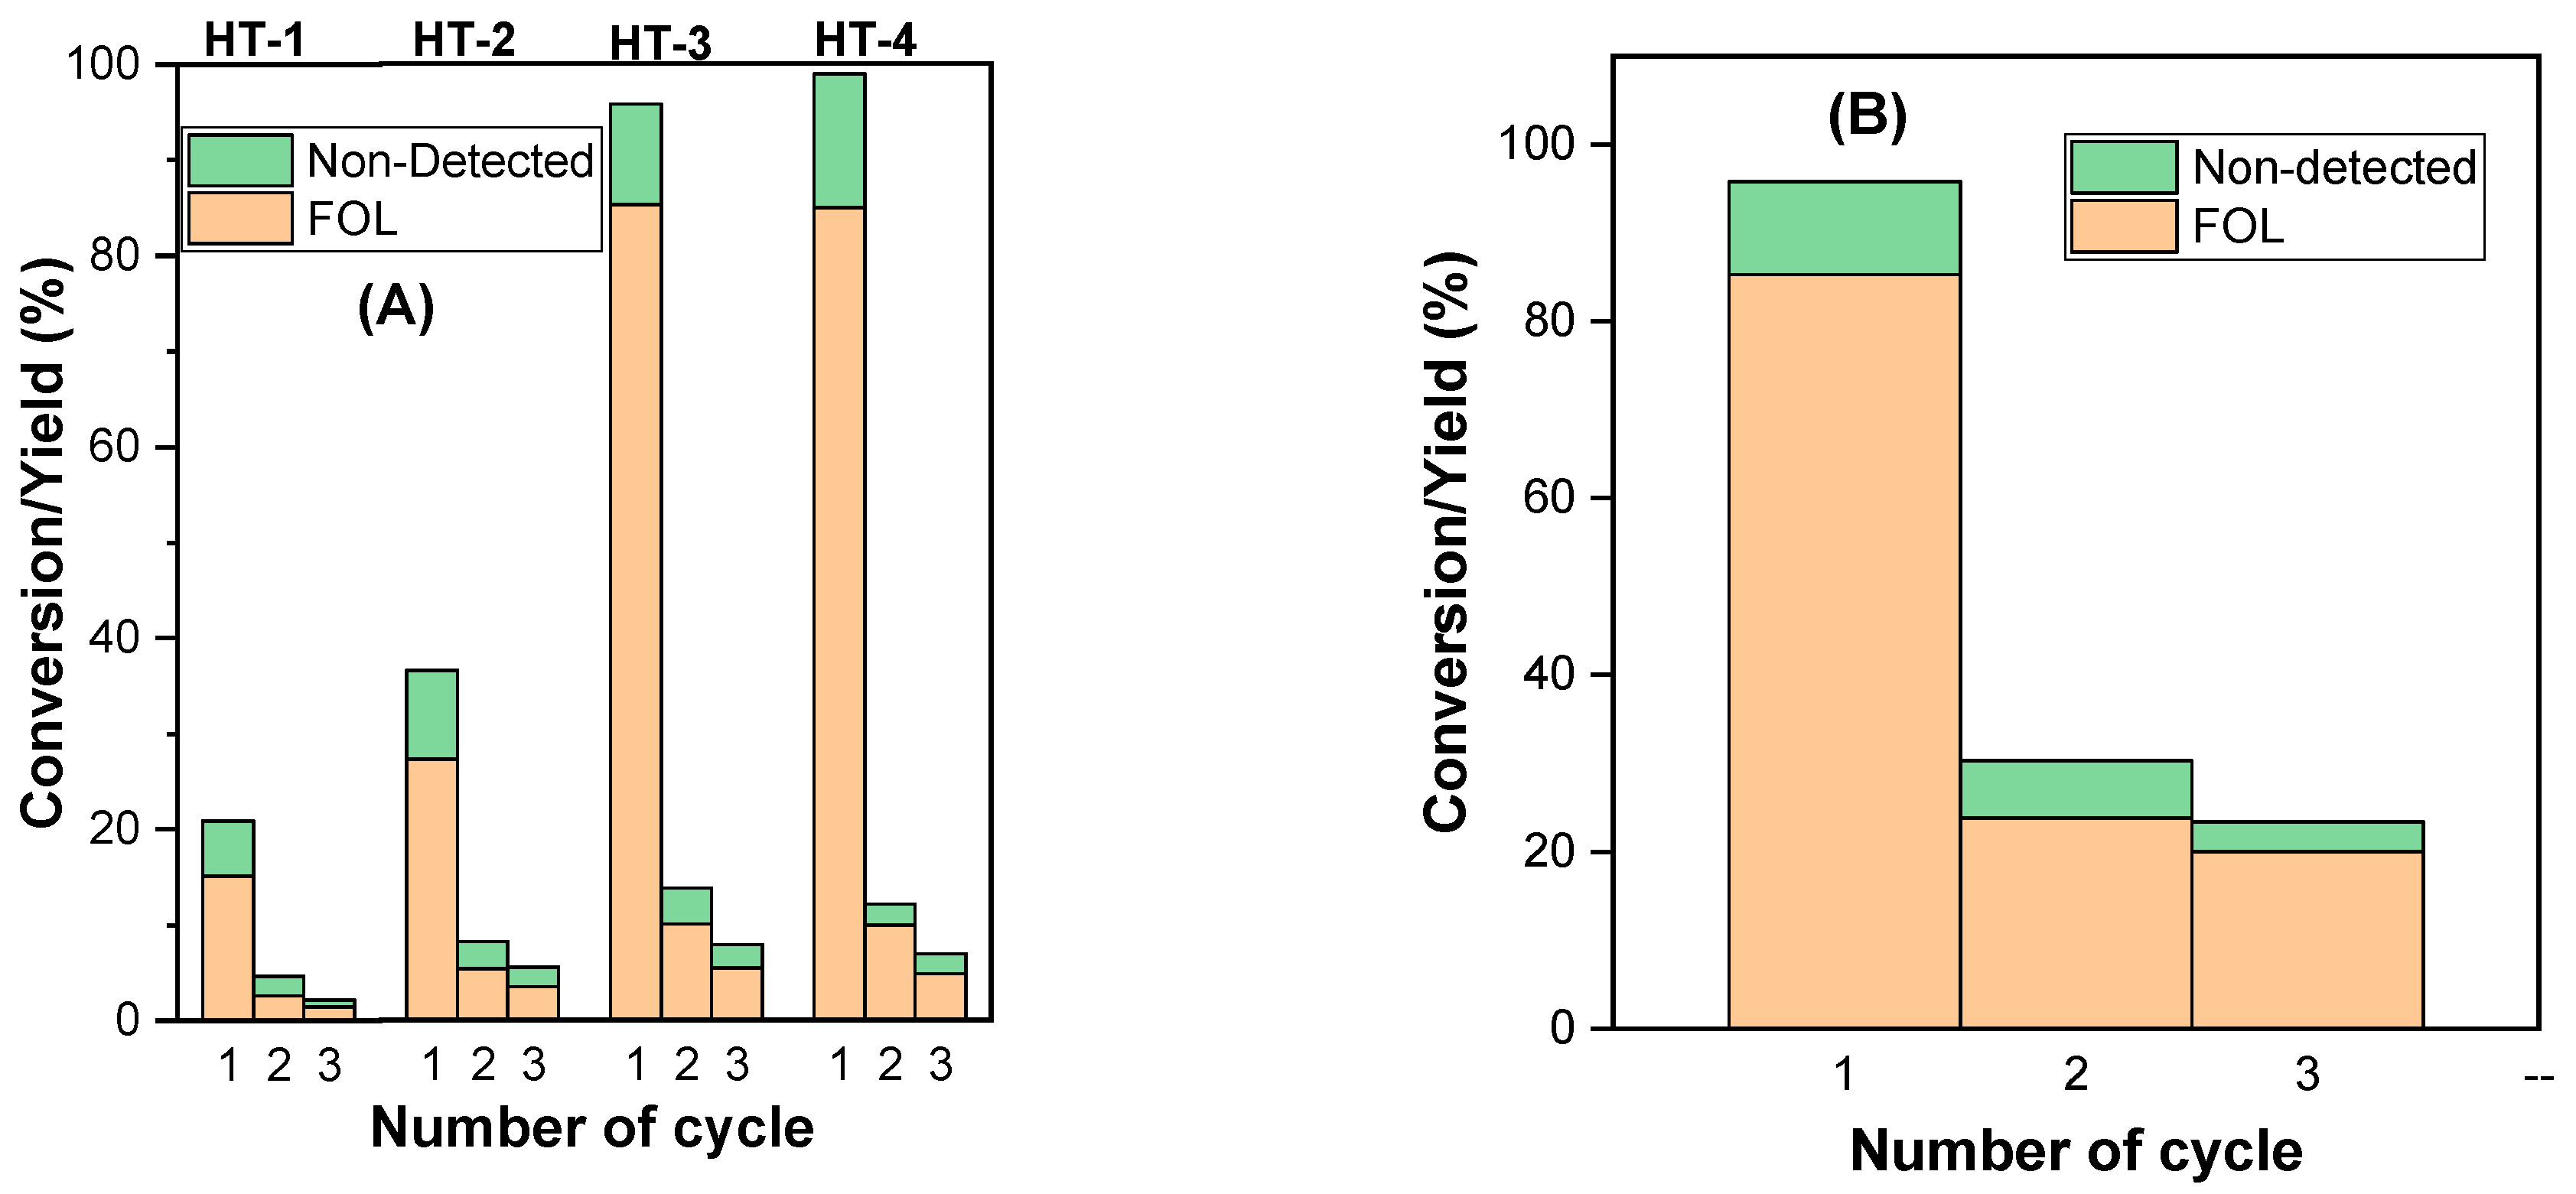
The main advantage of solid catalysts is the ease of reuse over several catalytic cycles. Thus, the MgAl-x catalysts were reused in three consecutive catalytic cycles without any reactivation treatment (Figure 11A), i.e., the catalyst was filtered and put in contact with a new fresh solution of FUR. As Figure 11A shows, the catalytic activity dropped sharply after the second cycle for all catalysts and, most notably, the FUR conversion was very similar between the MgAl-x catalysts even though the FUR conversion of the first cycle was markedly different. Between the second and third cycle the FUR conversion did not decrease significantly, pointing out that the most active sites were deactivated in the first cycle. This behavior was to be expected due to the formation of the aforementioned carbonaceous compounds and the fact that the FOL yield was not close to the FUR conversion. Therefore, reactivation was studied for the MgAl-3 catalyst. For this purpose, the catalyst was calcined at 500 °C in order to remove the carbonaceous residues remaining on the catalyst. After this treatment, the catalyst recovered the initial bright white color and it was reused in a second cycle (Figure 11B).
However, as shown in Figure 11B, the activity did not fully recover, with the FUR conversion being 30% after the second cycle. These results contrast with other reported in the bibliography when hydrotalcites have been used as heterogeneous catalysts. Thus, Li et al. [69] reported that a Cu2Al catalyst derived from hydrotalcite could be reused up to 5 cycles in the CTH of FUR with methanol without any treatment between catalytic cycles. Ramos et al. [70] reported that a catalyst based on Co3O4-Al2O3 derived from hydrotalcite could recover its activity after 3 runs when it was calcined at 500 °C. On the other hand, when catalysts other than hydrotalcites were used in this reaction, the activity could be recovered after different reactivation processes. When NiO nanoparticles were used as catalysts in the CTH of FUR with i-POH [60], the activity was monotonically decreased after each catalytic run but recovered completely when the catalyst was subjected to a calcination step at 300 °C. In addition, when 2-BuOH was used as hydrogen donor, Pd supported on nitrogen-doped carbon catalyst [63] could be reused up to 5 runs by rinsing the catalyst with water and acetone between each catalytic run. Therefore, we selected the MgAl-3 catalyst to analyze the superficial changes occurring on the catalyst surface. Thus, XPS of the MgAl-3 catalyst after reactivation at 500 °C was performed (Table 6).
Since the catalyst did not recover its catalytic activity, the XRD study was performed after calcination at 500 °C (Figure 12). This graph shows that a new phase appeared after calcination. This phase has been associated with the presence of the spinel MgAl2O4 (PDF: 04-014-3259), in addition, the N2 adsorption-desorption analysis showed that the catalyst after calcination worsened both the pore volume and the average pore size, i.e., the presence of this new segregated phase led to the properties of the initial catalyst being substantially modified. As a consequence, the activity was not recovered despite the fact that calcination eliminated the carbonaceous residues on the catalyst.
The surface of the calcined catalyst was also studied by XPS analysis. The XPS analysis of the MgAl-3 catalyst reactivated at 500 °C after the catalytic cycle showed some differential features with respect to the MgAl-3 catalyst before reaction. The most remarkable is that the bands corresponding to Al2p and Mg2p can be deconvoluted in two different contributions, one more intense at low energy, similar to the one presented by the catalyst before reaction, and another one less intense at higher energy. The former can be attributed to the presence of Al3+ and Mg2+ in an oxidic environment, whereas the latter could be due to the presence of hydroxide species bound to these elements. The values of both core levels attributed to spinel are in the same BE region as the pristine mixed oxide, so it is difficult to discern whether these cations are in a spinel phase or in mixed oxide. This is supported by the two bands at the O1s core level, where the O2− contribution corresponds to the lower energy band, and the higher energy band of the O1s level is due to the hydroxide species. Moreover, the contribution of the O2− was remarkably reduced after catalysis and thermal reactivation. In addition, a decrease in the Mg/Al atomic ratio was observed after the reactivation treatment probably due to the presence of the spinel phase. As mentioned before, the CTH reaction requires the presence of basic but strong sites such as oxide ions, so the drastic drop-in activity can be attributed to the partial transformation of the oxide ions into hydroxides and also, as mentioned above, to the presence of the segregated spinel phase. Therefore, these modifications seem to be responsible for the fact that these catalysts have not recovered all their activity after the reactivation method. In future work, other reactivation methods such as catalyst rinsing with solvent at room temperature or hot and catalyst rinsing and calcination will be explored.

2.2.5. Characterization of the Adsorbed Species by FTIR Spectroscopy

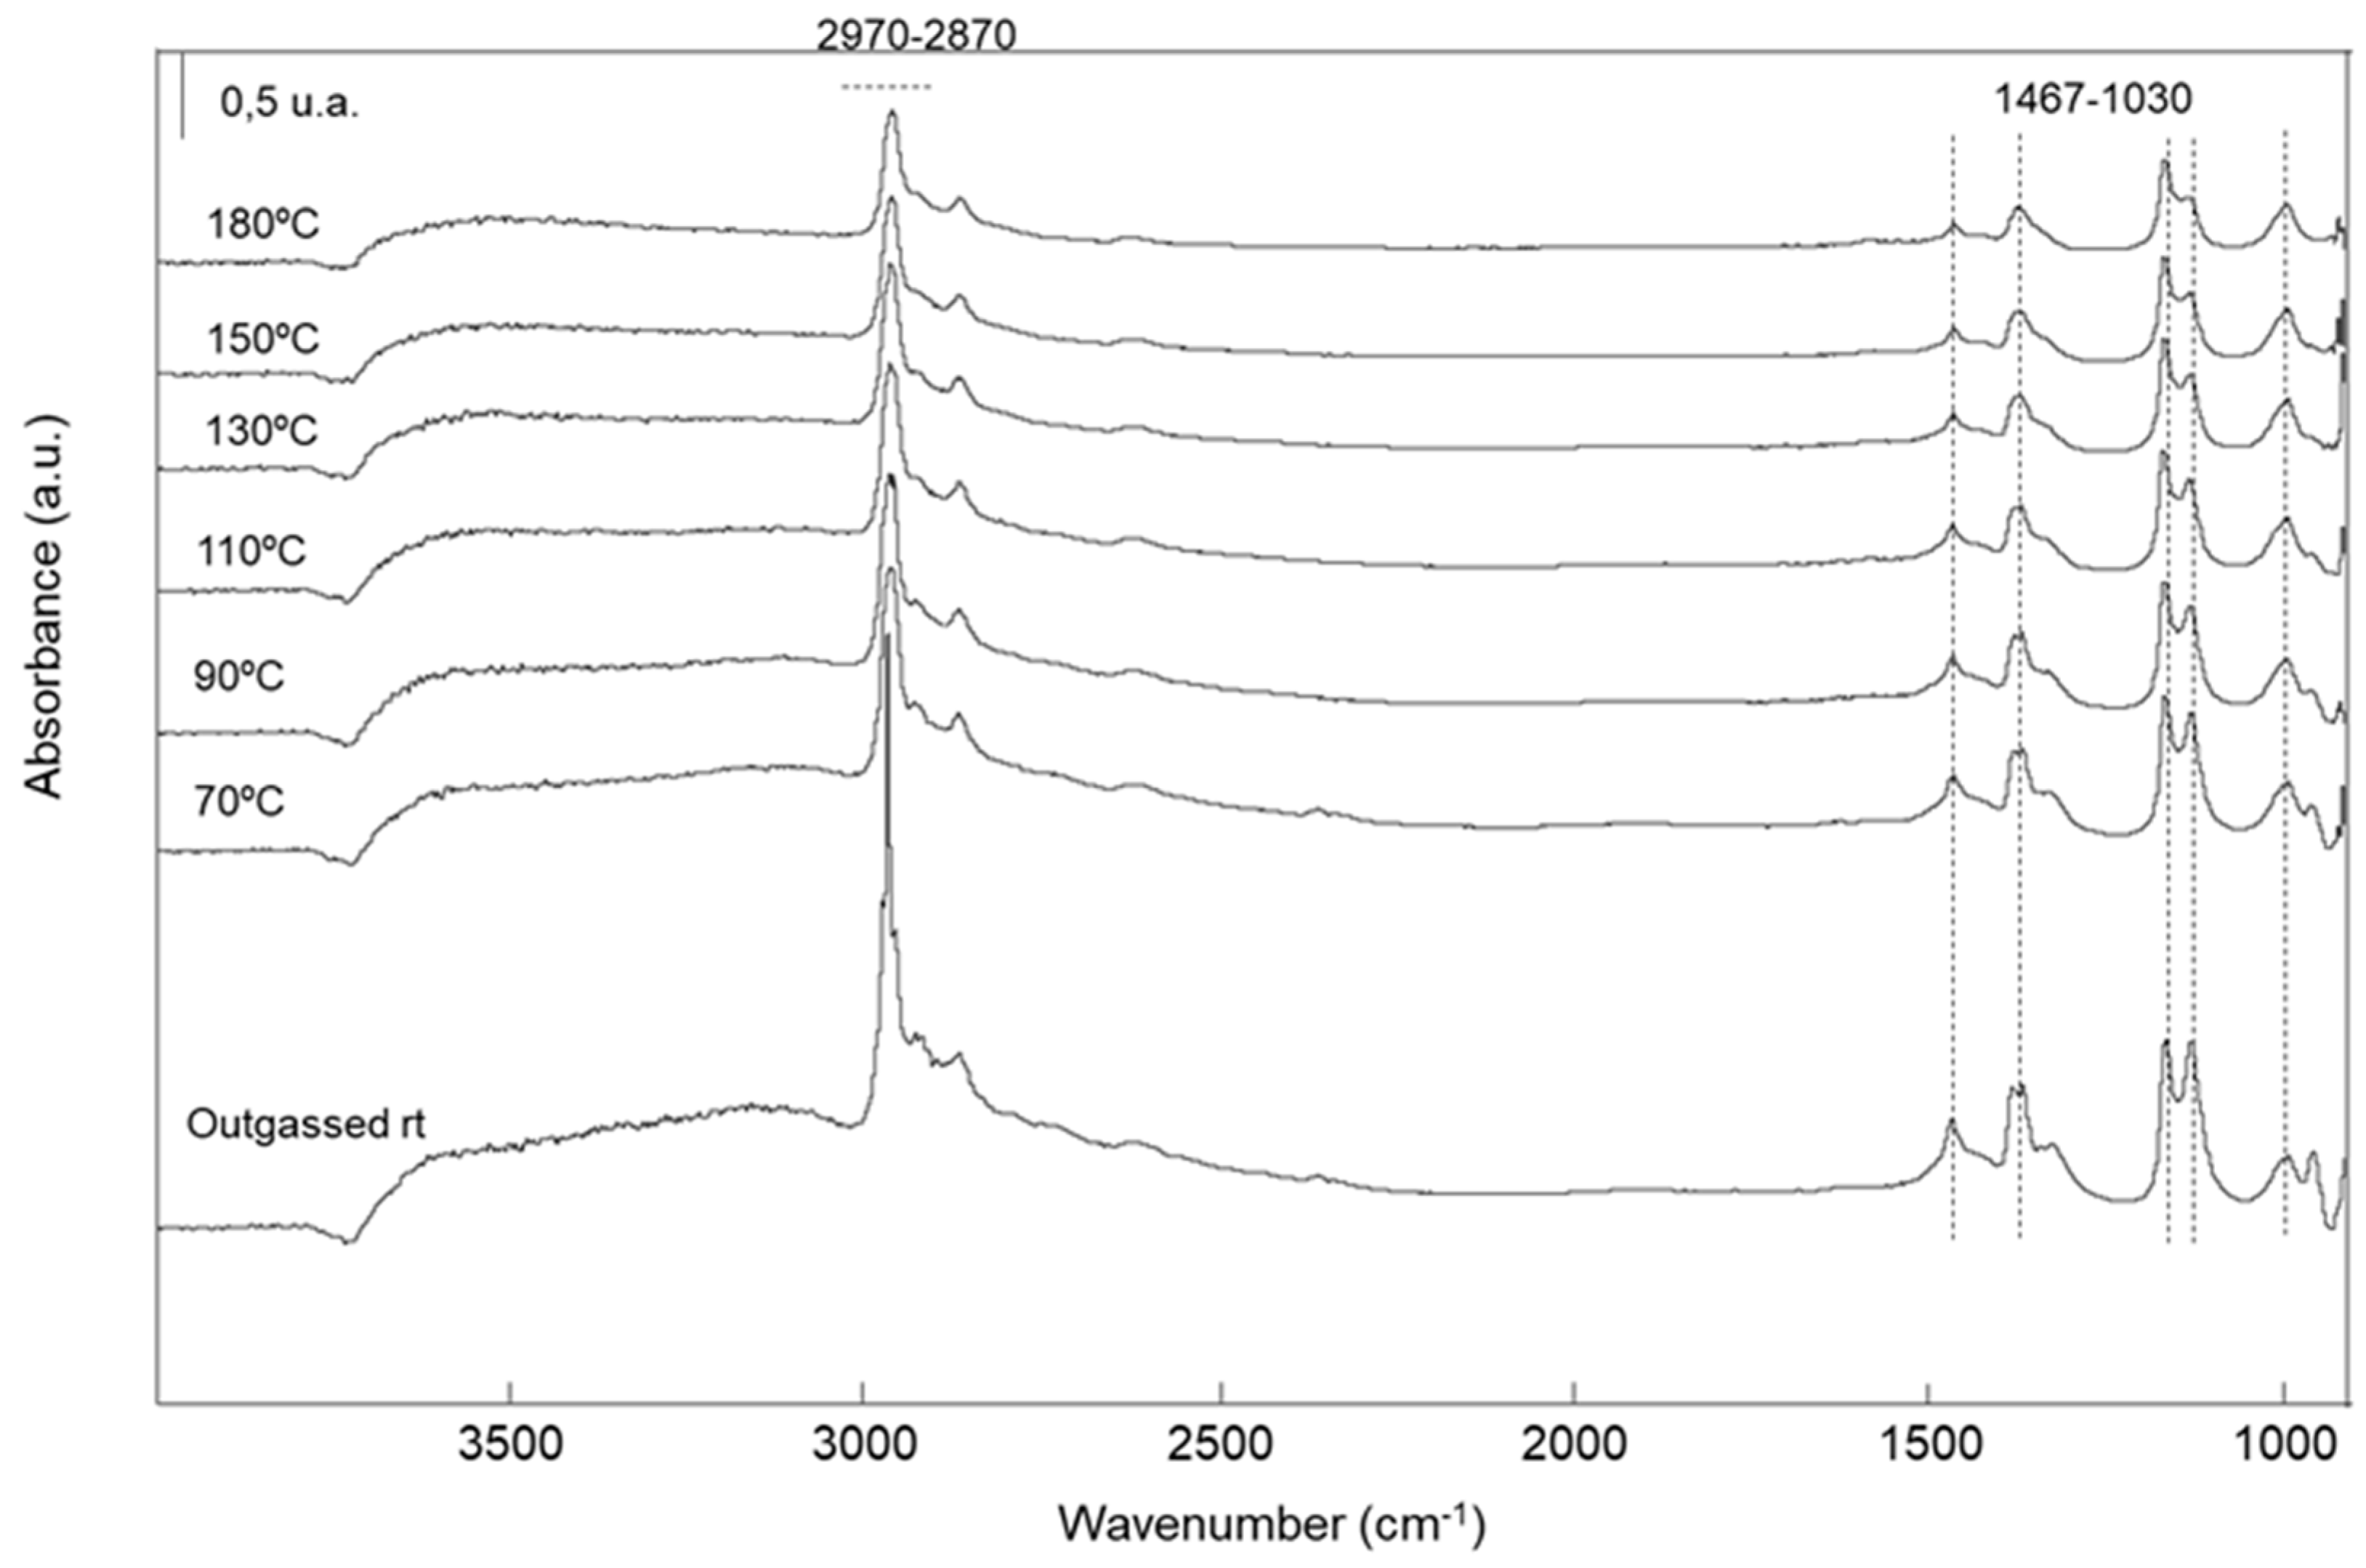
To follow the adsorbed species on the catalyst surface, both i-POH and FUR were adsorbed on the MgAl-3 catalyst surface, separately or simultaneously, and evacuated at different temperatures. The objective of this study was to know how these molecules were adsorbed, whether they competed for the same adsorption sites, and how stable the surface species were as a function of evacuation temperature. First, the spectrum of i-POH adsorption on the surface of MgAl-3 was recorded (Figure 13). This spectrum showed, in the low wavenumbers region, bands at 1467, 1381, 1327, 1166 and 1128 cm−1 assigned to antisymmetric and symmetric δ(CH3), δ(C-H), ν(C-O)/ν(C-C) and r(CH3) modes of isopropoxide species, formed through dissociative adsorption of the alcohol [71]. Bands associated with molecularly adsorbed i-POH or hydrogen bonded to different surface basic sites were not recorded. In the high wavenumbers region, very intense bands between 2970 and 2870 cm−1 can be observed, corresponding to the stretching ν(CH) mode of methyl groups of i-POH. At roughly 3700 cm−1 a negative band appeared due to the disappearance of the surface hydroxyls groups of mixed oxides after reacting with the i-POH [72], as the reaction 1 shows. The position of this band was ascribed by M. del Arco et al. [73] to free hydroxyl groups on the surface of MgO, although the hydroxyls bonded to Al are also found in this region of the spectrum. On the other hand, the dissociative adsorption of i-POH to yield isopropoxide species with the involvement of oxides anions would form new –OH moieties on the surface (reaction 2), which were not discernible in these spectra, probably because they were involved in the hydrogen bridges network as the broad band extended from 3700 to 3000 cm−1.
(CH3)2CH-OH + HO-Mn+ → (CH3)2CH-O-Mn+ + H2O
where Mn+ refers to Al3+ or Mg2+. The evolved water of reaction (1) did not remain physisorbed on the surface since the δ(H-O-H) band at 1630 cm−1 was not observed.
(CH3)2CH-OH + M-O-M → M-(OH)-M-O-CH-(CH3)2
The bands due to the isopropoxide specie were also discernible after evacuation at 180 °C, indicating that such species were quite stable on the surface of the catalyst. Finally, no bands due to oxidized species were recorded on the surface as the outgassing temperature was increased.
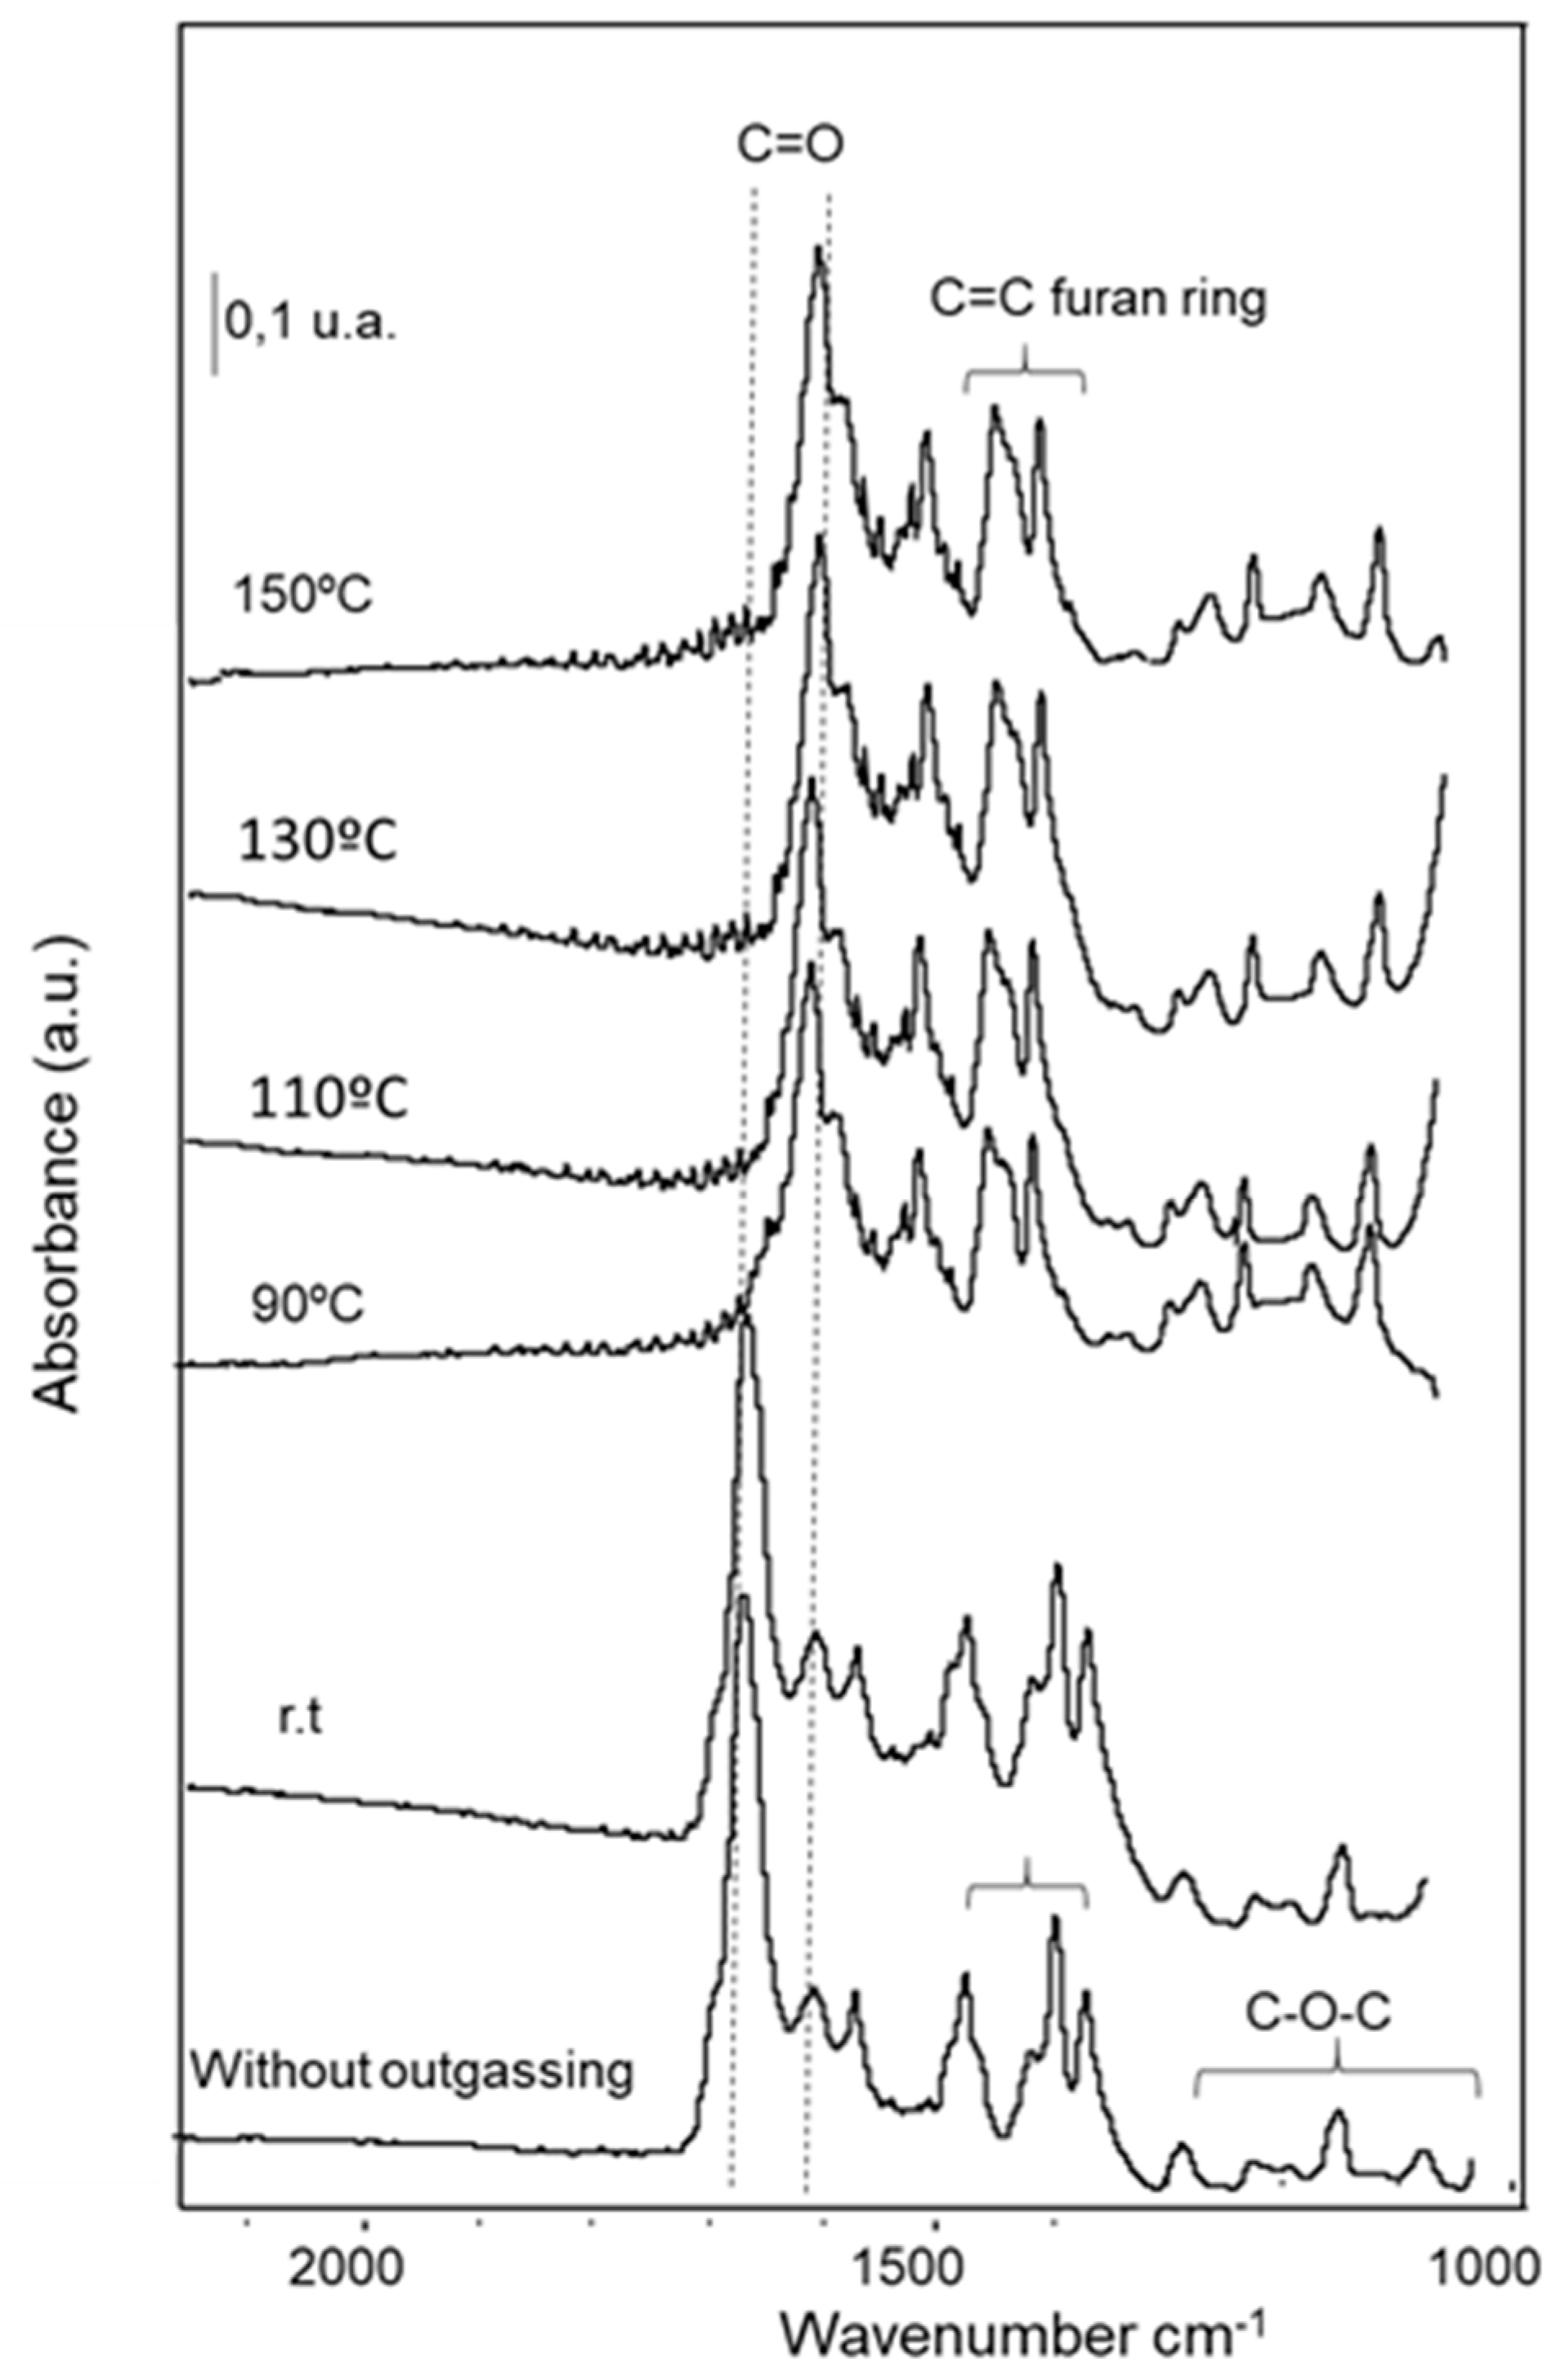
As with i-POH, FUR adsorption was carried out to obtain information about FUR binding on the catalyst surface. The spectra related to the adsorption of a pulse of furfural on the catalyst at room temperature and its evacuation at rising temperature in the wavelengths range of 2000–1000 cm−1 are presented in Figure 14. Two general ways of adsorption of furfural on the surface of metal species have been described in the bibliography [74]. In the former, known as the η1-(O) conformation, the aldehyde group adsorbs via the unshared electron pair of oxygen onto an acidic Lewis center. In the latter, the aldehyde group can adsorb on the surface via both the C and O of the aldehyde group (η2-(C,O) conformation). The former is less stable and tends to desorb as opposed to the latter which tends to undergo transformations on the catalyst surface. Moreover, the η1-(O) conformation is promoted by the superficial oxygens as in metal oxides.
Furfural adsorption on the catalyst at room temperature did not show the band of physisorbed furfural (around 1700 cm−1), because the remaining gas had been evacuated from the cell, and an intense signal at 1667 cm−1 characteristic of chemisorbed furfural was very evident, indicating the presence of carbonyl group (C=O). This red shift of the ν(C=O) pointed out a strong chemical adsorption of C=O on the surface of the catalyst with the concomitant weakening of the C-O bond [75]. This band was accompanied by the lower intensity band at 1610 cm−1, which suggested that there were two modes of furfural adsorption [76]. Taking into account the downshift of the vibration of the carbonyl group, we can assume that the furfural was adsorbed via η1-(O) conformation. It was reported [74,75] that the vibration of the carbonyl group was shifted to lower wavelengths, below 1450 cm−1, when the adsorption occurred through η2-(C,O) conformation. The vibration of the double bond of the furan ring associated with the bands located at 1474 and 1395 cm−1 and the tension of the C-O-C bonds associated with the set of signals located in the interval 1285 and 1000 cm−1 were also evident. When the temperature increased, the band at 1667 cm−1 disappeared and the band at 1610 cm−1 became dominant without decreasing in intensity with increasing temperature, therefore, it is likely that the furfural did not undergo a chemical transformation at the surface of the catalyst but rather changed the adsorption site. Finally, even at temperatures as high as 340 °C (not shown), the FUR bands were detectable on the catalyst surface.
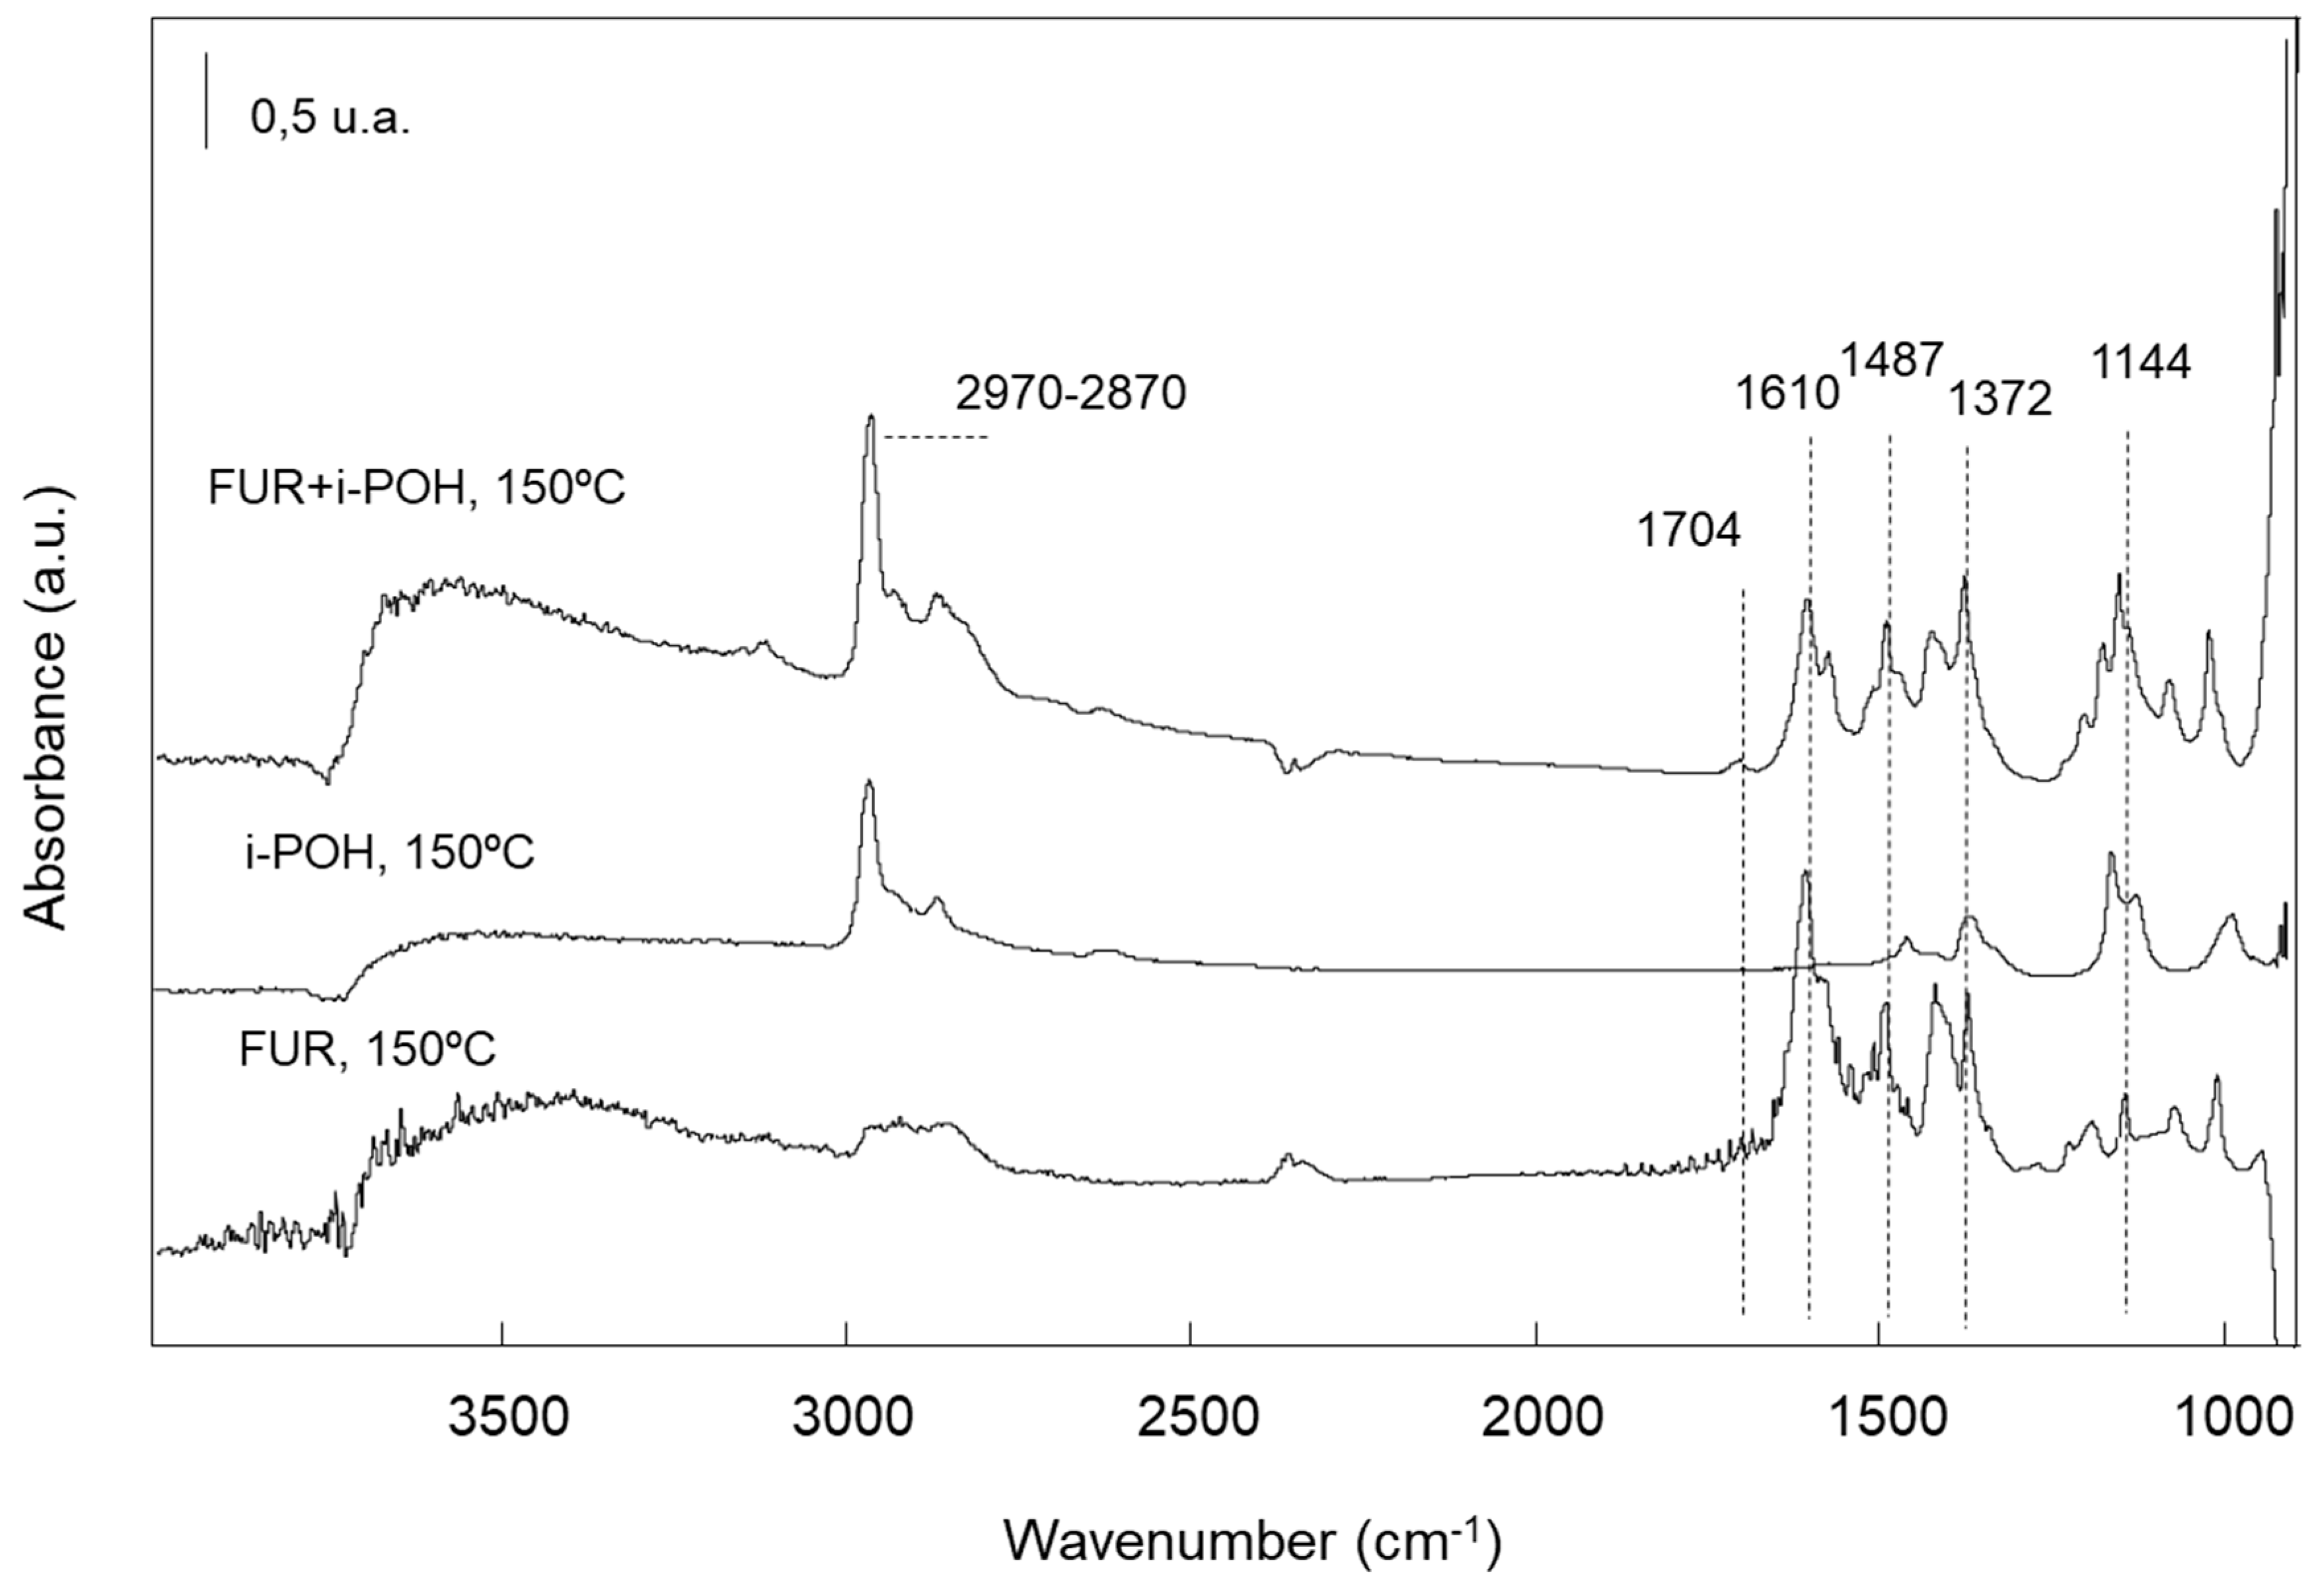
Finally, the i-POH and FUR were adsorbed on MgAl-3 catalyst simultaneously (Figure 15) and evacuated at 150 °C. Simultaneous adsorption of i-POH and FUR generated the same bands that were observed when adsorption was done separately. This indicates that both molecules did not compete for the same adsorption sites and, moreover, they did not modify their respective adsorption states on the catalyst [77]. However, compared to the i-POH or FUR adsorption experiments, new bands started to be noticed. Thus, a new band was observed at 1704 cm−1 corresponding to acetone weakly bonded through the oxygen atom to surface Lewis-type acid centers, i.e., this spectral feature proved that CTH reaction on the catalyst took place. From these spectroscopy experiments, we can conclude that i-POH adsorbs on both strong and weak basic sites, and FUR adsorbs on the metal centers that make the electronic sites deficient to coordinate the carbonyl group of FUR. In addition, both sites must be in the vicinity to form the described six-membered cycle necessary for the success of the reaction.

2.2.6. Influence of the Reaction Temperature in the Catalytic Activity of MgAl-x Catalysts

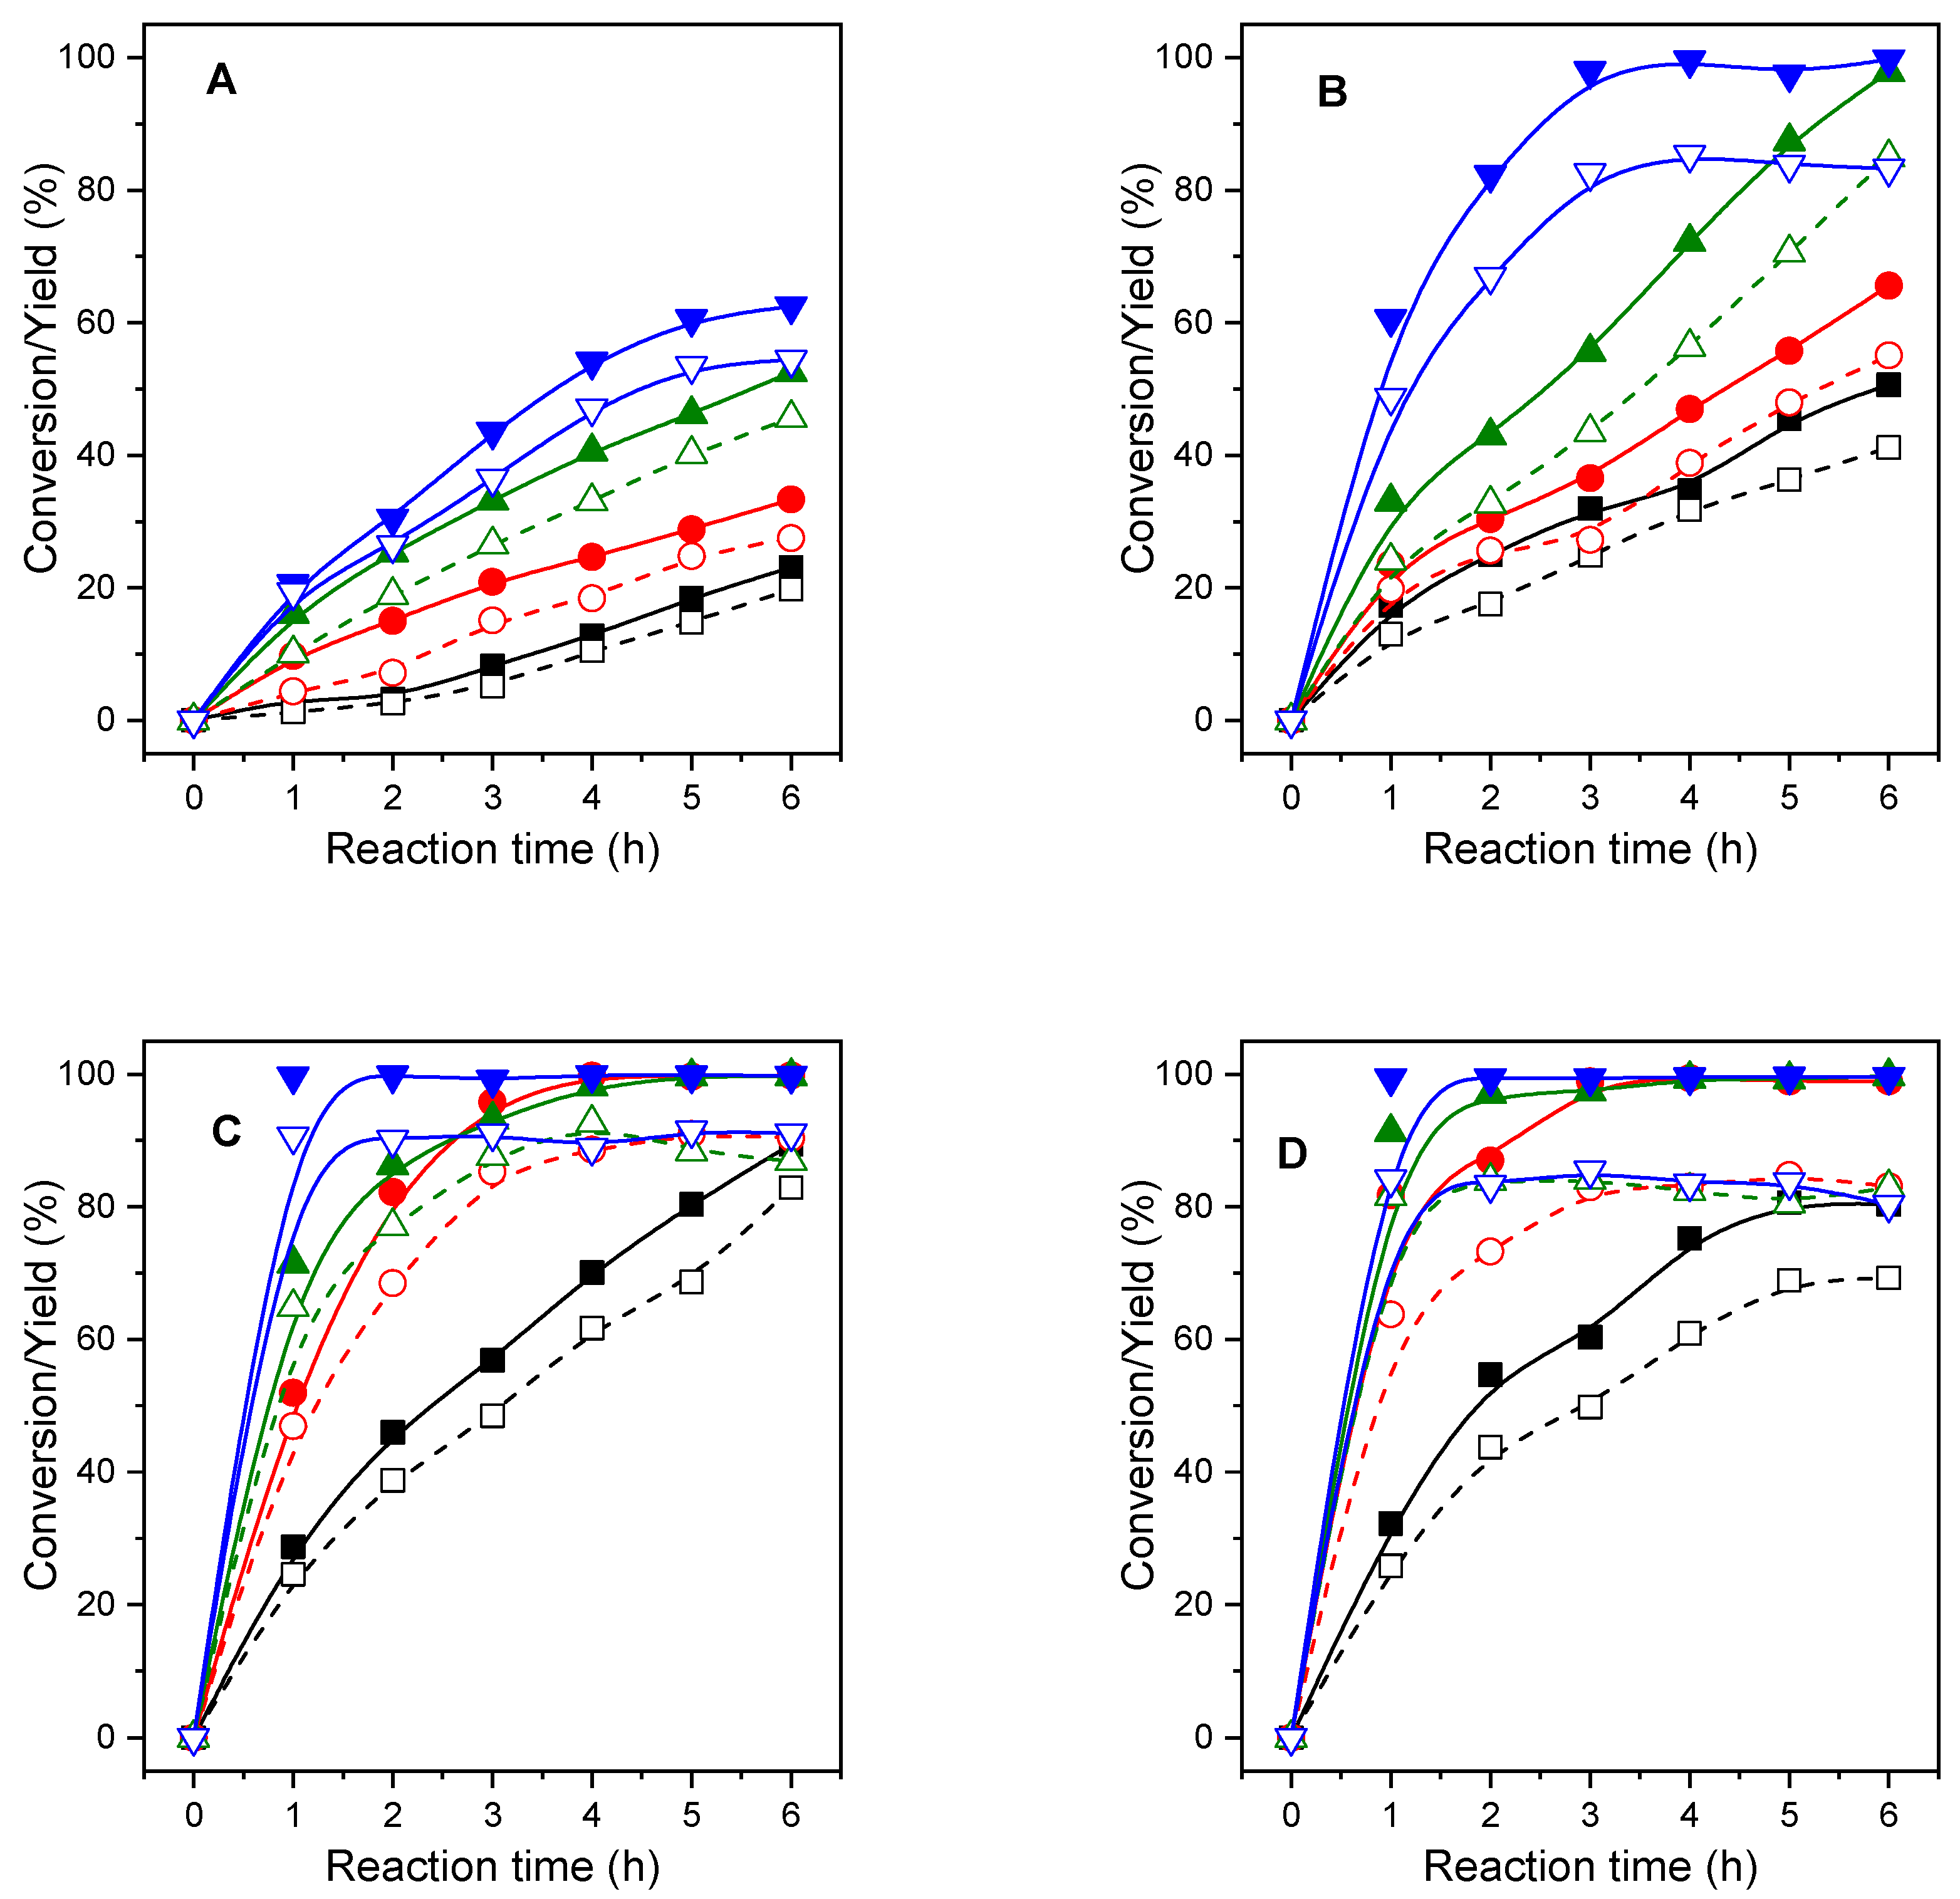
The reaction temperature was evaluated in the range of 90 to 150 °C for the MgAl-x catalysts (Figure 16), observing that both FUR conversion and FOL yield increased with temperature and reaction time. Furthermore, it is observed that both FUR and FOL followed the same trend. No decrease in FOL yield was appreciable with reaction time at any temperature tested, therefore, FOL did not seem to participate to a large extent in the formation of humins. The MgAl-1 catalyst did not achieve full conversion of FUR at any of the temperatures tested, with the maximum conversion of FUR being roughly 60 mol% at 150 °C. On the other hand, for the rest of the catalysts, the FUR conversion increased as the temperature increased. Moreover, the maximum conversion was reached at lower temperatures and shorter reaction times as the Mg/Al ratio increases, i.e., as the concentration of basic sites increased. Thus, the MgAl-2 catalyst reaches 100% conversion of FUR at 130 °C at 6 h of reaction or at 3 h when the temperature increased to 150 °C whereas the MgAl-4 catalyst reaches the maximum conversion at 110 °C after 3 h of reaction or at 1 h of reaction when the temperature increases to 150 °C. However, a consequence of increasing the temperature was related to the decrease in FOL yield and, therefore, the increase in non-detected products. Considering that the selectivity to FOL was maintained throughout the reaction time, this decrease in the yield to FOL is linked to a consumption of the FUR in secondary reactions that form other products, which, as mentioned above, are not detected by GC-FID. This was more intense for the MgAl-4 catalyst which showed a yield to others ranged between 16 and 20% when the temperature was raised up to 150 °C.

2.2.7. Influence of the Catalytic Parameters in the Activity of MgAl-3 Catalyst

MgAl-3 catalyst was selected for the study of the effect of several catalytic parameters. Firstly, the influence of i-POH/FUR ratio was studied (Figure 17) for ratios ranged between 25 to 75. The molar ratio of 25 did not reach the full FUR conversion at 110 °C even after 6 h of reaction. The CTH reaction is an equilibrium reaction so the increase in the molar amount of the sacrificial alcohol promotes the equilibrium shift towards the products of the reaction. The differences between 50 and 75 i-POH/FUR molar ratio were marginal and, therefore, the optimum ratio was set at 50. In addition, these tested ratios did not affect the FOL selectivity.
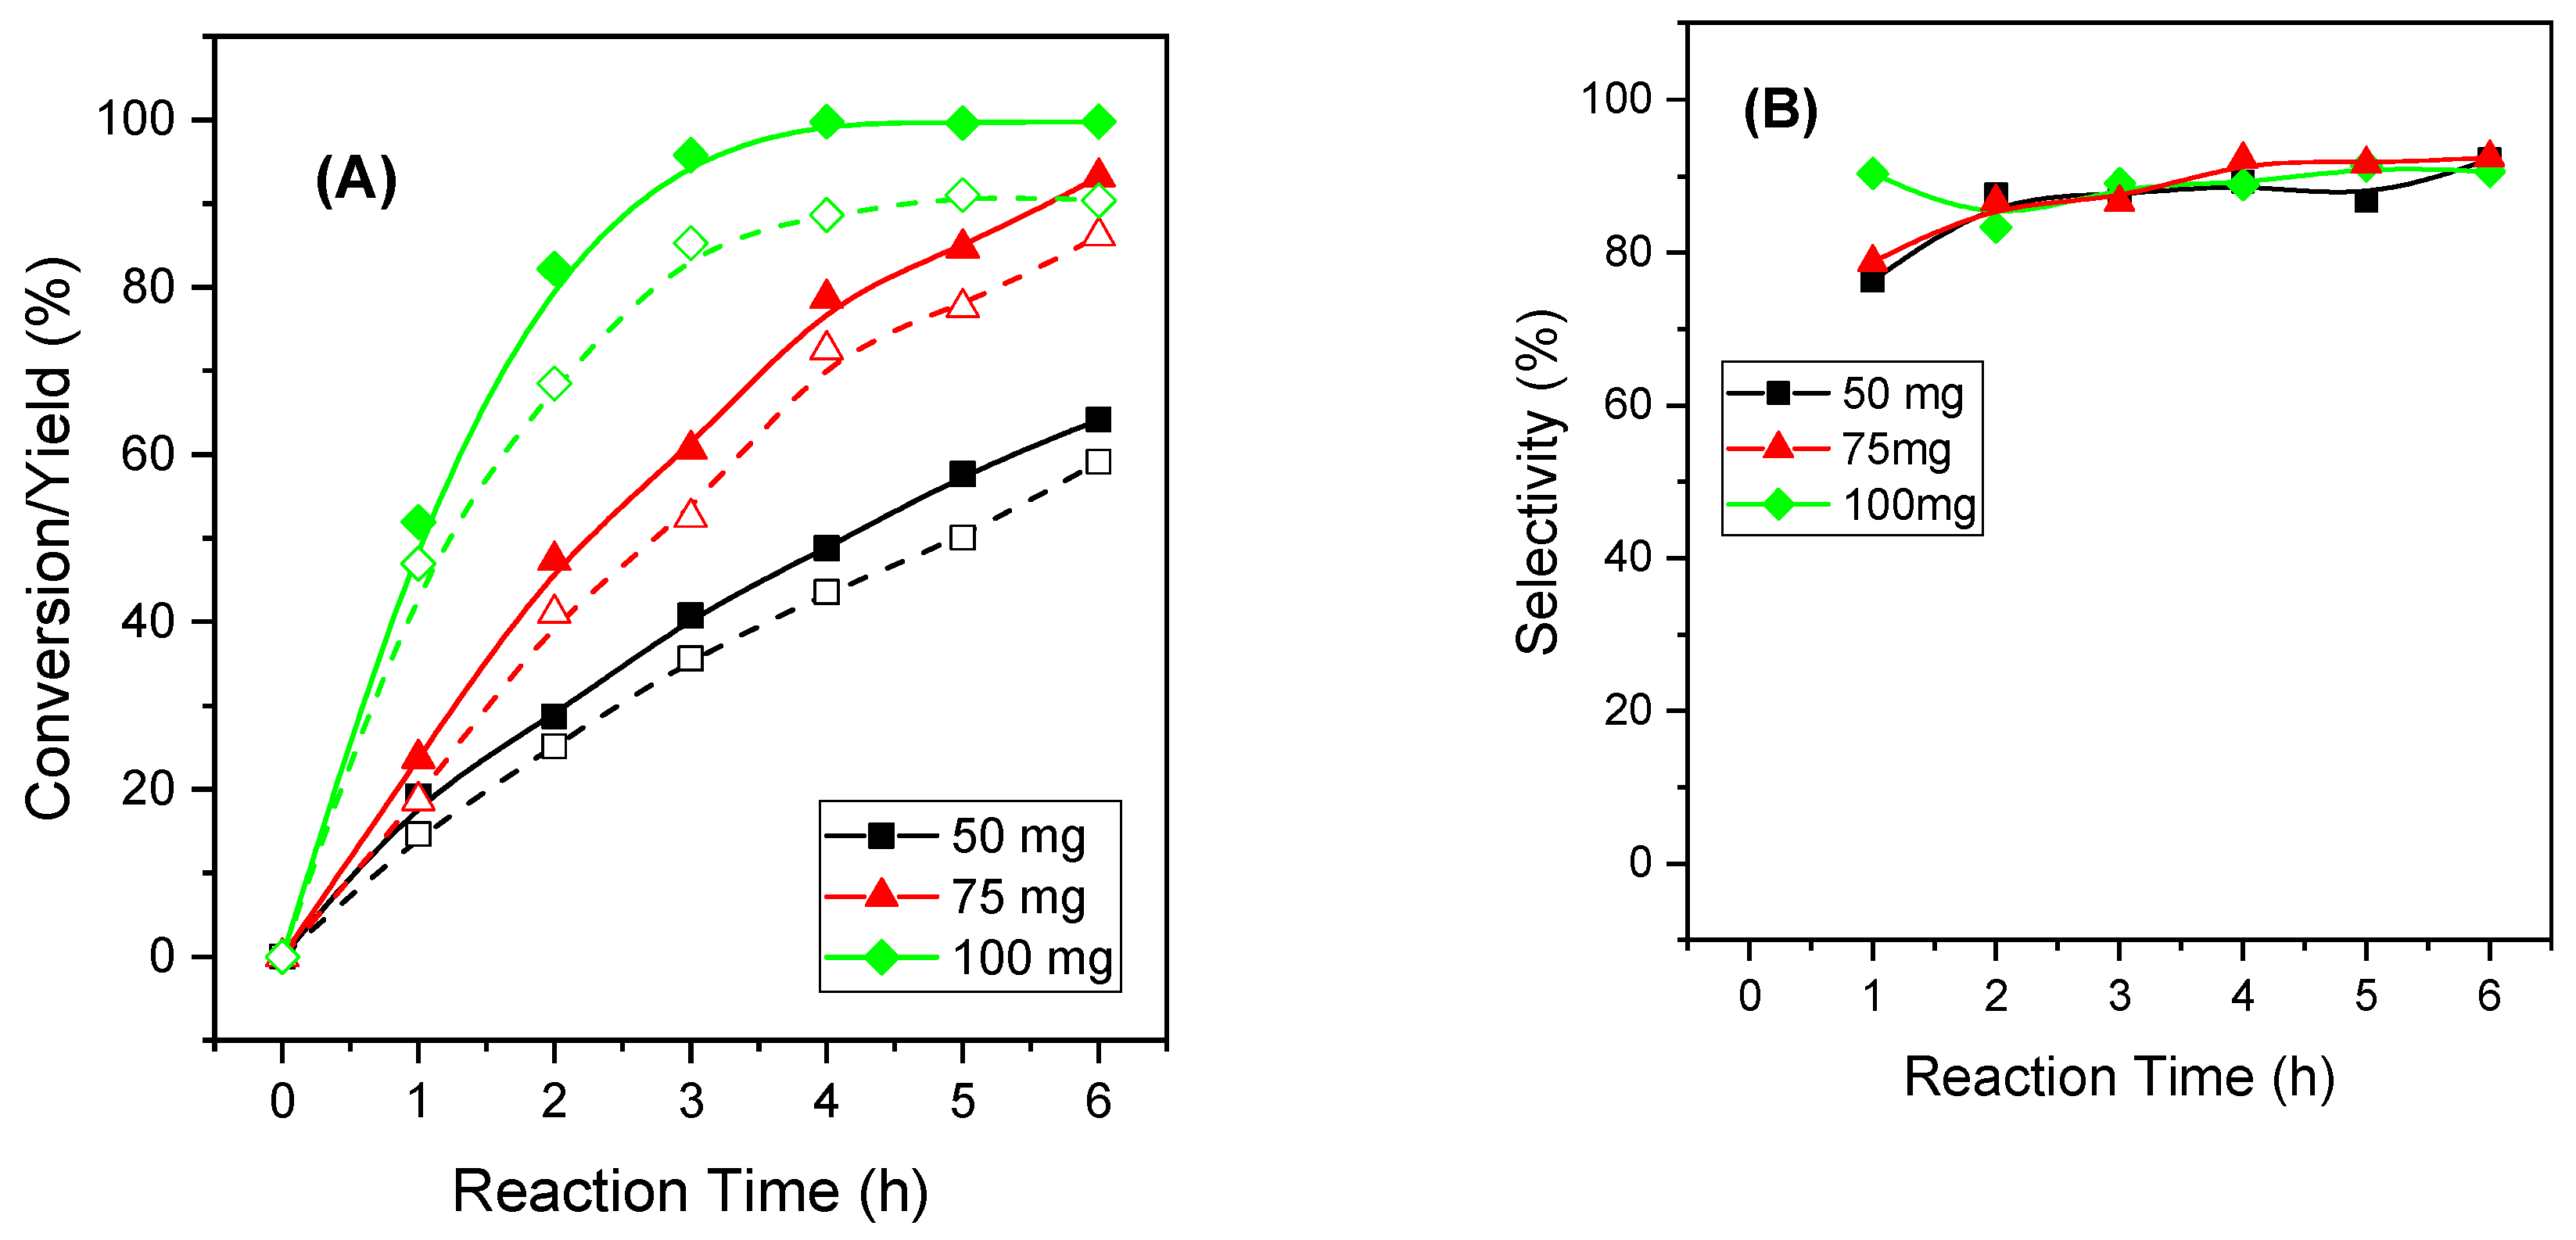
The catalyst dosage is an important parameter affecting the catalytic activity. Thus, the catalyst loading was examined (Figure 18). The FUR conversion was increased with the catalyst amount, reaching the full conversion with the highest catalyst amount. This was correlated with the amount of active sites present in the reaction medium, accelerating the CTH reaction. However, the selectivity to FOL was very similar for the three amounts tested, demonstrating that FOL selectivity was not affected by the catalyst dosage and the active sites loaded in the reactor were involved in the CTH reaction rather than in secondary reactions.
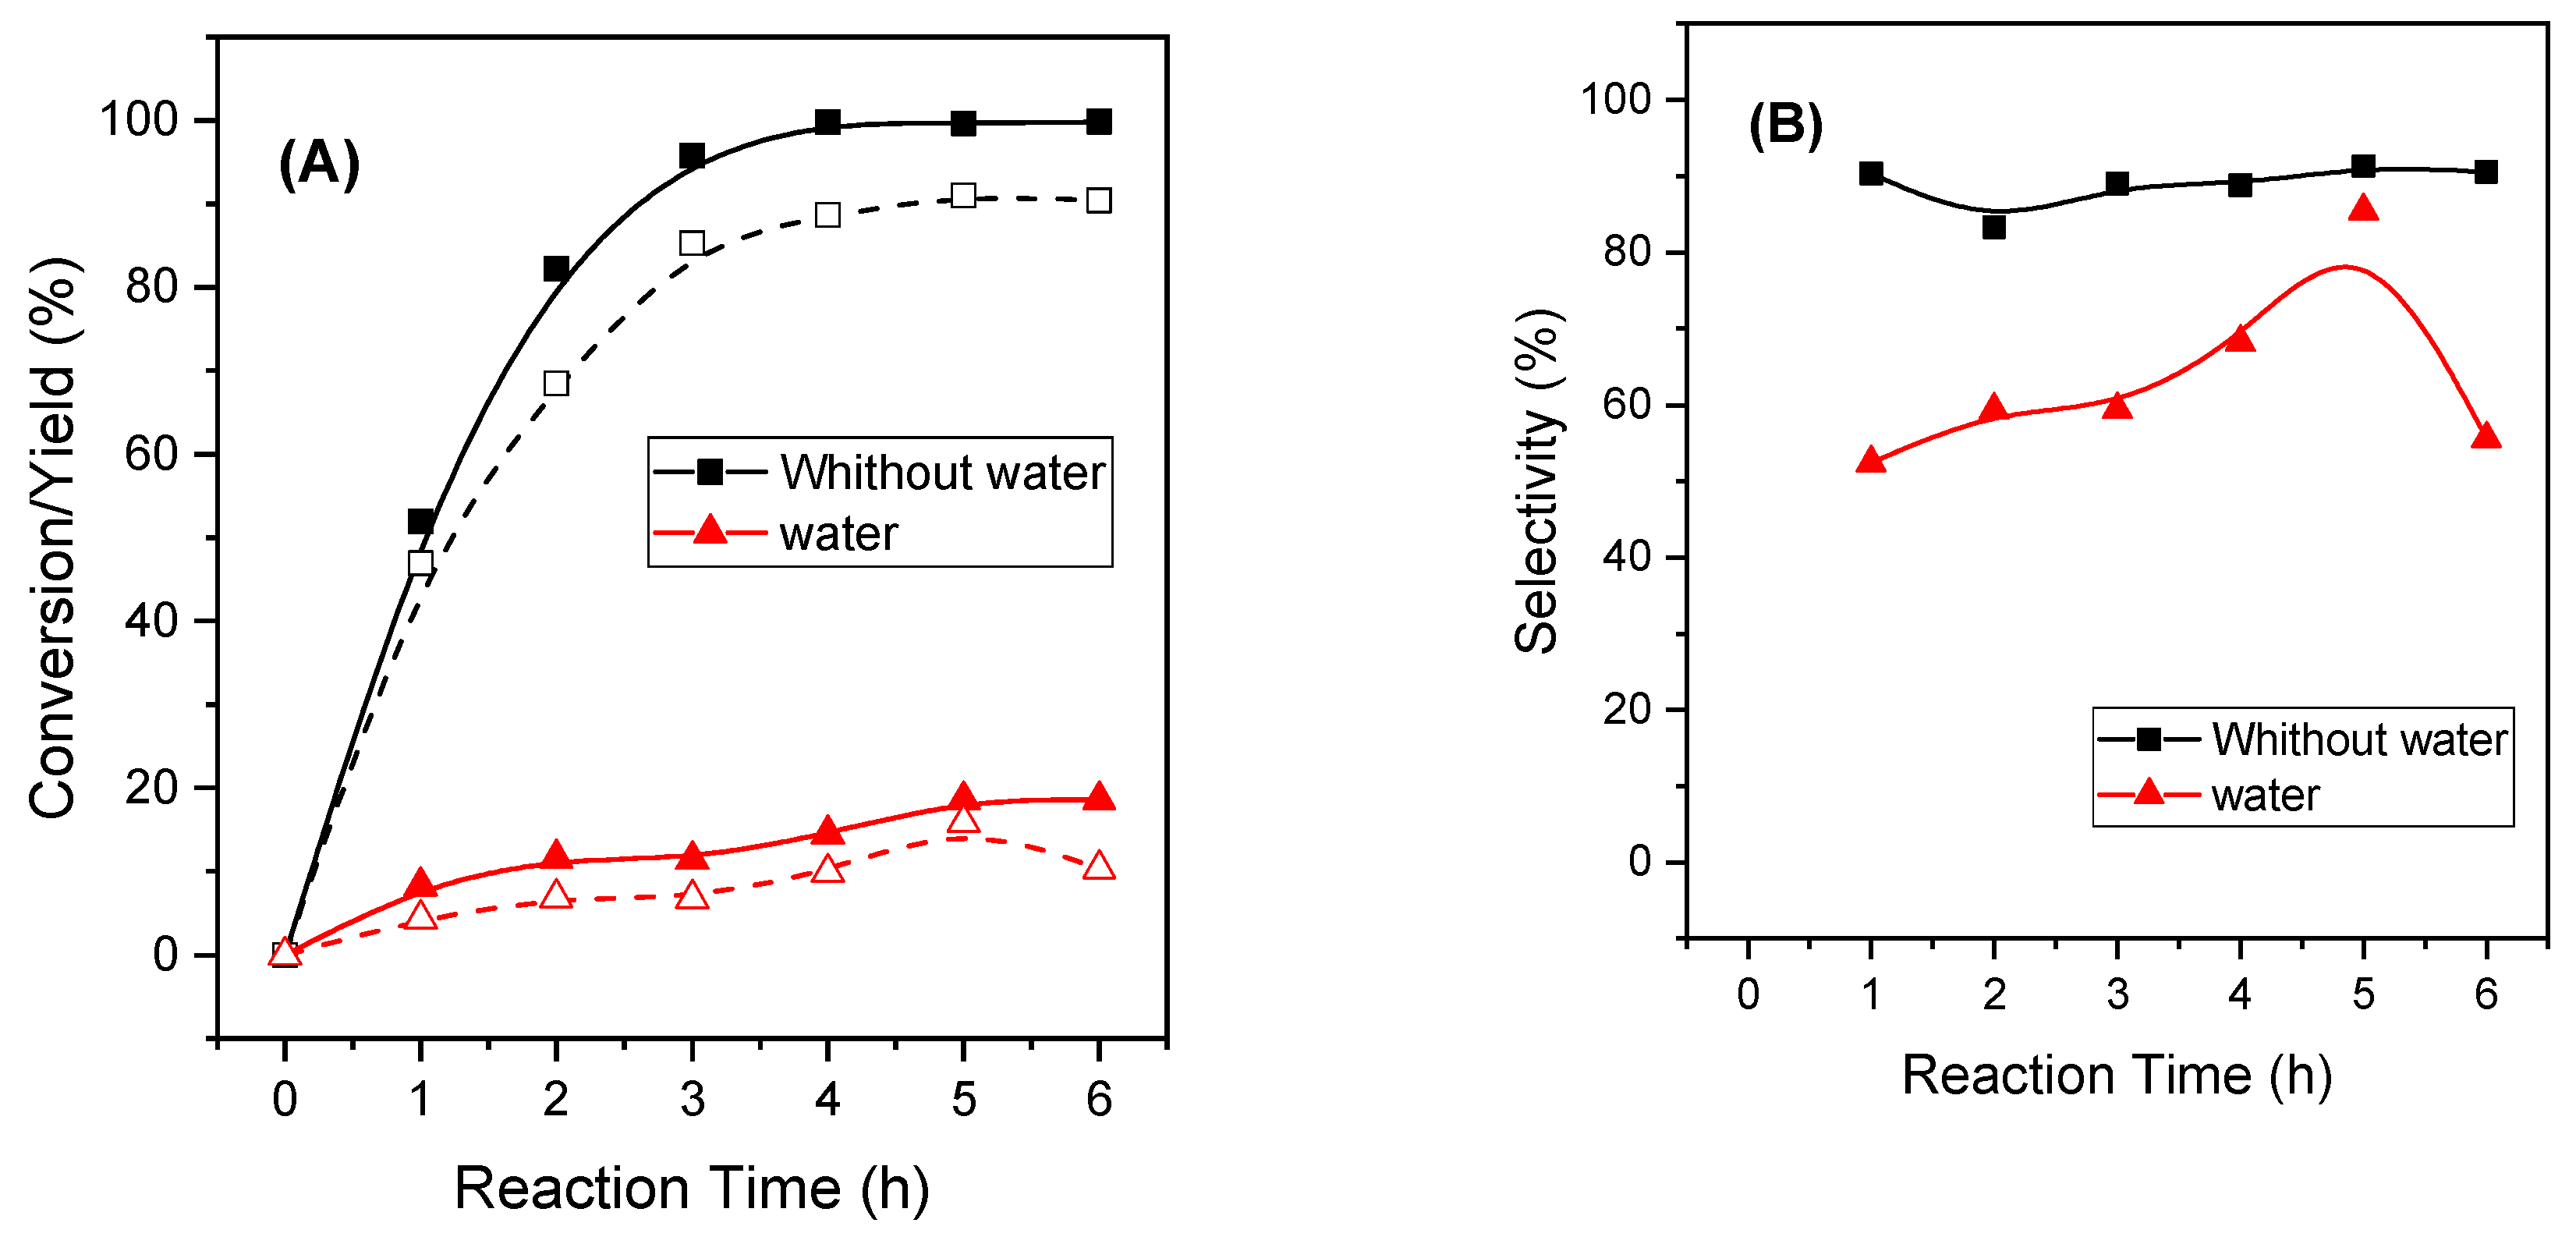
Finally, the role of water in the reaction medium was examined since there was interest in producing FOL directly from xylose in a one-pot reaction. Thus, the stoichiometric addition of water was added to the reactor, i.e., 3 moles of water per mole of FUR. Figure 19 shows a drastic drop in FUR conversion when a stoichiometric amount of water is present in the reactor. In addition, it was observed that selectivity to FOL was also greatly affected by the presence of water. This detrimental effect of water must be due to a change of the surface properties of the catalyst, modifying the nature of the active sites. In a previous paper [78], we demonstrated that the nature of the acid sites of a basic alumina was modified when it was treated with steam, resulting in an increase in the concentration of Brönsted acid sites at the expense of Lewis ones. Such sites were shown to be inactive in the reaction since the activity of such treated alumina was similar to the activity shown by untreated alumina in the presence of water in the reaction medium. In the case of MgAl-3 catalyst, the strong basic oxide ion-type centers can be transformed into -OH, of weaker strength along with the transformation of the Lewis centers into Brönsted centers which are not active in this CTH reaction.
To study the decrease in activity, FUR and i-POH catalyst were adsorbed on the catalyst in the presence of water and outgassed at 150 °C, analyzing the adsorbed species by FTIR (Figure 20). It is observed that the bands due to FUR and i-POH decreased their intensity and that the band associated with acetone disappeared. In addition, the spectrum resembles the catalyst used, so the surface species would be responsible for the low activity of the catalyst. All this indicates that water affects the adsorption of the reagents on the catalyst, decreasing its catalytic activity and rendering a lower FUR conversion and selectivity to FOL. These experimental results demonstrate that the water can be one of the most important poisons affecting the activity of the catalysts when the reduction of FUR is carried out by means of the MPV reaction.

3. Materials and Methods

3.1. Synthesis of Catalysts

The MgAl hydrotalcites were synthesized by the coprecipitation method of their respective salts, i.e., aluminum nitrate nonahydrated (Al(NO3)3 9H2O, Merck KGaA, Darmstadt, Germany, 99%) and magnesium nitrate hexahydrated (Mg(NO3)2 6H2O, Sigma-Aldrich, St. Louis, MO, USA, 99%), following a similar procedure to those shown in elsewhere [45]. The Mg/Al molar ratio was modified from 1 to 4, considering a total [Mg + Al] concentration of 1. The precipitation of Mg2+ and Al3+ species was carried out by the dropwise addition of a solution NaOH/Na2CO3, up to a pH of 10. The concentration of OH was set at 2 M and the CO32− concentration was half that of aluminum. The synthesis was realized at room temperature and after the addition of the precipitating agent, the solid was aged in the liquor mother during 42 h. Thereafter, the solid was filtered, washed abundantly with distilled water to remove the Na+ cations and dried overnight at 65 °C. Finally, the hydrotalcites were calcined considering their TG curves to obtain MgAl-mixed oxides. Additionally, Al2O3 and MgO catalysts from the same nitrate precursors and using the same precipitation and calcination conditions were synthesized.
In the case of the hydrotalcites, the samples were labeled HT-MgAl-x, and the mixed oxides obtained after calcination were denoted as MgAl-x, where x accounts for the Mg2+/Al3+ molar ratio.

3.2. Characterization of the Catalysts

Powder XRD patterns were obtained by using a PAN analytical X’Pert Pro automated diffractometer (Bruker, Rheinstetten, Germany) in Bragg–Brentano reflection configuration by using a Ge(111) primary monochromator (CuKα1) and an X’Celerator detector with a step size of 0.017° (2θ) between 2θ = 10 and 70° with an equivalent counting time of 712 s step−1. The crystallite size (D) was calculated by using the Williamson-Hall equation [79]: B cos θ = (K λ/D) + (2 ε sin θ), in which θ is the Bragg angle, B is the full width at half maximum (FWHM) of the XRD peaks, K is the Scherrer constant, λ is the wavelength of the X-ray, and ε is the lattice strain.
The TG-DSC data were recorded with a Mettler-Toledo (TGA/DSC-1) instrument (Columbus, OH, USA) equipped with a MX5 microbalance. The temperature was varied from RT to 900 °C at a heating rate of 5 °C min−1 with a flux of nitrogen of 50 mL min−1 using a mass around 10 mg. The measurements were performed with samples in open alumina crucibles under an air flow.
The textural parameters were evaluated from the N2 adsorption-desorption isotherms at −196 °C determined by using an automatic ASAP 2020 Micromeritics apparatus, (Micrometrics, Norcross, GA, USA). Before measurements, samples were calcined at 450 °C and then they were outgassed at 200 °C and 10−4 mbar overnight. Specific surface areas (SBET) were determined by using the BET equation considering a N2 cross section of 16.2 Å2. The pore size distribution was determined by using the DFT method. The basicity of the catalysts was studied by temperature-programmed desorption of CO2, where approximately 100 mg of sample was pretreated in a helium flow (60 mL min−1) at 450 °C for 30 min (10 °C min−1). The reaction temperature was lowered to 80 °C and a pure CO2 stream (60 mL min−1) was subsequently introduced into the reactor for 30 min. The CO2-TPD experiments were conducted between 100 and 450 °C He flow (10 °C min−1 and 30 mL min−1) and the amount of CO2 evolved was analyzed using a thermal conductivity detector (TCD).
XPS spectra were obtained by using a Physical Electronics PHI 5700 spectrometer (Physical Electronics, Eden Prairie, MN, USA) with non-monochromatic MgKα radiation (300 W, 15 kV, 1253.6 eV) with a multichannel detector. Spectra were recorded in the constant pass energy mode at 29.35 eV using a 720 μm diameter analysis area. Charge referencing was measured against adventitious carbon (C 1s at binding energy = 284.6 eV). A PHI ACCESS ESCA-V6.0 F software package was used for acquisition and data analysis. A Shirley-type background was subtracted from the signals. All recorded spectra were fitted using Gaussian–Lorentzian curves to more accurately determine the BE of the different element core levels. All samples were stored in sealed vials with an inert solvent to avoid oxidation. The sample preparation was performed in a dry box under an N2 flow, the solvent was evaporated before its introduction into the analysis chamber, and directly analyzed without previous treatment.
FTIR analyses of adsorbed probe molecules on the catalyst surface were carried out over the MgAl-3 sample using pressed disks of pure powders activated in vacuum at 500 °C. An Avatar 380 Nicolet FT instrument (GMI, Ramsey, MN, USA) was used (100 scans, DTGS detector, KBr beam splitter, ONMICTM software). The disks were placed in an IR cell (provided with KBr windows) connected to a conventional gas/liquid manipulation apparatus and spectra of the samples after treatment at high temperature have been collected at room temperature. Isopropanol, furfural and a mixture of isopropanol/furfural adsorption (pulse of 10 torr) were carried out at room temperature over the surface activated at 500 °C with the purpose of analyzing the species formed by their interaction with the sample surface. NH3 or CO2 was also used as a molecule probe to study the acidity properties and strength and nature of carbonates formed respectively. The pretreated samples were exposed to the probe molecule at room temperature, after which the IR spectra of the surface species were collected between the room temperature and the target temperature when outgassing in continuous evacuation. Spectra presented are substraction spectra in which the spectrum of the activated sample was subtracted.

3.3. Catalytic Reaction and Measurement of the Reaction Products

The reaction was carried out in glass reactors that support autogenous pressures (Ace, 15 mL, pressure rated to 10 bars). In certain experiments, the reactor was loaded with 100 mg of hydrotalcite activated at 450 °C in which there was a 5 mL solution of furfural (1 mmol) in alcohol (isopropanol, 2-butanol or cyclohexanol), being the molar ratio alcohol: Furfural of 50. The reaction medium was kept under stirring (400 rpm) at the selected temperature during the reaction time (1–6 h). Afterwards, the reaction was stopped by immersing the reactor in iced water. The catalyst was filtered and saved for later characterization and an aliquot was taken from the reaction medium for analysis of the reaction products by gas chromatography (Shimadzu GC-14A) (Shimadzu Co., Kyoto, Japan), equipped with a Flame Ionization Detector and a CP-Wax 52 CB capillary column. The furfural conversion and selectivity were calculated, as follows:
Conversion   ( % ) = mol   Furfural   converted mol   Furfural   fed × 100
Selectivity   ( % ) = mol   Furfuryl   Alcohol mol   Furfural   converted × 100

4. Conclusions

In this work, we have demonstrated that the MgAlOx mixed oxides derived from Mg/Al hydrotalcites were active and very selective in the CTH reduction of FUR to FOL. The activity was closely related to the basicity of the catalysts. The higher the basicity of the catalysts, the higher the catalytic activity and the better catalytic results were achieved at lower reaction times and temperatures. Thus, the MgAl-3 and MgAl-4 were very active at 110 °C and higher temperatures implied a reduction of FOL yield since the FUR was consumed in secondary reactions yielding humins. The formation of such compounds were detected by FTIR spectroscopy on the surface of the catalysts.
Adsorption of FUR and i-POH on the MgAl-3 catalyst, followed by FTIR spectroscopy, showed that both molecules did not compete for the same adsorption sites. Since i-POH adsorbed on the basic sites, regardless of whether they were strong or weak basic sites, and FUR adsorbed via the carbonyl oxygen on the Lewis acid sites provided by the metal cations present in the vicinity of the basic sites to form the six-membered cycle.
Despite these promising results, reuse was unsuccessful, as the activity dropped sharply after the first catalytic cycle. The calcination process for catalyst reactivation was not a viable treatment as the activity partially recovered. This fact was related to the segregation of hydroxide species on the surface that could not carry out the reaction.

Author Contributions

Conceptualization, R.M.-T. and J.A.C.-B.; methodology, J.A.C.-B., C.G.-S., C.H.-D. and M.Á.L.-V.; investigation, R.L.-A., C.H.-D. and M.Á.L.-V.; resources, R.L.-A. and C.G.-S.; writing—original draft preparation, J.A.C.-B.; writing—review and editing, R.M.-T.; supervision, R.M.-T.; project administration, P.J.M.-T.; funding acquisition, P.J.M.-T. and R.M.-T. All authors have read and agreed to the published version of the manuscript.

Funding

This research was funded by the Spanish Ministry of Science and Innovation (PID2021-122736OB-C42), FEDER (European Union) funds (PID2021-122736OB-C42, P20-00375, UMA20-FEDERJA88).

Conflicts of Interest

The authors declare no conflict of interest. The funders had no role in the design of the study; in the collection, analyses, or interpretation of data; in the writing of the manuscript, or in the decision to publish the results.

References

  1. Kamm, B.; Gruber, P.R.; Kamm, M. Biorefineries-Industrial Processes and Products: Status Quo and Future Directions. Biorefineries-Ind. Process. Prod. Status Quo Futur. Dir. 2008, 1–2, 1–959. [Google Scholar] [CrossRef]
  2. Mariscal, R.; Maireles-Torres, P.; Ojeda, M.; Sá Daba, I.; Ló Pez Granados, M. Furfural: A Renewable and Versatile Platform Molecule for the Synthesis of Chemicals and Fuels. Energy Environ. Sci. 2016, 9, 1144. [Google Scholar] [CrossRef]
  3. Zeitsch, K.J. The Chemistry and Technology of Furfural and Its Many By-Products 10. Furfural Processes. Sugar Ser. 2000, 13, 36–74. [Google Scholar]
  4. Dalvand, K.; Rubin, J.; Gunukula, S.; Clayton Wheeler, M.; Hunt, G. Economics of Biofuels: Market Potential of Furfural and Its Derivatives. Biomass Bioenergy 2018, 115, 56–63. [Google Scholar] [CrossRef]
  5. Petersen, T.W.G. Top Value Added Chemicals from Biomass Volume I—Results of Screening for Potential Candidates from Sugars and Synthesis Gas; National Renewable Energy Lab.: Golden, CO, USA, 2004. [Google Scholar]
  6. Lange, J.-P.; Van Der Heide, E.; Van Buijtenen, J.; Price, R. Furfural-A Promising Platform for Lignocellulosic Biofuels. ChemSusChem 2012, 5, 150–166. [Google Scholar] [CrossRef]
  7. Yan, K.; Wu, G.; Lafleur, T.; Jarvis, C. Production, Properties and Catalytic Hydrogenation of Furfural to Fuel Additives and Value-Added Chemicals. Renew. Sustain. Energy Rev. 2014, 38, 663–676. [Google Scholar] [CrossRef]
  8. Sitthisa, S.; Resasco, D.E. Hydrodeoxygenation of Furfural over Supported Metal Catalysts: A Comparative Study of Cu, Pd and Ni. Catal. Lett. 2011, 141, 784–791. [Google Scholar] [CrossRef]
  9. Jiménez-Gómez, C.P.; Cecilia, J.A.; Durán-Martín, D.; Moreno-Tost, R.; Santamaría-González, J.; Mérida-Robles, J.; Mariscal, R.; Maireles-Torres, P. Gas-Phase Hydrogenation of Furfural to Furfuryl Alcohol over Cu/ZnO Catalysts. J. Catal. 2016, 336, 107–115. [Google Scholar] [CrossRef]
  10. Nakagawa, Y.; Nakazawa, H.; Watanabe, H.; Tomishige, K. Total Hydrogenation of Furfural over a Silica-Supported Nickel Catalyst Prepared by the Reduction of a Nickel Nitrate Precursor. ChemCatChem 2012, 4, 1791–1797. [Google Scholar] [CrossRef]
  11. Pang, S.H.; Schoenbaum, C.A.; Schwartz, D.K.; Medlin, J.W. ARTICLE Directing Reaction Pathways by Catalyst Active-Site Selection Using Self-Assembled Monolayers. Nat. Commun. 2013, 4, 2448. [Google Scholar] [CrossRef] [Green Version]
  12. Baker, L.R.; Kennedy, G.; Van Spronsen, M.; Hervier, A.; Cai, X.; Chen, S.; Wang, L.W.; Somorjai, G.A. Furfuraldehyde Hydrogenation on Titanium Oxide-Supported Platinum Nanoparticles Studied by Sum Frequency Generation Vibrational Spectroscopy: Acid-Base Catalysis Explains the Molecular Origin of Strong Metal-Support Interactions. J. Am. Chem. Soc. 2012, 134, 14208–14216. [Google Scholar] [CrossRef] [PubMed]
  13. Xu, Y.; Xu, Z.; An, Z.; Zhou, J.; Li, J. Active Metal Oxide-Nitrogen-Doped Carbon Hybrid Catalysts towards Selective Catalytic Transfer Hydrogenation of Furfural to Furfuryl Alcohol. Appl. Catal. A Gen. 2022, 636, 118574. [Google Scholar] [CrossRef]
  14. Gao, B.; Zhang, J.; Yang, J.H. Bimetallic Cu-Ni/MCM-41 Catalyst for Efficiently Selective Transfer Hydrogenation of Furfural into Furfural Alcohol. Mol. Catal. 2022, 517, 112065. [Google Scholar] [CrossRef]
  15. Meerwein, H.; Schmidt, R. Ein Neues Verfahren Zur Reduktion von Aldehyden Und Ketonen. Justus Liebigs Ann. Chem. 1925, 444, 221–238. [Google Scholar] [CrossRef]
  16. Verley, M. Sur l’échange de Groupements Fonctionnels Entre Deux Molécules. Passage Des Cétones Aux Alcohols et Inversement. Bull. Soc. Chim. Fr. 1925, 37, 871–874. [Google Scholar]
  17. Ponndorf, W. Der Reversible Austausch Der Oxydationsstufen Zwischen Aldehyden Oder Ketonen Einerseits Und Primären Oder Sekundären Alkoholen Anderseits. Angew. Chem. 1926, 39, 138–143. [Google Scholar] [CrossRef]
  18. Graves, C.R.; Zhou, H.; Stern, C.L.; Nguyen, S.B.T. A Mechanistic Investigation of the Asymmetric Meerwein-Schmidt-Ponndorf- Verley Reduction Catalyzed by BINOL/AlMe3—Structure, Kinetics, and Enantioselectivity. J. Org. Chem. 2007, 72, 9121–9133. [Google Scholar] [CrossRef] [PubMed]
  19. Cohen, R.; Graves, C.R.; Nguyen, S.B.T.; Martin, J.M.L.; Ratner, M.A. The Mechanism of Aluminum-Catalyzed Meerwein-Schmidt-Ponndorf-Verley Reduction of Carbonyls to Alcohols. J. Am. Chem. Soc. 2004, 126, 14796–14803. [Google Scholar] [CrossRef]
  20. Liu, Y.C.; Ko, B.T.; Huang, B.H.; Lin, C.C. Reduction of Aldehydes and Ketones Catalyzed by a Novel Aluminum Alkoxide: Mechanistic Studies of Meerwein-Ponndorf-Verley Reaction. Organometallics 2002, 21, 2066–2069. [Google Scholar] [CrossRef]
  21. Ooi, T.; Ichikawa, H.; Maruoka, K. Practical Approach to the Meerwein ± Ponndorf ± Verley Reduction of Carbonyl Substrates with New Aluminum Catalysts. Angew. Chem. Int. Ed. 2001, 40, 3610–3612. [Google Scholar] [CrossRef]
  22. Nandi, P.; Solovyov, A.; Okrut, A.; Katz, A. AlIII-Calix[4]Arene Catalysts for Asymmetric Meerwein-Ponndorf-Verley Reduction. ACS Catal. 2014, 4, 2492–2495. [Google Scholar] [CrossRef]
  23. Graves, C.R.; Joseph Campbell, E.; Nguyen, S.B.T. Aluminum-Based Catalysts for the Asymmetric Meerwein–Schmidt–Ponndorf–Verley–Oppenauer (MSPVO) Reaction Manifold. Tetrahedron Asymmetry 2005, 16, 3460–3468. [Google Scholar] [CrossRef]
  24. Creyghton, E.J.; Ganeshie, S.D.; Downing, R.S.; Van Bekkum, H. Stereoselective Meerwein–Ponndorf–Verley and Oppenauer Reactions Catalysed by Zeolite BEA. J. Mol. Catal. A Chem. 1997, 115, 457–472. [Google Scholar] [CrossRef]
  25. Gao, Z.K.; Hong, Y.C.; Hu, Z.; Xu, B.Q. Transfer Hydrogenation of Cinnamaldehyde with 2-Propanol on Al2O3 and SiO2 –Al2O3 Catalysts: Role of Lewis and Brønsted Acidic Sites. Catal. Sci. Technol. 2017, 7, 4511–4519. [Google Scholar] [CrossRef]
  26. Gonell, F.; Boronat, M.; Corma, A. Structure–Reactivity Relationship in Isolated Zr Sites Present in Zr-Zeolite and ZrO2 for the Meerwein–Ponndorf–Verley Reaction. Catal. Sci. Technol. 2017, 7, 2865–2873. [Google Scholar] [CrossRef] [Green Version]
  27. Luo, H.Y.; Consoli, D.F.; Gunther, W.R.; Román-Leshkov, Y. Investigation of the Reaction Kinetics of Isolated Lewis Acid Sites in Beta Zeolites for the Meerwein–Ponndorf–Verley Reduction of Methyl Levulinate to γ-Valerolactone. J. Catal. 2014, 320, 198–207. [Google Scholar] [CrossRef] [Green Version]
  28. Assary, R.S.; Curtiss, L.A.; Dumesic, J.A. Exploring Meerwein-Ponndorf-Verley Reduction Chemistry for Biomass Catalysis Using a First-Principles Approach. ACS Catal. 2013, 3, 2694–2704. [Google Scholar] [CrossRef]
  29. Iglesias, J.; Melero, J.A.; Morales, G.; Moreno, J.; Segura, Y.; Paniagua, M.; Cambra, A.; Hernández, B. Zr-SBA-15 Lewis Acid Catalyst: Activity in Meerwein Ponndorf Verley Reduction. Catalysts 2015, 5, 1911–1927. [Google Scholar] [CrossRef] [Green Version]
  30. De Bruyn, M.; Limbourg, M.; Denayer, J.; Baron, G.V.; Parvulescu, V.; Grobet, P.J.; De Vos, D.E.; Jacobs, P.A. Mesoporous Zr and Hf Catalysts for Chemoselective MPV Reductions of Unsaturated Ketones. Appl. Catal. A Gen. 2003, 254, 189–201. [Google Scholar] [CrossRef]
  31. Boronat, M.; Corma, A.; Renz, M. Mechanism of the Meerwein-Ponndorf-Verley-Oppenauer (MPVO) Redox Equilibrium on Sn- and Zr—Beta Zeolite Catalysts. J. Phys. Chem. B 2006, 110, 21168–21174. [Google Scholar] [CrossRef]
  32. Corma, A.; Domine, M.E.; Valencia, S. Water-Resistant Solid Lewis Acid Catalysts: Meerwein–Ponndorf–Verley and Oppenauer Reactions Catalyzed by Tin-Beta Zeolite. J. Catal. 2003, 215, 294–304. [Google Scholar] [CrossRef]
  33. Corma, A.; Domine, M.E.; Nemeth, L.; Valencia, S. Al-Free Sn-Beta Zeolite as a Catalyst for the Selective Reduction of Carbonyl Compounds (Meerwein-Ponndorf-Verley Reaction). J. Am. Chem. Soc. 2002, 124, 3194–3195. [Google Scholar] [CrossRef] [PubMed]
  34. Wang, F.; Zhang, Z. Catalytic Transfer Hydrogenation of Furfural into Furfuryl Alcohol over Magnetic γ-Fe2O3@HAP Catalyst. ACS Sustain. Chem. Eng. 2017, 5, 942–947. [Google Scholar] [CrossRef]
  35. Hidalgo, J.M.; Jiménez-Sanchidrián, C.; Ruiz, J.R. Delaminated Layered Double Hydroxides as Catalysts for the Meerwein–Ponndorf–Verley Reaction. Appl. Catal. A Gen. 2014, 470, 311–317. [Google Scholar] [CrossRef]
  36. Aramendía, M.A.; Borau, V.; Jiménez, C.; Marinas, J.M.; Ruiz, J.R.; Urbano, F.J. Influence of the Preparation Method on the Structural and Surface Properties of Various Magnesium Oxides and Their Catalytic Activity in the Meerwein–Ponndorf–Verley Reaction. Appl. Catal. A Gen. 2003, 244, 207–215. [Google Scholar] [CrossRef]
  37. Xiao, Z. Insight into the Meerwein-Ponndorf-Verley Reduction of Cinnamaldehyde over MgAl Oxides Catalysts. Mol. Catal. 2017, 436, 1–9. [Google Scholar] [CrossRef]
  38. Kumbhar, P.S. Jaime Sanchez-Valente; Joseph Lopez; François Figueras Meerwein–Ponndorf–Verley Reduction of Carbonyl Compounds Catalysed by Mg–Al Hydrotalcite. Chem. Commun. 1998, 0, 535–536. [Google Scholar] [CrossRef]
  39. Axpuac, S.; Aramendía, M.A.; Hidalgo-Carrillo, J.; Marinas, A.; Marinas, J.M.; Montes-Jiménez, V.; Urbano, F.J.; Borau, V. Study of Structure–Performance Relationships in Meerwein–Ponndorf–Verley Reduction of Crotonaldehyde on Several Magnesium and Zirconium-Based Systems. Catal. Today 2012, 187, 183–190. [Google Scholar] [CrossRef]
  40. Wang, Q.; Ohare, D. Recent Advances in the Synthesis and Application of Layered Double Hydroxide (LDH) Nanosheets. Chem. Rev. 2012, 112, 4124–4155. [Google Scholar] [CrossRef]
  41. Antunes, M.M.; Lima, S.; Neves, P.; Magalhães, A.L.; Fazio, E.; Fernandes, A.; Neri, F.; Silva, C.M.; Rocha, S.M.; Ribeiro, M.F.; et al. One-Pot Conversion of Furfural to Useful Bio-Products in the Presence of a Sn,Al-Containing Zeolite Beta Catalyst Prepared via Post-Synthesis Routes. J. Catal. 2015, 329, 522–537. [Google Scholar] [CrossRef] [Green Version]
  42. Koehle, M.; Lobo, R.F. Lewis Acidic Zeolite Beta Catalyst for the Meerwein–Ponndorf–Verley Reduction of Furfural. Catal. Sci. Technol. 2016, 6, 3018–3026. [Google Scholar] [CrossRef]
  43. Bui, L.; Luo, H.; Gunther, W.R.; Romµn-Leshkov, Y.; Bui, L.; Luo, H.; Gunther, W.R.; Romµn-Leshkov, Y. Domino Reaction Catalyzed by Zeolites with Brønsted and Lewis Acid Sites for the Production of γ-Valerolactone from Furfural. Angew. Chem. Int. Ed. 2013, 52, 8022–8025. [Google Scholar] [CrossRef] [PubMed]
  44. Antunes, M.M.; Lima, S.; Neves, P.; Magalhães, A.L.; Fazio, E.; Neri, F.; Pereira, M.T.; Silva, A.F.; Silva, C.M.; Rocha, S.M.; et al. Integrated Reduction and Acid-Catalysed Conversion of Furfural in Alcohol Medium Using Zr,Al-Containing Ordered Micro/Mesoporous Silicates. Appl. Catal. B Environ. 2016, 182, 485–503. [Google Scholar] [CrossRef] [Green Version]
  45. Guerrero-Urbaneja, P.; García-Sancho, C.; Moreno-Tost, R.; Mérida-Robles, J.; Santamaría-González, J.; Jiménez-López, A.; Maireles-Torres, P. Glycerol Valorization by Etherification to Polyglycerols by Using Metal Oxides Derived from MgFe Hydrotalcites. Appl. Catal. A Gen. 2014, 470, 199–207. [Google Scholar] [CrossRef]
  46. Nogueira, K.A.B.; Cecilia, J.A.; Santos, S.O.; Aguiar, J.E.; Vilarrasa-García, E.; Rodríguez-Castellón, E.; Azevedo, D.C.S.; Silva, I.J. Adsorption Behavior of Bovine Serum Albumin on Zn–Al and Mg–Al Layered Double Hydroxides. J. Sol-Gel Sci. Technol. 2016, 80, 748–758. [Google Scholar] [CrossRef]
  47. Ulibarri, M.A.; Hernandez, M.J.; Cornejo, J. Changes in Textural Properties Derived from the Thermal Decomposition of Synthetic Pyroaurite. Thermochim. Acta 1987, 113, 79–86. [Google Scholar] [CrossRef]
  48. Valente, J.S.; Hernandez-Cortez, J.; Cantu, M.S.; Ferrat, G.; López-Salinas, E. Calcined Layered Double Hydroxides Mg–Me–Al (Me: Cu, Fe, Ni, Zn) as Bifunctional Catalysts. Catal. Today 2010, 150, 340–345. [Google Scholar] [CrossRef]
  49. León, M.; Díaz, E.; Vega, A.; Ordóñez, S.; Auroux, A. Consequences of the Iron–Aluminium Exchange on the Performance of Hydrotalcite-Derived Mixed Oxides for Ethanol Condensation. Appl. Catal. B Environ. 2011, 102, 590–599. [Google Scholar] [CrossRef]
  50. Thommes, M.; Kaneko, K.; Neimark, A.V.; Olivier, J.P.; Rodriguez-Reinoso, F.; Rouquerol, J.; Sing, K.S.W. Physisorption of Gases, with Special Reference to the Evaluation of Surface Area and Pore Size Distribution (IUPAC Technical Report). Pure Appl. Chem. 2015, 87, 1051–1069. [Google Scholar] [CrossRef] [Green Version]
  51. Gursky, J.A.; Blough, S.D.; Luna, C.; Gomez, C.; Luevano, A.N.; Gardner, E.A. Particle-Particle Interactions between Layered Double Hydroxide Nanoparticles. J. Am. Chem. Soc. 2006, 128, 8376–8377. [Google Scholar] [CrossRef]
  52. Zhao, W.; Veerappan Vaithilingam, B.; Ghosh, S.; Li, X.; Geuzebroek, F.; El Nasr, A.S.; Khan, I.; Dara, S.; Mittal, N.; Daoutidis, P.; et al. High-Capacity Regenerable H2S Sorbent for Reducing Sulfur Emissions. Ind. Eng. Chem. Res. 2021, 60, 14779–14787. [Google Scholar] [CrossRef]
  53. Li, J.; Fan, H.; Jia, X. Multilayered ZnO Nanosheets with 3D Porous Architectures: Synthesis and Gas Sensing Application. J. Phys. Chem. C 2010, 114, 14684–14691. [Google Scholar] [CrossRef]
  54. Di Cosimo, J.I.; Díez, V.K.; Xu, M.; Iglesia, E.; Apesteguía, C.R. Structure and Surface and Catalytic Properties of Mg-Al Basic Oxides. J. Catal. 1998, 178, 499–510. [Google Scholar] [CrossRef] [Green Version]
  55. Padmasri, A.H.; Venugopal, A.; Durga Kumari, V.; Rama Rao, K.S.; Kanta Rao, P. Calcined Mg-Al, Mg-Cr and Zn-Al Hydrotalcite Catalysts for Tert-Butylation of Phenol with Iso-Butanol—A Comparative Study. J. Mol. Catal. A Chem. 2002, 188, 255–265. [Google Scholar] [CrossRef]
  56. Bing, W.; Zheng, L.; He, S.; Rao, D.; Xu, M.; Zheng, L.; Wang, B.; Wang, Y.; Wei, M. Insights on Active Sites of CaAl-Hydrotalcite as a High-Performance Solid Base Catalyst toward Aldol Condensation. ACS Catal. 2018, 8, 656–664. [Google Scholar] [CrossRef]
  57. Gilkey, M.J.; Panagiotopoulou, P.; Mironenko, A.V.; Jenness, G.R.; Vlachos, D.G.; Xu, B. Mechanistic Insights into Metal Lewis Acid-Mediated Catalytic Transfer Hydrogenation of Furfural to 2-Methylfuran. ACS Catal. 2015, 5, 3988–3994. [Google Scholar] [CrossRef] [Green Version]
  58. Panagiotopoulou, P.; Martin, N.; Vlachos, D.G. Effect of Hydrogen Donor on Liquid Phase Catalytic Transfer Hydrogenation of Furfural over a Ru/RuO2/C Catalyst. J. Mol. Catal. A Chem. 2014, 392, 223–228. [Google Scholar] [CrossRef]
  59. Mironenko, A.V.; Vlachos, D.G. Conjugation-Driven “Reverse Mars-van Krevelen”-Type Radical Mechanism for Low-Temperature C-O Bond Activation. J. Am. Chem. Soc. 2016, 138, 8104–8113. [Google Scholar] [CrossRef]
  60. He, J.; Schill, L.; Yang, S.; Riisager, A. Catalytic Transfer Hydrogenation of Bio-Based Furfural with NiO Nanoparticles. ACS Sustain. Chem. Eng. 2018, 6, 17220–17229. [Google Scholar] [CrossRef]
  61. Feng, L.; Jiang, S.; Wang, Y.; Huang, J.; Li, C. Catalytic Transfer Hydrogenation of Furfural over CuNi@C Catalyst Prepared from Cu–Ni Metal-Organic Frameworks. Russ. J. Phys. Chem. A 2021, 95, 68–79. [Google Scholar] [CrossRef]
  62. Gilkey, M.J.; Xu, B. Heterogeneous Catalytic Transfer Hydrogenation as an Effective Pathway in Biomass Upgrading. ACS Catal. 2016, 6, 1420–1436. [Google Scholar] [CrossRef]
  63. Puthiaraj, P.; Kim, K.; Ahn, W.S. Catalytic Transfer Hydrogenation of Bio-Based Furfural by Palladium Supported on Nitrogen-Doped Porous Carbon. Catal. Today 2019, 324, 49–58. [Google Scholar] [CrossRef]
  64. García-Sancho, C.; Moreno-Tost, R.; Mérida-Robles, J.M.; Santamaría-González, J.; Jiménez-López, A.; Torres, P.M. Etherification of Glycerol to Polyglycerols over MgAl Mixed Oxides. Catal. Today 2011, 167, 84–90. [Google Scholar] [CrossRef]
  65. Bocanegra, S.A.; Ballarini, A.D.; Scelza, O.A.; de Miguel, S.R. The Influence of the Synthesis Routes of MgAl2O4 on Its Properties and Behavior as Support of Dehydrogenation Catalysts. Mater. Chem. Phys. 2008, 111, 534–541. [Google Scholar] [CrossRef]
  66. Gyngazova, M.S.; Grazia, L.; Lolli, A.; Innocenti, G.; Tabanelli, T.; Mella, M.; Albonetti, S.; Cavani, F. Mechanistic Insights into the Catalytic Transfer Hydrogenation of Furfural with Methanol and Alkaline Earth Oxides. J. Catal. 2019, 372, 61–73. [Google Scholar] [CrossRef]
  67. Chang, X.; Liu, A.F.; Cai, B.; Luo, J.Y.; Pan, H.; Huang, Y.B. Catalytic Transfer Hydrogenation of Furfural to 2-Methylfuran and 2-Methyltetrahydrofuran over Bimetallic Copper–Palladium Catalysts. ChemSusChem 2016, 9, 3330–3337. [Google Scholar] [CrossRef]
  68. Gong, W.; Chen, C.; Fan, R.; Zhang, H.; Wang, G.; Zhao, H. Transfer-Hydrogenation of Furfural and Levulinic Acid over Supported Copper Catalyst. Fuel 2018, 231, 165–171. [Google Scholar] [CrossRef]
  69. Li, X.; Liu, T.; Shao, S.; Yan, J.; Zhang, H.; Cai, Y. Catalytic Transfer Hydrogenation of Biomass-Derived Oxygenated Chemicals over Hydrotalcite-like Copper Catalyst Using Methanol as Hydrogen Donor. Biomass Convers. Biorefinery 2022. [Google Scholar] [CrossRef]
  70. Ramos, R.; Peixoto, A.F.; Arias-Serrano, B.I.; Soares, O.S.G.P.; Pereira, M.F.R.; Kubička, D.; Freire, C. Catalytic Transfer Hydrogenation of Furfural over Co3O4−Al2O3 Hydrotalcite-Derived Catalyst. ChemCatChem 2020, 12, 1467–1475. [Google Scholar] [CrossRef]
  71. Carriazo, D.; Martín, C.; Rives, V. An FT-IR Study of the Adsorption of Isopropanol on Calcined Layered Double Hydroxides Containing Isopolymolybdate. Catal. Today 2007, 126, 153–161. [Google Scholar] [CrossRef]
  72. Martín, C.; Martín, I.; Rives, V.; Grzybowska, B.; Gressel, I. A FTIR Spectroscopy Study of Isopropanol Reactivity on Alkali-Metal-Doped MoO3/TiO2 Catalysts. Spectrochim. Acta Part A Mol. Spectrosc. 1996, 52, 733–740. [Google Scholar] [CrossRef]
  73. Del Arco, M.; Gutiérrez, S.; Martín, C.; Rives, V. FTIR Study of Isopropanol Reactivity on Calcined Layered Double Hydroxides. Phys. Chem. Chem. Phys. 2001, 3, 119–126. [Google Scholar] [CrossRef]
  74. Mavrikakis, M.; Barteau, M.A. Oxygenate Reaction Pathways on Transition Metal Surfaces. J. Mol. Catal. A Chem. 1998, 131, 135–147. [Google Scholar] [CrossRef]
  75. Sitthisa, S.; Sooknoi, T.; Ma, Y.; Balbuena, P.B.; Resasco, D.E. Kinetics and Mechanism of Hydrogenation of Furfural on Cu/SiO2 Catalysts. J. Catal. 2011, 277, 1–13. [Google Scholar] [CrossRef]
  76. Zhang, W.; Zhu, Y.; Niu, S.; Li, Y. A Study of Furfural Decarbonylation on K-Doped Pd/Al2O3 Catalysts. J. Mol. Catal. A Chem. 2011, 335, 71–81. [Google Scholar] [CrossRef]
  77. Ren, Y.; Yang, Y.; Chen, L.; Wang, L.; Shi, Y.; Yin, P.; Wang, W.; Shao, M.; Zhang, X.; Wei, M. Synergetic Effect of Cu0 − Cu+ Derived from Layered Double Hydroxides toward Catalytic Transfer Hydrogenation Reaction. Appl. Catal. B Environ. 2022, 314, 121515. [Google Scholar] [CrossRef]
  78. López-Asensio, R.; Cecilia, J.A.; Jiménez-Gómez, C.P.; García-Sancho, C.; Moreno-Tost, R.; Maireles-Torres, P. Selective Production of Furfuryl Alcohol from Furfural by Catalytic Transfer Hydrogenation over Commercial Aluminas. Appl. Catal. A Gen. 2018, 556, 1–9. [Google Scholar] [CrossRef]
  79. Williamson, G.K.; Hall, W.H. X-Ray Line Broadening from Filed Aluminium and Wolfram. Acta Metall. 1953, 1, 22–31. [Google Scholar] [CrossRef]
Scheme 1. Results and discussion.
Catalysts 13 00045 sch001
Figure 1. XRD patterns of the synthesized hydrotalcites.
Catalysts 13 00045 g001
Figure 2. Thermal analysis of the synthesized hydrotalcites. Thermogravimetric (A), heat flow (B) and DTG plot of the HT-MgAl-x hydrotalcites (C).
Catalysts 13 00045 g002aCatalysts 13 00045 g002b
Figure 3. XRD patterns of the calcined hydrotalcites at 500 °C.
Catalysts 13 00045 g003
Figure 4. (A) N2 isotherms of MgAl mixed oxides; (B) Pore size distribution of MgAl mixed oxides.
Catalysts 13 00045 g004
Figure 5. CO2-TPD of the calcined hydrotalcites.
Catalysts 13 00045 g005
Figure 6. Adsorption of NH3 on the MgAl–3 catalyst followed by FTIR spectroscopy after gas outgassing at different temperatures.
Catalysts 13 00045 g006
Figure 7. Adsorption of CO2 on the MgAl—3 catalyst followed by FTIR spectroscopy after outgassing at different temperatures.
Catalysts 13 00045 g007
Figure 8. Influence of the secondary alcohol in the CTH of FUR to FOL. (A) FUR conversion (full symbols) and FOL yield (open symbols); (B) FOL selectivity. Reaction conditions: 0.1 g of MgAl-3 catalyst, T = 110 °C, Alcohol/FUR molar ratio = 50, FUR/catalyst mass ratio = 1.
Catalysts 13 00045 g008
Figure 9. Influence of the calcination temperature on the catalytic activity of the MgAl-3 catalyst. (A) FUR conversion (full symbols) and FOL yield (open symbols); (B) FOL selectivity. Reaction conditions: 0.1 g of MgAl-3 catalyst, T = 110 °C, i-POH/FUR molar ratio = 50, FUR/catalyst mass ratio = 1.
Catalysts 13 00045 g009
Figure 10. (A) FUR conversion (full symbols) and FOL yield (open symbols) and (B) FOL selectivity for the MgAl-x catalysts. Reaction conditions: 0.1 g of MgAl-x catalyst, T = 110 °C, i-POH/FUR molar ratio = 50, FUR/catalyst mass ratio = 1.
Catalysts 13 00045 g010
Figure 11. Reutilization of the MgAl-x catalysts (A) and reutilization of the MgAl-3 catalyst (B) after thermal treatment at 500 °C between cycles. Reaction conditions: 0.1 g of MgAl-x catalyst, T = 110 °C, i-POH/FUR molar ratio = 50, FUR/catalyst mass ratio = 1.
Catalysts 13 00045 g011
Figure 12. XRD patterns of the MgAl-3 catalyst before the first reaction run and after such cycle and calcination at 500 °C (MgAl-3R).
Catalysts 13 00045 g012
Figure 13. FTIR spectra of adsorbed i-POH on the surface of MgAl–3 catalyst at room temperature and evacuated at different temperatures.
Catalysts 13 00045 g013
Figure 14. FTIR spectra of adsorbed FUR on the surface of MgAl–3 catalyst at room temperature and evacuated at different temperatures.
Catalysts 13 00045 g014
Figure 15. Simultaneous adsorption of i-POH and FUR on MgAl–3 catalyst and evacuated at 150 °C.
Catalysts 13 00045 g015
Figure 16. Influence of the reaction temperature in the catalytic activity of MgAl-1 (A); MgAl-2 (B); MgAl-3 (C); MgAl-4 (D). Reaction conditions: 0.1 g of catalyst, i-POH/FUR molar ratio = 50, FUR/catalyst mass ratio = 1. Legend: FUR conversion (full symbols) and FOL yield (open symbols). Colors: black (90 °C); red (110 °C); green (130 °C) and blue (150 °C).
Catalysts 13 00045 g016
Figure 17. Study of the influence of the i-POH/FUR molar ratio in the activity of MgAl-3 catalyst. (A) FUR conversion (full symbols) and FOL yield (open symbols); (B) FOL selectivity. Reaction conditions: 0.1 g of catalyst, T = 110 °C, FUR/catalyst mass ratio = 1.
Catalysts 13 00045 g017
Figure 18. Study of the influence of MgAl-3 dosage in the catalytic activity. (A) FUR conversion (full symbols) and FOL yield (open symbols); (B) FOL selectivity. Reaction conditions: 0.1 g of catalyst, T = 110 °C, i-POH/FUR ratio = 50.
Catalysts 13 00045 g018
Figure 19. Influence of the presence of water in the catalytic activity of MgAl-3 catalyst. (A) FUR conversion (full symbols) and FOL yield (open symbols); (B) FOL selectivity. Reaction conditions: 0.1 g of catalyst, T = 110 °C, i-POH/FUR ratio = 50.
Catalysts 13 00045 g019
Figure 20. FTIR spectrum of the used catalyst after 6 h of reaction at 150 °C and the co-adsorption of FUR and i-POH in presence of water vapor and outgassing at 150 °C.
Catalysts 13 00045 g020
Table 1. Hydrotalcite cell parameters.
Hydrotalcited(003)
(Å)
c *
(Å)
a *
(Å)
HT-MgAl-17.5923.343.03
HT-MgAl-27.6223.453.04
HT-MgAl-37.8023.143.06
HT-MgAl-47.8022.923.07
* c = 3d(003) and a = 2d(110).
Table 2. Weight losses and temperatures at which they occur from thermogravimetric analysis of hydrotalcites.
Hydrotalcite1er Peak (%)2° Peak (%)3er Peak (%)Total (%)
HT-MgAl-1* 25.4 (186 °C)17.3 (374 °C)-42.7
HT-MgAl-217.4 (180 °C)24.2 (391 °C)4.1 (481 °C)45.7
HT-MgAl-314.9 (146 °C)24.5 (379 °C)5.3 (486 °C)44.7
HT-MgAl-414.8 (102 °C)24.2 (352 °C)5.9 (484 °C)44.9
* This peak is the sum of overlapped peaks and we did not try to deconvoluted it.
Table 3. Textural properties of mixed oxides obtained from hydrotalcites and MgAl-3R.
CatalystBET
(m2/g)
a t-Plot
(m2/g)
Vp
(cm3/g)
dp
(nm)
Basicity
(µmol CO2/g)
MgAl-11810.0448.323.6
MgAl-23910.0887.957.2
MgAl-3139190.2658.2117.4
MgAl-420590.57510.3146.7
MgAl-3R b16030.0795.7
a t-plot: microporosity data obtained by the t-plot method; b MgAl-3 catalyst after first reaction cycle and calcination at 500 °C.
Table 4. Surface chemical composition of MgAl-x catalysts.
CatalystC
(%)
O
(%)
Mg
(%)
Al
(%)
Mg/Al
Surface Atomic Ratio
MgAl-11.267.815.1315.870.95
MgAl-24.2565.3719.6110.771.82
MgAl-39.5265.1918.606.682.78
MgAl-42.0365.5526.665.764.62
Table 5. Surface characterization of MgAl-x catalysts by means of XPS.
CatalystC1s
(eV)
O1s
(eV)
Mg2p
(eV)
Al2p
(eV)
MgAl-1284.6 (55.7%)
290.0 (44.3%)
530.4 (66.0%)
532.0 (34.0%)
49.873.9
MgAl-2284.7 (71.4%)
289.7 (28.6%)
530.4 (79.4%)
532.3 (20.6%)
49.673.8
MgAl-3285.2 (60.9%)
289.3 (39.1%)
530.6 (94.7%)
531.9 (5.3%)
49.974.2
MgAl-4284.8 (63.4%)
289.3 (36.6%)
529.9 (45.9%)
531.6 (54.1%)
49.373.7
Table 6. Surface characterization of MgAl-3 catalysts after the first catalytic cycle and calcination at 500 °C by means of XPS.
CatalystC1s
(eV)
O1s
(eV)
Mg2p
(eV)
Al2p
(eV)
Mg/Al
Surface Atomic Ratio
MgAl-3284.7 (56.4%)
285.8 (18.8%)
288.4 (24.8%)
530.1 (53.7%)
531.7 (46.3%)
49.5 (92.7%)
50.8 (7.3%)
73.8 (95.6%)
75.5 (4.4%)
2.31
Disclaimer/Publisher’s Note: The statements, opinions and data contained in all publications are solely those of the individual author(s) and contributor(s) and not of MDPI and/or the editor(s). MDPI and/or the editor(s) disclaim responsibility for any injury to people or property resulting from any ideas, methods, instructions or products referred to in the content.