Article

Preparation of Fenton Catalysts for Water Treatment

1
College of Chemistry, Beijing University of Chemical Technology, Beijing 100029, China
2
Analysis and Test Center, Beijing University of Chemical Technology, Beijing 100029, China
*
Author to whom correspondence should be addressed.
Catalysts 2023, 13(11), 1407; https://doi.org/10.3390/catal13111407
Submission received: 18 August 2023 / Revised: 12 October 2023 / Accepted: 20 October 2023 / Published: 30 October 2023
(This article belongs to the Topic Fabrication of Hybrid Materials for Catalysis)

Abstract

:
In the heterogeneous Fenton reaction, a solid catalyst reacts with H2O2 to generate highly oxidizing free radicals, that degrade organic pollutants in aqueous solutions. In this study, impregnation calcination was used to modify activated carbon and load it with various metal compounds. The synergistic catalysis of the various metal compounds showed improved catalytic activity, and the prepared heterogeneous Fenton catalyst exhibited high catalytic activity, a wide pH range, and good stability. The concentration ratios of the Fenton catalyst impregnation solutions-were as follows: Fe3+, Cu2+, Mn2+, and Ce3+ at 0.45, 0.72, 0.19, and 0.11 mol/L, respectively. The optimal sintering temperature of AC impregnation was determined through TGA/DSC, SEM, SEM-EDS, XPS, and XRD testing. At a final calcination temperature of 900 °C, the degradation efficiency of 10 ppm methylene blue reached 98.25% at pH 5 with 5 mM H2O2. After ten soaking cycles, the degradation efficiency exceeded 90%. The structure and performance of the catalysts were characterized using EPR, BET, ICP, and UV spectroscopy, demonstrating the excellent performance of the catalyst and providing an improved treatment plan for solving wastewater problems.

1. Introduction

The continuous societal development and industrial modernization has resulted in an increased discharge of industrial wastewater, thereby polluting water bodies and causing water shortages. Water pollution severely restricts economic and societal development [1,2,3,4,5]. Sewage is complex because it contains various toxic substances, and is difficult to degrade. If the sewage is discharged without treatment, it can damage the environment and endanger human health. Therefore, developing an efficient, biodegradable, and environment-friendly sewage treatment methods is crucial. To treat the organic compounds industial wastewater, which are difficult to degrade, various chemical, physical, and biological methodsare commonly used [6,7]. In particular, attention has been paid to the development of solar-driven catalytic technologies and other emerging processes, such as microwave assisted catalysis, plasma-catalytic processes, and biocatalytic remediation [8]. Bahnemann et al. used TiO2 photocatalysis to transform aromatic water pollutants into fuels [9]. They used a dual-function system of B/N-graphene-coated Cu/TiO2 as a photocatalyst to convert the organic pollutants into hydrogen for waste recycling [10]. A comprehensive review of the literature on solving organic pollution problems through Fenton reaction and related process experiments [11]. These methods generate strong oxidizing free radicals to degrade pollutants. Therefore, the Fenton method, used in advanced wastewater oxidation processes, is effective and environment friendly [12,13,14]. In the Fenton catalytic oxidation water treatment method, the released metal ions catalyze the generation of hydroxyl radicals from H2O2 with high activity, low cost, and mild conditions. However, the traditional Fenton reaction has many limitations, including the necessity for acidic environments, formation of iron sludge, and introduction of excess chemicals [15]. Heterogeneous Fenton catalysis solves the above problems by imparting a wide range of degradable pH values, reduced production of metal sludge, multiple sustainable degradation pathways, and maintenance of high degradation efficiency.
Fenton’s reagents, H2O2 and Fe2+/Fe3+, are powerful sources of hydroxyl radicals [16]. The reaction between Fe2+ and H2O2 generates hydroxyl radicals (Equation (1)), and Fe3+ reacts with H2O2 to regenerate Fe2+, thereby prolonging the Fenton reaction [17] (Equations (2) and (3)).
Fe2+ + H2O2 → Fe3+ + OH + ⋅OH
Fe3+ + H2O2 ⇔ Fe(OOH)2+ + H+
Fe(OOH)2+ → Fe2+ + ⋅OOH
Fenton catalysts can be classified as either homogeneous or heterogeneous. In the homogeneous Fenton process, Fe2+ and H2O2 undergo a homogeneous reaction in the solution to produce reactive oxygen species. In the heterogeneous Fenton process, iron or other metal ions are loaded onto carrier substrates as catalysts, and heterogeneous reactions occur on the surface to generate free radicals [18,19]. Owing to the drawbacks of homogeneous Fenton catalysis, including the production of a large amount of metal sludge, narrow pH range, and difficult recycling, heterogeneous Fenton catalysis is commonly used to improve the stability, dispersion, and ability of catalysts to adsorb pollutants. Fenton catalyst carriers are usually porous materials with large specific surface areas and high stabilities, such as alumina, activated carbon [20], diatomaceous earth [21], and kaolin [22].
Catalysts supported by multiple metals can achieve synergistic catalysis and improved catalytic efficiency. The active metal is the basis for improving catalyst performance and determining the reaction rate and direction [23]. Equation (4) describes the concerted copper and ferric reactions that generate the effective catalytic components.
Fe3+ + Cu+/e → Cu2+ + Fe2+
To improve the synergistic catalysis efficiency, researchers have introduced transition metals (including Cu and Mn) and rare earth elements (such as Ce) into iron-based materials, resulting in improved catalytic activities [24,25]. The experimental equations for the synergistic catalytic degradation of Fe and Ce are as follows:
≡ Fe2+ + H2O2 → ≡ Fe3+ + ⋅OH + OH
≡ Fe3+ + H2O2 → ≡ Fe2+ + ⋅OOH + H+
≡ Ce3+ + H2O2 → ≡ Ce4+ + ⋅OH + OH
≡ Ce4+ + H2O2 → ≡ Ce3+ + ⋅OOH + H+
≡ Ce4+ + ≡ Fe2+ → ≡ Ce3+ + ≡ Fe3+
MB + ·OH → CO2 + H2O + byproducts
The standard oxidation reduction potential of Ce4+/Ce3+ and Fe3+/Fe2+ is 1.44 and 0.77 V, respectively. Therefore, the electron transfer from Fe2+ to Ce4+ is thermodynamically advantageous. The generated Ce3+ can further react with H2O2 to generate ·OH. Therefore, this reaction system can stably provide Fe2+ and Ce3+ for H2O2 decomposition, generating additional ·OH for methylene blue (MB) oxidation [26]. Synergistic catalysis involves two metal ions and produces excess ·OH, which efficiently degrades pollutants.
In this study, we used activated carbon (AC) as a carrier and loaded it with Fe, Cu, Mn, and Ce to prepare Fenton catalysts. Further, using MB as a model pollutant, we studied the degradation performance of the Fenton catalysts, and expored their catalytic degradation efficiency at different pH values, H2O2 concentrations, calcination temperatures, and metal impregnation ratios to determine the optimal solution for the degradation of organic pollutants (especially dyes) in water.

2. Results and Discussion

2.1. Catalyst Characterization

2.1.1. Thermal Analysis

The Fenton catalyst is obtained through impregnation and sintering treatments, therefore, studying the thermal behavior of the impregnated AC can guide the sintering process conditions of the catalyst. Figure 1 shows the thermal gravimetric analysis (TGA) and differential scanning calorimetry (DSC) curves of AC impregnation under nitrogen atmosphere conditions at a heating rate of 10 °C per minute.
Before 250 °C on the TGA curve, there is approximately 15% weight loss, which could be attributed to the loss of physically adsorbed water in the AC and crystalline water of inorganic salts. In contrast to DSC, the endothermic peak at 105 °C is caused by the loss of physically adsorbed water in the impregnated AC, while that at 241 °C is due to the decomposition of crystalline water and some inorganic salts in the impregnated AC. At 500, 600, and 700 °C, the weight loss of the impregnated AC is insignificant, indicating that during the catalyst formation process, inorganic salts decomposed into oxides, and then reduced to metals. Moreover, there was no significant weight change. However, there is a significant weight loss at 800 and 900 °C, indicating that this process is accompanied by the reduction of oxides to metals and the loss of AC to C, enhancing the metal reduction. Between 900–1000 °C, there is a weight loss of about 2% in TGA, indicating that a large amount of AC undergoes decomposition. Even with inert gas protection, the stability of AC is challenged, causing a considerably high sintering stability at 1000 °C. Therefore, the TGA and DSC analysis results indicated that the optimal sintering temperature for impregnating AC should be between 800–900 °C.

2.1.2. Surface Morphology

Figure 2 shows SEM images of the AC before and after loading, whereas Figure 2A shows the uneven surface of the unloaded AC with many pores. Figure 2B shows that there are many particles of different shapes and sizes on the surface of AC after loading the catalyst that was sintered at 900 °C. The particle size distribution of the spherical particles was narrow, and the catalyst particles were embedded on the surface of the AC to form a stable catalyst system.
Figure 3 shows SEM images of the metal-salt-loaded AC at different sintering temperatures. Two photos with different magnifications (1000 and 20,000) are provided for the samples prepared at each sintering temperature of 500, 600, 700, 800, 900, and 1000 °C. At 500 and 600 °C in Figure 3, the particles are relatively small with regular morphology. Large particles appeared at 700 °C sintering, within this temperature range, small particles of inorganic salts begin to decompose and aggregate into large particles. At 800 °C, after the decomposition of inorganic salt particles, they are further reduced to form spherical metal alloy particles, with a narrow particle size distribution of approximately 200 nm. The particle size obtained at 900 and 1000 °C was slightly larger than that at 800 °C. At 1000 °C, the large spherical particles approximately 1 μm in size were formed. As the sintering temperature increased, small particles gradually formed on the AC surface, and the particle size gradually increased. During sintering, the metal compounds gradually transformed from an ionic state to a metallic state, and from small particles to large particles with increasing sintering temperatures. According to the chemical properties of metal nitrate compounds, transformation into oxidation state or metallic state occurs only above 700 °C. However, as the sintering temperature increased further, the small particles gradually melted into larger particles, as shown in Figure 3.

2.1.3. Surface Element Composition

Figure 4 shows the SEM-EDS curves of the blank AC, impregnated AC, and the catalysts prepared at the different sintering temperatures. Table 1 shows the average weight content ratios of the selected elements of the catalyst after five tests of blank AC, impregnated AC, and different sintering temperatures using SEM-EDS analysis, please also check Supplementary Materials. The blank AC contained mainly C, a small amount of O, and a large amount of impurity elements, such as Si, Al, S, Ca, Fe, etc. Iron salts and other substances were impregnated onto the surface of AC, and as the sintering temperature increased, the inorganic salts began to decompose. When the temperature reached 700 °C, the peak of O element decreased, while that of C element increased, this indicated that inorganic salts begin to transform into metal elements or alloys. At 800 and 900 °C, the relative ratios of C and O elements hardly changed, and the relative contents of catalyst elements Fe, Mn, Cu, and Ce remained unchanged. When the temperature reached 1000 °C, the content of C element was higher, while that of Fe, Mn, Cu, and Ce elements, playing a catalytic role decreased, this indicated that as the sintering temperature increased, the catalyst particles may migrate towards the interior of AC. The SEM-EDS analysis results indicate that the optimal sintering temperatures for the catalyst are 800 °C and 900 °C based on the presence of elements.
Figure 5 shows the elemental surface distribution of the catalyst prepared at a calcination temperature of 900 °C through SEM-EDS. The surface elemental distribution showed that all elements were almost evenly distributed on the surface of the catalyst, with only a small amount of Fe and Cu exhibiting an aggregated state. A small amount of Mn exhibited agglomeration, whereas Ce did not.

2.1.4. Catalyst Specific Surface Areas

The specific surface area of the catalyst is closely related to its catalytic activity. Changes in the specific surface area and adsorption–desorption isotherms before and after AC loading were studied experimentally. Figure 6 shows the adsorption–desorption isotherm curves and related characteristics of the AC before and after catalyst loading. The AC was soaked in solutions containing 0.45 mol/L Fe(NO3)3, 0.72 mol/L Cu(NO3)2, 0.16 mol/L Mn(NO3)2, and 0.11 mol/L Ce(NO3)3. The AC was then dried and sintered at 900 °C. The adsorption–desorption isotherms of the samples were similar to those of the original AC, indicating that the catalyst preparation did not affect the AC structure.
Table 2 lists the specific surface areas of the AC before and after loading. According to the BET test results, the specific surface area increased slightly with the loading of metal elements on the AC surface, indicating that the loading of metal elements had little effect on the AC main structure. The specific surface area of the catalyst increased lightly after the introduction of metallic particles because the specific surface area of the AC carrier was already large.

2.1.5. XRD of the Prepared Catalysts

The phases in the synthesized samples were analyzed using XRD with Cu Kα radiation at a scan rate of 5°/min in the 2θ range 3–90°. The XRD patterns of the catalysts sintered at different temperatures are shown in Figure 7. The XRD spectra show no obvious diffraction peaks at 500 and 600 °C, indicating that at low temperatures the metal salt particles impregnated onto the surface of AC are small. When the sintering temperature reached 700 °C, a weak diffraction peak was observed in the XRD pattern, indicating the formation of metal particles. The XRD diffraction peak gradually increased from 800 to 1000 °C. As the sintering temperature increased, the metal particle size increased and the diffraction peaks of the metal crystal strengthened. However, larger particles were formed after sintering at 1000 °C and the metal or oxide particles became excessively aggregated, thus, the contact area between active sites and reaction solution was reduced, which caused a decrease in catalytic activity. Qualitative analysis was conducted on the diffraction peaks that appeared near 43.3°, 50.4°, and 74.6°, consistent with the standard XRD diffraction peaks of Fe–C (ICDD, 23-0298) and Cu (ICDD, 01-1241), indicating the presence of these alloy or metal single-crystal structures in the catalyst.
During sintering, the addition of Fe and Cu was relatively high, and with increasing sintering temperature, the corresponding alloys were formed. However, the addition of Mn and Ce was lower, and the XRD pattern showed no obvious diffraction peaks, indicating uniform dispersion of these elements without agglomeration. Therefore, based on the XRD results, Fe, Cu, Mn, and Ce were stably loaded onto AC to form efficient and stable catalysts, the calcination temperature should be between 800 and 900 °C.

2.1.6. XPS of the Prepared Catalysts

The XPS detection conditions include a spot size of 500 µm at Monochromated Al Kα 150 W, with the survey energy of 200 eV and high resolution scans of 30 eV. Figure 8 shows the XPS spectra of the AC loaded Fe, Cu, Ce, and Mn catalysts after calcined at 900 °C. According to the analysis of the various element spectra, Fe exhibited two strong absorption peaks at 706.7 and 719.9 eV, indicating the presence of Fe 2p3/2 and Fe 2p1/2, and the absorption peaks correspond to Fe2+ and Fe3+ valences after the peak splitting treatment at 709.6 and 710.8 eV. The peaks at 706.7 eV are clearly asymmetric, indicating that Fe is transformed into its atomic state. The satellite peaks indicated that Fe was loaded onto the AC surface in the Fe2O3 and Fe3O4 form. Cu exhibits two strong absorption peaks at 932.6 and 952.2 eV, indicating the presence of Cu 2p3/2 and Cu 2p1/2. In addition, other peaks at 932.6, 932.4, and 933.6 eV, indicated that Cu mainly existed in the form of Cu0, Cu1+, and Cu2+, with a more intense peak at 932.6 eV compared to that at 933.6 eV, indicating that most of Cu was atomized. The presence of Cu1+ at 932.4 eV promotes the formation of hydroxyl radicals and improves the degradation efficiency. Similar to the findings in reference [27,28,29], Cu1+ exhibits high chemical activity.
In the 3d orbital spectrum of Ce, Ce 3d5/2 was located at 882, 884, and 916.7 eV, corresponding to Ce4+, while Ce 3d3/2 was located at 902 eV, corresponding to Ce3+. The Ce4+ and Ce3+ contents on the surface are similar to the peak areas, as Figure 8 shows. The presence of both ions was conducive to mutual conversion, thereby generating more hydroxyl radicals on the catalyst surface and improving the catalytic degradation performance. Two main peaks were observed in the Mn orbital spectrum, Mn 2p3/2 at 642.1 eV and Mn 2p1/2 at 653.7 eV. The binding energies of these two peaks corresponded to Mn4+ and Mn3+ at 642.1 and 653.7 eV respectively, with a small absorption peak at 638.7 eV arising from atomic Mn (Figure 8). Mn2+ at 641.0 eV and Mn4+ at 641.6 eV combined to form a broad peak area at 640–650 eV, indicating that the surface Mn was mainly composed of Mn4+ and Mn2+. Thus, the surface contained mainly MnO2 and MnO, accompanied by a small amount of Mn2O3.
Figure 9 shows the XPS profiles of the AC-supported catalysts calcined at different temperatures. The ion binding energies of Fe, Cu, Ce, and Mn gradually decreased with increasing calcination temperature, which is conducive to metal ion atomization. The binding energy of Fe mainly arose from the Fe+3 and Fe+2 valence at 710.8 and 709.6 eV, respectively. The binding energy corresponding to the wave peak in the XPS spectrum was similar to that of atomic Fe at 706.7 eV with increasing calcination temperature, indicating that the valence decreased to atomic Fe during high-temperature calcination. As the calcination temperature increased, the binding energy of the Cu peak approached that of the Cu atom at 932.6 eV. The binding energy of Ce in the XPS diagram shows little change with increasing calcination temperature, remaining mostly in the +4 and +3 states, indicating that Ce can be loaded onto the AC surface in the form of alloys containing other metals [30]. The addition of Ce changed the material morphology, accelerated the electron transfer in the reaction system, promoted the synergistic effect between Fe2+ and Ce4+, and improved the catalytic activity [31]. The XPS spectrum of Mn did not show significant changes with different calcination temperatures, and Mn existed i +4 and +2 valence states. Mn2+ reacts with H2O2 to generate hydroxyl radicals, thereby improving the catalytic efficiency. Mn doping also promotes the recombination of H2O2 and Ce sites on the catalyst surface and can be used as a repository to receive and release electrons, thereby promoting electron transfer between Ce and H2O2 [32]. However, the XPS absorption strength of each metal decreases at sintering 1000 °C, owing to particle migration into the AC because of the high temperature. XPS testing revealed that the sample penetrated to a depth of only 5 nm. The catalyst particles migrated into inner AC or the agglomeration of metal compound particles, and the test area contained fewer metal particles, hence the degradation efficiency at 1000 °C decreased compared to that at 900 °C.

2.2. Types of Impregnated Metals

When the sintering temperature of metal supported AC catalyst was 900 °C, the degradation rate of a fixed amount of catalyst to a certain concentration of MB is used to measure the catalytic efficiency. Figure 10 shows the MB degradation efficiency of different types of metal-loaded AC catalysts (MB remove rate = (A0 − A)/A0, A0 is the absorbance before irradiation, and A is the absorbance after irradiation). From the degradation curve shown in Figure 10, the degradation rates of the catalysts for 10 mg/L MB in 5 mM H2O2 were as follows: AC-loaded Fe/Cu/Mn/Ce > AC-loaded Fe/Cu/Ce > AC-loaded Fe/Cu > AC-loaded Fe > AC, indicating that Fe, Cu, Mn, and Ce have catalytic degradation activities. however, the catalytic abilities of different metal catalysts differ, and the combination of multiple metals produces a synergistic catalytic effect. Owing to the presence of a small amount of impurity metals, such as Fe, in AC, pure AC also exhibited a certain degree of degradation, but with low efficiency. Efficient catalysts were prepared by loading the mixed metals such as Fe, Cu, Mn and Ce.

2.3. Impregnated Metal Ratio and Concentration

2.3.1. Effect of Fe and Cu on Catalyst Activity

Degradation experiments on the catalysts prepared with different ratios of Fe and Cu are shown in Figure 11, and the corresponding Fe and Cu data are shown in Table 3. The performances of the catalysts prepared with Fe: Cu ratios of 7, 8, and 9 (Figure 11) were significantly higher than those of the other six groups. The times required for catalytic degradation in the three high performing groups were similar, indicating that the Fe ratio was the main factor controlling the catalyst performance. The catalytic performance of group 7 was the best with impregnation solution conditions of 0.45 mol/L Fe3+ and 0.72 mol/L Cu2+. Table 3 lists the ion concentrations of the impregnation solutions with different ratios of Fe and Cu in a 20 mL solution with 12 g of dried AC.

2.3.2. Effect of Ce on Catalyst Activity

At preparation conditions of 0.45 mol/L Fe3+ and 0.72 mol/L Cu2+, the MB degradation efficiency was tested further by adding Ce3+ of the same volume and different concentrations (see Figure 12). With increasing Ce3+ concentration, the MB removal rate gradually increased. At 0.11 mol/L Ce3+, the MB removal rate peaked and further increasing the concentration had little effect on the removal rate. Therefore, the concentration of 0.11 mol/L Ce3+ was chosen as the optimal immersion concentration.

2.3.3. Effect of Mn on Catalyst Activity

With a starting solution of 0.45 mol/L Fe3+, 0.72 mol/L Cu2+, and 0.11 mol/L Ce3+, the same volume of Mn2+ with different concentrations was tested to prepare the metal supported AC catalyst and its MB removal rate studied. Figure 13 shows that the MB removal rate gradually increased with increasing Mn2+ concentration. At 0.16 mol/L Mn2+, the MB removal rate remained largely unchanged with further concentration increases. Therefore, 0.16 mol/L Mn2+ was selected as the optimal immersion solution concentration.

2.4. Effect of Solution pH on Catalytic Activity

Under solution conditions of 10 mg/L MB and 5 mM H2O2, 10 mL solutions with different pH values were prepared and 0.1 g catalyst was added. The mixture was then placed under a xenon lamp and the time required for complete degradation of MB was recorded. Figure 14 shows the time required for the complete MB degradation at different pH values. Lower pH values induced faster catalytic reaction rates and the catalytic activity was very low at pH 6, consistent with a previous report [33].
The catalyst (0.1 g) was placed in a 10 mL solution with different pH values. The concentrations of Fe, Cu, Mn, and Ce dissolved from the catalyst in the solution were measured by ICP-MS after immersion for 60 min. Figure 15 shows the concentration curves of the metal ions dissolved by the catalyst at different pH values. A lower pH resulted in higher metal ion dissolution rates, while a higher pH decreased the degradation ability. Therefore, to balance the catalytic efficiency and stability, a pH of 5 is recommended.

2.5. Effect of Calcination Temperature on Catalyst Activity

The catalysts prepared at different calcination temperatures catalyzed the MB degradation for 30 min, and the MB removal rate gradually increased with increasing calcination temperature, as Figure 16 shows, The MB removal rate peaked, when the calcination temperature was 900 °C, and decreased at 1000 °C. At low calcination temperatures, the catalytic degradation efficiency decreases because the various metal salts impregnated on the AC surface cannot be completely reduced to form a stable alloy or oxidation state. In addition, the catalyst particles on the AC surface were not firmly bound, resulting in poor stability and ineffectiveness during catalytic degradation. Aggregation of the active components occurred at excessive sintering temperatures, decreasing the degradation efficiency. Therefore, to ensure the structural stability and catalytic activity, the optimal sintering temperature was determined to be between 800 and 900 °C.

2.6. Effect of H2O2 Concentration on MB Degradation

H2O2 plays an important role in the Fenton catalytic degradation, and Figure 17 shows the influence of its concentration on MB degradation. Concentrations ranging from 1 mM to 20 mM were tested, and the degradation efficiency of the 5 mM H2O2 condition was the highest. The difference between the 1 mM and 10 mM H2O2 conditions was insignificant, however, the degradation efficiency decreased as the H2O2 concentration in the solution increased. This is because as the H2O2 concentration increased, excess H2O2 combines with ·OH, resulting in a decrease in the active substances in solution and decreased degradation efficiency. These findings were consistent with a previous report [7]. Therefore, 5 mM H2O2 was selected as the standard conditions for optimal degradation.

2.7. Electron Paramagnetic Resonance Analysis

Six sets of the EPR analysis experiments were compared to intuitively study the catalytic degradation performance of the catalyst and determine the catalytic degradation mechanism of Fenton catalyst as Figure 18 shows. Figure 18A shows the production of free radicals with H2O2, without light and at different lighting times, with no free radical production without light. Figure 18B shows the free radical production of AC with H2O2 and without different lighting times. AC could not be produced the free radical without light. Figure 18C,D show the free radical production of AC under calcination at 500 °C and 900 °C without light and different lighting times, respectively. The loaded AC also produces a small amount of free radicals without light, but the amount of free radical production significantly increased with an extension of lighting time. Figure 18E compares the free radical production of H2O2, AC + H2O2, the impregnated AC sintering 500 °C + H2O2, and 900 °C + H2O2 under the same lighting conditions. Although free radicals are produced, the signal of free radicals is constantly increasing, and those produced by the impregnated AC sintering 900 °C are significantly increased, indicating that the catalytic activity of the impregnated AC sintering 900 °C is higher. Figure 18F shows the EPR plot obtained under no-light conditions. H2O2 and H2O2 + AC do not produce free radicals in the dark environment, whereas the sintered AC after loading can. However, the production rate is not high indicating that the prepared catalyst has catalytic degradation ability, even in the dark environment, which is more conducive to the degradation of pollutants. The results in Figure 18A–D show that the signal intensity of free radicals increases with the increase of illumination time, indicating that illumination is beneficial for the generation of free radicals, and that the signal intensity of free radicals generated by the catalyst after loading significantly increases.

2.8. Catalyst Stability

The repeated and efficient use of a catalyst is an important indicator of its stability. After soaking the catalyst in at pH 5 solution system for 60 min, MB was degraded. Table 4 lists the relationship between the number of immersions and the MB degradation rate at same conditons. The highest degradation efficiency was achieved after the first soaking step, 97.93%. Although the degradation efficiency of MB decreased after each soaking cycle, it remained >90% after ten soaking cycles, indicating that the synthetic catalyst exhibited good stability. The stability of the catalyst in water can also be inferred that the catalyst particles may exist in the form of alloys or oxides. The high stability of this catalyst provides foundation for its future industrial applications.

3. Experimental

3.1. Reagents and Instruments

The compounds used for the catalyst synthesis and MB degradation were all analytically pure reagents, as listed in Table 5. The related instruments and equipment are listed in Table 6.

3.2. Catalyst Preparation

Different masses of Fe(NO3)3·9H2O and Cu(NO3)2·3H2O were added to various volumes of 0.5 mol/L Ce(NO3)3 and 0.7 mol/L Mn(NO3)2 solutions. Subsequently, deionized water was added to prepare a 20 mL solution. Then, 12 g of the dried AC carrier was added to the mixed solution, immersed in an ultrasonic bath for 30 min, and allowed to stand overnight. The impregnated activated carbon was then filtered and baked in an oven at 110 °C for 10 h until the moisture in the AC has completely evaporated. The dried AC-loaded catalyst was placed in a tube furnace under nitrogen protection for different sintering temperatures to obtain the catalysts loaded with Fe, Cu, Mn, and Ce.
The scanning electron microscopy (SEM) was used to study the morphology of the catalyst surface, the scanning electron microscopy-–energy dispersive spectrum (SEM-EDS) was used to study the elemental composition and distribution on the catalyst surface, the X-ray diffraction (XRD) was used to study the crystallization status of the catalyst, the X-ray photoelectron spectroscopy (XPS) was used to study the valence states of the catalyst surface elements, and Brunauer-Emmett-Teller (BET) was used to study the specific surface area of the catalyst.

3.3. Fenton Catalytic Experiment

0.1 g of catalyst is added to 10 mL of 10 mg/L MB solution with pH = 5, and 5 mM H2O2. The catalytic reaction was performed under the irradiation of a 35 watts of xenon lamp (note: xenon lamp is used to simulate the irradiation of sunlight), and then detected the content of MB with a spectrophotometer to determine the degree of degradation.

4. Conclusions

With societal development, water pollution has become a critical problem and has peaked the research interest on sewage treatment. While some of the proposed solutions have high sewage treatment cost or difficult and complex catalyst preparation methods, others have low reuse rates. However, the catalyst preparation method is simple and reusable, has high catalytic efficiency, has a long service life, and is easy to implement for industrial use.
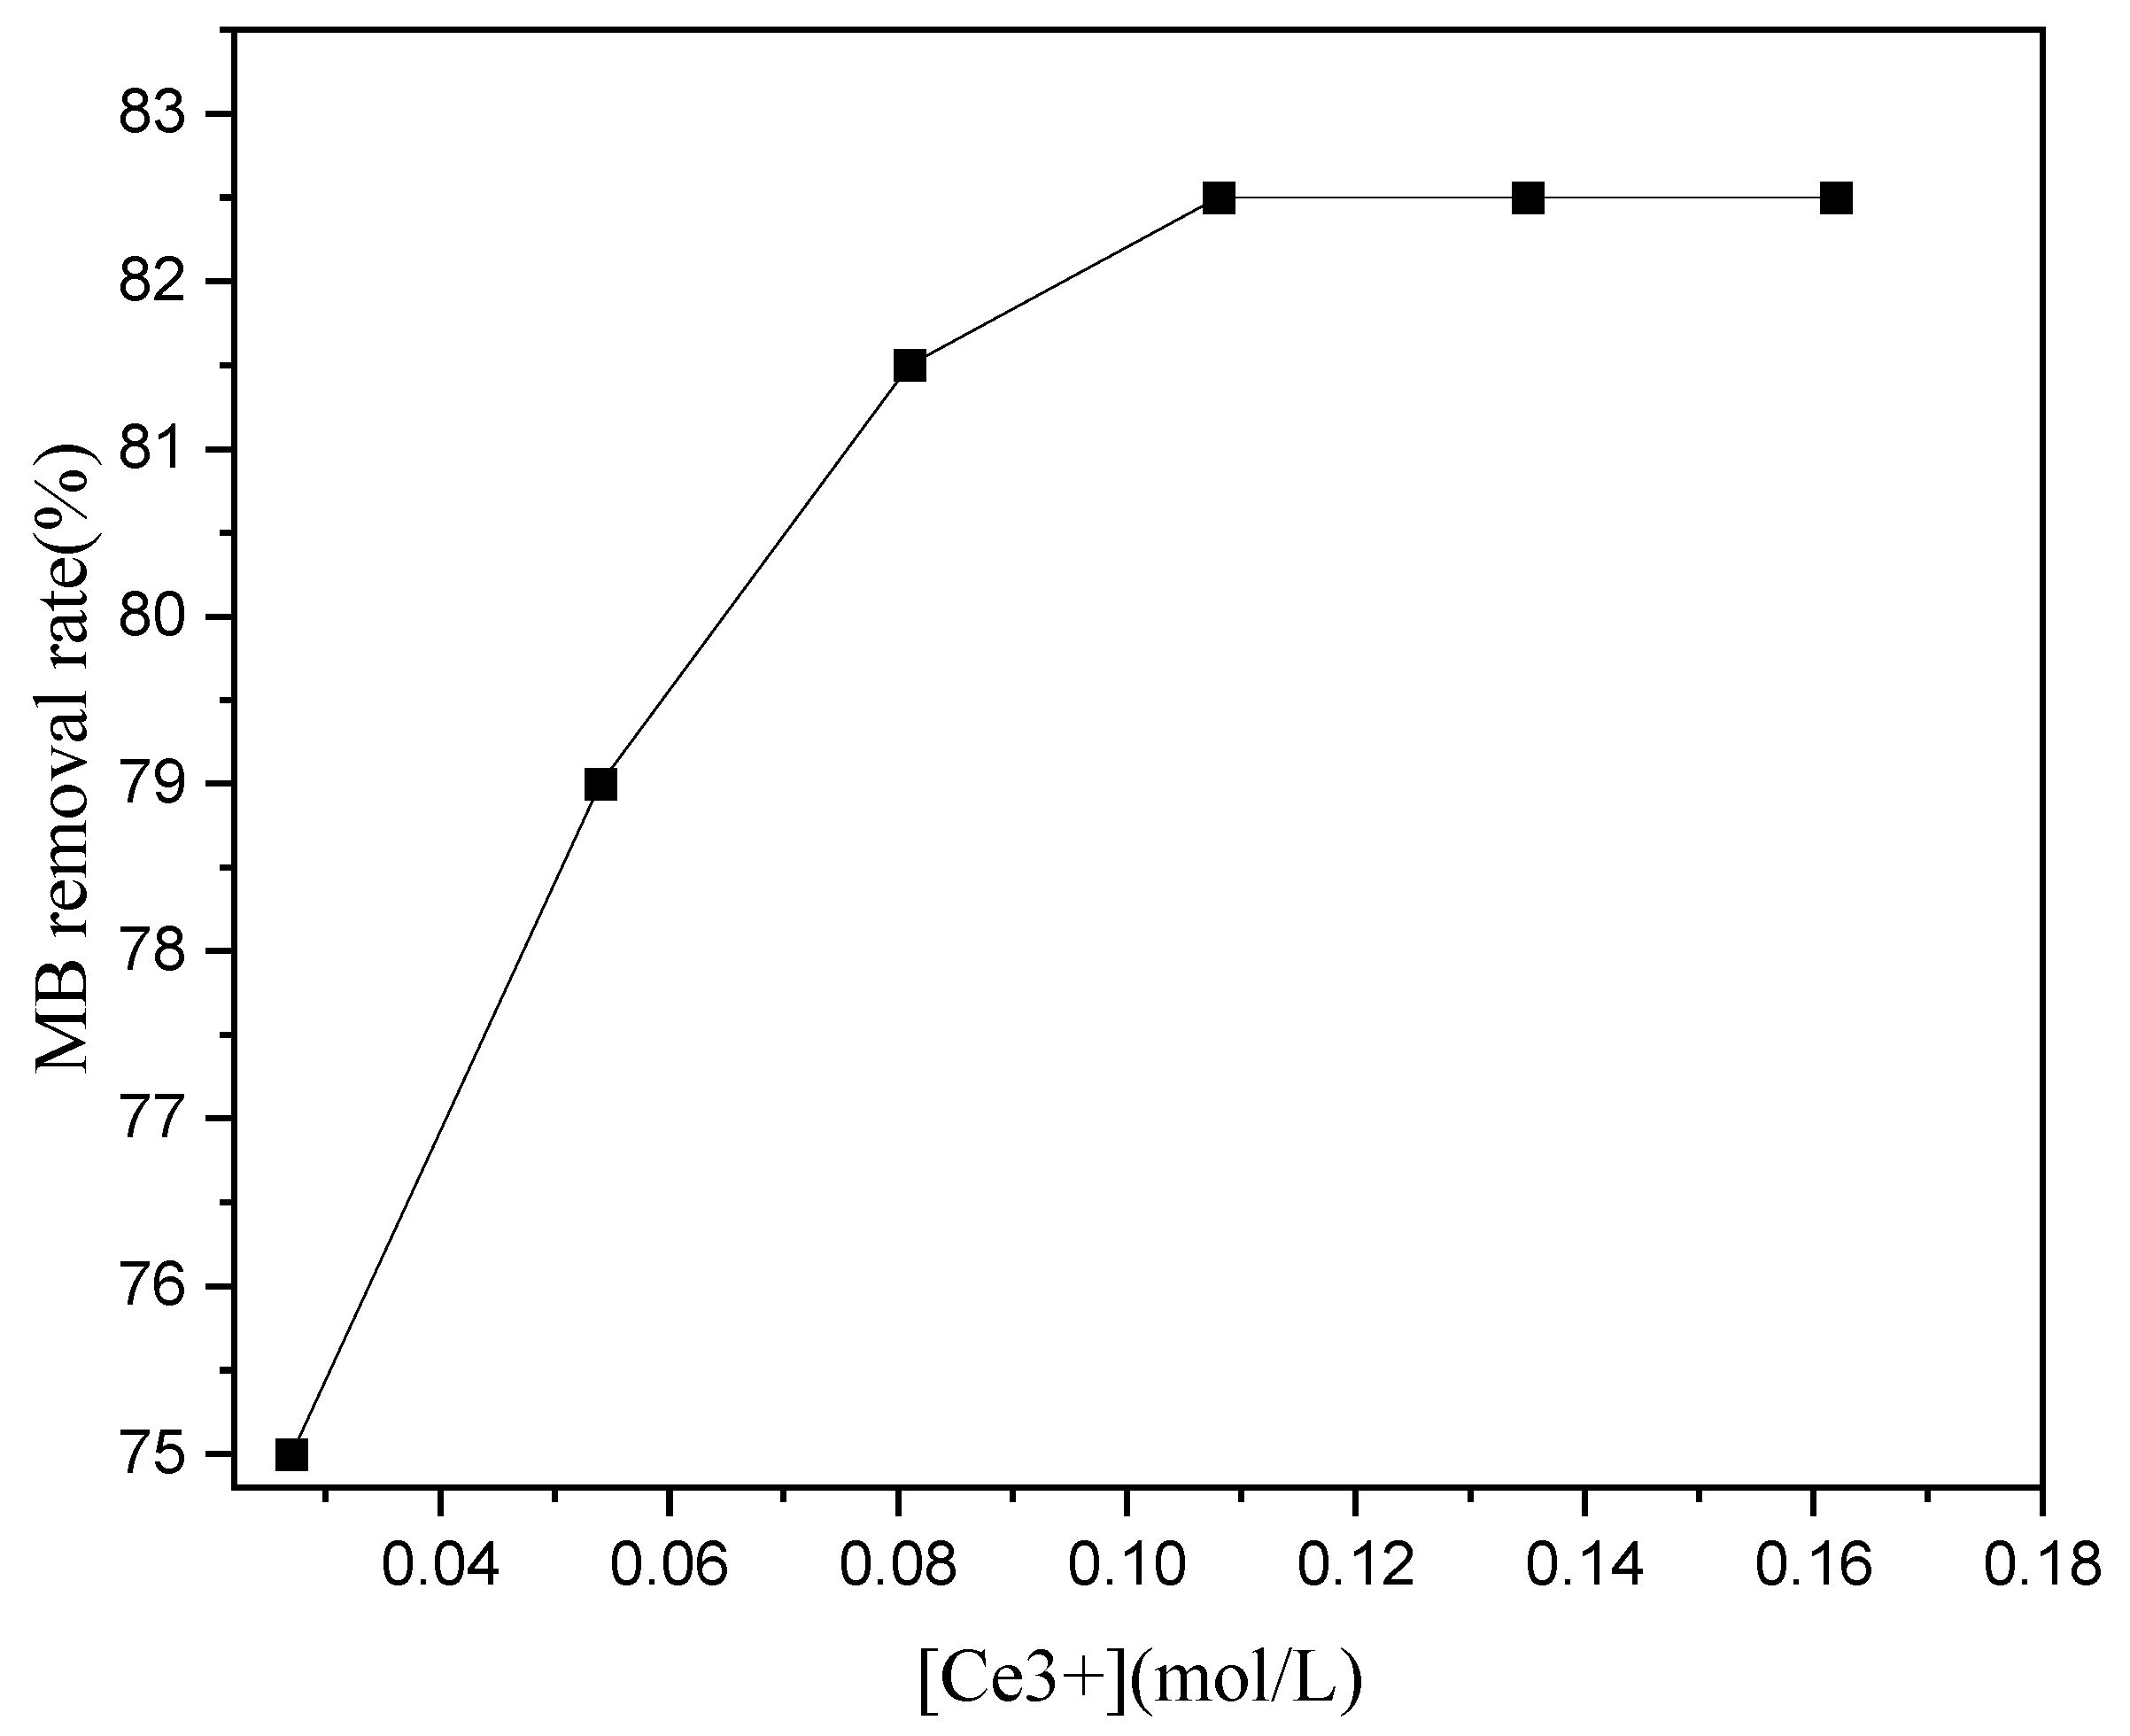
The thermal weight loss of the AC impregnation at different sintering temperatures was studied through TGA/DSC. At low sintering temperatures, the metal salts loaded onto the AC did not fully decompose and could not form metals or alloy particles. However, when the sintering temperature is excessive, the metal or alloy particles of the catalyst fuse into large particles and the catalytic efficiency decreases. XRD, SEM and SEM-EDS analysis showed that the catalyst particles on the AC were mostly alloys, laying the foundation for multi-metal synergistic catalysis. We used XPS to study the activity of the catalyst based on the electron binding energies of the atoms. The EPR analysis has shown that sufficient light is the optimal solution for accelerating the Fenton catalytic degradation. The porous structure of the AC was not affected by catalyst loading and the catalyst particles fully utilized the large specific surface area of the AC carrier. The optimal impregnation solution for preparation of the Fenton heterogeneous catalyst was as follows: 0.45 mol/L Fe3+, 0.72 mol/L Cu2+, 0.16 mol/L Mn2+, and 0.11 mol/L Ce3+. Optimal calcination conditions were 800 or 900 °C for 1 h. The optimal degradation conditions for the catalyst were pH 5, 5 mM H2O2, and 10 g/L catalyst loading.

Supplementary Materials

The following supporting information can be downloaded at: https://www.mdpi.com/article/10.3390/catal13111407/s1, SEM-EDS data: SEM-EDS after sintering of loaded AC catalyst at 900 °C, and SEM-EDS analysis of blank AC.

Author Contributions

Conceptualization and methodology, W.C. and J.Y.; software and validation, W.C. and M.Z.; formal analysis and investigation, W.C.; resources and data curation, W.C. and M.Z.; writing—original draft preparation, W.C.; writing—review and editing, W.C. and J.Y.; visualization, W.C. and J.Y.; supervision, J.Y.; project administration, J.Y.; funding acquisition, J.Y. All authors have read and agreed to the published version of the manuscript.

Funding

This study received no external funding.

Data Availability Statement

The data presented in this study are available upon request from the corresponding author.

Conflicts of Interest

The authors declare no conflict of interest.

References

  1. Liang, L.; Meng, Y.; Shi, L.; Ma, J.; Sun, J. Enhanced photocatalytic performance of novel visible light-driven Ag–TiO2/SBA-15 photocatalyst. Superlattices Microstruct. 2014, 73, 60–70. [Google Scholar] [CrossRef]
  2. Zhu, S.-R.; Wu, M.-K.; Zhao, W.-N.; Yi, F.-Y.; Tao, K.; Han, L. Fabrication of heterostructured BiOBr/Bi24O31Br10/TiO2 photocatalyst by pyrolysis of MOF composite for dye degradation. J. Solid. State Chem. 2017, 255, 17–26. [Google Scholar] [CrossRef]
  3. Wang, Y.; Liu, X.; Guo, L.; Shang, L.; Ge, S.; Song, G.; Naik, N.; Shao, Q.; Lin, J.; Guo, Z. Metal organic framework-derived C-doped ZnO/TiO2 nanocomposite catalysts for enhanced photodegradation of Rhodamine B. J. Colloid. Interface Sci. 2021, 599, 566–576. [Google Scholar] [CrossRef] [PubMed]
  4. Singh, J.; Kumar, S.; Manna, A.K.; Soni, R. Fabrication of ZnO–TiO2 nanohybrids for rapid sunlight driven photodegradation of textile dyes and antibiotic residue molecules. Opt. Mater. 2020, 107, 110138. [Google Scholar] [CrossRef]
  5. Vasilaki, E.; Katsarakis, N.; Dokianakis, S.; Vamvakaki, M. Rgo functionalized ZnO–TiO2 core-shell flower-like architectures for visible light photocatalysis. Catalysts 2021, 11, 332. [Google Scholar] [CrossRef]
  6. Li, K.; Zhao, Y.; Song, C.; Guo, X. Magnetic ordered mesoporous Fe3O4/CeO2 composites with synergy of adsorption and Fenton catalysis. Appl. Surf. Sci. 2017, 425, 526–534. [Google Scholar] [CrossRef]
  7. Sun, Y.; Yang, Z.; Tian, P.; Sheng, Y.; Xu, J.; Han, Y.-F. Oxidative degradation of nitrobenzene by a Fenton-like reaction with Fe-Cu bimetallic catalysts. Appl. Catal. B Environ. 2019, 244, 1–10. [Google Scholar] [CrossRef]
  8. Parvulescu, V.I.; Epron, F.; Garcia, H.; Granger, P. Recent Progress and Prospects in Catalytic Water Treatment. Chem. Rev. 2022, 122, 2981–3121. [Google Scholar] [CrossRef]
  9. Madanat, O.; AlSalka, Y.; Ramadan, W.; Bahnemann, D.W. TiO2 Photocatalysis for the Transformation of Aromatic Water Pollutants into Fuels. Catalysts 2021, 11, 317–361. [Google Scholar] [CrossRef]
  10. Ombaka, L.M.; McGettrick, J.D.; Oseghe, E.O.; Al-Madanat, O.; Genannt Best, F.R.; Msagati, T.A.; Davies, M.L.; Bredow, T.; Bahnemann, D.W. Photocatalytic H2 production and degradation of aqueous 2-chlorophenol over B/N-graphene-coated CuO/TiO2: A DFT, experimental and mechanistic investigation. J. Environ. Manag. 2022, 311, 114822. [Google Scholar] [CrossRef]
  11. Jain, B.; Singh, A.K.; Kim, H.; Lichtfouse, E.; Sharma, V.K. Treatment of organic pollutants by homogeneous and heterogeneous Fenton reaction processes. Environ. Chem. Lett. 2018, 16, 947–967. [Google Scholar] [CrossRef]
  12. Xin, S.; Liu, G.; Ma, X.; Gong, J.; Ma, B.; Yan, Q.; Chen, Q.; Ma, D.; Zhang, G.; Gao, M.; et al. High efficiency heterogeneous Fenton-like catalyst biochar modified CuFeO2 for the degradation of tetracycline: Economical synthesis, catalytic performance and mechanism. Appl. Catal. B Environ. 2021, 280, 119386. [Google Scholar] [CrossRef]
  13. Xu, B.; Dai, J.; Du, Z.; Li, F.; Liu, H.; Gu, X.; Wang, X.; Li, N.; Zhao, J. Catalytic conversion of biomass-derived compounds to various amino acids: Status and perspectives. Front. Chem. Sci. Eng. 2023, 17, 817–829. [Google Scholar] [CrossRef]
  14. Cui, R.; Jin, D.; Jiao, G.; Liu, Z.; Ma, J.; Sun, R. Cuprous oxide/copper oxide interpenetrated into ordered mesoporous cellulose-based carbon aerogels for efficient photocatalytic degradation of methylene blue. Front. Chem. Sci. Eng. 2023, 17, 918–929. [Google Scholar] [CrossRef]
  15. Ghernaout, D.; Elboughdiri, N.; Ghareba, S. Fenton technology for wastewater treatment: Dares and trends. Open Access Libr. J. 2020, 7, 1–26. [Google Scholar] [CrossRef]
  16. Liang, J.; Duan, X.; Xu, X.; Chen, K.; Wu, F.; Qiu, H.; Liu, C.; Wang, S.; Cao, X. Biomass-derived pyrolytic carbons accelerated Fe (iii)/Fe (ii) redox cycle for persulfate activation: Pyrolysis temperature-depended performance and mechanisms. Appl. Catal. B Environ. 2021, 297, 120446. [Google Scholar] [CrossRef]
  17. Tamang, M.; Paul, K.K. Application of activated carbon-supported heterogeneous Fenton catalyst for the treatment of real coking wastewater: Characterization and optimization of treatment parameters. Water Air Soil. Pollut. 2023, 234, 77. [Google Scholar] [CrossRef]
  18. Martínez, F.; Calleja, G.; Melero, J.; Molina, R. Iron species incorporated over different silica supports for the heterogeneous photo-Fenton oxidation of phenol. Appl. Catal. B Environ. 2007, 70, 452–460. [Google Scholar] [CrossRef]
  19. Nguyen, T.D.; Phan, N.H.; Do, M.H.; Ngo, K.T. Magnetic Fe2MO4 (M: Fe, Mn) activated carbons: Fabrication, characterization and heterogeneous Fenton oxidation of methyl orange. J. Hazard. Mater. 2011, 185, 653–661. [Google Scholar] [CrossRef]
  20. Li, Z.; Tang, X.; Liu, K.; Huang, J.; Xu, Y.; Peng, Q.; Ao, M. Synthesis of a MnO2/Fe3O4/diatomite nanocomposite as an efficient heterogeneous Fenton-like catalyst for methylene blue degradation. Beilstein J. Nanotechnol. 2018, 9, 1940–1950. [Google Scholar] [CrossRef]
  21. Luo, Y.; Wei, Y. Research of Fenton-like catalysts for remediation of organic pollution in sewage treatment technology. IOP Conf. Ser. Earth Environ. Sci. 2021, 804, 042069. [Google Scholar] [CrossRef]
  22. Pan, X.; Gu, Z.; Chen, W.; Li, Q. Preparation of biochar and biochar composites and their application in a Fenton-like process for wastewater decontamination: A review. Sci. Total Environ. 2021, 754, 142104. [Google Scholar] [CrossRef] [PubMed]
  23. Wu, N.; He, Y.; Tan, Y.; Zhang, L.; Huang, N.; Fang, W. Preparation of catalyst CuO/CeO2 in multiphase Fenton technology. IOP Conf. Ser. Mater. Sci. Eng. 2020, 789, 012067. [Google Scholar] [CrossRef]
  24. Li, J.; Jiang, J.; Zhang, W. Oxidative degradation of tetracycline hydrochloride using nano Fe/Co alloy and H2O2 under Fenton conditions. Res. Environ. Sci. 2018, 31, 757–764. [Google Scholar]
  25. Han, J.; Jiang, J.; Li, J. Oxidative degradation of oxytetracycline using nano Fe/Co catalyst and H2O2 under Fenton conditions. Res. Environ. Sci. 2020, 33, 2335–2341. [Google Scholar]
  26. Li, T.; Chen, Y.; Wang, X.; Liang, J.; Zhou, L. Modifying organic carbon in Fe3O4-loaded Schwertmannite to improve heterogeneous Fenton activity through accelerating Fe (ii) generation. Appl. Catal. B Environ. 2021, 285, 119830. [Google Scholar] [CrossRef]
  27. Ngo, H.-S.; Nguyen, T.-L.; Tran, N.-T.; Le, H.-C. Photocatalytic Removal of Ciprofloxacin in Water by Novel Sandwich-like CuFe2O4 on rGO/Halloysite Material: Insights into Kinetics and Intermediate Reactive Radicals. Water 2023, 15, 1569–1590. [Google Scholar] [CrossRef]
  28. Liu, L.; Li, S.; An, Y.; Sun, X.; Wu, H.; Li, J.; Chen, X.; Li, H. Hybridization of Nanodiamond and CuFe-LDH as Heterogeneous Photoactivator for Visible-Light Driven Photo-Fenton Reaction: Photocatalytic Activity and Mechanism. Catalysts 2019, 9, 118–137. [Google Scholar] [CrossRef]
  29. Prado, T.M.; Silva, F.L.; Grosseli, G.; Fadini, P.S.; Fatibello-Filho, O.; de Moraes, F.C. Using BiVO4/CuO-Based Photoelectrocatalyzer for 4-Nitrophenol Degradation. Materials 2020, 13, 1322–1324. [Google Scholar] [CrossRef]
  30. Li, G.; Mu, Y.; Huang, Z.; Wang, N.; Chen, Y.; Liu, J.; Liu, G.; Li, O.L.; Shao, M.; ShI, Z. Poly-active centric Co3O4-CeO2/Co-N-C composites as superior oxygen reduction catalysts for Zn-air batteries. Sci. China Mater. 2021, 64, 73–84. [Google Scholar] [CrossRef]
  31. Santos De Lima, A.; Fernandes Pupo Nogueira, R. Cerium-modified iron oxides applied as catalysts in the heterogeneous Fenton system for degradation of cephalexin. Environ. Sci. Pollut. Res. 2021, 28, 23767–23777. [Google Scholar] [CrossRef]
  32. Li, H.; Gao, Q.; Wang, G.; Han, B.; Xia, K.; Zhou, C. Unique electron reservoir properties of manganese in Mn (ii)-doped CeO2 for reversible electron transfer and enhanced Fenton-like catalytic performance. Appl. Surf. Sci. 2020, 502, 144295. [Google Scholar] [CrossRef]
  33. Ghasemi, H.; Mozaffari, S.; Mousavi, S.H.; Aghabarari, B.; Abu-Zahra, N. Decolorization of wastewater by heterogeneous Fenton reaction using MnO2-Fe3O4/CuO hybrid catalysts. J. Environ. Chem. Eng. 2021, 9, 105091. [Google Scholar] [CrossRef]
Figure 1. TGA and DSC curves of the impregnated AC.
Catalysts 13 01407 g001
Figure 2. SEM diagram of the AC before (A) and after (B) catalyst loading.
Catalysts 13 01407 g002
Figure 3. SEM diagram of the AC after loading at different sintering temperatures. (500, 600, 700, 800, 900, and 1000 °C).
Catalysts 13 01407 g003aCatalysts 13 01407 g003b
Figure 4. SEM-EDS analysis of blank AC, impregnated AC, and different sintering temperatures.
Catalysts 13 01407 g004
Figure 5. SEM-EDS surface element distribution of calcined 900 °C catalyst.
Catalysts 13 01407 g005
Figure 6. Adsorption–desorption isotherm curves before and after catalyst loading on AC.
Catalysts 13 01407 g006
Figure 7. XRD patterns of the catalysts at different calcination temperatures (sintering temperatures ranging from 500 to 1000 °C).
Catalysts 13 01407 g007
Figure 8. XPS spectra of AC loaded Fe, Cu, Ce, and Mn are (A), (B), (C), and (D), respectively.
Catalysts 13 01407 g008
Figure 9. XPS spectra of the AC catalysts prepared at different calcination temperatures loaded Fe, Cu, Ce, and Mn are (A), (B), (C), and (D), respectively.
Catalysts 13 01407 g009
Figure 10. Removal rate of MB by the AC catalysts impregnated with different metals.
Catalysts 13 01407 g010
Figure 11. Degradation time of MB corresponding to different ratios of Fe and Cu.
Catalysts 13 01407 g011
Figure 12. Degradation of MB by impregnating solutions with different Ce3+ concentrations.
Catalysts 13 01407 g012
Figure 13. Degradation of MB by impregnating solutions with different Mn2+ concentrations.
Catalysts 13 01407 g013
Figure 14. Degradation time of MB under different pH conditions.
Catalysts 13 01407 g014
Figure 15. Dissolved concentrations of catalyst ions at different pH values.
Catalysts 13 01407 g015
Figure 16. Effect of catalyst calcination temperature on MB removal rate.
Catalysts 13 01407 g016
Figure 17. Effect of H2O2 concentration on MB degradation.
Catalysts 13 01407 g017
Figure 18. EPR spectra of the samples at different conditions, Different lighting conditions in the presence of H2O2 (A), H2O2 + AC (B), Impregnated AC sintering at 500 °C + H2O2 (C), and Impregnated AC sintering at 500 °C + H2O2 (D); Impregnated AC sintering at 900 °C, impregnated AC sintering at 500 °C, unload AC, and only H2O2 in the light (E) and dark environments (F).
Catalysts 13 01407 g018
Table 1. Element content of blank AC, impregnated AC, and different sintering temperatures.
ElementC (wt%)O (wt%)Mn (wt%)Fe (wt%)Cu (wt%)Ce (wt%)
Sample
Blank AC86.647.58 5.78
Impregnated AC16.6030.840.8043.716.241.81
Sintering at 500 °C17.8020.600.8944.8114.101.80
Sintering at 600 °C16.6019.750.9844.9615.342.37
Sintering at 700 °C40.274.030.9337.6814.292.80
Sintering at 800 °C45.822.520.7836.0912.622.17
Sintering at 900 °C49.122.060.6935.0311.281.82
Sintering at 1000 °C53.142.020.5632.5310.111.64
Table 2. BET analysis results before and after catalyst loading of AC.
SampleSBET
AC without load890.46 ± 4.45
AC after loading899.26 ± 4.50
Table 3. Ion concentrations of impregnation solutions with different ratios of Fe and Cu.
Group123456789
Project
Fe3+(mol/L)0.270.270.270.360.360.360.450.450.45
Cu2+(mol/L)0.720.810.90.720.810.90.720.810.9
n(Fe): n(Cu)6:163:96:208:168:184:105:810:1810:20
Table 4. Repetitive stability test of the prepared catalyst.
Soaking Times12345678910
MB removal rate (%)97.9395.0394.1593.6293.3192.9792.5692.0791.4390.89
Table 5. Main experimental reagents.
Compound NameChemical FormulaManufacturer
Iron nitrate nine hydrateFe(NO3)3·9H2OShanghai Aladdin Biochemical Technology Co., Ltd., Shanghai, China
Cerium nitrates hexahydrateCe(NO3)3·6H2OShanghai Maclean’s Biochemical Technology Co., Ltd., Shanghai, China
Manganese nitrate tetrahydrateMn(NO3)2·4H2OShanghai Maclean’s Biochemical Technology Co., Ltd.
30% hydrogen peroxideH2O2Shanghai Maclean’s Biochemical Technology Co., Ltd.
Methylene blueC16H18ClN3S·3H2OFuchen (Tianjin) Chemical Reagent Co., Ltd., Tianjin, China
Cupric chloride dihydrateCuCl2·2H2OFuchen (Tianjin) Chemical Reagent Co., Ltd.
Sodium hydroxideNaOHBeijing Chemical Factory Co., Ltd., Beijing, China
Concentrated nitric acidHNO3Beijing Chemical Factory Co., Ltd.
Table 6. Main experimental instruments and equipment.
Experimental Instrument NameInstrument ModelProducer
Electronic balanceAL204Mettler-Toledo International Trading (Shanghai) Co., Ltd. China
CNC ultrasonic cleanerKQ-400DBKunShan Ultrasonic Instruments Co., Ltd., Kunshan, China
1650 degree atmosphere tube furnaceMR13Beijing Huace Testing Instrument Co., Ltd., Beijing, China.
Electric blast constant temperature drying oven101-0BShaoxing Yuanmore Machine and Electrical Equipment Co., Ltd., China
Field emission scanning electron microscopeJSM-7800FJEOL, Tokyo, Japan
Energy-dispersive spectroscopy annexQUANTAX 200Bruber, Salbuluken, Germany
Specific surface area analyzerASAP 2460 2.02Micromeritics, Norcross, GA, USA
ICP-MS7700Agilent, Santa Clara, CA, USA
X-ray photoelectron spectrometerESCALAB 250ThermoFisher Scientific, Waltham, MA, USA
UV spectrophotometerL6SShanghai Yidian Scientific Instrument Co., Ltd., Shanghai, China
X-ray diffractometerXRD-6000Shimadzu, Kyoto, Japan
Simultaneous thermal analyzerTGA/DSC 3+Mettler-Toledo, Zurich, Switzerland
Disclaimer/Publisher’s Note: The statements, opinions and data contained in all publications are solely those of the individual author(s) and contributor(s) and not of MDPI and/or the editor(s). MDPI and/or the editor(s) disclaim responsibility for any injury to people or property resulting from any ideas, methods, instructions or products referred to in the content.

