
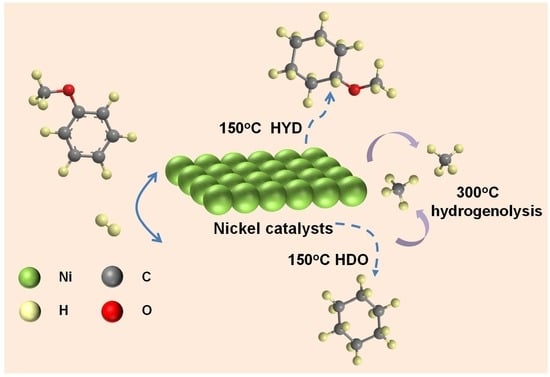
Temperature-Dependent Hydrogenation, Hydrodeoxygenation, and Hydrogenolysis of Anisole on Nickel Catalysts

Abstract
:
1. Introduction
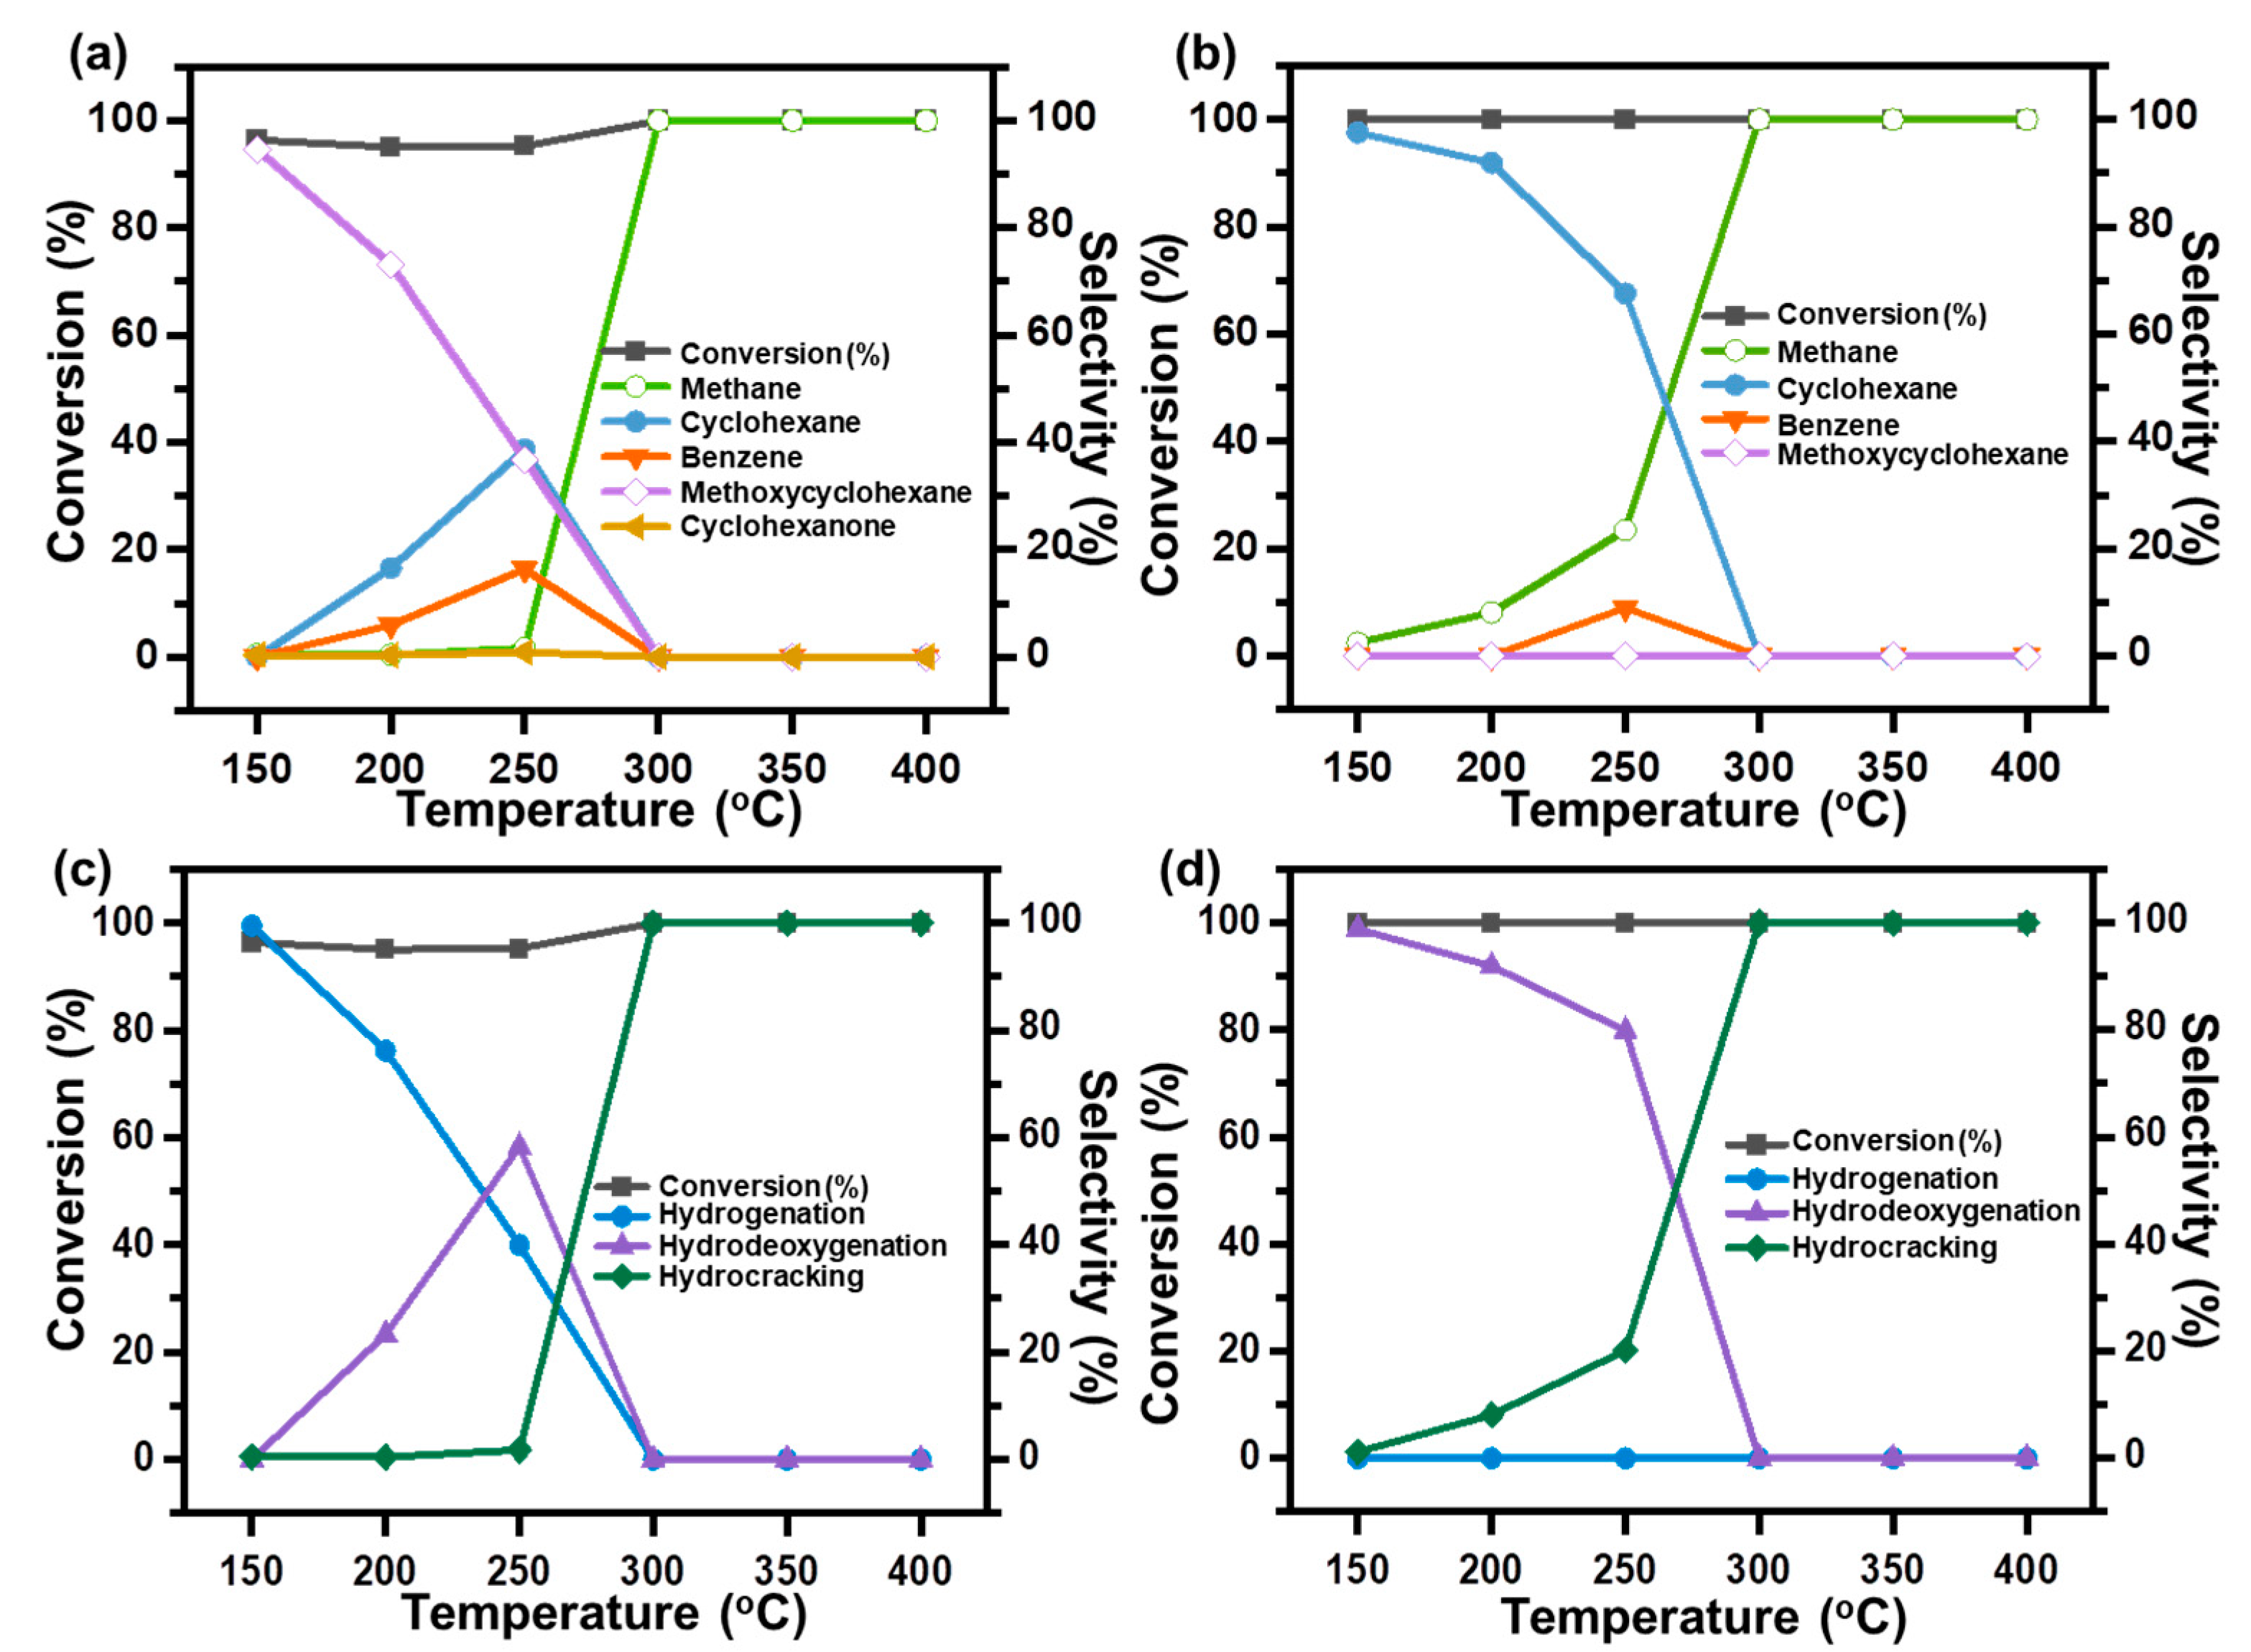
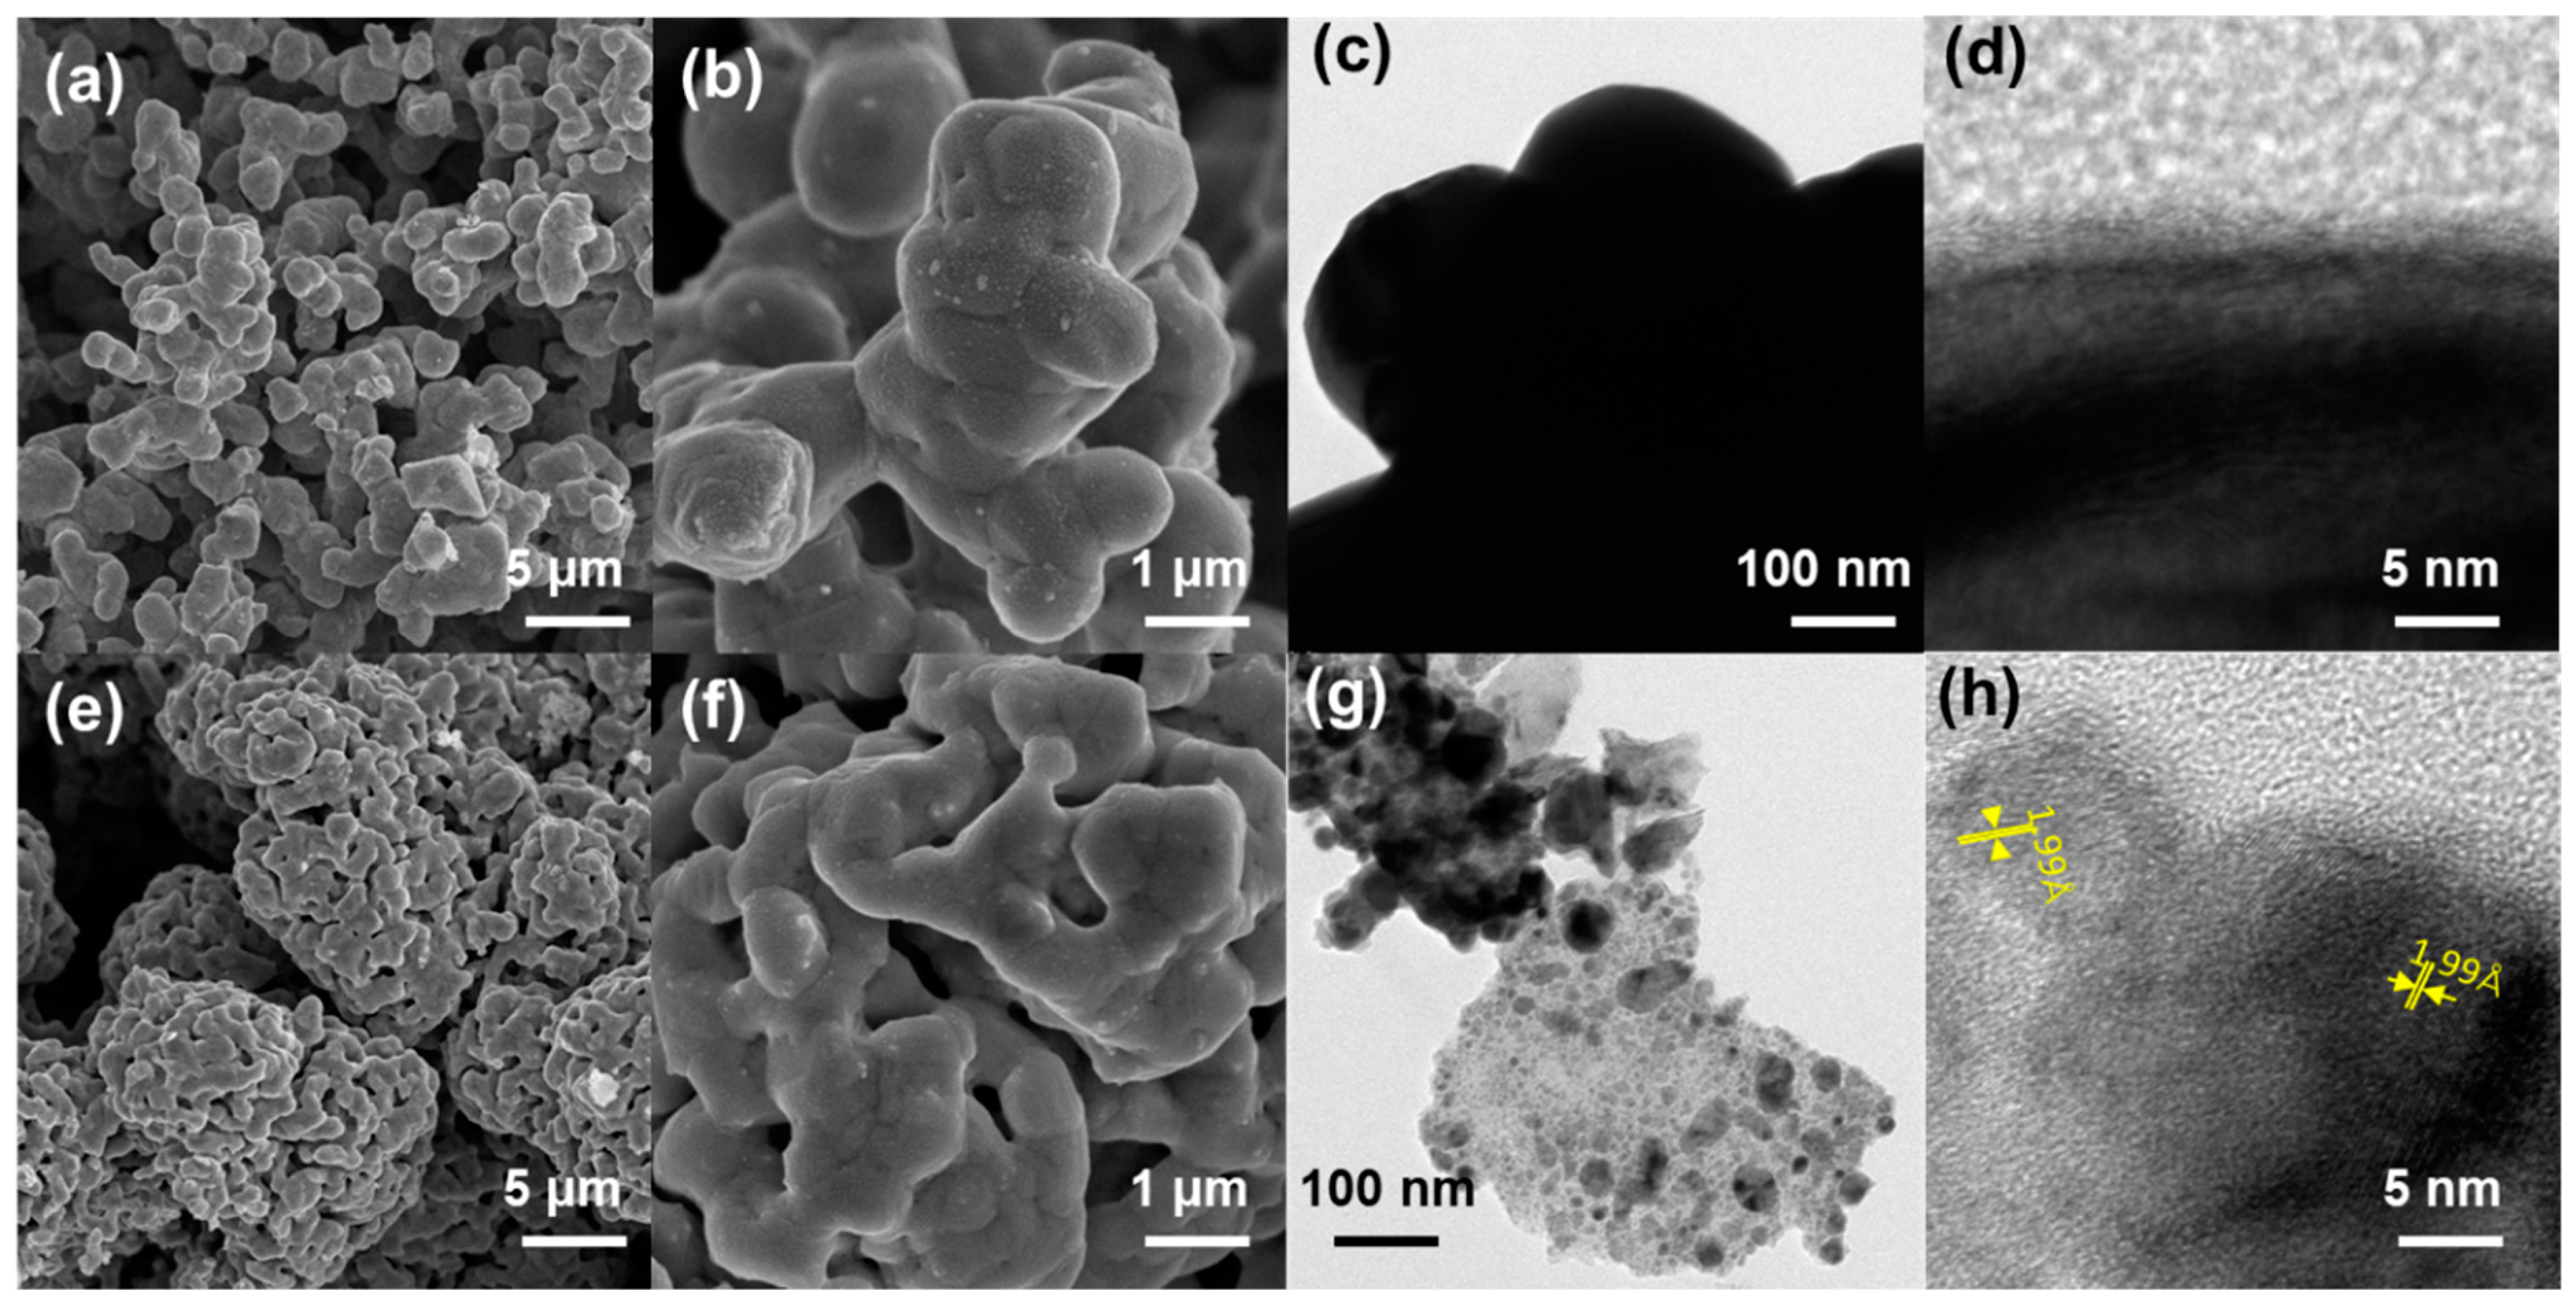
2. Results and Discussion
3. Experimental Methods
3.1. Synthesis of Catalysts
3.2. Characterization Method
3.3. Catalyst Evaluation
4. Conclusions
Author Contributions
Funding
Data Availability Statement
Conflicts of Interest
References
- Dresselhaus, M.S.; Thomas, I.L. Alternative energy technologies. Nature 2001, 414, 332–337. [Google Scholar] [CrossRef] [PubMed]
- Guo, X.; Fang, G.; Li, G.; Ma, H.; Fan, H.; Yu, L.; Ma, C.; Wu, X.; Deng, D.; Wei, M.; et al. Direct, Nonoxidative Conversion of Methane to Ethylene, Aromatics, and Hydrogen. Science 2014, 344, 616–619. [Google Scholar] [CrossRef]
- Huber, G.W.; Iborra, S.; Corma, A. Synthesis of Transportation Fuels from Biomass: Chemistry, Catalysts, and Engineering. Chem. Rev. 2006, 106, 4044–4098. [Google Scholar] [CrossRef] [PubMed]
- de Lasa, H.; Salaices, E.; Mazumder, J.; Lucky, R. Catalytic Steam Gasification of Biomass: Catalysts, Thermodynamics and Kinetics. Chem. Rev. 2011, 111, 5404–5433. [Google Scholar] [CrossRef] [PubMed]
- Xu, H.; Li, H. Regulating the crystal phase of Pd/Nb2O5 for vanillin selective HDO at room temperature. J. Catal. 2023, 423, 105–117. [Google Scholar] [CrossRef]
- Rajendran, A.; Cui, T.-y.; Fan, H.-x.; Yang, Z.-f.; Feng, J.; Li, W.-y. A comprehensive review on oxidative desulfurization catalysts targeting clean energy and environment. J. Mater. Chem. A 2020, 8, 2246–2285. [Google Scholar] [CrossRef]
- López-Benítez, A.; Berhault, G.; Burel, L.; Guevara-Lara, A. Novel NiW hydrodesulfurization catalysts supported on Sol-Gel Mn-Al2O3. J. Catal. 2017, 354, 197–212. [Google Scholar] [CrossRef]
- Albersberger, S.; Hein, J.; Schreiber, M.W.; Guerra, S.; Han, J.; Gutiérrez, O.Y.; Lercher, J.A. Simultaneous hydrodenitrogenation and hydrodesulfurization on unsupported Ni-Mo-W sulfides. Catal. Today 2017, 297, 344–355. [Google Scholar] [CrossRef]
- Hosseinpour, M.; Golzary, A.; Saber, M.; Yoshikawa, K. Denitrogenation of biocrude oil from algal biomass in high temperature water and formic acid mixture over H+ZSM-5 nanocatalyst. Fuel 2017, 206, 628–637. [Google Scholar] [CrossRef]
- Pinheiro, A.; Hudebine, D.; Dupassieux, N.; Geantet, C. Impact of Oxygenated Compounds from Lignocellulosic Biomass Pyrolysis Oils on Gas Oil Hydrotreatment. Energy Fuels 2009, 23, 1007–1014. [Google Scholar] [CrossRef]
- Yu, X.; Williams, C.T. Recent applications of nickel and nickel-based bimetallic catalysts for hydrodeoxygenation of biomass-derived oxygenates to fuels. Catal. Sci. Technol. 2023, 13, 802–825. [Google Scholar] [CrossRef]
- Chheda, J.N.; Huber, G.W.; Dumesic, J.A. Liquid-Phase Catalytic Processing of Biomass-Derived Oxygenated Hydrocarbons to Fuels and Chemicals. Angew. Chem. Int. Ed. 2007, 46, 7164–7183. [Google Scholar] [CrossRef] [PubMed]
- Furimsky, E. Catalytic hydrodeoxygenation. Appl. Catal. A Gen. 2000, 199, 147–190. [Google Scholar] [CrossRef]
- Li, H.; Ma, H.; Zhao, W.; Li, X.; Long, J. Upgrading lignin bio-oil for oxygen-containing fuel production using Ni/MgO: Effect of the catalyst calcination temperature. Appl. Energy 2019, 253, 113613. [Google Scholar] [CrossRef]
- Zhu, X.; Lobban, L.L.; Mallinson, R.G.; Resasco, D.E. Bifunctional transalkylation and hydrodeoxygenation of anisole over a Pt/HBeta catalyst. J. Catal. 2011, 281, 21–29. [Google Scholar] [CrossRef]
- Yang, Y.; Ochoa-Hernández, C.; de la Peña O’Shea, V.; Pizarro, P.; Coronado, J.M.; Serrano, D.P. Effect of metal–support interaction on the selective hydrodeoxygenation of anisole to aromatics over Ni-based catalysts. Appl. Catal. B Environ. 2014, 145, 91–100. [Google Scholar] [CrossRef]
- Zhang, S.; Liu, X.; Lin, H.; Chen, R.; Chen, Y.; Xu, Y.; Xu, K.; Zhao, H.; Tan, L.; Wu, L.; et al. Unveiling the in-situ formation of single-atomically dispersed Pd-Fe bimetallic catalytic sites during anisole hydrodeoxygenation. Mol. Catal. 2023, 547, 113401. [Google Scholar] [CrossRef]
- Strapasson, G.B.; Sousa, L.S.; Báfero, G.B.; Leite, D.S.; Moreno, B.D.; Rodella, C.B.; Zanchet, D. Acidity modulation of Pt-supported catalyst enhances C-O bond cleavage over acetone hydrodeoxygenation. Appl. Catal. B Environ. 2023, 335, 122863. [Google Scholar] [CrossRef]
- Prabhudesai, V.S.; Gurrala, L.; Vinu, R. Catalytic Hydrodeoxygenation of Lignin-Derived Oxygenates: Catalysis, Mechanism, and Effect of Process Conditions. Energy Fuels 2021, 36, 1155–1188. [Google Scholar] [CrossRef]
- Zhang, J.; Sun, J.; Wang, Y. Recent advances in the selective catalytic hydrodeoxygenation of lignin-derived oxygenates to arenes. Green Chem. 2020, 22, 1072–1098. [Google Scholar] [CrossRef]
- Lup, A.N.K.; Abnisa, F.; Daud, W.M.A.W.; Aroua, M.K. A review on reaction mechanisms of metal-catalyzed deoxygenation process in bio-oil model compounds. Appl. Catal. A Gen. 2017, 541, 87–106. [Google Scholar] [CrossRef]
- Zheng, Y.; Zhao, N.; Chen, J. Enhanced direct deoxygenation of anisole to benzene on SiO2-supported Ni-Ga alloy and intermetallic compound. Appl. Catal. B Environ. 2019, 250, 280–291. [Google Scholar] [CrossRef]
- Liu, X.; Zhang, S.; Zhao, H.; Lin, H.; Xu, K.; Xu, Y.; Tan, L.; Wu, L.; Tang, Y. In-situ studies on the synergistic effect of Pd-Mo bimetallic catalyst for anisole hydrodeoxygenation. Mol. Catal. 2022, 530, 112591. [Google Scholar] [CrossRef]
- Zhou, H.; Wang, M.; Wang, F. Oxygen-vacancy-mediated catalytic methanation of lignocellulose at temperatures below 200 °C. Joule 2021, 5, 3031–3044. [Google Scholar] [CrossRef]
- Si, X.; Lu, R.; Zhao, Z.; Yang, X.; Wang, F.; Jiang, H.; Luo, X.; Wang, A.; Feng, Z.; Xu, J.; et al. Catalytic production of low-carbon footprint sustainable natural gas. Nat. Commun. 2022, 13, 258. [Google Scholar] [CrossRef] [PubMed]
- Xu, Y.; An, Z.; Yu, X.; Yao, J.; Lv, Q.; Yang, H.; Lv, Z.; Guo, H.; Jiang, Q.; Liu, W.; et al. Enhanced catalytic stability and structural evolution of Rh-BN interface in dry reforming of methane under intensified CO2 partial pressure. J. Catal. 2023, 427, 115094. [Google Scholar] [CrossRef]
- Ghimire, N.; Bakke, R.; Bergland, W.H. Liquefaction of lignocellulosic biomass for methane production: A review. Bioresour. Technol. 2021, 332, 125068. [Google Scholar] [CrossRef] [PubMed]
- Wang, Z.; Peng, X.; Xia, A.; Shah, A.A.; Yan, H.; Huang, Y.; Zhu, X.; Zhu, X.; Liao, Q. Comparison of machine learning methods for predicting the methane production from anaerobic digestion of lignocellulosic biomass. Energy 2023, 263, 125883. [Google Scholar] [CrossRef]
- Ren, Z.; Si, X.; Chen, J.; Li, X.; Lu, F. Catalytic Complete Cleavage of C–O and C–C Bonds in Biomass to Natural Gas over Ru(0). ACS Catal. 2022, 12, 5549–5558. [Google Scholar] [CrossRef]
- Gassner, M.; Maréchal, F. Thermo-economic optimisation of the polygeneration of synthetic natural gas (SNG), power and heat from lignocellulosic biomass by gasification and methanation. Energy Environ. Sci. 2012, 5, 5768–5789. [Google Scholar] [CrossRef]
- Xie, J.; Xi, Y.; Gao, W.; Zhang, H.; Wu, Y.; Zhang, R.; Yang, H.; Peng, Y.; Li, F.; Li, Z.; et al. Hydrogenolysis of Lignin Model Compounds on Ni Nanoparticles Surrounding the Oxygen Vacancy of CeO2. ACS Catal. 2023, 13, 9577–9587. [Google Scholar] [CrossRef]
- Teles, C.A.; Ciotonea, C.; Le Valant, A.; Canaff, C.; Dhainaut, J.; Clacens, J.-M.; Noronha, F.B.; Richard, F.; Royer, S. Optimization of catalyst activity and stability in the m-cresol hydrodeoxygenation through Ni particle size control. Appl. Catal. B Environ. 2023, 338, 123030. [Google Scholar] [CrossRef]
- Stanley, J.T.; Thanarasu, A.; Kumar, P.S.; Periyasamy, K.; Raghunandhakumar, S.; Periyaraman, P.; Devaraj, K.; Dhanasekaran, A.; Subramanian, S. Potential pre-treatment of lignocellulosic biomass for the enhancement of biomethane production through anaerobic digestion—A review. Fuel 2022, 318, 123593. [Google Scholar] [CrossRef]
- Taghvaei, H.; Moaddeli, A.; Khalafi-Nezhad, A.; Iulianelli, A. Catalytic hydrodeoxygenation of lignin pyrolytic-oil over Ni catalysts supported on spherical Al-MCM-41 nanoparticles: Effect of Si/Al ratio and Ni loading. Fuel 2021, 293, 120493. [Google Scholar] [CrossRef]
- Lu, X.; Guo, H.; Chen, J.; Wang, D.; Lee, A.F.; Gu, X. Selective Catalytic Transfer Hydrogenation of Lignin to Alkyl Guaiacols Over NiMo/Al-MCM-41. ChemSusChem 2022, 15, e202200099. [Google Scholar] [CrossRef] [PubMed]
- Wu, X.; Liu, C.-J.; Wang, H.; Ge, Q.; Zhu, X. Origin of strong metal-support interactions between Pt and anatase TiO2 facets for hydrodeoxygenation of m-cresol on Pt/TiO2 catalysts. J. Catal. 2023, 418, 203–215. [Google Scholar] [CrossRef]
- Cui, B.; Wang, H.; Han, J.; Ge, Q.; Zhu, X. Crystal-phase-depended strong metal-support interactions enhancing hydrodeoxygenation of m-cresol on Ni/TiO2 catalysts. J. Catal. 2022, 413, 880–890. [Google Scholar] [CrossRef]
- Chen, C.; Chen, G.; Yang, F.; Wang, H.; Han, J.; Ge, Q.; Zhu, X. Vapor phase hydrodeoxygenation and hydrogenation of m-cresol on silica supported Ni, Pd and Pt catalysts. Chem. Eng. Sci. 2015, 135, 145–154. [Google Scholar] [CrossRef]
- Fang, W.; Liu, S.; Steffensen, A.K.; Schill, L.; Kastlunger, G.; Riisager, A. On the Role of Cu+ and CuNi Alloy Phases in Mesoporous CuNi Catalyst for Furfural Hydrogenation. ACS Catal. 2023, 13, 8437–8444. [Google Scholar] [CrossRef]
- He, L.; Li, M.; Li, W.-C.; Xu, W.; Wang, Y.; Wang, Y.-B.; Shen, W.; Lu, A.-H. Robust and Coke-free Ni Catalyst Stabilized by 1–2 nm-Thick Multielement Oxide for Methane Dry Reforming. ACS Catal. 2021, 11, 12409–12416. [Google Scholar] [CrossRef]
- Lu, S.; Yang, H.; Zhou, Z.; Zhong, L.; Li, S.; Gao, P.; Sun, Y. Effect of In2O3 particle size on CO2 hydrogenation to lower olefins over bifunctional catalysts. Chin. J. Catal. 2021, 42, 2038–2048. [Google Scholar] [CrossRef]
- Wang, X.; Chen, J. Effects of indium on Ni/SiO2 catalytic performance in hydrodeoxygenation of anisole as model bio-oil compound: Suppression of benzene ring hydrogenation and C–C bond hydrogenolysis. Chin. J. Catal. 2017, 38, 1818–1830. [Google Scholar] [CrossRef]
- Saguì, N.A.; Ström, P.; Edvinsson, T.; Pehlivan, I.B. Nickel Site Modification by High-Valence Doping: Effect of Tantalum Impurities on the Alkaline Water Electro-Oxidation by NiO Probed by Operando Raman Spectroscopy. ACS Catal. 2022, 12, 6506–6516. [Google Scholar] [CrossRef] [PubMed]
- Fu, Y.; Pichon, B.; Devred, F.; Singleton, M.L.; Hermans, S. Synthesis of spherical, rod, or chain Ni nanoparticles and their structure–activity relationship in glucose hydrogenation reaction. J. Catal. 2022, 415, 63–76. [Google Scholar] [CrossRef]
- Xu, J.; Zhu, P.; El Azab, I.H.; Bin Xu, B.; Guo, Z.; Elnaggar, A.Y.; Mersal, G.A.; Liu, X.; Zhi, Y.; Lin, Z.; et al. An efficient bifunctional Ni-Nb2O5 nanocatalysts for the hydrodeoxygenation of anisole. Chin. J. Chem. Eng. 2022, 49, 187–197. [Google Scholar] [CrossRef]
- Yang, F.; Liu, D.; Zhao, Y.; Wang, H.; Han, J.; Ge, Q.; Zhu, X. Size Dependence of Vapor Phase Hydrodeoxygenation of m-Cresol on Ni/SiO2 Catalysts. ACS Catal. 2018, 8, 1672–1682. [Google Scholar] [CrossRef]
- Peck, M.A.; Langell, M.A. Comparison of Nanoscaled and Bulk NiO Structural and Environmental Characteristics by XRD, XAFS, and XPS. Chem. Mater. 2012, 24, 4483–4490. [Google Scholar] [CrossRef]
- Wagner, C.D.; Gale, L.H.; Raymond, R.H. Two-dimensional chemical state plots: A standardized data set for use in identifying chemical states by X-ray photoelectron spectroscopy. Anal. Chem. 1979, 51, 466–482. [Google Scholar] [CrossRef]
- Gaskell, K.J.; Starace, A.; Langell, M.A. ZnxNi1-xO Rocksalt Oxide Surfaces: Novel Environment for Zn2+ and Its Effect on the NiO Band Structure. J. Phys. Chem. C 2007, 111, 13912–13921. [Google Scholar] [CrossRef]
- Shabaker, J.; Simonetti, D.; Cortright, R.; Dumesic, J. Sn-modified Ni catalysts for aqueous-phase reforming: Characterization and deactivation studies. J. Catal. 2005, 231, 67–76. [Google Scholar] [CrossRef]
- Hu, X.; Yang, J.; Sun, W.; Wang, N.; An, S.; Wang, Q.; Zhang, Y.; Xie, X.; Huang, L. Y-Zr-O solid solution supported Ni-based catalysts for hydrogen production via auto-thermal reforming of acetic acid. Appl. Catal. B Environ. 2020, 278, 119264. [Google Scholar] [CrossRef]
- Mateo, D.; Albero, J.; García, H. Graphene supported NiO/Ni nanoparticles as efficient photocatalyst for gas phase CO2 reduction with hydrogen. Appl. Catal. B Environ. 2018, 224, 563–571. [Google Scholar] [CrossRef]
- Zhang, M.; Zhang, J.; Zhou, Z.; Chen, S.; Zhang, T.; Song, F.; Zhang, Q.; Tsubaki, N.; Tan, Y.; Han, Y. Effects of the surface adsorbed oxygen species tuned by rare-earth metal doping on dry reforming of methane over Ni/ZrO2 catalyst. Appl. Catal. B Environ. 2020, 264, 118522. [Google Scholar] [CrossRef]
- Petitto, S.C.; Marsh, E.M.; Langell, M.A. Adsorption of Bromobenzene on Periodically Stepped and Nonstepped NiO(100). J. Phys. Chem. B 2005, 110, 1309–1318. [Google Scholar] [CrossRef]
- Song, T.; Li, R.; Wang, J.; Dong, C.; Feng, X.; Li, S.; Mu, R.; Fu, Q. Selective oxidation of methane to CO on Ni@BOx via reaction-induced vapor migration of boron-containing species onto Ni. Appl. Catal. B Environ. 2023, 321, 122021. [Google Scholar] [CrossRef]
- Zhao, D.; Shu, S.; Zhao, J.; Liang, Y.; Wang, H.; Liu, H.; Li, L.; Wang, D. Interactions of H2O and O2 with char during gasification in mixed atmosphere analyzed by isotope tracer method and in-situ DRIFTS. Fuel 2023, 337, 127173. [Google Scholar] [CrossRef]


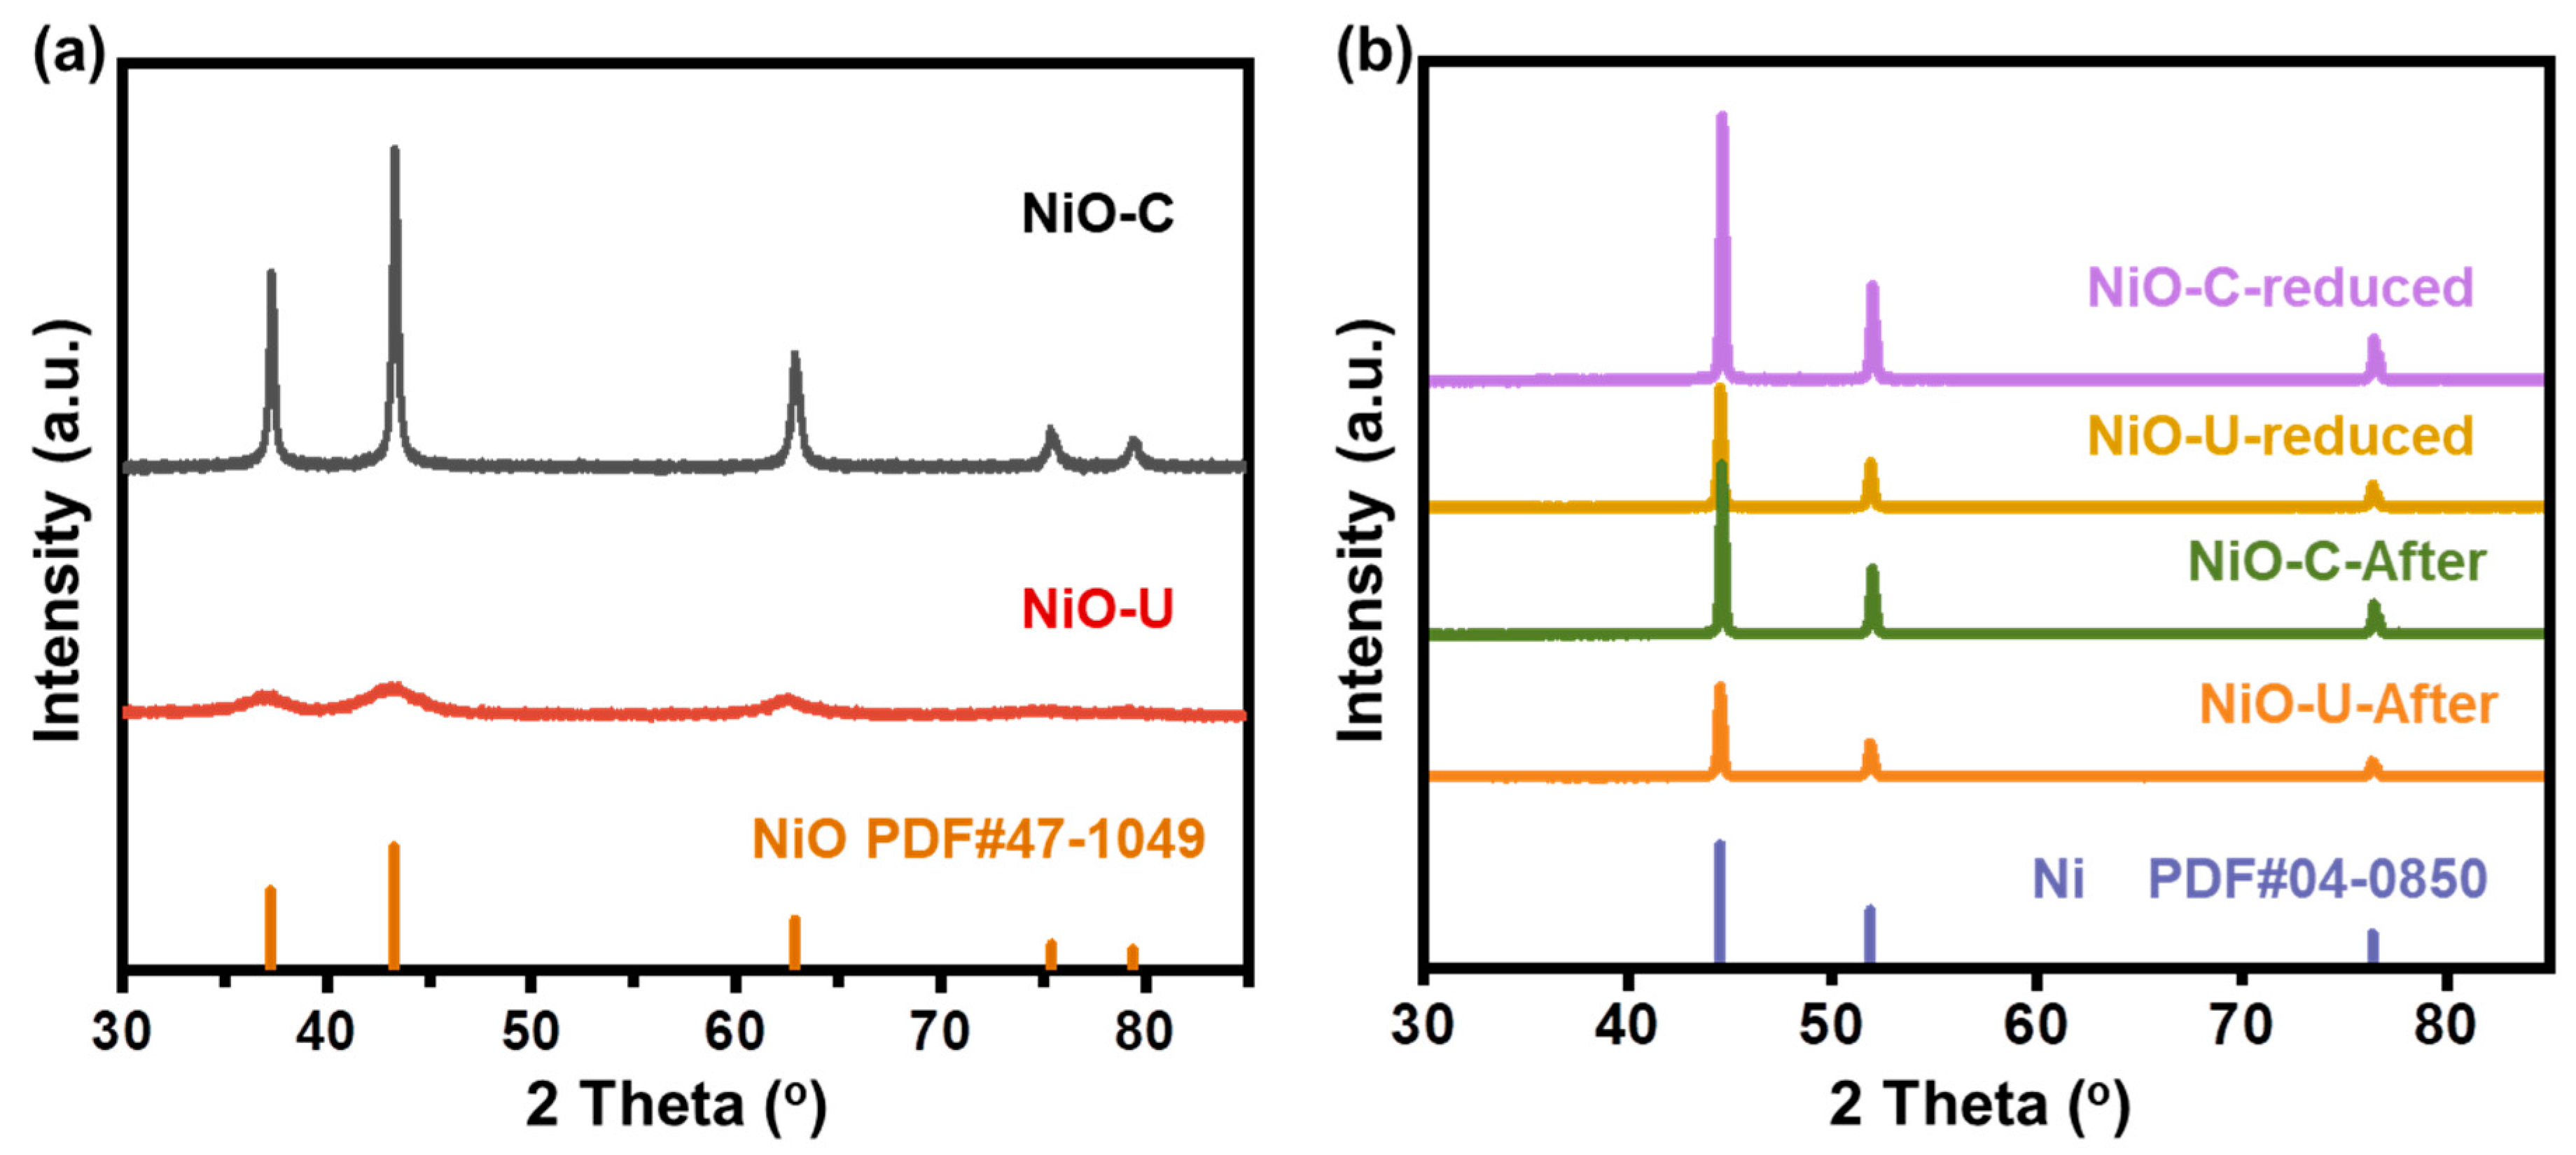
| Sample | Miller Indices (hkl) Plane | 2-Theta (°) | FWHM (Rad) | Crystallite Size (nm) a |
|---|---|---|---|---|
| NiO–C | (200) | 43.3 | 0.28 | 33 |
| NiO–U | (200) | 43.1 | 3.16 | 3 |
| NiO–C–reduced | (111) | 44.6 | 0.18 | 53 |
| NiO–U–reduced | (111) | 44.5 | 0.20 | 47 |
| NiO–C–after | (111) | 44.6 | 0.18 | 53 |
| NiO–U–after | (111) | 44.5 | 0.20 | 47 |
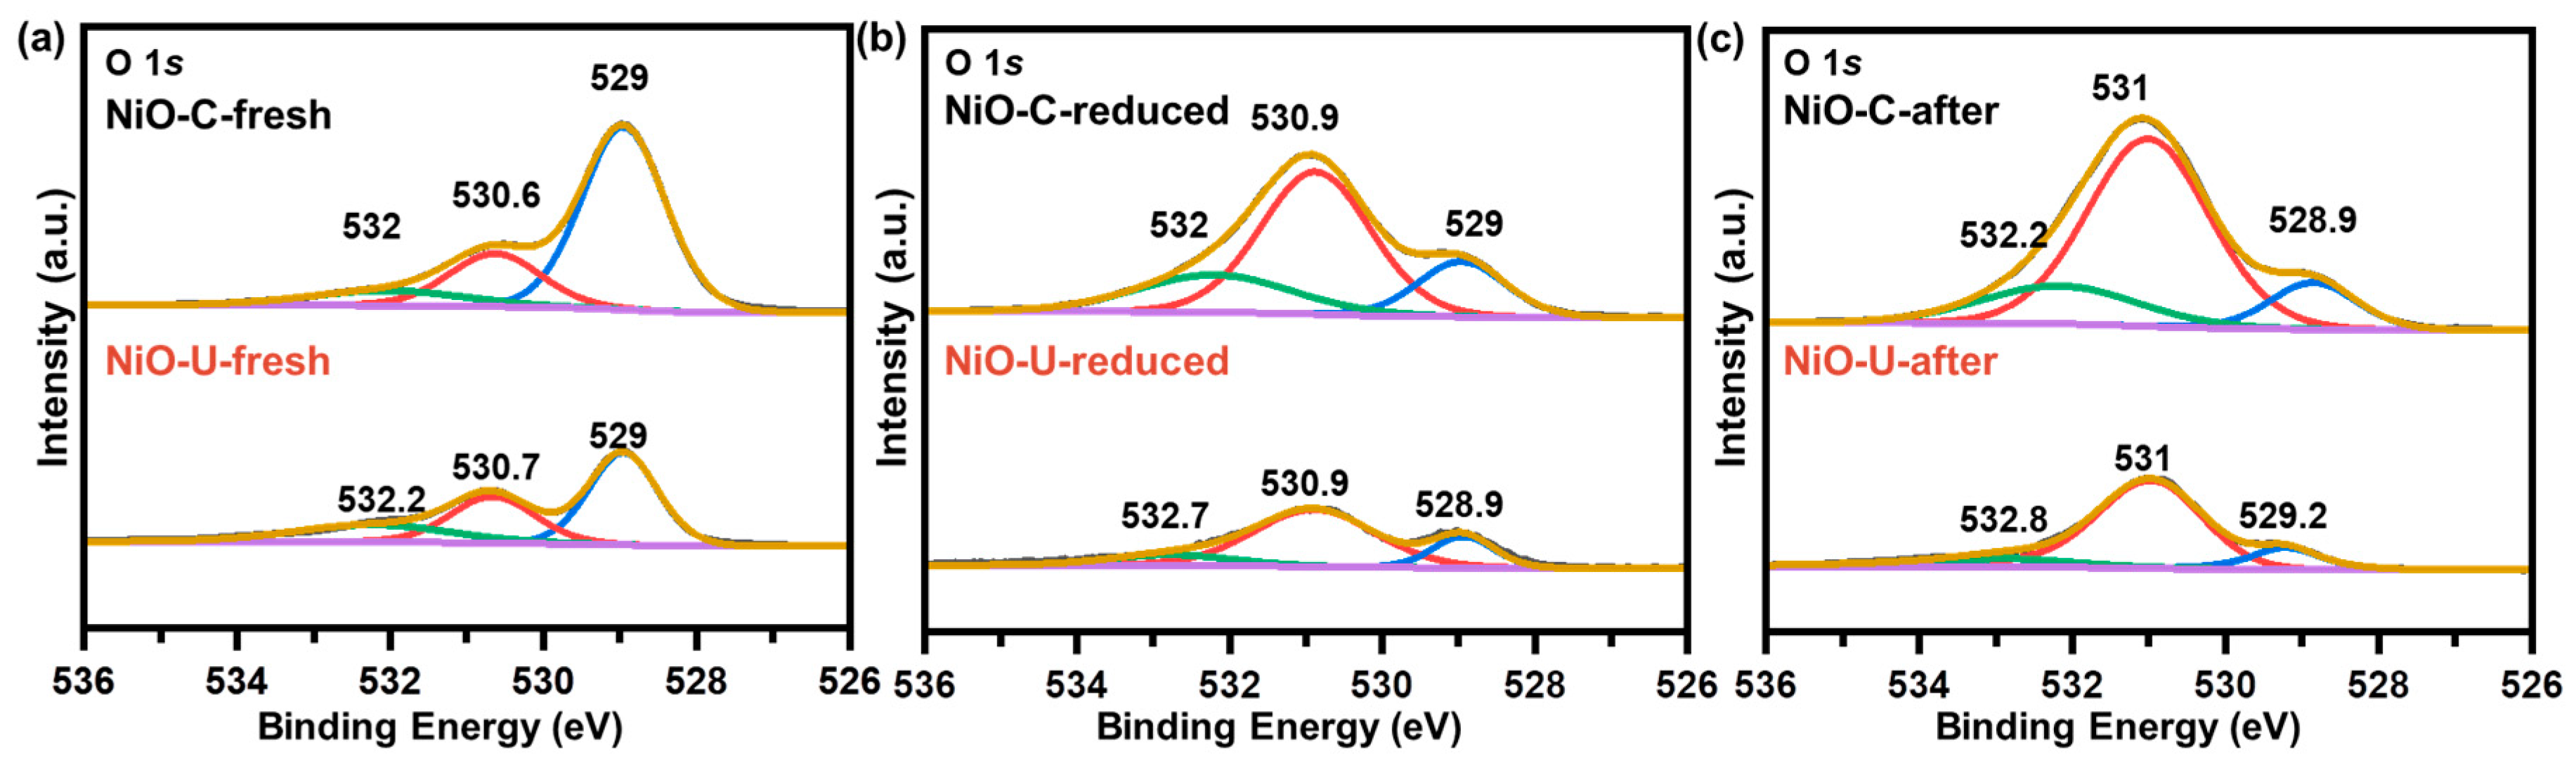
| Sample | Oxygen Species | Fresh | Reduced | After |
|---|---|---|---|---|
| NiO–C | lattice oxygen (%) | 42.3 | 30.0 | 22.4 |
| disordered oxygen (%) | 38.9 | 33.8 | 44.3 | |
| hydroxyl oxygen (%) | 18.8 | 36.2 | 33.3 | |
| NiO–U | lattice oxygen (%) | 48,8 | 19.0 | 13.1 |
| disordered oxygen (%) | 30.3 | 67.8 | 77.5 | |
| hydroxyl oxygen (%) | 20.9 | 13.2 | 9.4 |
Disclaimer/Publisher’s Note: The statements, opinions and data contained in all publications are solely those of the individual author(s) and contributor(s) and not of MDPI and/or the editor(s). MDPI and/or the editor(s) disclaim responsibility for any injury to people or property resulting from any ideas, methods, instructions or products referred to in the content. |
© 2023 by the authors. Licensee MDPI, Basel, Switzerland. This article is an open access article distributed under the terms and conditions of the Creative Commons Attribution (CC BY) license (https://creativecommons.org/licenses/by/4.0/).
Share and Cite
Zhang, S.; Liu, X.; Xu, Y.; Tang, Y. Temperature-Dependent Hydrogenation, Hydrodeoxygenation, and Hydrogenolysis of Anisole on Nickel Catalysts. Catalysts 2023, 13, 1418. https://doi.org/10.3390/catal13111418
Zhang S, Liu X, Xu Y, Tang Y. Temperature-Dependent Hydrogenation, Hydrodeoxygenation, and Hydrogenolysis of Anisole on Nickel Catalysts. Catalysts. 2023; 13(11):1418. https://doi.org/10.3390/catal13111418
Chicago/Turabian StyleZhang, Shuya, Xiaochen Liu, Yuanjie Xu, and Yu Tang. 2023. "Temperature-Dependent Hydrogenation, Hydrodeoxygenation, and Hydrogenolysis of Anisole on Nickel Catalysts" Catalysts 13, no. 11: 1418. https://doi.org/10.3390/catal13111418