Article

Investigating the Impact of Na2WO4 Doping in La2O3-Catalyzed OCM Reaction: A Structure–Activity Study via In Situ XRD-MS

School of Physical Science and Technology, Shanghai Tech University, 393 Huaxia Middle Road, Shanghai 201210, China
*
Author to whom correspondence should be addressed.
Catalysts 2024, 14(2), 150; https://doi.org/10.3390/catal14020150
Submission received: 31 December 2023 / Revised: 8 February 2024 / Accepted: 10 February 2024 / Published: 18 February 2024
(This article belongs to the Special Issue Heterogeneous Catalysis for Selective Hydrogenation)

Abstract

:
The La2O3 catalyst exhibits good performance in OCM reactions for its promising C2 selectivity and yield. Previous studies have affirmed that the formation of carbonates in La2O3 impedes the catalyst’s activity as a result of poisoning from CO2 exposure. In this study, a series of Na2WO4-impregnated La2O3 catalysts were synthesized to investigate the poisoning-resistant effect. The bulk phase and kinetics of the catalysts were analyzed in reactors employed with in situ XRD-MS and online MS, focusing on the CO2 adsorption on La2O3 and the phase transition process to La2O2CO3 in temperature zone correlated to OCM light-off. In situ XRD analysis revealed that, with Na2WO4 doped, CO2 exposure at elevated temperatures formed La2O2CO3 in tetragonal crystal phases, exhibiting distinctive differences from the hexagonal phase carbonates in undoped commercial La2O3. The ability to develop tetragonal or monoclinic La2O2CO3 was suggested as a descriptor to assess the sensitivity of La2O3 catalysts to CO2 adsorption, a tunable characteristic found in this study through varying Na2WO4 doping levels. Coupled XRD-MS analysis of CO2 adsorption uptake and phase change further confirmed a positive dependence between the resistivity of La2O3 catalyst to CO2 adsorption and its low-temperature C2 selectivity. The results extended the previous CO2 poisoning effect from multiple perspectives, offering a novel modification approach for enhancing the low-temperature performance of La2O3 catalysts in OCM.

1. Introduction

The oxidative coupling of methane (OCM) reaction is deemed a promising industrial process, as it enables the direct conversion of CH4 into C2H4 and C2H6, which are essential precursors in the industrial realm [1,2,3,4]. The obstacle preventing the large-scale industrialization of the OCM reaction is the restricted C2 yield and selectivity at high reaction temperatures [5,6,7,8]. Hence, catalysts exhibiting high catalytic activity at low temperatures in OCM reactions are indispensable to meet industrial requirements. Following the groundbreaking contributions by Keller and Bhasin, numerous catalytic materials have undergone investigation for the OCM reaction [8,9]. Currently, La2O3 has undergone extensive research and is acknowledged as one of the most effective catalysts for OCM reactions [2,3,8,10]. In general, most OCM reaction systems, including La2O3, require very high temperatures around or above 800 °C [11], which is important to accomplish the cleavage of C-H bond and CH3 radical desorption to form methyl radicals. On the other hand, the overall OCM reaction is highly exothermic [12]. While OCM is generally recognized as a catalytic process, its efficiency is influenced by synergistic gas-phase chemistry, which is affected by factors, such as residence time, pressure, and the ratio of CH4 to O2. Experimental studies indicate that the rate of C2 formation is heavily reliant on CH3 concentrations [13]. The formation rate of methyl radicals is only mildly affected by temperature but varies significantly depending on the specific catalyst employed. Considering both the thermodynamics and kinetics, it is imperative to improve the performance of OCM at low temperatures.
As a single metal oxide species, La2O3 demonstrates susceptibility to carbonation by CO2 exposure, either from the atmosphere or the OCM reaction circumstance, resulting in the formation of La2O2CO3, which is exclusively generated at temperatures exceeding 500 °C [11,14,15,16,17,18,19]. Several relevant studies have focused on La2O2CO3, regarding whether CO32− exerts an inhibitory or promotive effect on the OCM reaction activity of La2O3 [15,17,20,21,22,23]. CO2 is the primary by-product of La2O3-catalyzed OCM [24], of which the yield is around 10% accompanied by a 25% CH4 conversion rate and nearly 50% selectivity of C2 in the reaction [12]. The in situ surface and bulk structure formation of La2O2CO3 from pure La2O3 under a variety of OCM-correlated conditions have been investigated by our group in detail using XPS and XRD [11,25].
Taylor et al. conducted a comparison of various synthesized lanthanum salts and suggested that the rank of C2 activity is as follows: La2O2CO3 > La2(CO3)3 > La(OH)3 > La2O3 [26]. Other studies also agreed that synthesized lanthanum catalyst containing carbonate exhibits excellent performance [27]. However, under high-temperature OCM reaction conditions, most La2O2CO3 will undergo thermal decomposition and be reduced back into purified La2O3 on the catalytic surface. On the other hand, most in situ structure or real-time activity-related studies, in which the CO2 input is applied as a reaction parameter, concluded that carbonates have a negative impact in La2O3-catalyzed OCM reaction. Through 16O and 18O isotope and SSITKA analysis, Lacombe et al. concluded that, when exposed to CO2 at 750 °C, La2O3 will strongly inhibit surface oxygen dissociation [28,29]. Yide Xu et al. observed a negative impact on the CH4 conversion rate, C2 selectivity, and C 2 = / C 2 0 ratio when CO2 was added to the OCM reaction catalyzed by 10% La2O3/ZnO [30]. In our previous publication, by employing in situ XRD-MS, La2O2CO3 to La2O3 ratio was quantitatively estimated and controlled by adjusting CO2 exposure. Characterization afterward revealed that the higher the initial La2O2CO3 level in the catalyst bulk phase, the higher the OCM light-off temperature of both COx and C2 products in OCM, which is a typical poisoning descriptor [11]. XPS results after in situ CO2-correlated treatment also revealed that the sample pre-carbonated by CO2 exhibits an activation temperature nearly 65 °C higher than the one with a pristine La2O3 surface [25]. Combined with in situ kinetic correlated structure studies and detailed DFT modeling, it revealed a thermodynamically favored peroxide structure as the active oxygen site. On La2O3, this peroxide is formed on the subsurface six-coordinated oxygen site, which is also the same site of carbonate formation. The model provided a reasonable preliminary explanation from the perspective of chemical pathways that the La2O2CO3 acts as a poisoning species in La2O3-catalyzed OCM reaction; however, La2O2CO3 is a very robust species. In an inert environment, such as in a vacuum or an Ar-filled reactor, the complete decomposition of La2O2CO3 back to purified La2O3 requires a high temperature of around 800 °C [11]. In an atmosphere with CO2 at the same high temperatures, the catalyst sample could still contain both components [11,12,15,23,31,32,33,34]. This explains why OCM requires a very high reaction temperature as it is a necessity to decompose the poisoned sites.
Further in situ studies correlated the higher resistance to carbonation of La2O3 catalysts to its better low-temperature OCM activity [35]. In situ XRD-MS was applied to investigate the CO2 adsorption behavior and OCM reactivity of two La2O3 catalysts, a lab-synthesized nanorod La2O3 [23,33,34] and a commercial La2O3 supplied by [11]. In the identical temperature range, the apparent activation energy for the OCM reaction of nanorod La2O3 is approximately 60 kJ mol−1 lower than that observed for commercial La2O3 [35]. The online MS CO2 adsorption curve and the coupled in situ XRD indicate that, under the same exposure condition of CO2 concentration and heating temperature, nanorod La2O3 always absorbs less CO2 than commercial La2O3. This case by itself strongly suggests that increasing the resistivity of CO2 adsorption of La2O3 is an effective method to enhance the low-temperature OCM performance of La2O3, which is also a natural consequence of the above theory that CO2 acts as the poison in La2O3.
On the other hand, Na2WO4 is widely acknowledged as a highly effective additive in catalyst formulations, particularly in the case of the MnxOy–Na2WO4/SiO2 catalyst, which demonstrates excellent performance in the OCM reaction [36,37,38,39,40,41,42]. Pengwei Wang et al. synthesized a TiO2-doped Mn2O3–Na2WO4/SiO2 catalyst and revealed that it has accepted CH4 conversion of 22% and C2–3 selectivity of ~62% at a lower temperature (650 °C) and established a reaction mechanism model supported by the active oxygen transforming on W4+–W6+ [42]. Recently, Shihui Zou et al. innovatively developed a novel two-part catalyst comprising Na2WO4/SiO2 and La2O3; this catalyst involves modifying the La2O3 catalyst with additional Na2WO4, achieving a C2 yield of 10.9% at 570 °C [43]. Studies indicate the potential of incorporating Na2WO4 as an active additive in modified catalysts. Motivated by the Na2WO4-modified catalyst, Na2WO4 is introduced into the catalyst as an approach of optimization, especially on the low-temperature performance, in this study.
Based on the above research foundation of Na2WO4 and La2O3, we used in situ XRD-MS characterization to investigate the effect of doping Na2WO4 into La2O3 samples, focusing on CO2-adsorption-correlated structure behavior and the low-temperature OCM reaction activity. In situ XRD allows real-time monitoring of the pure oxide to dioxymonocarbonate phase changes in La2O3 during the linear heating process under CO2 exposure, while the coupled online MS collects the real-time CO2 adsorption from reaction outlet gas providing a quantitative estimation of the uptake. By combining the changes in bulk structure and gas composition through the time temperature correspondence, the resistance of the samples to CO2 adsorption can be directly compared through the experiment results. It was found that, after doping with Na2WO4, a series of new behaviors were induced in the commercial La2O3 catalysts. First, the online MS revealed that the CO2 adsorption temperature on the doped La2O3 sample is significantly increased. The in situ XRD also observed that the formed La2O2CO3 crystal structure after CO2 exposure changed from hexagonal to monoclinic/tetragonal with Na2WO4 doped over La2O3. Both the bulk phase crystal structure of the formed dioxymonocarbonates and the CO2 uptake temperature are characteristics of the nanorod La2O3 [23]. In the end, the OCM reaction activity results were acquired in a microreactor coupled with online MS, and the doped samples were found to have higher conversion and selectivity at 500–650 °C than the undoped La2O3. Combining the CO2 adsorption and OCM activity results, it becomes evident that the CO2 adsorption resistance of the La2O3 catalyst is critical for better low-temperature OCM performance. The results of this article provide a new approach and possibility for improving La2O3.

2. Results and Discussion

2.1. Differences in La2O3 and La2O2CO3 Phase Structure

After in situ calcination at 800 °C, the results comparison of bulk phase analysis obtained by XRD from M-La2O3 samples with different loading levels of Na2WO4 are shown in Figure 1. Little different from the undoped M-La2O3 sample, the XRD patterns of all three M-La2O3_nW catalysts exhibit similar crystal structures after high-temperature purification. The diffraction patterns all align well with the hexagonal phase of La2O3. As generally reported, it is expected that Na2WO4 exists in the bulk phase as a cubic crystal structure [44]. However, the XRD pattern of all three M-La2O3_nW samples at room temperature did not reveal any signal correlated to Na2WO4. This absence could be attributed to the low content and effective dispersion of Na2WO4, so the grain size is not adequate to generate diffraction patterns.
To confirm that Na2WO4 was indeed doped into the sample, XPS analysis was performed for M-La2O3_1W, 3W, and 5W samples (calcined at 800 °C) revealing the surface elements, their content, and electronic structure. As shown in Figure 1b (left), W 4f spectra exhibit the main W 4f7/2 peak at 35.5 eV confirming the +6 oxidation state for all samples [45]. While the only possible La oxidation state is +3 (metallic La is not expected at these conditions), different La3+ compounds are known to demonstrate various La 3d5/2 multiplet splitting. The La 3d5/2 spectra presented in Figure 1b (right) show the splitting of 4.5 eV, which is clearly associated with La2O3 (without hydroxide or carbonate) [46,47]. With the increase in Na2WO4 doping amount, the W 4f peaks intensity grows being in agreement with the samples preparation procedure. The atomic percentages of W and La (normalized to the total of W and La, other elements not considered) given in Table 1 demonstrate the increase in W content on the catalyst surface in agreement with the increase in Na2WO4 loading.
As mentioned in previous studies, it was observed that the La2O3 catalysts with identical bulk structures have different OCM performance, whereas the nanorod La2O3 catalyst shows better low-temperature performance than the M-La2O3 catalyst. Distinctions of the bulk phases between these two catalysts were only found after carbonate formed under identical CO2 treatment conditions [11,35]. In the subsequent experiments, the three M-La2O3_nW catalysts and M-La2O3 catalysts were exposed to identical CO2 flow.

2.2. Adsorption of CO2 and OCM Reaction Performance

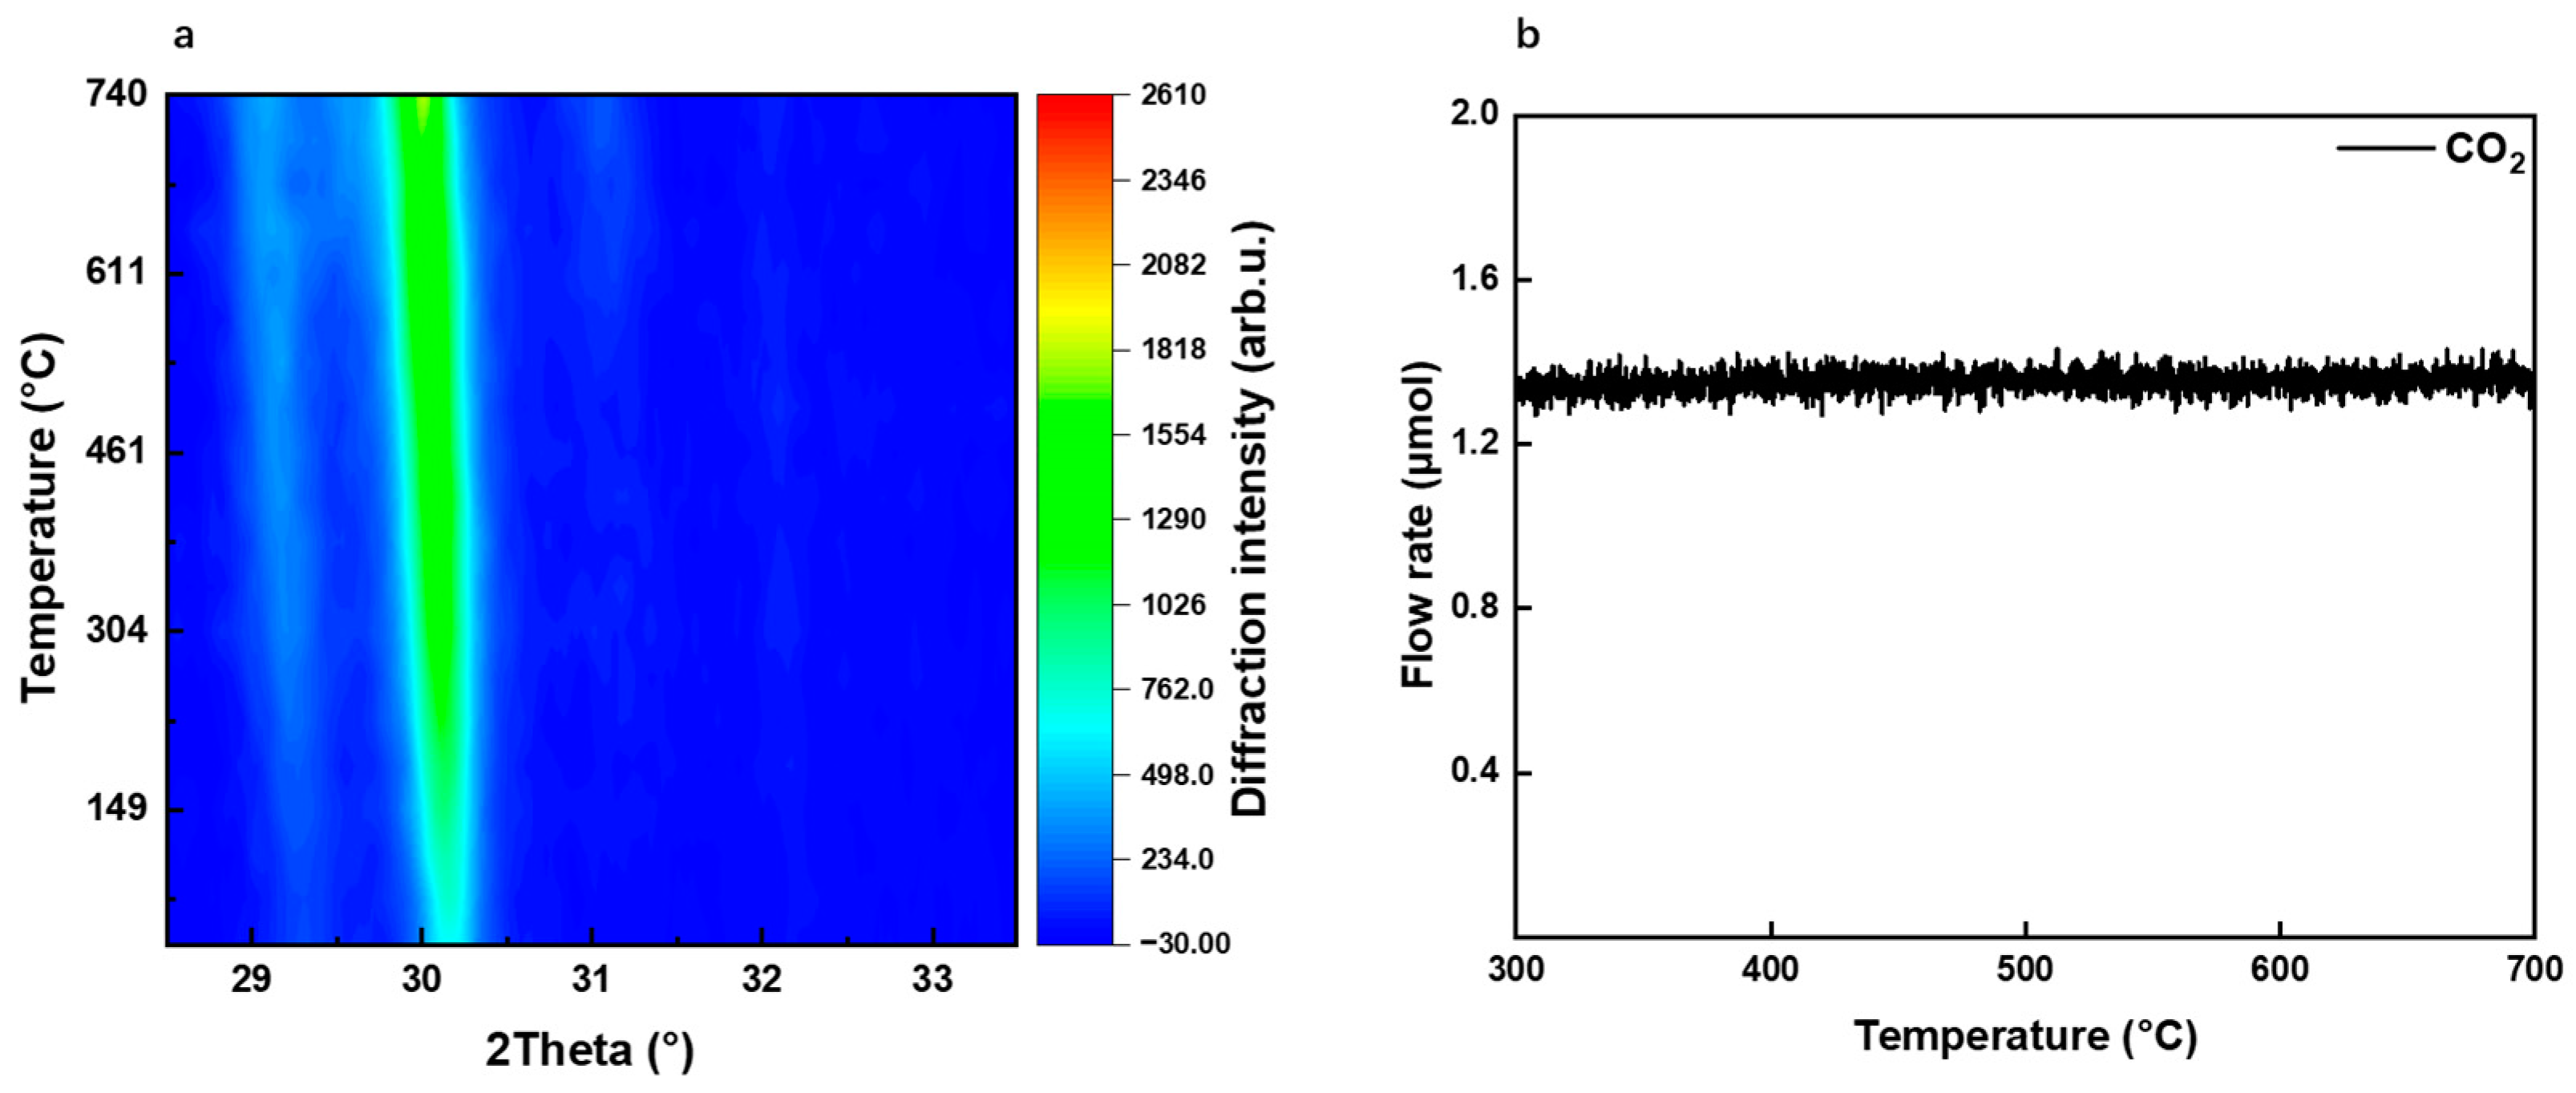
As mentioned in the introduction, previous in situ XRD-MS studies [35] indicated that, under the same exposure condition of CO2 concentration and heating temperature, the same in situ XRD-MS was applied for simultaneously monitoring of CO2 adsorption processes over the four catalyst samples during linear heating. To compare with this previous result, constant CO2 exposure treatments are performed on the M-La2O3_5W sample with 10% CO2 in the first in situ measurement. The XRD signal intensity in this region is plotted in a topographical map style (Figure 2a), and the XRD patterns clearly show the peaks at around 29.1° and 30.1° in this range, representing hexagonal La2O3 (002) and (101) are not reduced. The results showed that the doped M-La2O3_5W is always robust to CO2 exposure, remaining oxidic under the same 10% CO2 exposure when the temperature reaches 600 °C. Furthermore, it still shows no bulk phase change after additional heating to temperature region up to 740 °C (Figure 2a). The simultaneously obtained online MS signal also shows little change in CO2 output, confirming that there is no CO2 adsorption rate significant enough to change its partial pressure in the in situ XRD-MS cell during the whole process (Figure 2b). In previous studies [35], the optimized nanorods with better low-temperature activity also showed a stable La2O3 phase while exposed to 10% CO2 both throughout the 600 °C isotherm and after cooling down to room temperature. In this study, the M-La2O3 sample only after a simple Na2WO4 doping modification shows a similar behavior of resistance to carbonation.
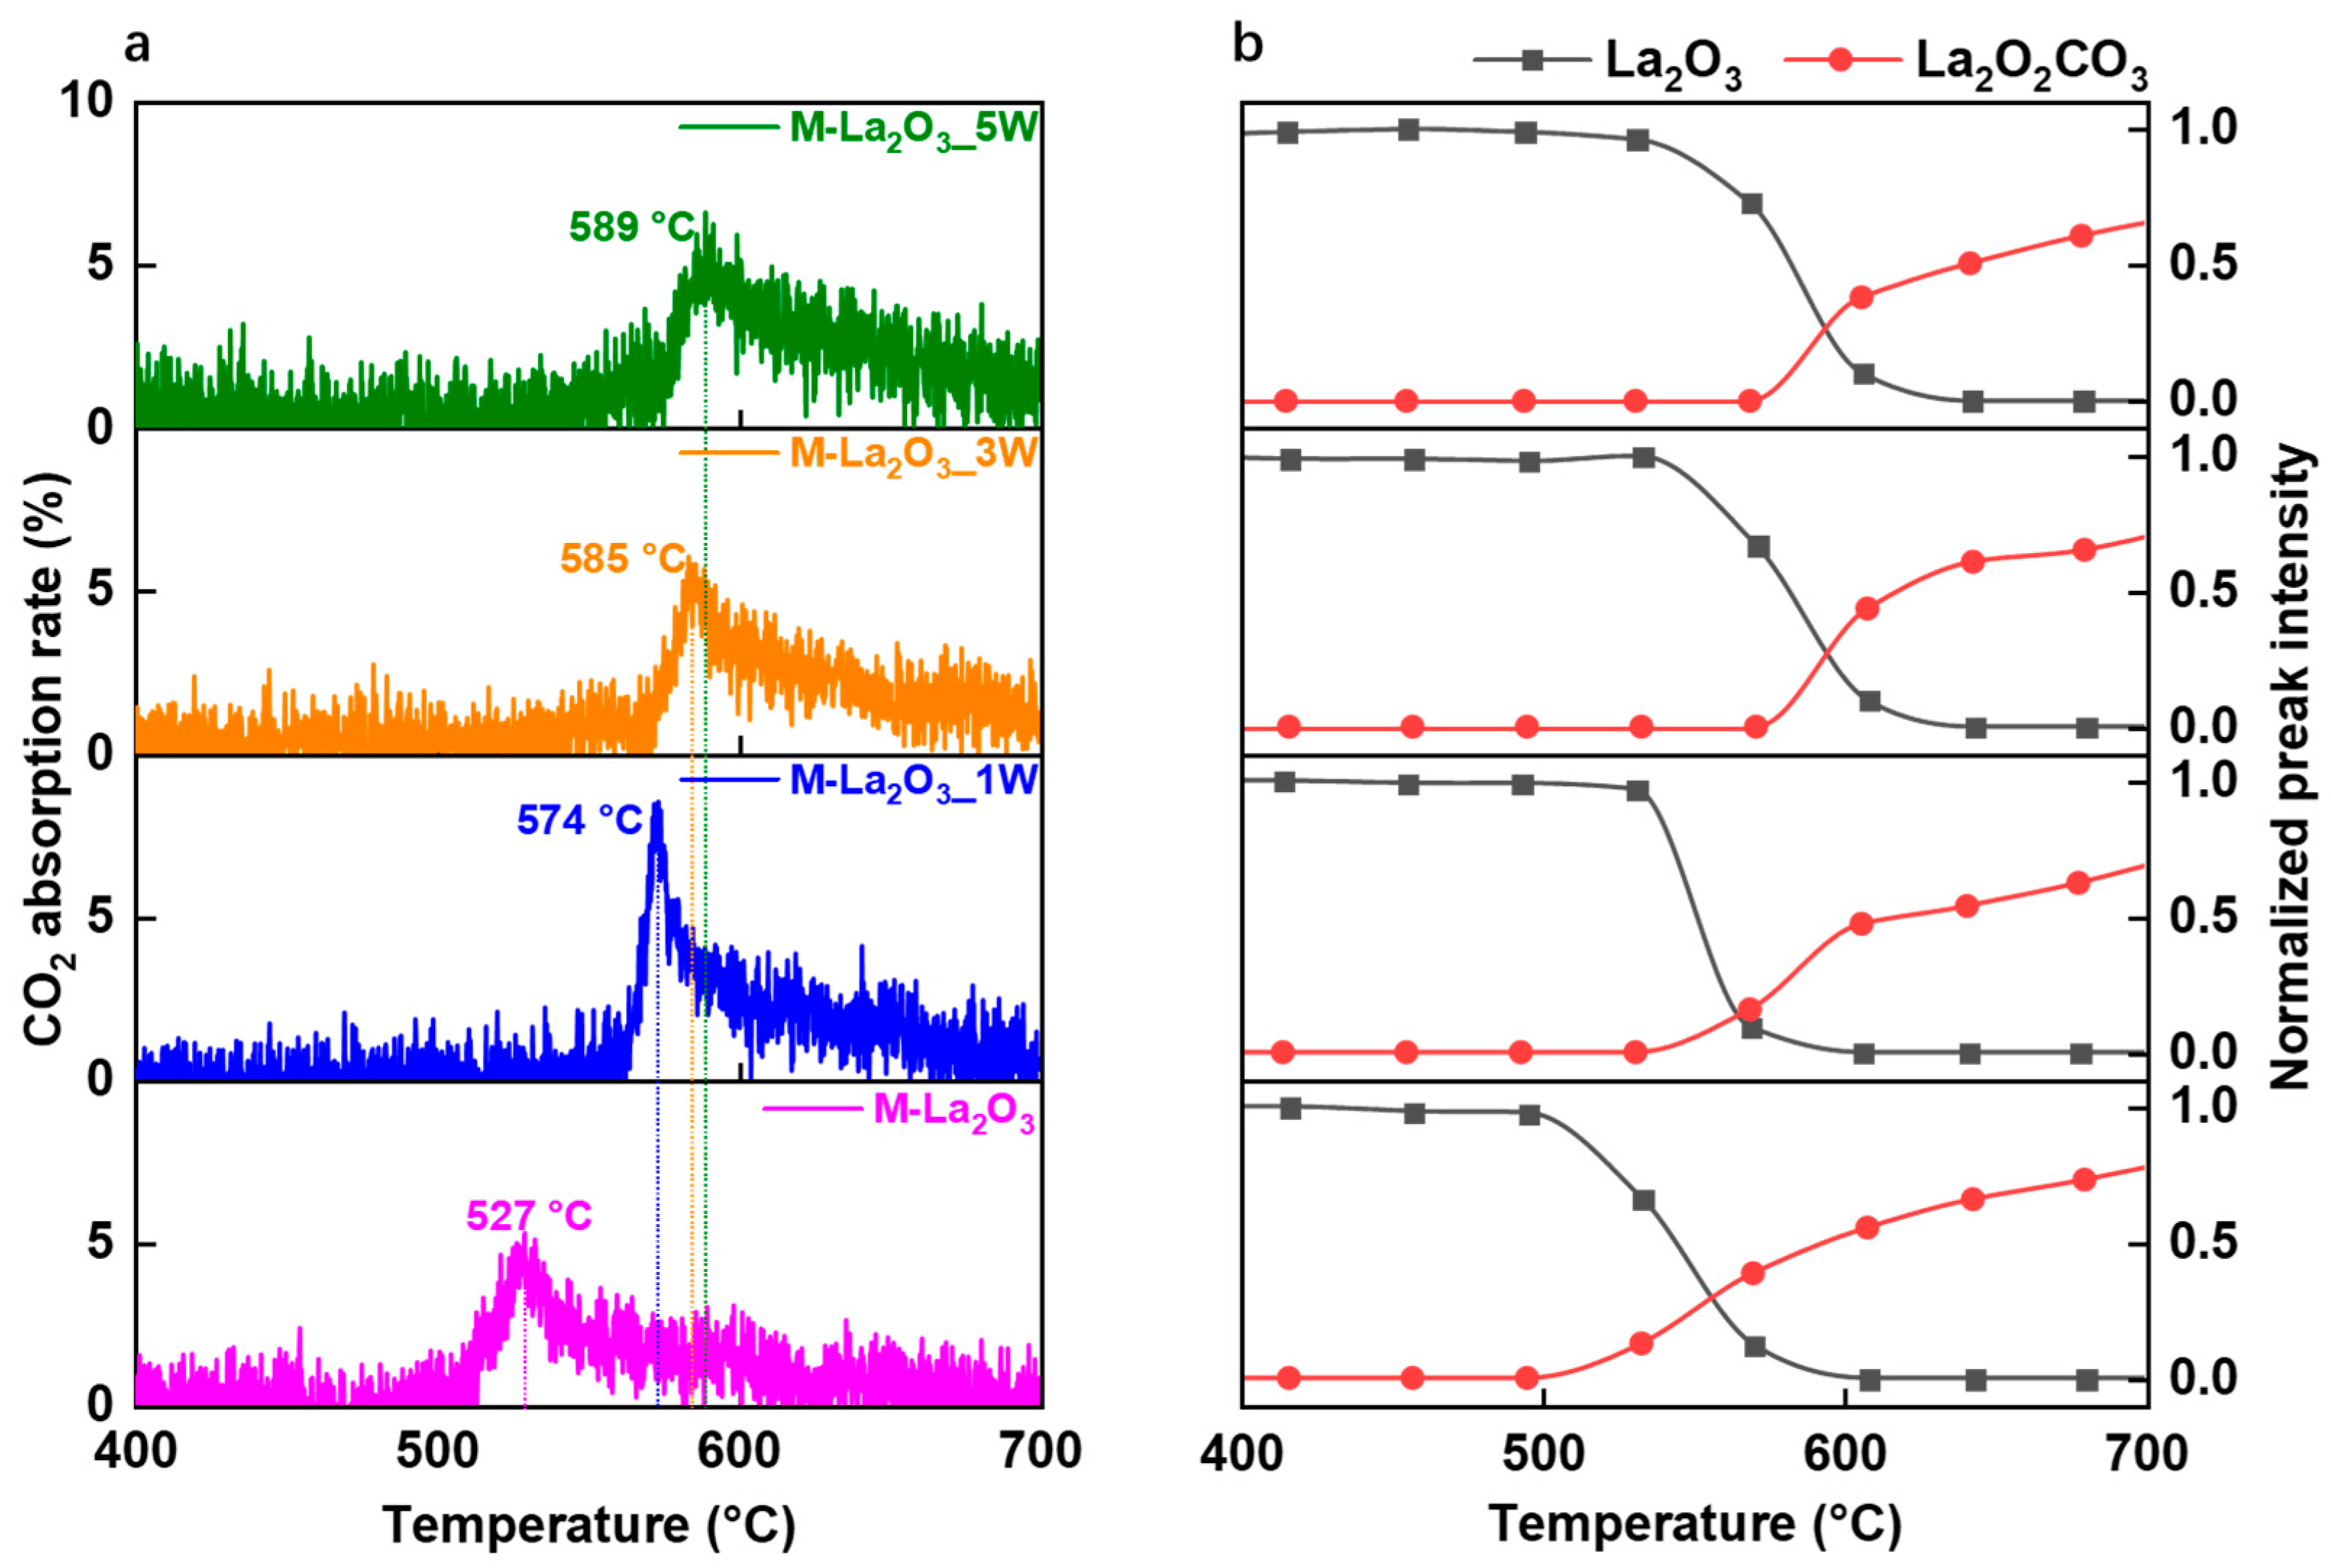
Complete carbonation over the M-La2O3_nW samples with significant CO2 uptake (MS) and carbonate phase change can only be more easily detected under nearly 100% CO2 exposure. In this way, their CO2 adsorption behavior can be directly compared to the undoped M-La2O3 sample. The calibrated MS signal, presented as CO2 consumption percentage normalized to the input during the adsorption process, was plotted vs. real-time linear temperature profile, as illustrated in Figure 3a. The simultaneously obtained oxide to carbonate full phase change, represented by normalized intensities of La2O3 (011) at 30.1° and the La2O2CO3 (103) peak at 29.9°, is plotted in Figure 3b. In this series of measurements, as the temperature reaches 500 °C, the M-La2O3 sample initiates CO2 adsorption at approximately 510 °C, reaching its peak value at 527 °C. M-La2O3_1W sample initiates CO2 adsorption at 556 °C, reaching its peak at 574 °C. In comparison to M-La2O3, the temperature for CO2 adsorption is approximately 47 °C higher. M-La2O3_3W sample starts CO2 adsorption around 570 °C, with the maximum value achieved at 585 °C, which is about 14 °C higher than the 1% wt Na2WO4-doped La2O3 sample. M-La2O3_5W sample initiates CO2 adsorption at approximately 570 °C, reaching its maximum at 589 °C. For all four samples, after reaching 700 °C, CO2 adsorption saturated, reaching around zero rate. By integrating each online MS peak, the yielded total CO2 uptake molar amounts are 208, 265, 283, and 307 μmol for the M-La2O3, M-La2O3_1W, M-La2O3_3W, and M-La2O3_5W samples, respectively. As the sample loading is around 300 μmol (100 mg, with molar mass around 326 g/mol), this CO2 uptake represents almost full carbonation (CO2 uptake to La2O3 loading ratios are 68%, 86%, 92%, and 100%, respectively), which can be represented by the following equation:
La 2 O 3 + CO 2 La 2 O 2 CO 3
The result shows that adding Na2WO4 slightly raises the CO2 uptake amount, approaching a 1:1 molar ratio. In addition to the CO2 uptake amount increase, there is a noticeable increasing trend in the CO2 uptake peaking temperature. In the case of the three doped M-La2O3_nW samples, the CO2 adsorption temperature is 47 °C–62 °C higher than that of M-La2O3. Furthermore, at equal temperatures below 650 °C, the estimated adsorbed CO2 quantities in sequential of the four samples are as follows: M-La2O3 > 1% > 3% > 5%, revealing a singular positive dependent correlation with the increment in Na2WO4 doping (Figure S1). As a solid base, it may be expected that Na2WO4 add-on species will decrease the uptake temperature. But instead, it actually increases the temperature. It could be because Na2WO4 is only doped at an overall low level, not as the main component.
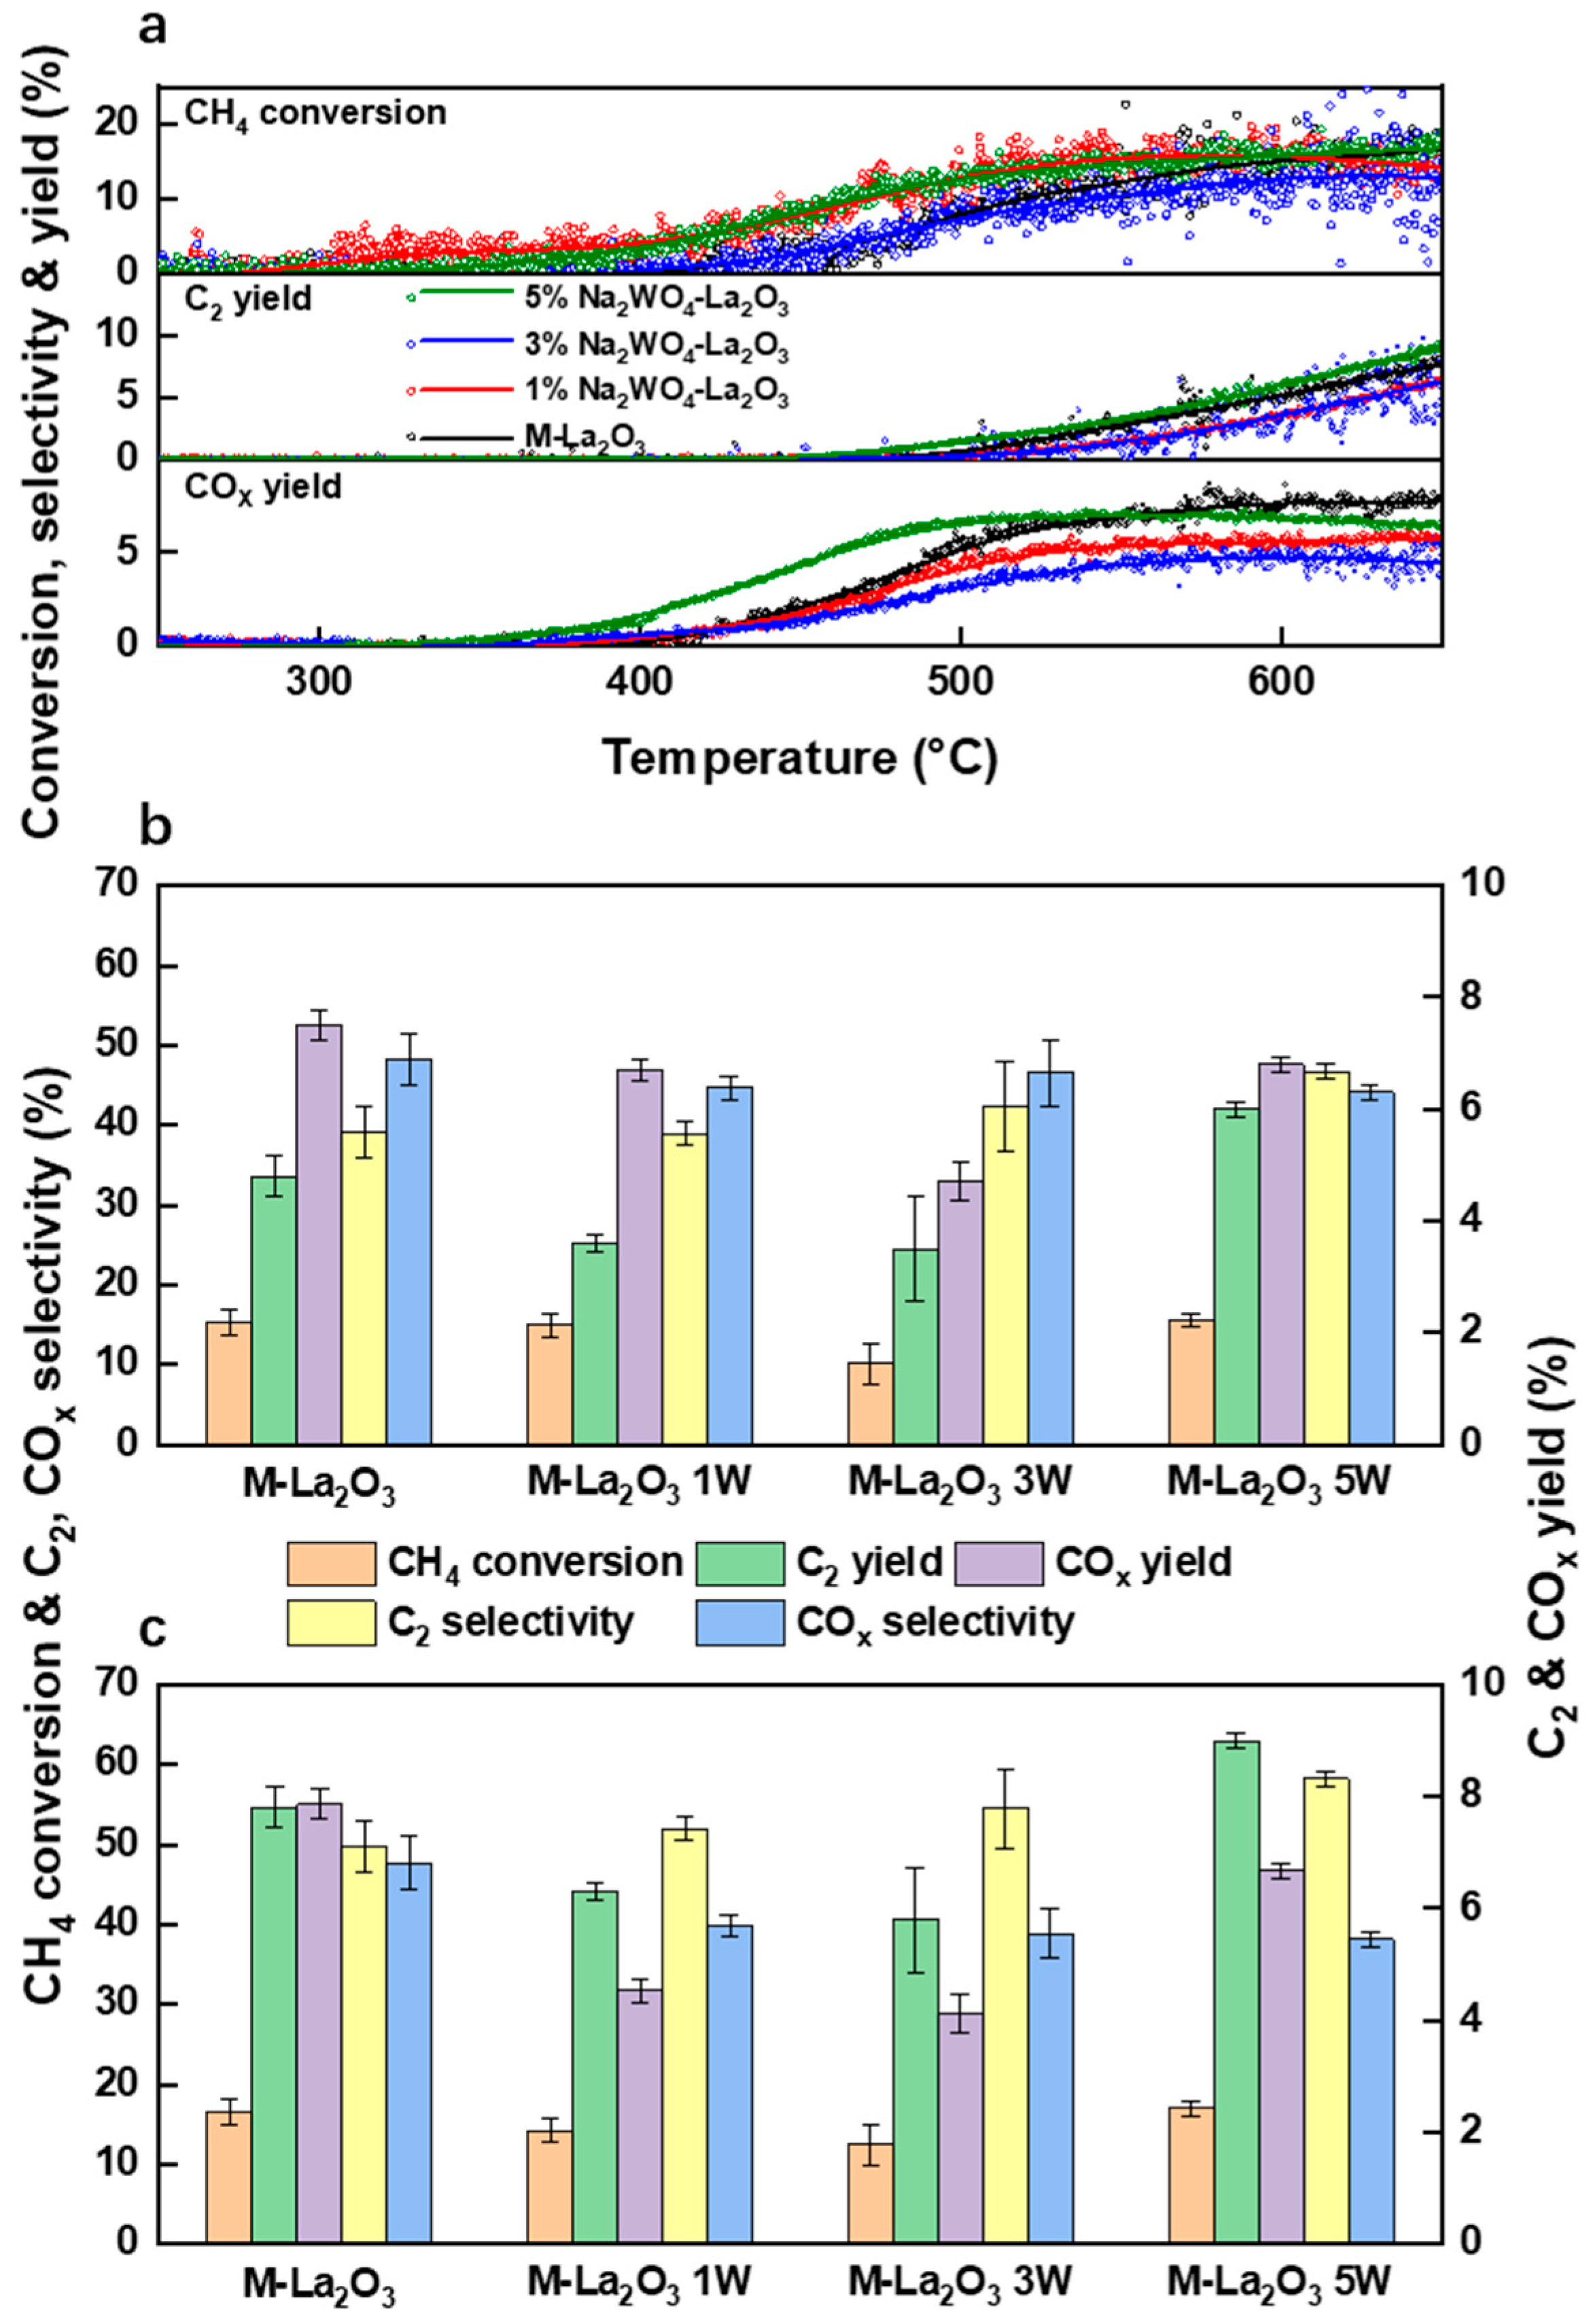
The preceding results have indicated that, in comparison to M-La2O3, the three doped La2O3 M-La2O3_nW catalysts display more resistance to CO2 adsorption. Based on this observation, OCM reactivity evaluation was conducted over these four samples in the microreactor. The exhaust gas from the reaction was collected for online MS analysis of C2 and COx products, and the reaction properties, including conversion, product yields, and selectivity, were extracted. All results are presented in Figure 4. Figure 4a reveals that the OCM reaction light-off temperature of M-La2O3 is higher than the other three samples and at low temperatures below 500 °C, conversion from this system is also the lowest. The CH4 conversion rate, C2 yield, C2 selectivity, and COx yield results at 600 °C and 650 °C are illustrated in the column charts of C2 yield and C2 activation temperature for the four samples, as depicted in Figure 4b,c. For all four samples, the C2 selectivity always shows a singular positive dependence on the Na2WO4 loading level. The CH4 conversion rates of M-La2O3, after its later light-off, increased faster than all the other systems to 17.8% at 650 °C, while the M-La2O3_1W and M-La2O3_3W are notably lower at 14.0% and 13.0%, respectively. The overall C2 product yields of M-La2O3_1W and M-La2O3_3W are also lower than that (7.8%) of M-La2O3, measuring 6.3% and 5.8%, respectively. However, the C2 selectivity of the undoped M-La2O3 remained below 50% and its excessive conversion mostly turned into unwanted COx by-products. For the two most important OCM evaluation properties, C2 yield and selectivity, the M-La2O3_5W surpasses the undoped M-La2O3 system from light-off to 650 °C, reaching 9% and 58.2%, respectively. The total CH4 conversion rate of M-La2O3_5W also rebounds to 17.3%. Consequently, tuning the Na2WO4 level doped on La2O3 shows a positive effect on the catalyst OCM performance, especially in the low-temperature region.
The C2 yield did directly increase as the loading of Na2WO4 on the catalyst increased. However, there is an obvious singular dependence between the light-off temperatures and the Na2WO4 doping level on M-La2O3, which is plotted in Figure 5. For C2 products, light-off temperature of M-La2O3 is 481 °C, while those of the M-La2O3_1W, M-La2O3_3W, and M-La2O3_5W samples are 475 °C, 460 °C, and 415 °C, respectively. The light-off temperatures of COx also have the same dependence but are all around 70 °C lower. These two significant decreasing trends vs. the Na2WO4 doping level clearly contrast the reversed trend of CO2 adsorption uptake temperature. As mentioned in the introduction, CO2 adsorption results in carbonate formation, which poisons the active oxygen sites. In OCM, CO2 is the main by-product, which will cause sample carbonation as an autocatalysis process, especially with the high temperature of the reaction. The Na2WO4 doping will increase the catalyst resistance to carbonation under CO2 exposure, as already proved in Figure 3. For those doped samples, fewer catalyst surface sites will be poisoned by the CO2 products, and a significant reaction rate becomes sustainable at lower temperatures. As a result, doping La2O3 with Na2WO4 is a worthy approach to reduce the activation temperature of C2 products and achieve better low-temperature (<650 °C) OCM reaction activity as compared to traditional M-La2O3.

2.3. Differences in Carbonate Bulk Phase between Doped and Undoped Samples

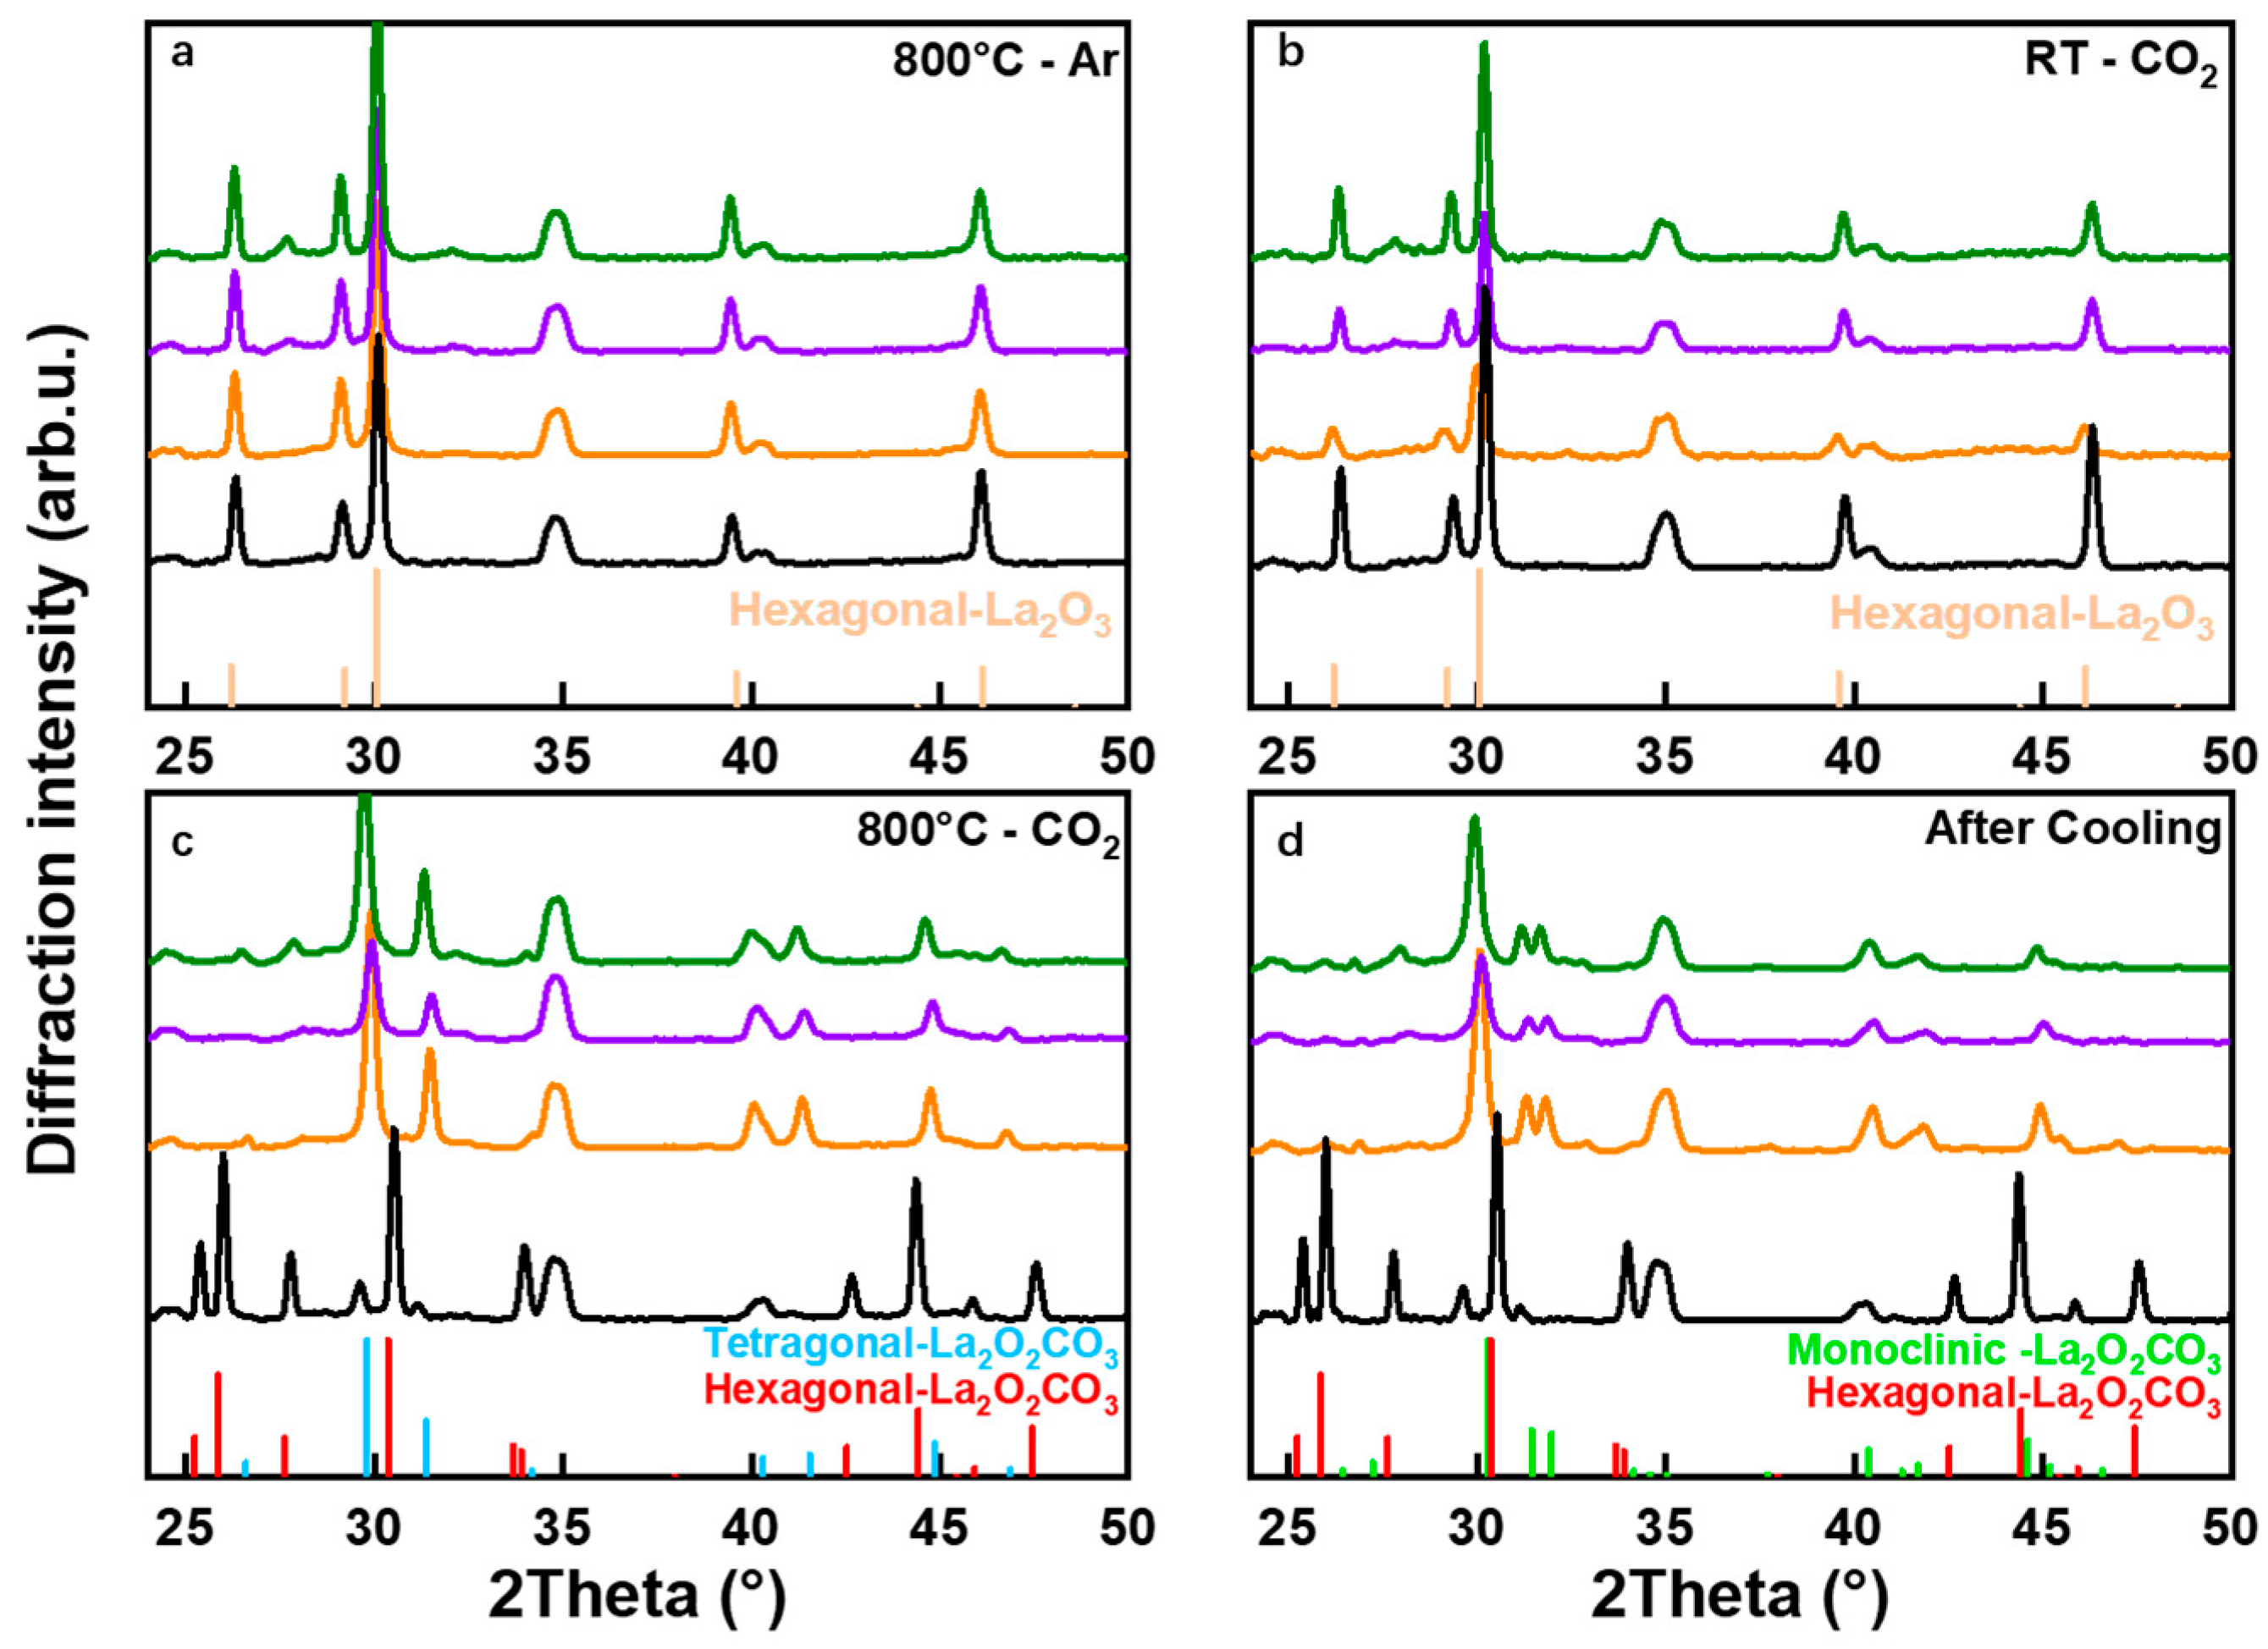
During the CO2 uptake measurements by online MS, simultaneous in situ time-resolved XRD experiments were performed to validate phase changes under CO2 exposure during linear heating on the three doped M-La2O3_nW samples and undoped M-La2O3. The wide range full-scan in situ XRD patterns were collected immediately after the specific treatment, as illustrated in Figure 5. The diffraction peak angle at high temperature (Figure 5a) exhibits a 2θ decrease of 0.18° from the room temperature (Figure 1) due to lattice thermal expansion. After the sample cooled down, direct exposure to CO2 (99% balanced with 1% Ar) at room temperature did not change (Figure 5b) the bulk structure so there was no bulk CO2 uptake. Figure 5c demonstrates the M-La2O3_nW samples under CO2 exposure at 800 °C and the bulk phase completely converted to La2O2CO3. Interestingly, the dioxymonocarbonates formed in M-La2O3_nW samples evidently exhibit a tetragonal La2O2CO3 crystal phase, as can be directly compared with the PDF database plotted in the same figure. After cooling to room temperature, all three tetragonal La2O2CO3 phases transformed into monoclinic La2O2CO3 (Figure 5d), characterized by the single diffraction peak at 31.5° splitting into two peaks at 2θ = 30.7° and 31.3°. On the other hand, the undoped M-La2O3 after complete carbonate formation only shows a hexagonal phase, either at high or room temperature, which was identical to our previous published results [11,35]. The results suggest that this phase change to tetragonal structure dioxymonocarbonate is strongly correlated to the high resistance to CO2 adsorption.
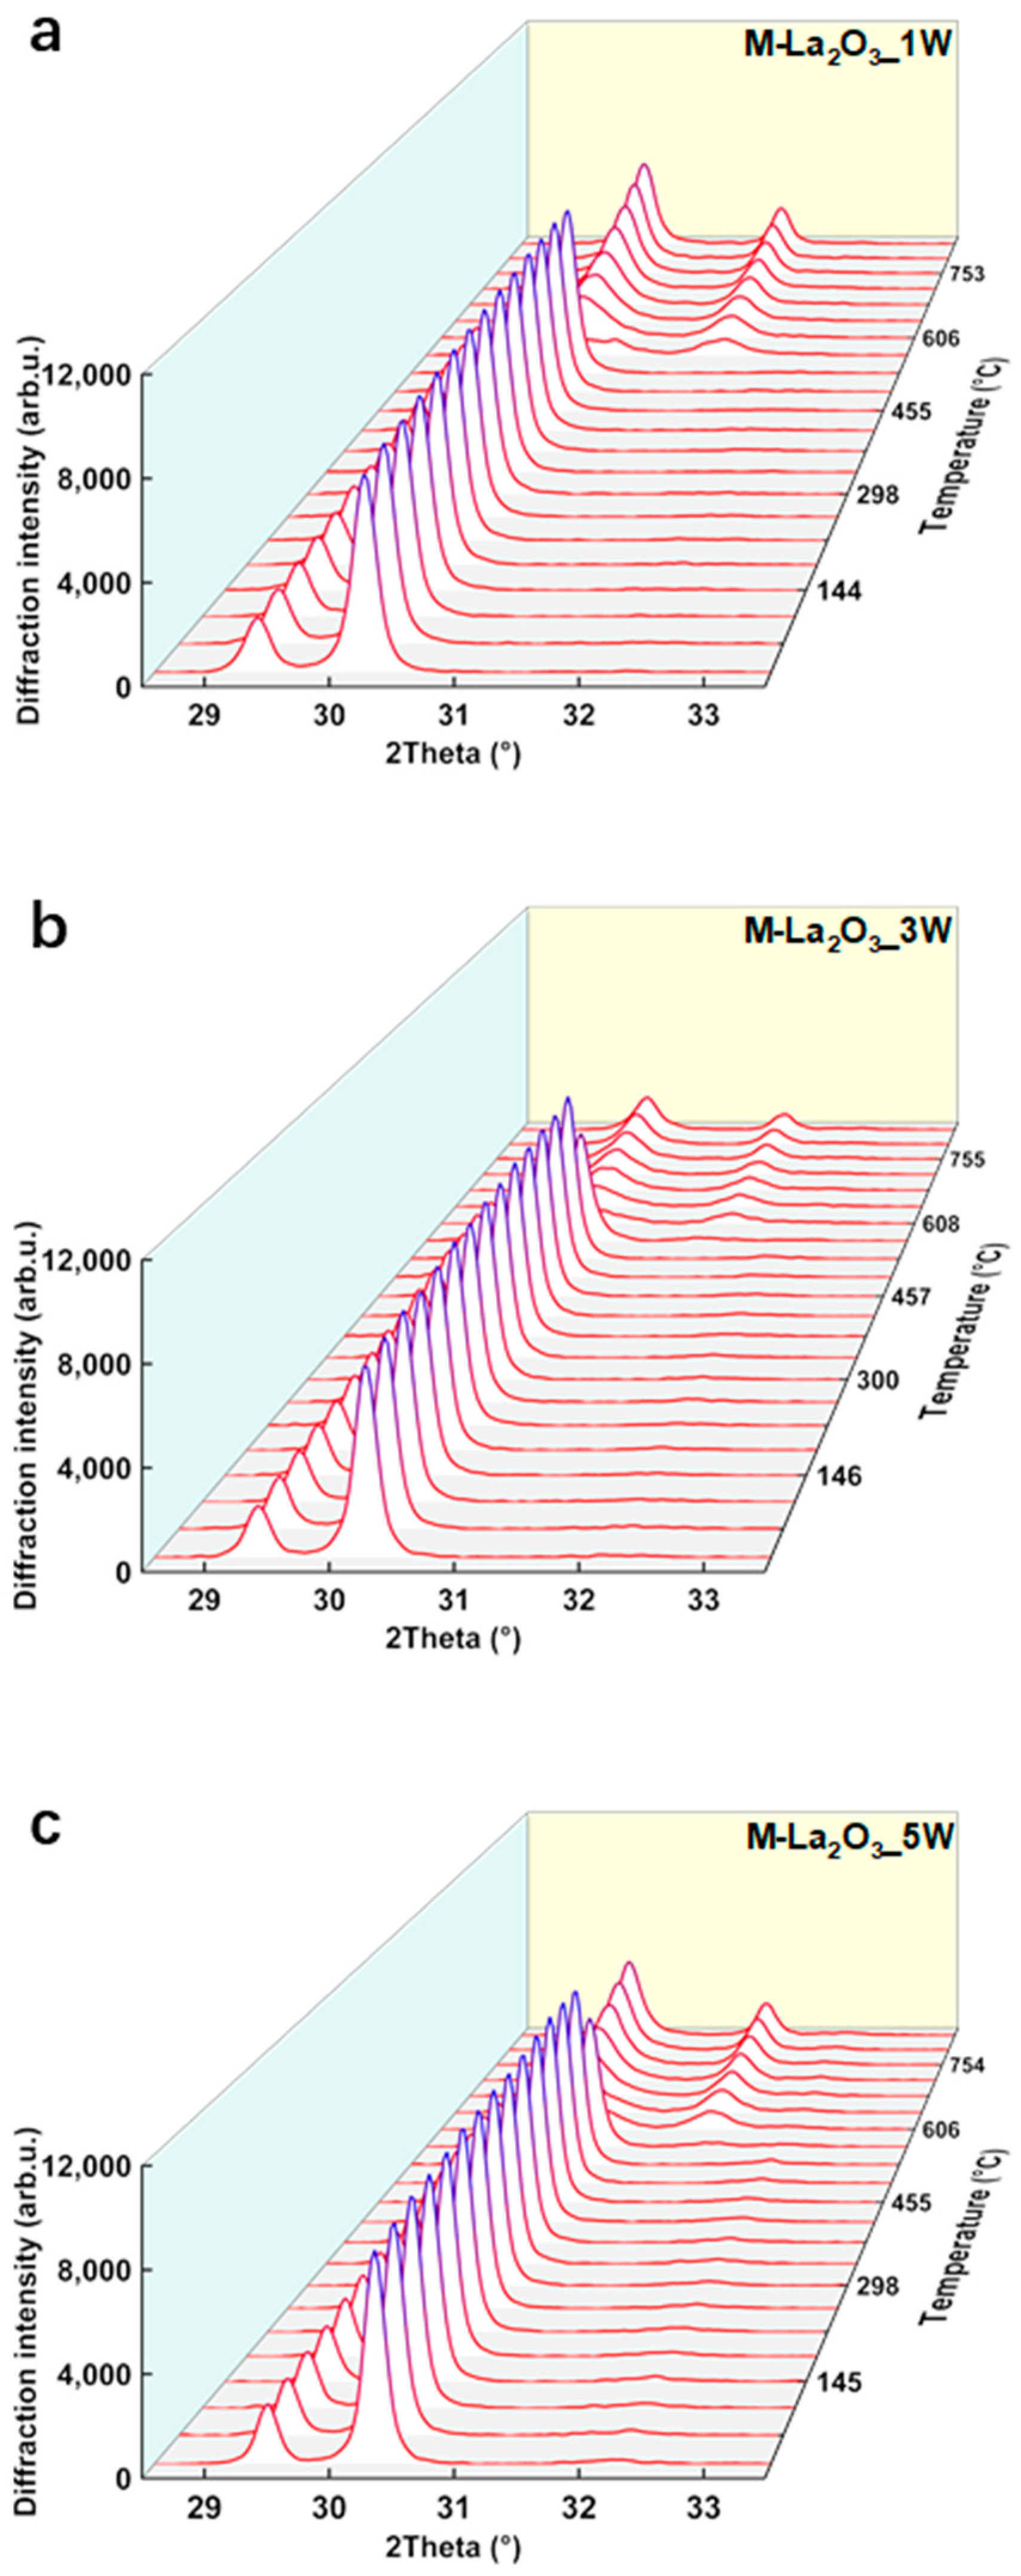
The time-resolved XRD rapid scan collected during the heating of the M-La2O3_nW samples in the CO2 flow is plotted in Figure 6a–c. These data are collected simultaneously with the online MS data collected in Figure 3. The 28.5~33.5° window perfectly captured the phase change from hexagonal La2O3 to tetragonal La2O2CO3 as it covers the characteristic peaks of La2O3 (011) at 30.1° and the La2O2CO3 (103) and (110) peaks at around 29.9 and 31.5°, respectively. As explained in Section 2.2, the phase change temperature can only be more roughly estimated as the scan time resolution sets a low limit of the temperature range of each scan at 38 °C. However, it still indicates that the higher doped M-La2O3_3W and M-La2O3_5W samples have a phase change temperature (570–606 °C) higher than that of the lower doped M-La2O3_1W sample (530–570 °C). It can also be noted from this figure that the phase change temperature difference is within 38 °C. This phase change temperature result agrees with the MS analysis results on the CO2 uptake temperature of the four samples.
Previous research also indicates that after complete carbonation, the M-La2O3 sample only shows a uniform hexagonal phase. The tetragonal/monoclinic phase carbonates formation could be found on M-La2O3, but only after a partial phase change, which can be controlled by heating in low CO2 concentration (<30%) to 600 °C for a limited time [35]. On the other hand, the nanorod La2O3 catalyst, with a higher low-temperature OCM reactivity compared to the M-La2O3 catalyst, also formed tetragonal La2O2CO3 at high temperatures after carbonation and subsequently transformed into monoclinic La2O2CO3 crystal phase upon cooling to room temperature. In a word, after the M-La2O3 was doped with Na2WO4, its carbonate formation behavior became similar to the nanorod La2O3. The previous studies, based on the comparison between the nanorod La2O3 and M-La2O3 catalysts behavior, already suggest that the special tetragonal carbonate phase change correlates with the higher CO2 adsorption resistance. In this study, as the La2O3 materials are all the same for the four catalysts, the analysis data certainly strengthen this conclusion as it can be correlated as follows:
Tetragonal carbonate

CO2 adsorption/poisoning resistance

Low-temperature OCM activity
As a result, we strongly recommend that being able to form tetragonal carbonate is an experimental descriptor for a La2O3 catalyst with better low-temperature activity in OCM.

3. Materials and Methods

3.1. Catalyst Preparation

Through impregnation in Na2WO4 solution, La2O3 can be modified to obtain samples with diverse weight loading percentages. Both Na2WO4 (S859551, ≥98%) and commercial La2O3 (L812319, ≥99.99%, denoted as M-La2O3) were from Shanghai Macklin Biochemical Co., Ltd. (Shanghai, China). Previous BET measurement (Kr) of M-La2O3 yields a relatively low specific surface area of 3.4 m2 g−1 (56 μmol g−1 assuming lattice density of 1015 cm−2) [11]. Initially, 5, 10, and 15 mg of Na2WO4 were precisely weighed and introduced into separate 20 mL portions of deionized water. Subsequently, 495, 490, and 485 mg of La2O3 were gradually added to the solution under continuous magnetic stirring. The solution was fully dried at 70 °C for 24 h and then calcined at 800 °C in a muffle furnace for 4 h with a heating rate of 5 °C min−1. The contents of Na2WO4 were calculated to be 1%, 3%, and 5% wt, respectively (denoted as M-La2O3_nW, where n refers to the weight percentage of Na2WO4-loaded). The precipitation does not significantly change the BET surface area results and dispersion. All freshly prepared samples were characterized immediately. Prior to commencing the CO2 absorption and OCM experiment, the sample was pretreated at 800 °C in an Ar atmosphere for 30 min in the in situ XRD or online MS microreactors, which aims to prevent sample hydroxylation or carbonation before the introduction of experimental gases.

3.2. In Situ XRD-MS

The XRD employs the Bruker D8 Advance powder X-ray diffractometer equipped with a Cu K α target with a wavelength of λ = 0.154 nm (8.05 KeV). The in situ heating reaction cell (Anton Paar XRK 900) is capable of conducting testing at 900 °C and 10 bar. The specific information on the relevant equipment is mentioned in the literature, including the design of the reaction gas pathway and coupled online mass spectrometry [11]. Before further characterization, the loaded 0.1 g sample (~300 μmol) was heated in situ to 800 °C at a rate of 10 °C min−1 under a 20 sccm Ar airflow, followed by a 30 min dwelling at 800 °C. Previous studies [25,47] show that this treatment effectively depletes the bulk and surface impurities including hydroxyl and carbonates, leaving only purified La2O3.
For online CO2 adsorption uptake studies, once cooling back to room temperature, the sample was exposed to CO2-contained gas at 20 sccm. After a 20 min gas flushing, the XRD pattern was collected at room temperature with a step size of 0.02° and a sensor exposure time of 1.5 s, spanning from 15 to 60°. Subsequently, the temperature was raised from room temperature to 800 °C at a rate of 10 °C min−1, and the XRD pattern at 800 °C was collected using the same parameters. During the heating process, the continuous fast scanning XRD patterns were collected in the range of 28.5~33.5 °, with a step size of 0.05 ° and a sensor exposure time of 1.0 s each for M-La2O3_nW samples, totally 100 s for each scan. The hardware still requires extra time after each scan to re-calibrate the initial alignment of the arms; so for the linear heating at the rate of 10 °C min−1, each scan covers a temperature variation of about 38 °C. The custom-designed coupled online mass spectrometry system (SRS RGA 200) collects real-time data of the exhaust gas released from the XRD in situ reaction cell during the heating process using capillary tubes [48]. In situ XRD-MS measurements were performed with two CO2 input conditions, 10% and nearly 100% (99% CO2 balanced with 1% Ar). The 10% condition is close to the practical CO2 concentration under real OCM reaction conditions above 400 °C. The nearly 100% condition makes it easier to capture full phase change from La2O3 to La2O2CO3 as shown in the data results section. Due to the inability of mass spectrometry to detect the consumption of pure gas uptake signal, such as 100% CO2, 1% Ar gas was mixed with 99% CO2 for labeling. In this way, accompanied by the CO2 partial consumption in an adsorption process, mass spectrometry will detect the partial pressure increase in the Ar signal from the sampled mixture. The relative CO2 uptake ratio thus can be re-calibrated from the Ar signal change.
The grain size on a specific face in the XRD result was calculated by Debye–Scherrer Formula:
D   ( nm ) = K   ·   γ B   ·   cos θ
where K in Equation (2) is 0.89 for the (100) face, which is calculated using the FWHM of the diffraction peak.

3.3. Online MS Microreactor

OCM reaction kinetics data for all samples were obtained using a specialized online mass spectrometry (MS) microreactor designed to operate under high-temperature and high-pressure conditions. The sample was sealed in a ¼-inch quartz tube using sealing rings and sleeves to ensure airtightness. The gas manifold offers diverse reaction input options, enabling real-time online sampling and gas characterization via a mass spectrometer (Pfeiffer PrismaPlus). More detailed information about the experimental setup is described in our previous publications [49].
For online OCM reactivity evaluation, 0.1 g samples were loaded in the center of quartz tubes plugged with quartz wool on both ends. Before the OCM reaction, the sample undergoes calcination in Ar up to 800 °C to eliminate carbonates and hydroxides. After a 15 min OCM reaction gas (CH4:O2:Ar = 5:1:4, GHSV = 8000 mL·h−1 gcat−1) purging at room temperature, the reactor is linearly heated to 740 °C at a rate of 10 °C min−1. The CH4 conversion rate, C2 selectivity, and yields of C2 and COx are calculated by the following equation, derived from carbon balance:
Conversion % = C H 4   input [ C H 4   out ] [ CH 4   input ]   ×   100
the selectivity of the product is determined using the following equation:
Selectivity % = n · Product [ CH 4   converted ]   ×   100
the yield of the product is determined using the following equation:
Yield % = n · Product [ CH 4   input ]   × 100
where n in Equations (4) and (5) is the carbon number of the product molecules.
The TOF of the product is estimated using the following equation:
TOF s 1 = Activity a · S = Yield · [ C H 4   i n p u t ] m · a · S
where a is the surface La atom density on the (001) surface of La2O3, which is calculated in average one La atom per 0.134 nm2 (about 7.5 × 1014 cm−2), applying the La2O3 (001) surface model; S is the specific surface area acquired from BET measurement (3.4 m2/g). The product of a · S yields the catalyst surface La site density of 42 μmol/gcat; m is the loading quality of the sample; yield is calculated by Equation (5).

3.4. XPS Measurement

The XPS surface analysis is performed utilizing a ThermoFischer ESCALAB 250Xi photoelectron spectrometer, applying monochromatic X-ray irradiation AlKα (hv = 1486.7 eV) and using a 180° double-focusing hemispherical analyzer with a six-channel detector. For each sample, C 1s, O 1s, La 3d, La 4d, W 4d, W 4f, and Na 1s core level spectra are collected with 30 eV pass energy and 0.1 eV step. The survey XPS scans are monitored as well to demonstrate no impurities on the sample surfaces. The binding energy scale of the collected spectra is calibrated to the adventitious carbon C 1 s peak at 284.8 eV. The atomic percentages for W and La are calculated from the corresponding photoelectron peaks after background subtraction taking into account transmission function and atomic sensitivity factors.

4. Conclusions

The carbonation behavior of La2O3 catalysts, as an inherent phenomenon during the OCM reaction process, is studied and correlated with OCM activity. This study carried out a comprehensive investigation of the bulk structure and kinetic analysis of CO2 adsorption on M-La2O3_nW catalysts. The CO2 kinetic adsorption curve indicated that an elevated Na2WO4 doping level raised the temperature at which CO2 absorption occurred, at least 46 °C higher than that of commercial La2O3. These results suggest that Na2WO4-doped La2O3 is more difficult to form La2O2CO3. Furthermore, online MS results indicated that at low temperatures (650 °C), the M-La2O3_nW catalyst exhibited higher C2 yield, and C2 selectivity, and produced less CO2 compared to commercial La2O3. In situ XRD-MS results also revealed that with Na2WO4 doped on the M-La2O3_nW catalyst, CO2 induced transform into tetragonal La2O2CO3 after high-temperature CO2 treatment. This behavior diverges from the hexagonal carbonation pattern observed in undoped M-La2O3 at elevated temperatures. The results correlate the tetragonal La2O2CO3 formation upon CO2 exposure to higher resistance to CO2 poisoning and better low-temperature OCM activity. Coupled the XRD measurement with simultaneous kinetic analysis of CO2 adsorption, this observation provides a novel approach for the enhancement of La2O3 catalysts through structure descriptor obtained from in situ characterization associated with real-time activity.

Supplementary Materials

The following supporting information can be downloaded at https://www.mdpi.com/article/10.3390/catal14020150/s1, Figure S1: The process of total CO2 adsorption of four samples in Figure 2 as a function of temperature; Figure S2: Plots of the standard deviation and mean absolute deviation between the (a) CH4 conversion, (b) C2 yield, and (c) COx yield discrete data and the fitting curves in Figure 3. The purple area is the standard deviation range for each set of data; Figure S3: (a) In situ XRD and (b) online MS result of CO2 uptake on M-La2O3_5W with 10% CO2-Ar (20 sccm), sample loading is 0.10 g; Figure S4: The C2, COx activity, and TOF calculated from Figure 3. Each TOF line has been normalized by a specific surface area.

Author Contributions

Conceptualization, D.W. and Y.Y.; methodology, D.W.; validation, J.L. and Y.Y.; formal analysis, J.L. and Y.Y.; data curation, D.W., Z.Q. and N.D.; writing—original draft preparation, D.W.; writing—review and editing, D.W., J.L. and Y.Y.; supervision, Y.Y.; project administration, Y.Y.; funding acquisition, Y.Y. All authors have read and agreed to the published version of the manuscript.

Funding

This research was funded by the National Key R&D Program of China (No. 2023YFB4005200), the National Natural Science Foundation of China (Nos 22272107, 22072092 and 92045301), support of all rental instrumentation from Analytical Instrumentation Center (contract no. SPST-AIC10112914), SPST, ShanghaiTech University, and cooperation from the Ministry of Science and Technology (National key R&D Program of China No. 2022YFA1503802).

Data Availability Statement

The original contributions presented in the study are included in the article/supplementary material, further inquiries can be directed to the corresponding author.

Conflicts of Interest

The authors declare no conflicts of interest.

References

  1. Geyer, R.; Jambeck, J.R.; Law, K.L. Production, use, and fate of all plastics ever made. Sci. Adv. 2017, 3, e1700782. [Google Scholar] [CrossRef]
  2. Lunsford, J.H. The catalytic oxidative coupling of methane. Angew. Chem. Int. Ed. 1995, 34, 970–980. [Google Scholar] [CrossRef]
  3. Lunsford, J.H. Catalytic conversion of methane to more useful chemicals and fuels: A challenge for the 21st century. Catal. Today 2000, 63, 165–174. [Google Scholar] [CrossRef]
  4. Schwach, P.; Pan, X.; Bao, X. Direct conversion of methane to value-added chemicals over heterogeneous catalysts: Challenges and prospects. Chem. Rev. 2017, 117, 8497–8520. [Google Scholar] [CrossRef] [PubMed]
  5. Godini, H.; Gili, A.; Görke, O.; Arndt, S.; Simon, U.; Thomas, A.; Schomäcker, R.; Wozny, G. Sol–gel method for synthesis of Mn–Na2WO4/SiO2 catalyst for methane oxidative coupling. Catal. Today 2014, 236, 12–22. [Google Scholar] [CrossRef]
  6. Kuo, J.; Kresge, C.; Palermo, R. Evaluation of direct methane conversion to higher hydrocarbons and oxygenates. Catal. Today 1989, 4, 463–470. [Google Scholar] [CrossRef]
  7. Pirro, L.; Mendes, P.S.; Paret, S.; Vandegehuchte, B.D.; Marin, G.B.; Thybaut, J.W. Descriptor–property relationships in heterogeneous catalysis: Exploiting synergies between statistics and fundamental kinetic modelling. Catal. Sci. Technol. 2019, 9, 3109–3125. [Google Scholar] [CrossRef]
  8. Zavyalova, U.; Holena, M.; Schlögl, R.; Baerns, M. Statistical analysis of past catalytic data on oxidative methane coupling for new insights into the composition of high-performance catalysts. ChemCatChem 2011, 3, 1935–1947. [Google Scholar] [CrossRef]
  9. Keller, G.; Bhasin, M. Synthesis of ethylene via oxidative coupling of methane: I. Determination of active catalysts. J. Catal. 1982, 73, 9–19. [Google Scholar] [CrossRef]
  10. Kondratenko, E.V.; Peppel, T.; Seeburg, D.; Kondratenko, V.A.; Kalevaru, N.; Martin, A.; Wohlrab, S. Methane conversion into different hydrocarbons or oxygenates: Current status and future perspectives in catalyst development and reactor operation. Catal. Sci. Technol. 2017, 7, 366–381. [Google Scholar] [CrossRef]
  11. Guan, C.; Yang, Y.; Pang, Y.; Liu, Z.; Li, S.; Vovk, E.I.; Zhou, X.; Li, J.P.H.; Zhang, J.; Yu, N. How CO2 poisons La2O3 in an OCM catalytic reaction: A study by in situ XRD-MS and DFT. J. Catal. 2021, 396, 202–214. [Google Scholar] [CrossRef]
  12. Liu, Z.; Ho Li, J.P.; Vovk, E.; Zhu, Y.; Li, S.; Wang, S.; van Bavel, A.P.; Yang, Y. Online kinetics study of oxidative coupling of methane over La2O3 for methane activation: What is behind the distinguished light-off temperatures? ACS Catal. 2018, 8, 11761–11772. [Google Scholar] [CrossRef]
  13. Luo, L.; Tang, X.; Wang, W.; Wang, Y.; Sun, S.; Qi, F.; Huang, W. Methyl radicals in oxidative coupling of methane directly confirmed by synchrotron VUV photoionization mass spectroscopy. Sci. Rep. 2013, 3, 1625. [Google Scholar] [CrossRef]
  14. Bernal, S.; Diaz, J.; Garcia, R.; Rodriguez-Izquierdo, J. Study of some aspects of the reactivity of La2O3 with CO2 and H2O. J. Mater. Sci. 1985, 20, 537–541. [Google Scholar] [CrossRef]
  15. Hou, Y.-H.; Han, W.-C.; Xia, W.-S.; Wan, H.-L. Structure sensitivity of La2O2CO3 catalysts in the oxidative coupling of methane. ACS Catal. 2015, 5, 1663–1674. [Google Scholar] [CrossRef]
  16. Klingenberg, B.; Vannice, M.A. Influence of pretreatment on lanthanum nitrate, carbonate, and oxide powders. Chem. Mater. 1996, 8, 2755–2768. [Google Scholar] [CrossRef]
  17. Levan, T.; Che, M.; Tatibouet, J.; Kermarec, M. Infrared study of the formation and stability of La2O2CO3 during the oxidative coupling of methane on La2O3. J. Catal. 1993, 142, 18–26. [Google Scholar] [CrossRef]
  18. Mu, Q.; Wang, Y. Synthesis, characterization, shape-preserved transformation, and optical properties of La(OH)3, La2O2CO3, and La2O3 nanorods. J. Alloys Compd. 2011, 509, 396–401. [Google Scholar] [CrossRef]
  19. Turcotte, R.P.; Sawyer, J.O.; Eyring, L. Rare earth dioxymonocarbonates and their decomposition. Inorg. Chem. 1969, 8, 238–246. [Google Scholar] [CrossRef]
  20. Chu, C.; Zhao, Y.; Li, S.; Sun, Y. CO2 chemisorption and its effect on methane activation in La2O3-catalyzed oxidative coupling of methane. J. Phys. Chem. C 2016, 120, 2737–2746. [Google Scholar] [CrossRef]
  21. Chu, C.; Zhao, Y.; Li, S.; Sun, Y. Correlation between the acid–base properties of the La2O3 catalyst and its methane reactivity. Phys. Chem. Chem. Phys. 2016, 18, 16509–16517. [Google Scholar] [CrossRef]
  22. Li, X.; Zhao, Z.-J.; Zeng, L.; Zhao, J.; Tian, H.; Chen, S.; Li, K.; Sang, S.; Gong, J. On the role of Ce in CO2 adsorption and activation over lanthanum species. Chem. Sci. 2018, 9, 3426–3437. [Google Scholar] [CrossRef]
  23. Song, J.; Sun, Y.; Ba, R.; Huang, S.; Zhao, Y.; Zhang, J.; Sun, Y.; Zhu, Y. Monodisperse Sr–La2O3 hybrid nanofibers for oxidative coupling of methane to synthesize C2 hydrocarbons. Nanoscale 2015, 7, 2260–2264. [Google Scholar] [CrossRef] [PubMed]
  24. Fierro, J. Catalysis in C 1 chemistry: Future and prospect. Catal. Lett. 1993, 22, 67–91. [Google Scholar] [CrossRef]
  25. Zhou, X.; Pang, Y.; Liu, Z.; Vovk, E.I.; van Bavel, A.P.; Li, S.; Yang, Y. Active oxygen center in oxidative coupling of methane on La2O3 catalyst. J. Energy Chem. 2021, 60, 649–659. [Google Scholar] [CrossRef]
  26. Taylor, R.P.; Schrader, G.L. Lanthanum catalysts for methane oxidative coupling: A comparison of the reactivity of phases. Ind. Eng. Chem. Res. 1991, 30, 1016–1023. [Google Scholar] [CrossRef]
  27. Schmack, R.; Friedrich, A.; Kondratenko, E.V.; Polte, J.; Werwatz, A.; Kraehnert, R. A meta-analysis of catalytic literature data reveals property-performance correlations for the OCM reaction. Nat. Commun. 2019, 10, 441. [Google Scholar] [CrossRef]
  28. Lacombe, S.; Holmena, A.; Wolf, E.; Ducarme, V.; Moral, P.; Mirodatos, C. Isotopic exchange and volumetric studies on methane activation over rare-earth oxides. In Studies in Surface Science and Catalysis; Elsevier: Amsterdam, The Netherlands, 1994; Volume 81, pp. 211–216. [Google Scholar]
  29. Lacombe, S.; Zanthoff, H.; Mirodatos, C. Oxidative coupling of methane over lanthana catalysts: II. A mechanistic study using isotope transient kinetics. J. Catal. 1995, 155, 106–116. [Google Scholar] [CrossRef]
  30. Yide, X.; Lin, Y.; Xiexian, G. Effect of basicity and adding CO2 in the feed on the oxidative coupling of methane over K2O and SrO promoted La2O3/ZnO catalysts. Appl. Catal. A Gen. 1997, 164, 47–57. [Google Scholar] [CrossRef]
  31. Choudhary, V.R.; Mulla, S.A.; Uphade, B.S. Oxidative coupling of methane over supported La2O3 and La-promoted MgO catalysts: Influence of catalyst− support interactions. Ind. Eng. Chem. Res. 1997, 36, 2096–2100. [Google Scholar] [CrossRef]
  32. Choudhary, V.R.; Uphade, B.S.; Mulla, S.A. Oxidative coupling of methane over a Sr-promoted La2O3 catalyst supported on a low surface area porous catalyst carrier. Ind. Eng. Chem. Res. 1997, 36, 3594–3601. [Google Scholar] [CrossRef]
  33. Huang, P.; Zhao, Y.; Zhang, J.; Zhu, Y.; Sun, Y. Exploiting shape effects of La2O3 nanocatalysts for oxidative coupling of methane reaction. Nanoscale 2013, 5, 10844–10848. [Google Scholar] [CrossRef]
  34. Jiang, T.; Song, J.; Huo, M.; Yang, N.; Liu, J.; Zhang, J.; Sun, Y.; Zhu, Y. La2O3 catalysts with diverse spatial dimensionality for oxidative coupling of methane to produce ethylene and ethane. RSC Adv. 2016, 6, 34872–34876. [Google Scholar] [CrossRef]
  35. Guan, C.; Liu, Z.; Wang, D.; Zhou, X.; Pang, Y.; Yu, N.; van Bavel, A.P.; Vovk, E.; Yang, Y. Exploring the formation of carbonates on La2O3 catalysts with OCM activity. Catal. Sci. Technol. 2021, 11, 6516–6528. [Google Scholar] [CrossRef]
  36. Arndt, S.; Otremba, T.; Simon, U.; Yildiz, M.; Schubert, H.; Schomäcker, R. Mn–Na2WO4/SiO2 as catalyst for the oxidative coupling of methane. What is really known? Appl. Catal. A Gen. 2012, 425, 53–61. [Google Scholar] [CrossRef]
  37. Beck, B.; Fleischer, V.; Arndt, S.; Hevia, M.G.; Urakawa, A.; Hugo, P.; Schomäcker, R. Oxidative coupling of methane—A complex surface/gas phase mechanism with strong impact on the reaction engineering. Catal. Today 2014, 228, 212–218. [Google Scholar] [CrossRef]
  38. Fang, X.; Li, S.; Gu, J.; Yang, D. Preparation and characterization of W-Mn catalyst for oxidative coupling of methane. J. Mol. Catal. 1992, 6, 255–261. [Google Scholar]
  39. Fang, X.; Li, S.; Lin, J.; Chu, Y. Oxidative coupling of methane on W-Mn catalysts. J. Mol. Catal. 1992, 6, 427–433. [Google Scholar]
  40. Fleischer, V.; Steuer, R.; Parishan, S.; Schomäcker, R. Investigation of the surface reaction network of the oxidative coupling of methane over Na2WO4/Mn/SiO2 catalyst by temperature programmed and dynamic experiments. J. Catal. 2016, 341, 91–103. [Google Scholar] [CrossRef]
  41. Si, J.; Zhao, G.; Sun, W.; Liu, J.; Guan, C.; Yang, Y.; Shi, X.R.; Lu, Y. Oxidative Coupling of Methane: Examining the Inactivity of the MnOx-Na2WO4/SiO2 Catalyst at Low Temperature. Angew. Chem. Int. Ed. 2022, 61, e202117201. [Google Scholar] [CrossRef] [PubMed]
  42. Wang, P.; Zhao, G.; Wang, Y.; Lu, Y. MnTiO3-driven low-temperature oxidative coupling of methane over TiO2-doped Mn2O3 − Na2WO4/SiO2 catalyst. Sci. Adv. 2017, 3, e1603180. [Google Scholar] [CrossRef] [PubMed]
  43. Zou, S.; Li, Z.; Zhou, Q.; Pan, Y.; Yuan, W.; He, L.; Wang, S.; Wen, W.; Liu, J.; Wang, Y. Surface coupling of methyl radicals for efficient low-temperature oxidative coupling of methane. Chin. J. Catal. 2021, 42, 1117–1125. [Google Scholar] [CrossRef]
  44. Werny, M.J.; Wang, Y.; Girgsdies, F.; Schlögl, R.; Trunschke, A. Fluctuating storage of the active phase in a Mn − Na2WO4/SiO2 catalyst for the oxidative coupling of methane. Angew. Chem. Int. Ed. 2020, 59, 14921–14926. [Google Scholar] [CrossRef]
  45. Ho, S.-F.; Contarini, S.; Rabalais, J. Ion-beam-induced chemical changes in the oxyanions (MOyn−) and oxides (MOx) where M = chromium, molybdenum, tungsten, vanadium, niobium and tantalum. J. Phys. Chem. 1987, 91, 4779–4788. [Google Scholar] [CrossRef]
  46. Zhou, X.; Vovk, E.I.; Liu, Y.; Guan, C.; Yang, Y. An In Situ Temperature-Dependent Study of La2O3 Reactivation Process. Front. Chem. 2021, 9, 694559. [Google Scholar] [CrossRef]
  47. Li, J.P.H.; Zhou, X.; Pang, Y.; Zhu, L.; Vovk, E.I.; Cong, L.; van Bavel, A.P.; Li, S.; Yang, Y. Understanding of binding energy calibration in XPS of lanthanum oxide by in situ treatment. Phys. Chem. Chem. Phys. 2019, 21, 22351–22358. [Google Scholar] [CrossRef] [PubMed]
  48. Yang, Y.; Zebang, L.; Li, J.P.H.; Evgeny, V. Reaction Control and Mass Spectrometry Workstation for Coupling an X-ray Spectroscopic Characterization Instrument with an In-Situ Reaction Cell. U.S. Patent No. 11,435,301, 6 September 2022. [Google Scholar]
  49. Li, J.P.H.; Liu, Z.; Wu, H.; Yang, Y. Investigation of CO oxidation over Au/TiO2 catalyst through detailed temperature programmed desorption study under low temperature and Operando conditions. Catal. Today 2018, 307, 84–92. [Google Scholar] [CrossRef]
Figure 1. (a) In situ XRD patterns of M-La2O3 and M-La2O3_nW samples at RT compared with PDF database. The diffraction peak marked with a diamond is from the sample stage. (b) The W 4f (left) and La 3d5/2 (right) core level XPS spectra of M-La2O3_1W (black), 3W (green), and 5W (blue) samples calcined at 800 °C.
Catalysts 14 00150 g001
Figure 2. (a) In situ XRD and (b) online MS result of CO2 uptake on M-La2O3_5W with 10% CO2-Ar (20 sccm); sample loading is 0.10 g.
Catalysts 14 00150 g002
Figure 3. (a) The calibrated MS signal presented as CO2 adsorption uptake rate results obtained from online MS and (b) the simultaneously obtained in situ XRD results of full phase change from normalized La2O3 (011) to La2O2CO3 (103) intensity over the four samples. The black and red lines represent the La2O3 and La2O2CO3 phase transitions.
Catalysts 14 00150 g003
Figure 4. (a) The OCM reactivity evaluation results of four M-La2O3_nW samples and the analysis of CH4 conversion, C2 yield, COx yield (right scale) and C2, COx selectivity in OCM at (b) 600 °C and (c) 650 °C. The discrete points in (a) mean the data directly from online MS results; the smoothed lines are the fitting lines obtained through the locally weighted regression.
Catalysts 14 00150 g004
Figure 5. In situ XRD patterns of four stages in CO2 treatment: (a) holding at 800 °C in Ar, (b) switching to CO2 at RT after cooling in Ar, (c) holding at 800 °C in CO2, and (d) cooling down to RT in CO2. The black, orange, purple and green curves represent M-La2O3, M-La2O3_1W, 3W, and 5W catalysts, respectively. The single diffraction peak at 34.8° represents impurities in the sample stage.
Catalysts 14 00150 g005
Figure 6. In situ XRD scanning results of M-La2O3: (a) 1W, (b) 3W, and (c) 5W, respectively, in 20 sccm CO2 from room temperature to 800 °C. Diffraction peak intensity change is contrasted by color gradient change (red to purple).
Catalysts 14 00150 g006
Table 1. W and La atomic percentages (other elements are not taken into consideration) for M-La2O3_1W, 3W, and 5W samples.
SAMPLESXPS
ATOMIC PERCENTAGES
XRD
WLaGrain Size (nm)
M-La2O3_1W0.899.227.12
M-La2O3_3W2.997.137.85
M-La2O3_5W4.295.839.33
Disclaimer/Publisher’s Note: The statements, opinions and data contained in all publications are solely those of the individual author(s) and contributor(s) and not of MDPI and/or the editor(s). MDPI and/or the editor(s) disclaim responsibility for any injury to people or property resulting from any ideas, methods, instructions or products referred to in the content.