Article

A CoFe Bimetallic Catalyst for the Direct Conversion of Syngas to Olefins

Key Laboratory of Low-Carbon Conversion Science and Engineering, Shanghai Advanced Research Institute, Chinese Academy of Sciences, Shanghai 201210, China
*
Authors to whom correspondence should be addressed.
Catalysts 2023, 13(12), 1472; https://doi.org/10.3390/catal13121472
Submission received: 17 October 2023 / Revised: 16 November 2023 / Accepted: 21 November 2023 / Published: 27 November 2023
(This article belongs to the Special Issue Nanotechnology in Catalysis, 2nd Edition)

Abstract

:
Syngas conversion is a useful technology for converting nonpetroleum carbon resources into chemicals such as olefins. Iron- and cobalt-based catalysts, as two major categories, have been extensively studied in Fischer–Tropsch synthesis to olefins (FTO) reactions. Although both iron and cobalt catalysts have shown distinct merits and shortcomings, they are also complementary in their properties and catalytic performances when combined with each other. Herein, Na-modified CoFe bimetallic catalysts were fabricated using a co-precipitation method. It was found that there was a synergistic effect between Co and Fe that promoted a CO dissociation rate and carburization, and an appropriate Co/Fe ratio was conducive to improvements in their catalytic performances. The desired olefins selectivity reached 66.1 C% at a CO conversion of 37.5% for a Co2Fe1 catalyst, while the methane selectivity was only 4.3 C%. In addition, no obvious deactivation was found after nearly 160 h, indicating their potential industrial application.

1. Introduction

Fischer–Tropsch synthesis (FTS) can convert syngas (a mixture of carbon monoxide and hydrogen) into valuable chemicals, such as paraffins, olefins, oxygenates, and so on, depending on the catalyst types and reaction conditions used [1,2,3]. Among these, olefins, including lower olefins (C2–4=) and higher olefins (C5+=), are very important products that can be used to synthesize various chemicals, such as lubricants, plastics, solvents, and drug intermediates [4,5,6,7]. The Fischer–Tropsch to olefins (FTO) reaction has become a promising technology due to its simplified reaction process and low energy consumption compared to the traditional “syngas-methanol–olefins” indirect route.
Promoted Fe-based catalysts have been used in Fischer–Tropsch synthesis to olefins (FTO) processes for a long time [8,9]. Torres Galvis et al. reported a supported Fe-based catalyst, and the selectivity of the lower olefins reached 61 C% at 340 °C and 20 bar [10,11,12]. Zhai et al. prepared an iron carbide catalyst modified by Zn and Na, and it demonstrated a high level of selectivity for olefins (up to 79%) at 340 °C and 20 bar [13]. Although Fe-based catalysts exhibit high olefin selectivity, the reaction temperatures are typically over 300 °C. Under these harsh conditions, particle sintering and carbon deposition on a catalyst’s surface easily occurs, leading to rapid catalyst deactivation.
For Co-based FTO catalysts, Zhong et al. reported on a Co2C nanoprism catalyst exhibiting high olefin selectivity in an FTO reaction [14]. The olefin selectivity reached 60.8 C%, while the CH4 selectivity was <5 C% at a mild condition (250 °C). Further characterization and theoretical simulation confirmed the exposed facet of (101) and (020) on the obtained Co2C nanoprisms, which greatly favored olefin production while restraining CH4 production. Subsequent works have displayed that Na and Mn could act as electronic and structural promoters, respectively, facilitating the formation of Co2C with special morphologies [15]. In addition, the reduction condition and cobalt-support interaction have significant impacts on the catalytic behaviors of Co2C-based catalysts.
Recently, researchers have been making efforts to build new types of FT catalysts that combine the merits of iron catalysts, which are known for their affordability, with cobalt catalysts, which are recognized for their high activity [16,17,18,19,20]. Yang et al. constructed a hetero-structured Fe5C2/Co dual-center low-temperature FTS catalyst [21]. Although the Fe5C2/Co catalyst had only 0.6% Co (Fe/Co = 12), its CO conversion increased by a factor of three compared to that of a pure Fe catalyst. Zhang et al. prepared a series of CoFe alloy catalysts that efficiently hydrogenated CO2 into jet-fuel-range hydrocarbons [22]. Gong et al. designed a CoFe alloy catalyst derived from an FeCo hydrotalcite precursor [23]. They observed the formation of (FexCoy)C with an abundant Co-Fe contact boundary, which promoted the formation of an oxygenate. Zeng et al. prepared a series of ε′-(CoxFe1–x)2.2C alloy carbide catalysts derived from CoFe spinel nanoparticles. The ε′-(CoxFe1–x)2.2C catalysts with atomically dispersed dual CoxC-FexC sites facilitated the formation of oxygenates [24,25].
In this study, we reported a Na-modified CoFe-based catalyst for the direct conversion of syngas to olefins. We observed a synergistic effect between the Co and Fe, and the Co2Fe1 catalyst exhibited higher activity levels compared to the individual Co and Fe catalysts. In addition, the overall selectivity for the chemicals, including the olefins and oxygenates, reached 83.2 C%, while the production of methane was significantly lower than that predicated by a theoretic ASF model. We also demonstrated that the formation of Co2C and Fe2C was responsible for the observed high activity and selectivity of the CoFe-based catalysts obtained in this work.

2. Results and Discussion

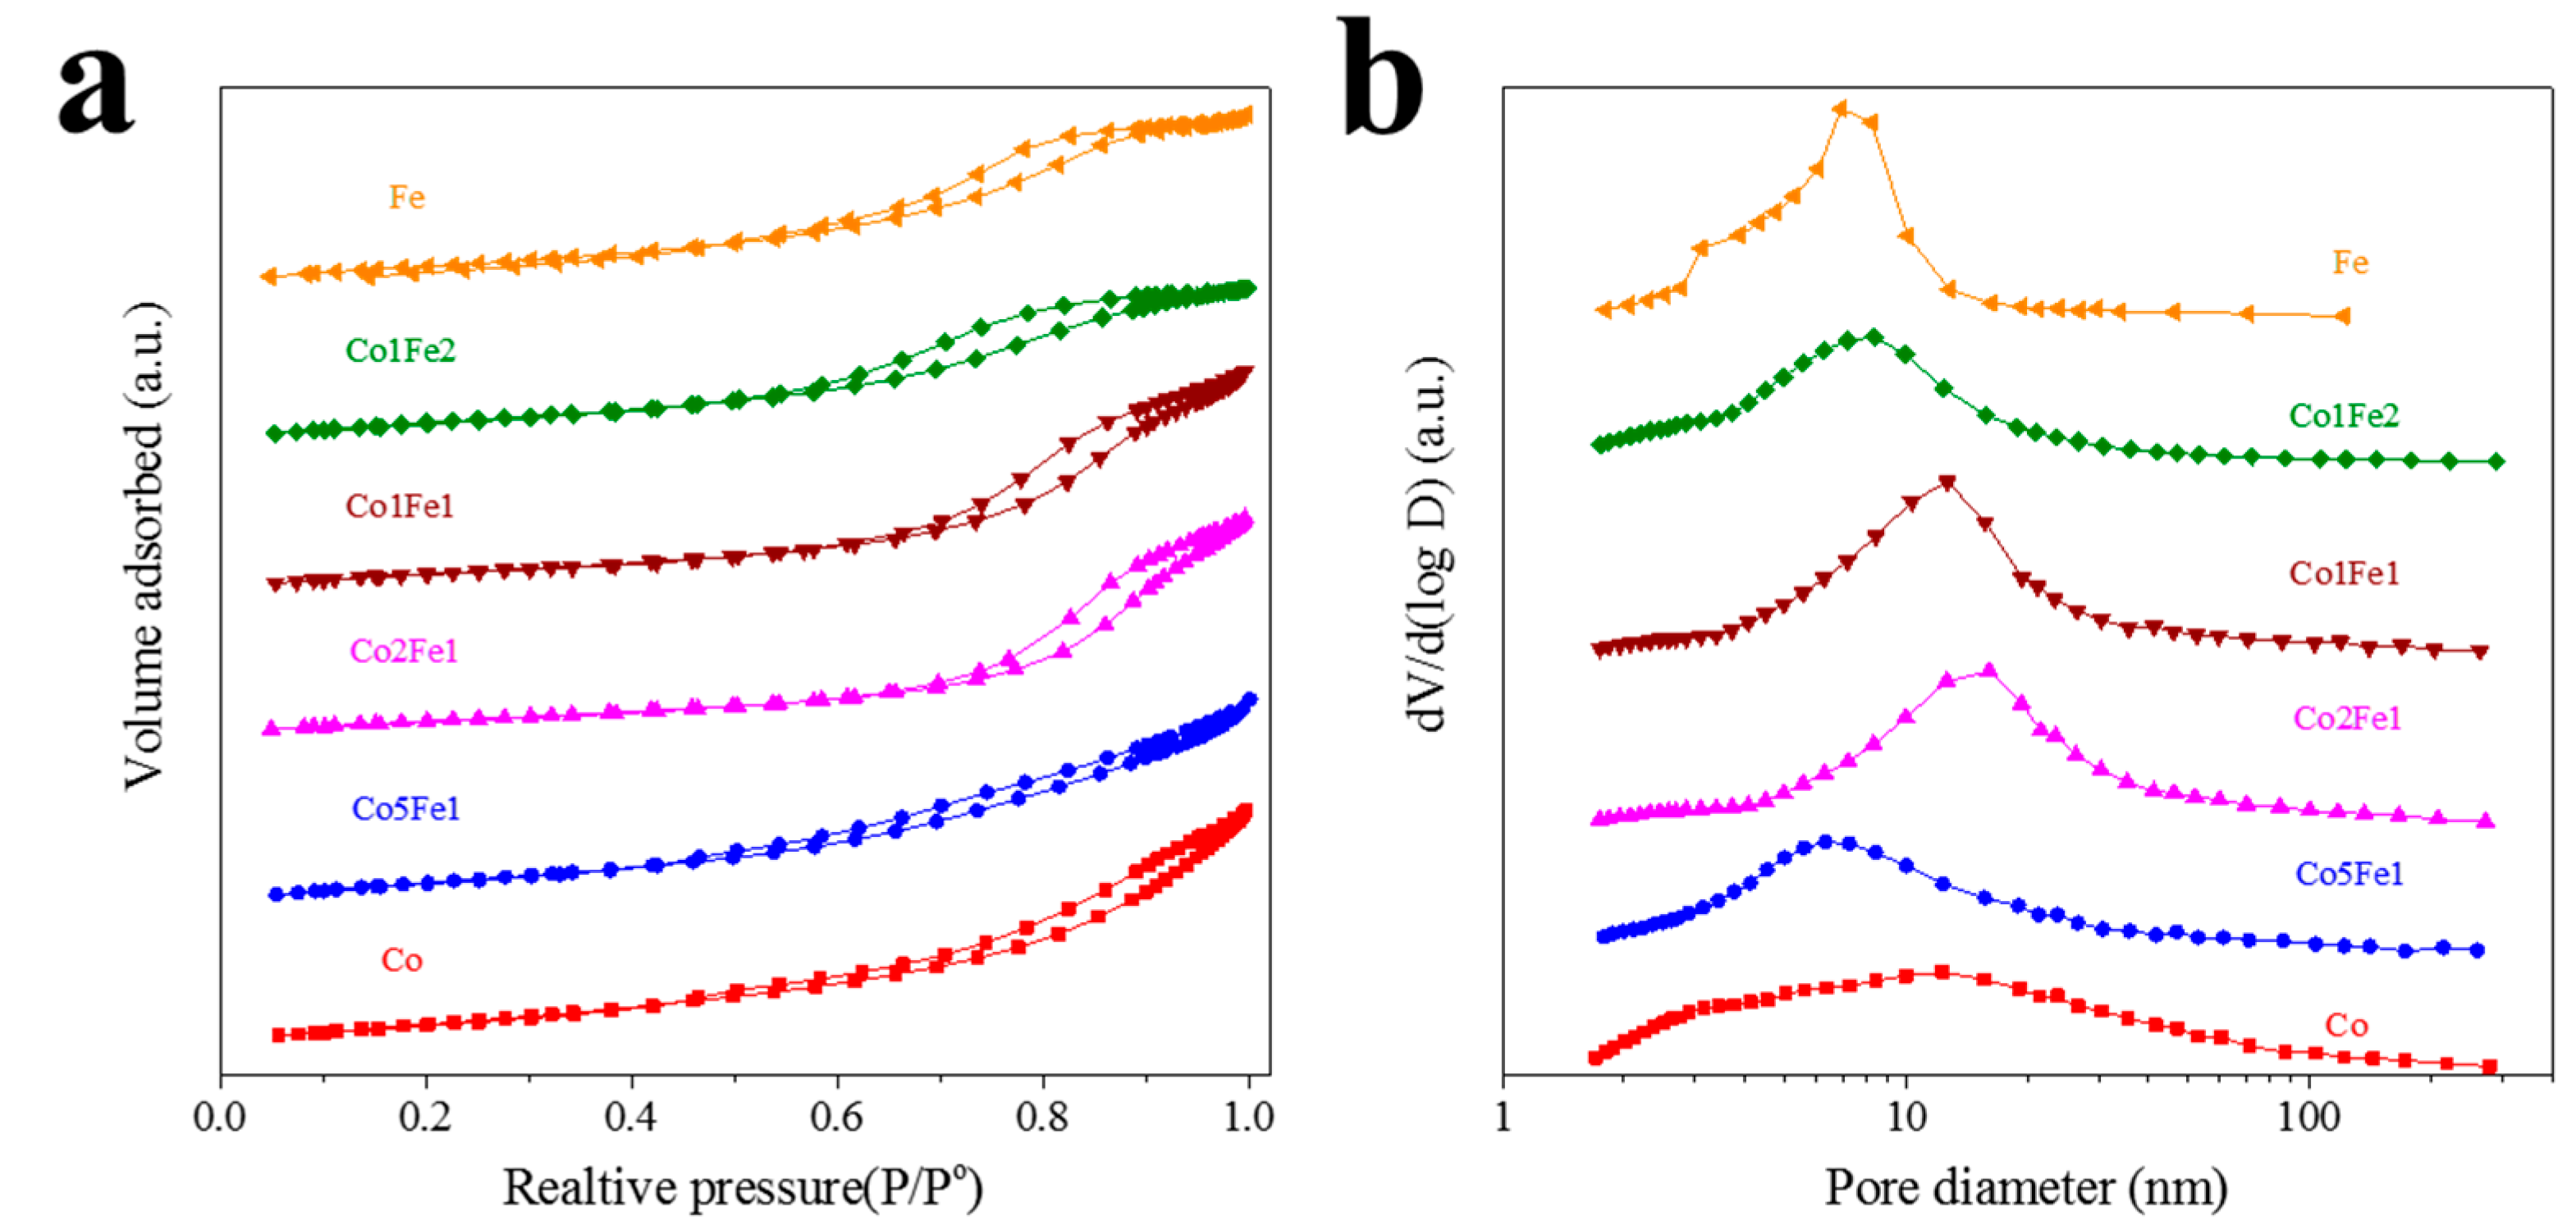
2.1. Structural Characterization

The Co-, CoFe-, and Fe-based samples were synthesized via a co-precipitation method. The concentrations of cobalt, iron, and sodium in the calcined samples are listed in Table 1. By controlling the washing times, all samples had a similar residual Na content (2.3~3.8 wt.%), and the molar ratio of (Co + Fe)/Mn/Al was approximately 1.0:1.0:1.0. The element concentrations, as determined by XRF, were close to the nominal concentrations.
The pore structure properties of the samples are also presented in Table 1 and Figure 1. The as-prepared samples exhibited characteristic mesoporous structures, as evidenced by the similar hysteresis loops for the N2 adsorption–desorption isotherms with average pore sizes centered at 6~20 nm. The pore size of the sole Co sample was 8.8 nm, and this increased to 12.4 nm for the Co2Fe1 catalyst. However, the pore sizes dropped to 7.2 and 8.0 nm for Co1Fe2 and Fe, respectively. The BET specific surface area showed an opposite trend. For example, a surface area of 222 m2/g was observed for the Co sample, and this dropped to 144 m2/g for Co2Fe1. Slight increases in the specific surface areas were observed for Co1Fe2 (184 m2/g) and Fe (178 m2/g). We assumed that this was mainly due to the formation of CoFe composite oxides, such as Co2FeO4 (Co/Fe = 2) species. The combination of Fe species with small Co particles, reduced the number of micropores, resulting in a decrease in the specific surface area and an increase in the average pore size. This phenomenon was even more pronounced for the Co2Fe1 sample (Co/Fe = 2). However, excess Fe cannot combine with Co species. The additional Fe species contributed to the total specific surface area. As a result, the specific surface area increased, and average pore size decreased again. Apparently, the addition of Fe to the Co sample resulted in significant change in the textural property [26].
X-ray diffraction was employed to identify the phase structure of various catalysts. Figure 2a shows the XRD patterns of the calcined samples. The diffraction peaks for sole Co and Fe were Co3O4 (JCPDS no. 43-1003) and Fe3O4 (JCPDS no. 26-1136), respectively. Figure 2b shows the step-scanning patterns of the 2θ from 30 to 45°. As the Fe concentration increased in CoFe samples, the peak position shifted to a higher angle. This was mainly due to the increased intensity of the diffraction peak of MnO2 (JCPDS no. 44-0141) with the addition of Fe content. After reduction in a H2 atmosphere at 300 °C for 5 h, diffraction peaks ascribed to CoO (JCPDS no. 71-1178) and FeO (JCPDS no. 89-0687) phases were found in the Co and Fe samples (Figure 2c). The diffraction peaks of reduced CoFe samples were located between CoO and FeO, indicating the formation of the CoFe composite oxide with a lower valence state. Since the atomic radius of Fe is slightly higher than that of Co (1.26 vs. 1.25 Å), the diffraction peaks shifted to a lower angle with increasing Fe concentration (Figure 2d).
The XRD patterns of spent CoFe catalysts are presented in Figure 2e. All samples showed the diffraction peaks of MnCO3 (JCPDS no. 44-1472). Due to the weak interaction between Fe and Mn, the separated MnO2 in Figure 2b on a calcined sample would convert to MnCO3 with sharp diffraction peaks during the reaction. For samples containing both Co and Fe, the diffraction peaks of CoO and FeO disappeared due to the carburizing reaction, while diffraction peaks located at 37.0, 34.4, 42.6, and 54.6, corresponding to Co2C (JCPDS no. 65-1457), were observed. The crystallite size of Co2C calculated by Scherer’s formula based on Co2C (111) was 19.4, 16.3, 15.9, 10.1, and 9.0 nm for Co, Co5Fe1, Co2Fe1, Co1Fe1, and Co1Fe2, respectively, indicating the addition of Fe could restrain the growth of Co2C. As for the spent Fe catalyst, the peaks of the Fe2C (JCPDS no. 17-0897) at 2θ of 41.3, 42.5, and 43.0 and FeO (JCPDS no. 74-1886) were found. These results suggested that there was incomplete carbonization in the Fe sample.
The H2-temperature-programmed reduction (TPR) of the calcined sample is presented in Figure 2f. For the sole Co and Fe samples, the first H2 consumption peak around 250 °C was ascribed to the reduction of Mn3+ to Mn2+. For the Co sample, three H2 consumption peaks centered around 300, 336, and 423 °C were observed, which were assigned to the partial reduction of the Co3O4 and CoMn oxide to Co2+, and the further reduction of the Co2+ to Co0 [27,28,29]. For the Fe sample, the reduction peaks around 370  °C and 425  °C were attributed to the reduction of Fe3O4 to FeO, and FeO to metallic Fe [30]. The fourth peak centered at 550~620 °C was attributed to the reduction of CoAl and FeAl spinel [31,32]. For the CoFe samples, the reduction temperature increased with the increase in the Fe/Co molar ratio, implying that the addition of Fe inhibited the reduction process.
High Resolution Transmission Electron Microscopy (HRTEM) images of the spent catalysts are presented in Figure 3. After the reaction, the CoO and FeO species were carbonized into Co2C and Fe2C with the aid of a Na promoter. For the Co sample, plenty of Co2C nanoprisms were observed, while the Fe sample showed the presence of Fe2C nanoparticles. For the CoFe samples, both Fe2C nanoparticles and Co2C nanoprisms were observed, which is in line with the results of XRD characterization.

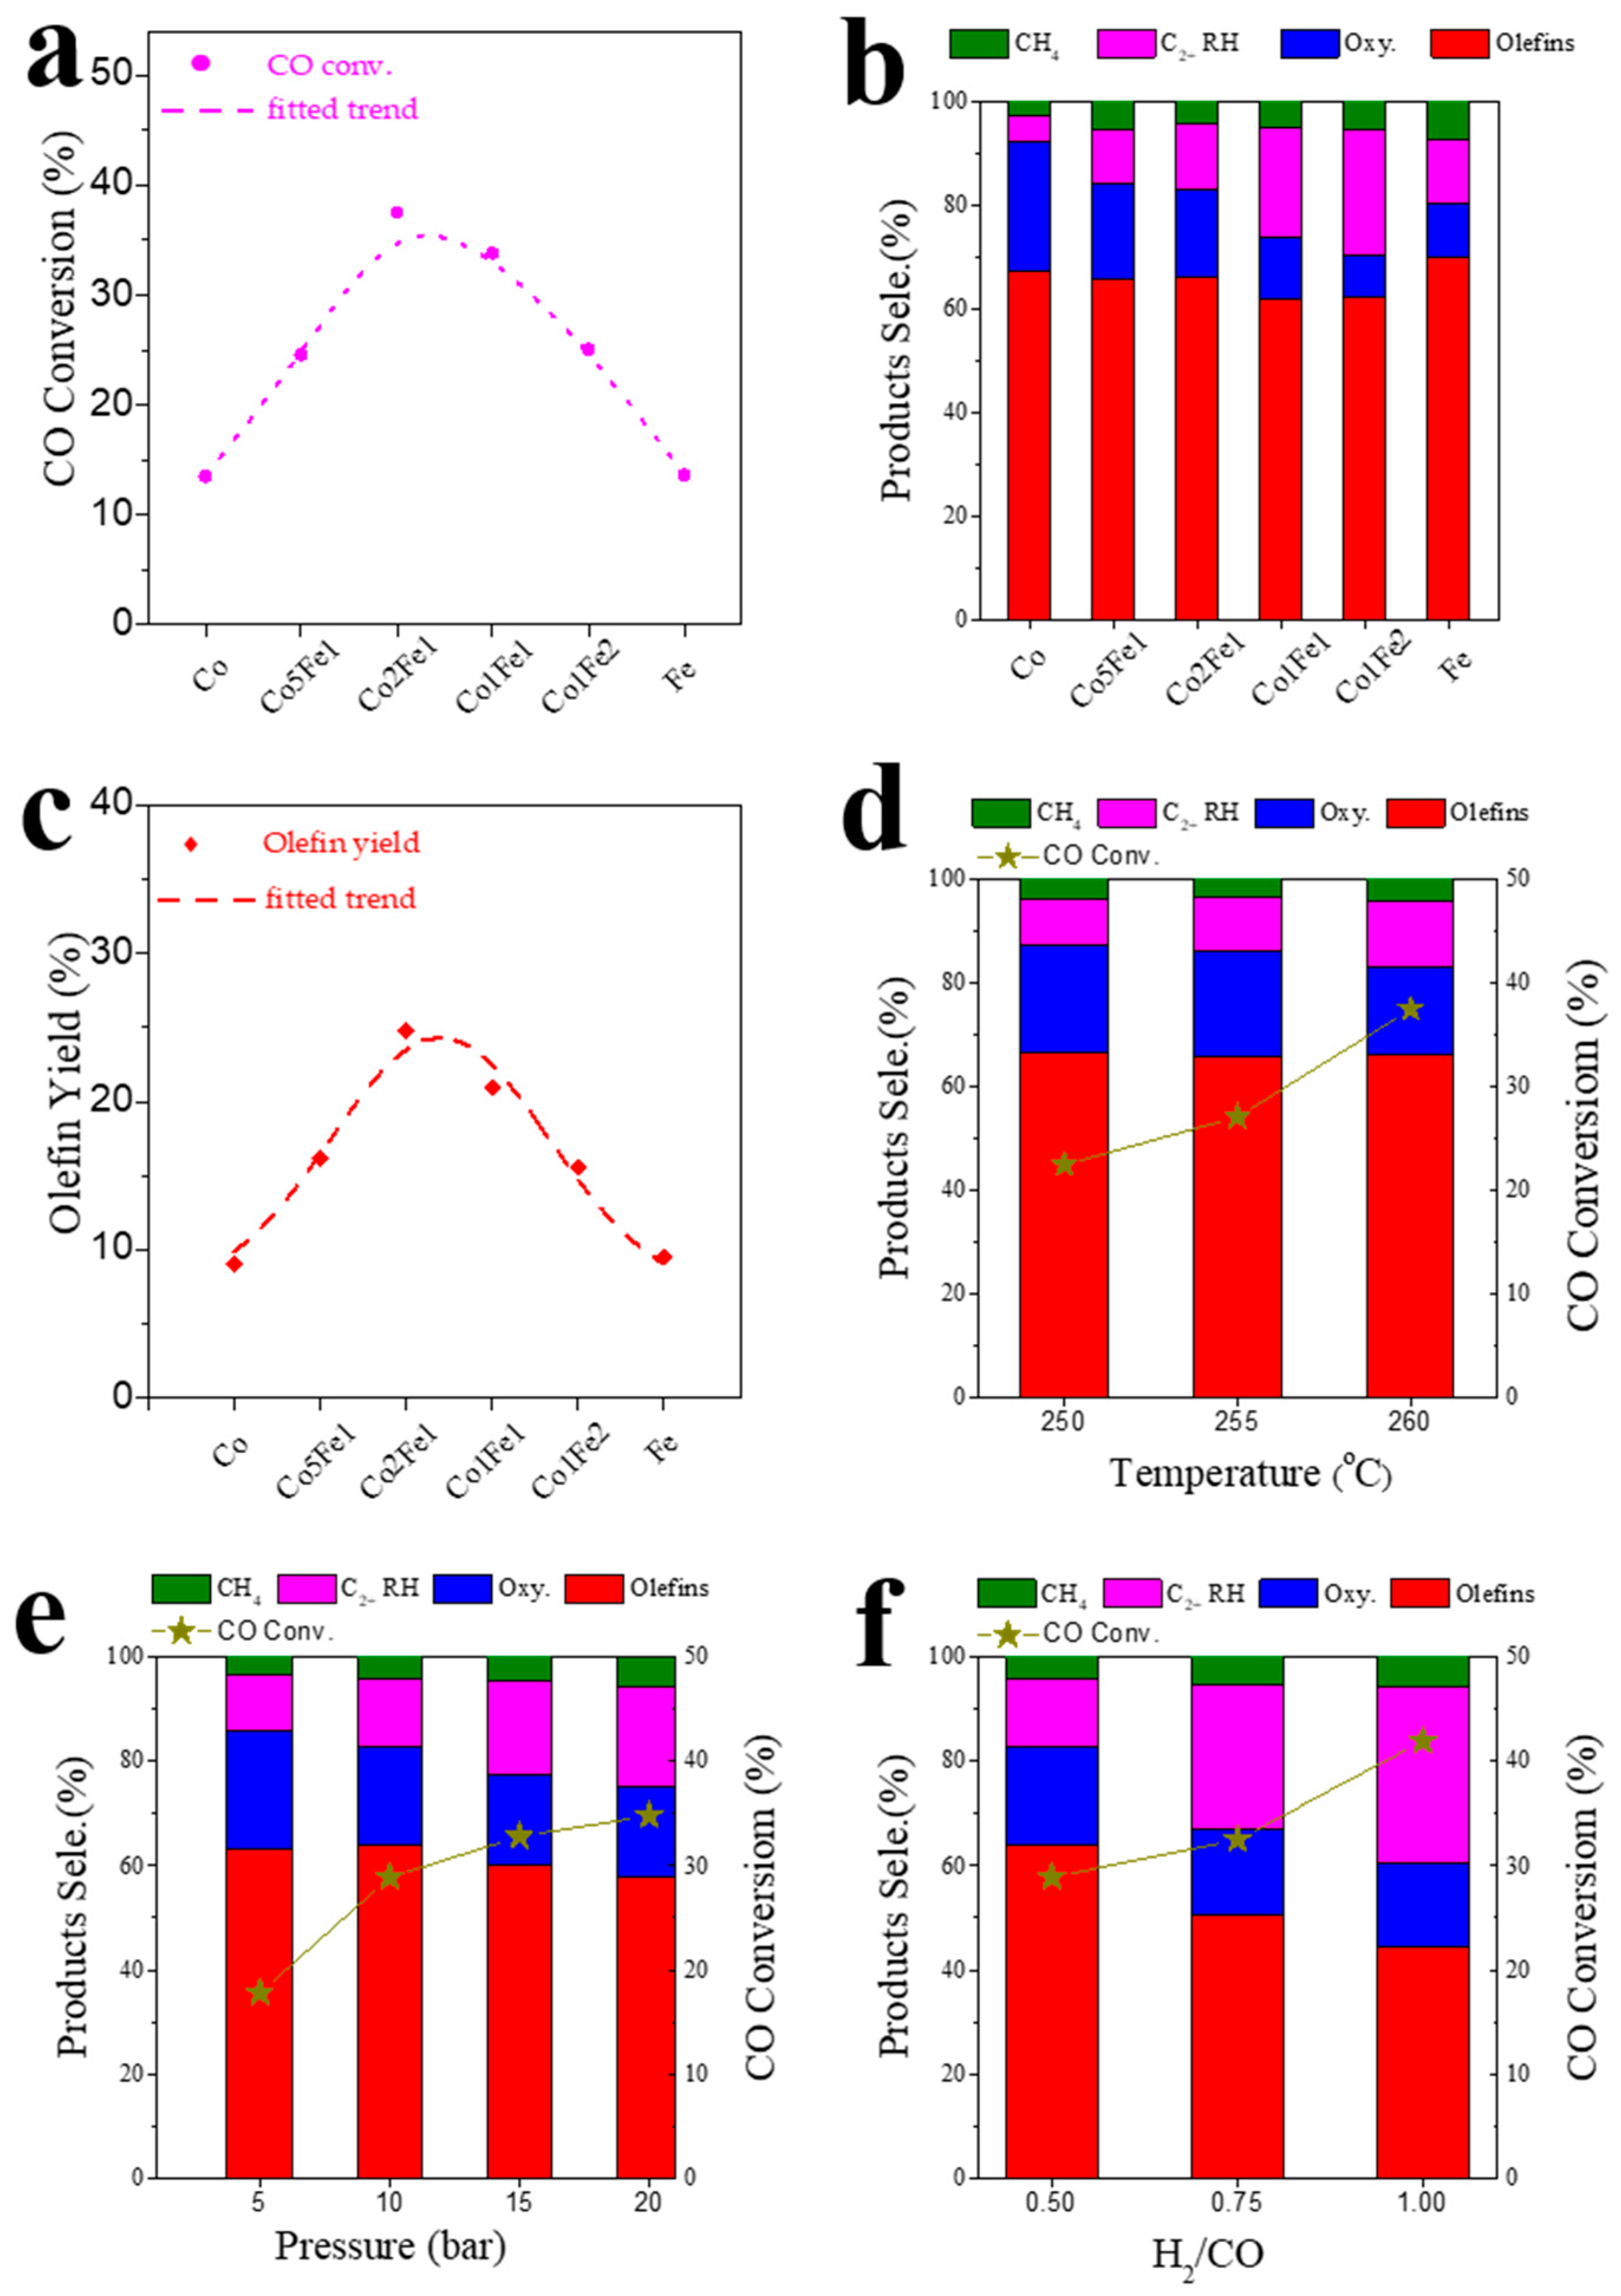
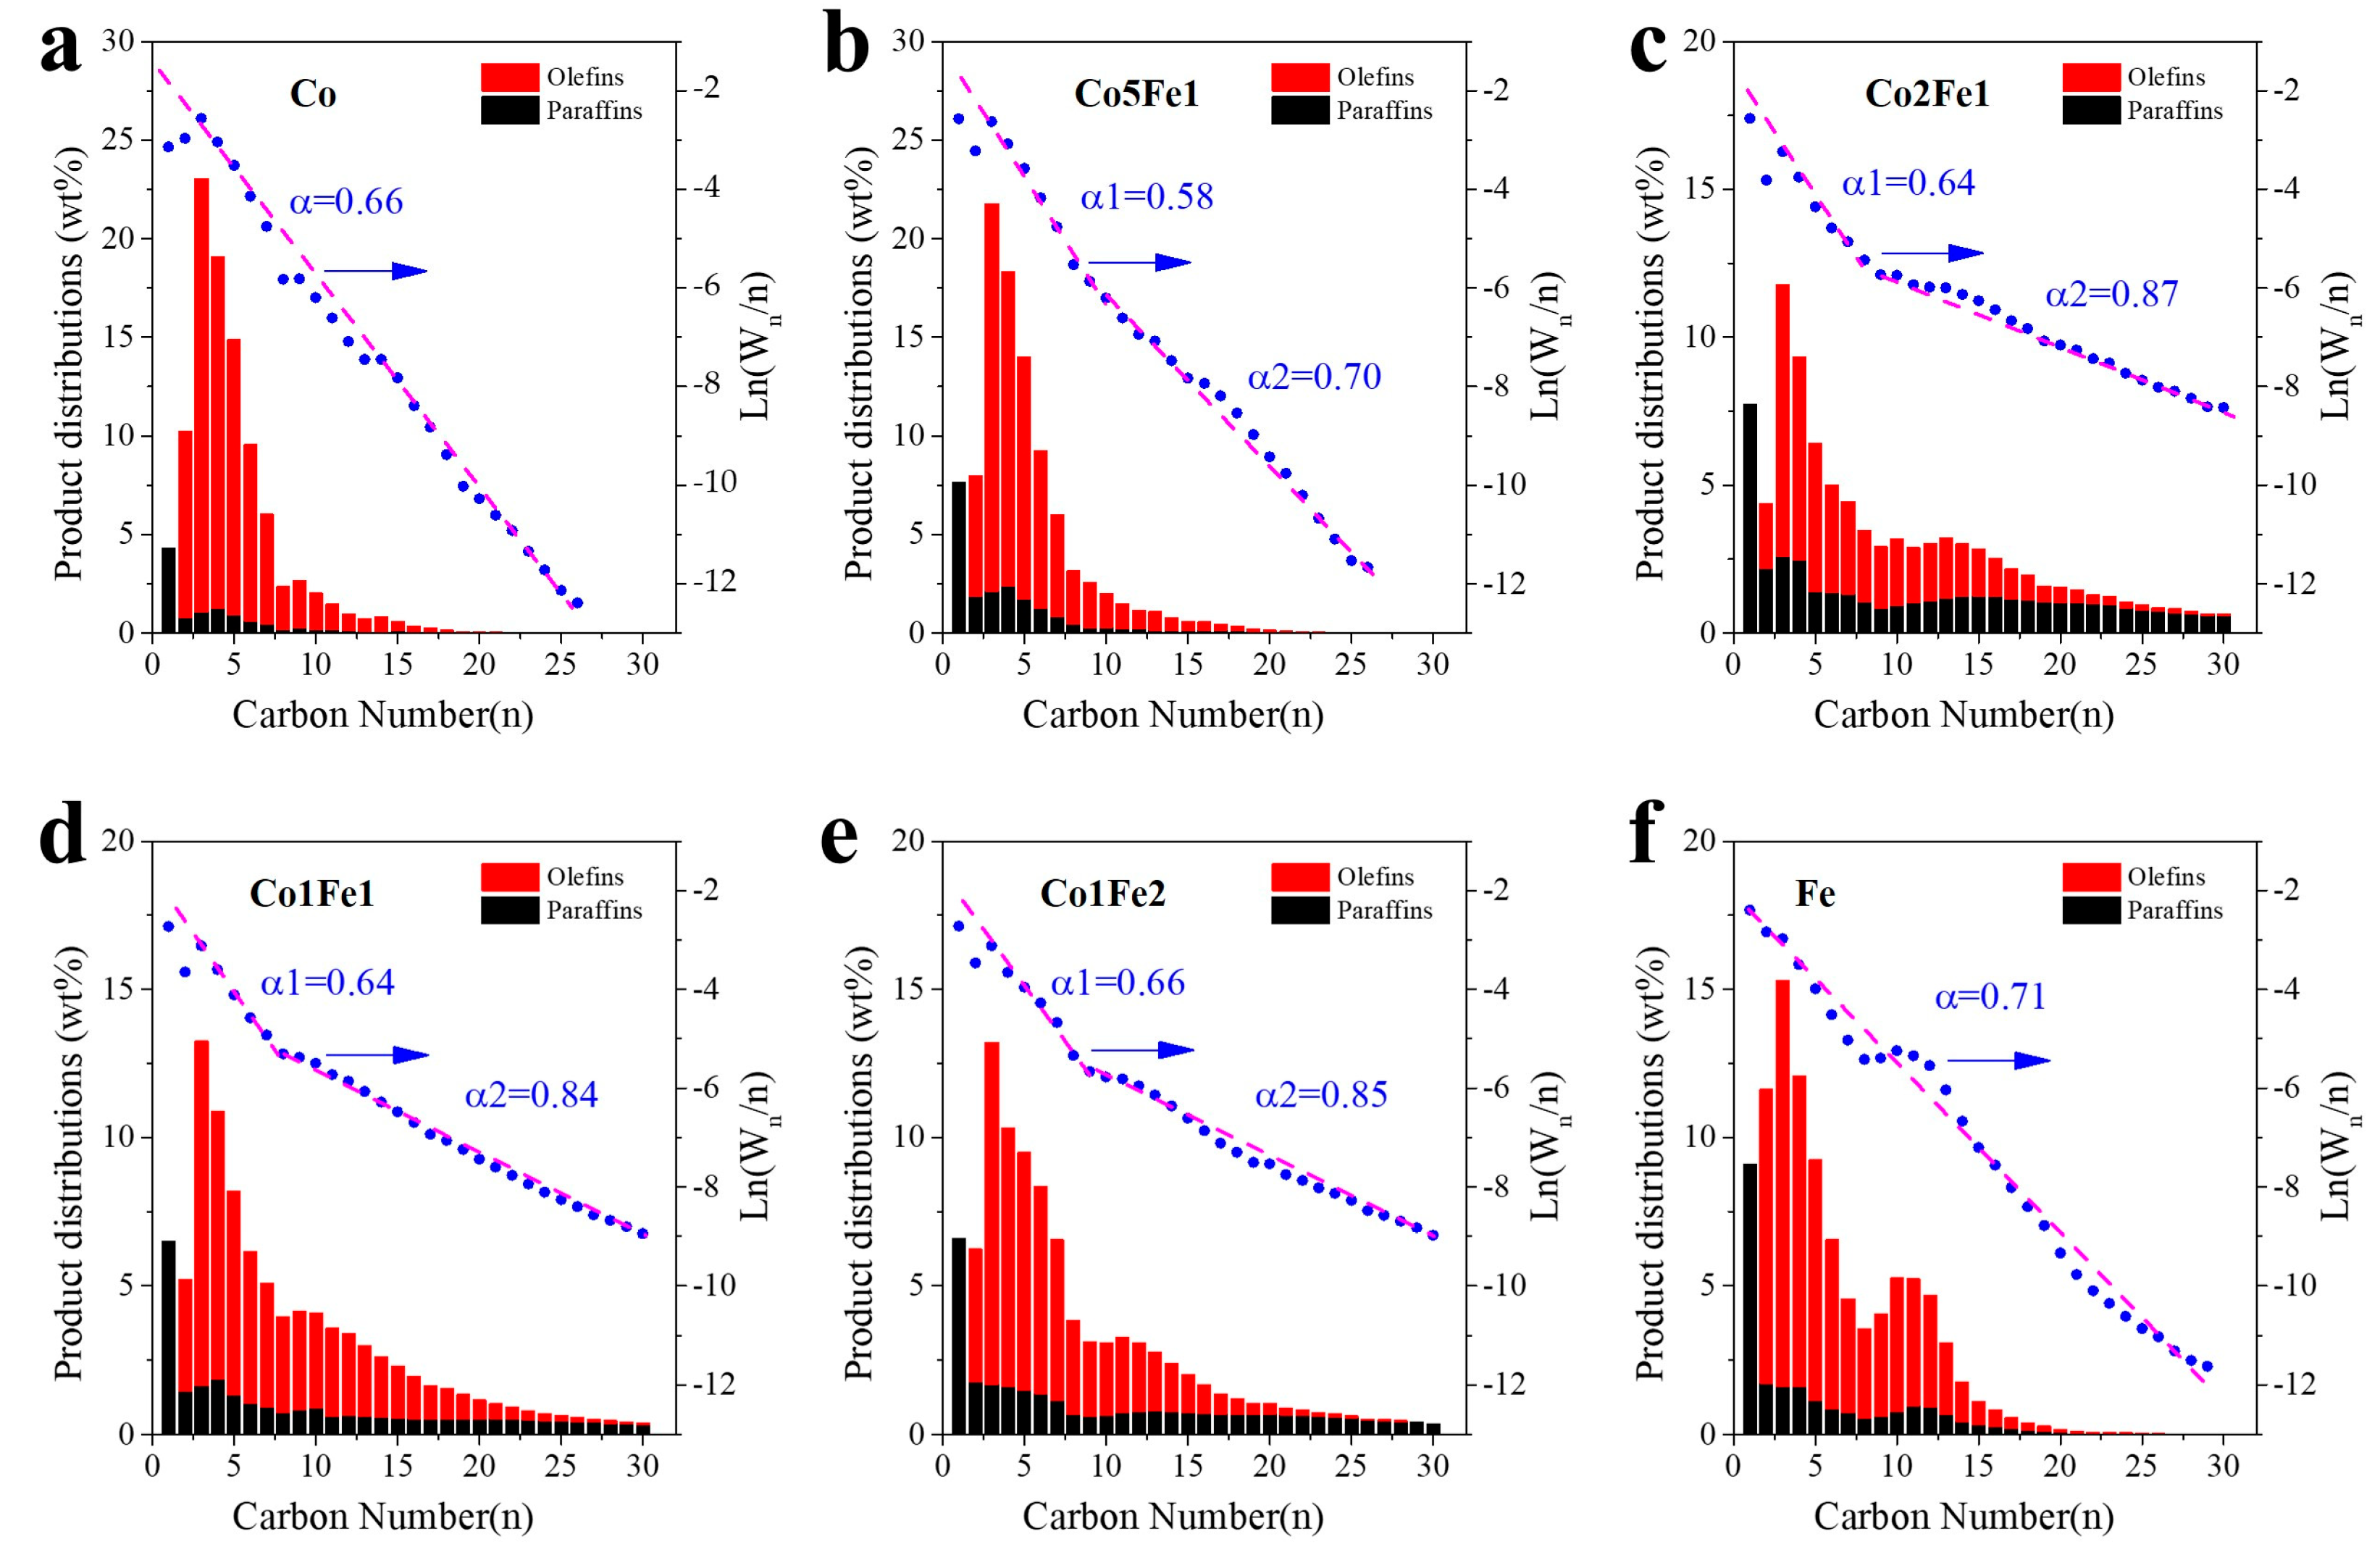
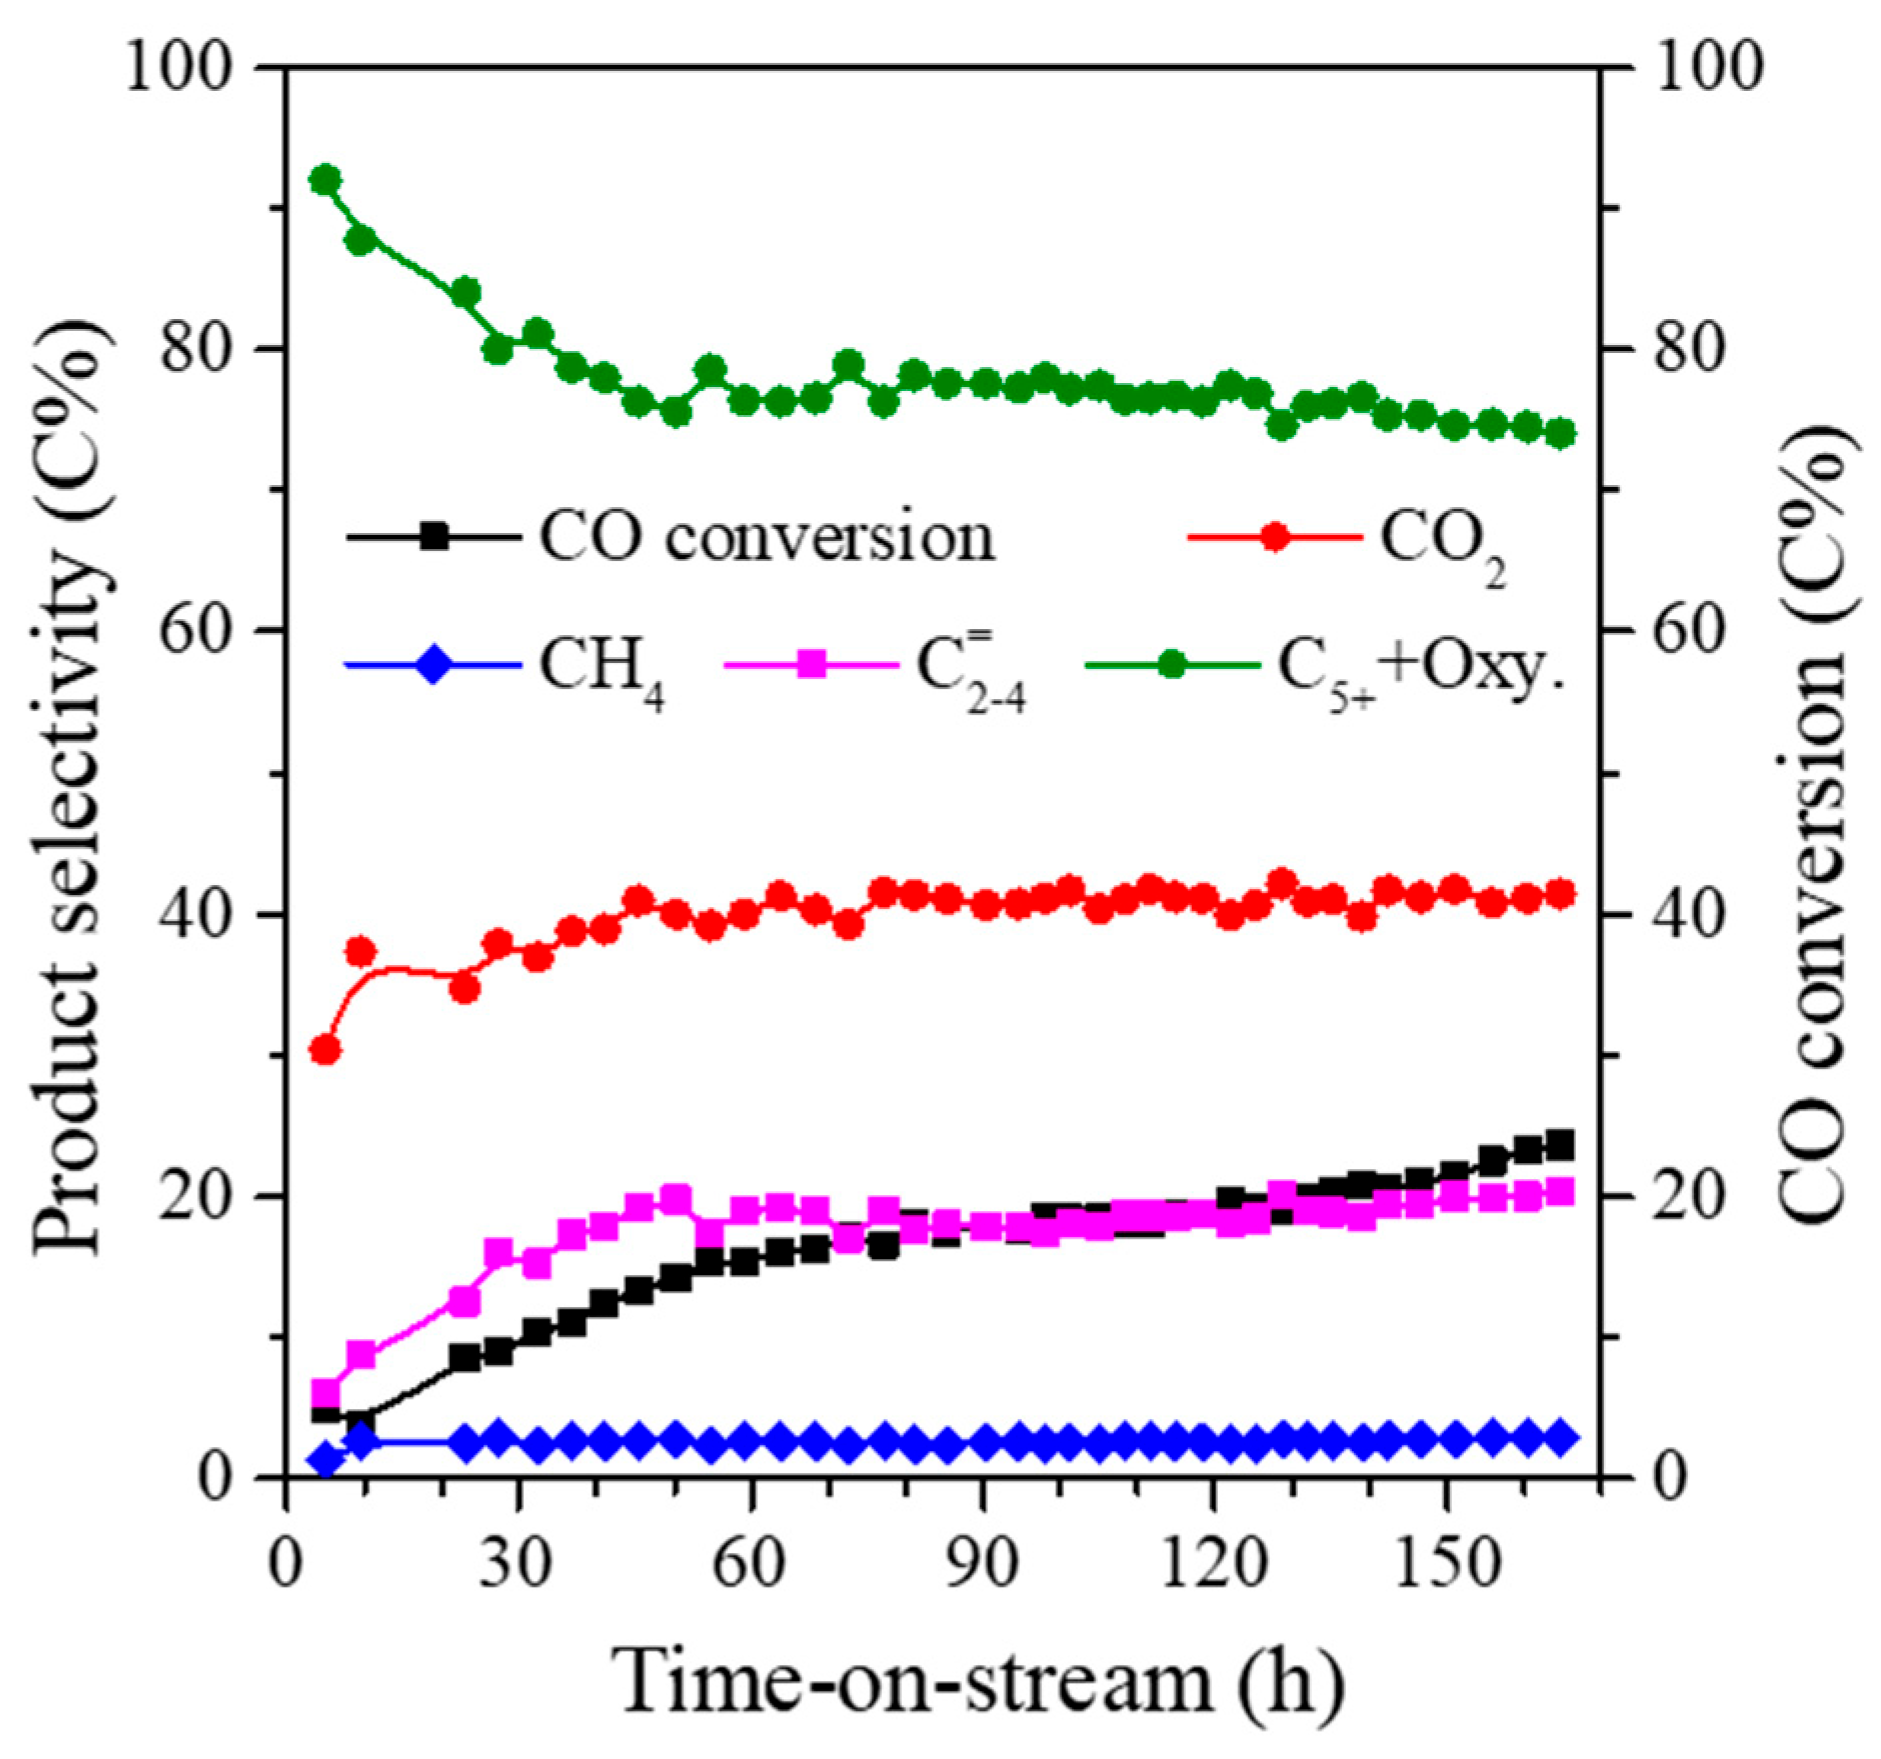
2.2. Catalytic Performance

The CoFe catalysts with different Co/Fe ratios (5/1, 2/1, 1/1, and 1/2) were evaluated for the CO hydrogenation. As for comparison, the catalytic performance of the sole Co and Fe catalysts were also investigated. As shown in Table 2 and Figure 4a, the sole Co or Fe catalysts show a much lower CO conversion of 13.5% and 13.6%, respectively, at 260 °C. Although the FexC has been reported as the active phase of the Fe-based FTS reaction, the much lower reaction temperature led to the observed low activity, as most of the Fe-based reported catalysts operated at around 300~350 °C [33,34,35]. For the CoFe catalysts, the catalytic activity gradually increased with the increase in the Fe content. For example, the CO conversion of Co5Fe1 was 24.5%, and it was raised to 37.5% for Co2Fe1, which is nearly 2.8 times-higher than that of the sole Co and Fe catalysts. However, the CO conversion decreased to 33.8% and 25.0% for Co1Fe1 and Co1Fe2, respectively. The high water-gas-shift (WGS) reaction activity for both carbide catalysts [36,37] often leads to a high CO2 selectivity (~50 C%), and it is believed that the syngas with a low H2/CO ratio is more suitable for this type of catalyst [38,39,40,41].
Figure 4b shows the product distribution of various catalysts. The sole Co catalyst showed a slightly higher olefin selectivity (67.3 C%) and a lower CH4 selectivity (2.9 C%). Although the olefin selectivity reached 70.1 C% for the sole Fe catalyst, the fraction of CH4 was as high as 7.2 C%. The Co2Fe catalyst also showed a much higher olefin selectivity (66.1 C%) with the lowest CH4 selectivity (4.3 C%) among various CoFe catalysts. Benefiting from both high CO conversion and olefin selectivity, the Co2Fe1 exhibited the highest olefins yield (24.8 C%) (Figure 4c). The higher oxygenates selectivity was also observed for these catalysts. For example, a 25% oxygenates selectivity was obtained over the sole Co catalyst, and the sum selectivity of olefins and oxygenates was even as high as 92.3 C%. As the Co/Fe molar ratio decreased from 5/1 to 1/2, the oxygenate selectivity showed downward trend from 18.5 C% to 7.9 C%.
Table 3 and Figure 4d–f show the effect of the reaction conditions on the FTO performance over the Co2Fe1 catalyst. When raising the reaction temperature from 250 to 260 °C, the CO conversion increased from 22.5 to 37.5%, while keeping the product selectivity almost unchanged, with about 66 C% olefin selectivity and 4 C% methane selectivity, respectively. As the reaction pressure increased from 5 to 20 bar, the CO conversion was promoted from 17.8 to 34.8%. Increasing pressure is beneficial to hydrogenation reaction, so the olefin fraction decreased from 63.8 to 57.7 C%, and the CH4 fraction increased from 3.6 to 5.8 C%. The H2/CO ratio also shows a great influence on the catalytic performance [42]. When the H2/CO ratio was increased from 0.5 to 1, the CO conversion increased from 28.9% to 41.9%, while the olefin selectivity decreased from 63.8 to 44.4 C%.
The detailed hydrocarbons distribution was also investigated, as shown in Figure 5. The olefins fractions dominated the products for all catalysts, which were as high as 89.7% and 78.0% for the sole Co and Fe catalyst, respectively. As the Co/Fe ratio decreased from Co5Fe1 to Co1Fe2, the olefin fractions also decreased from 80.7% to 67.7%. For the sole Co catalyst, the CH4 selectivity was significantly lower than the value predicted by the classical ASF model, which is in accordance with the previous point that Co2C nanoprisms can effectively suppress CH4 formation [14]. However, the hydrocarbon products distribution of the sole Fe catalyst followed the typical ASF distribution. The chain growth probability (α) of the sole Co and Fe catalyst was calculated to be 0.66 and 0.71, respectively. With the addition of Fe, the hydrocarbon products distribution of CoFe catalysts gradually showed two different chain growth probabilities, which was mainly due to the existence of two different catalytic active sites.
Figure 6 shows the stability performance of the Co2Fe1 catalyst. An induction period was observed during the first 50 h. This was mainly because the FTO active phase of Co2C and Fe2C was derived by carbonizing CoO and FeO in the start-up period of the FTO reaction [14]. After an initial activation period, the CO conversion reached 18%, and no obvious deactivation was found in the 160 h test. The CO2 selectivity remained at about 40 C%, and the selectivity toward CH4 and C2–4= kept at around 2.6 C% and 18 C%, respectively, while the selectivity of C5+ and oxygenates remained at about 75 C%.

2.3. Structural-Performance Discussion

To explore the influence of Fe addition into Co on the CO dissociation rate, the reduced catalysts of Co, Fe, and Co2Fe were exposed to a CO atmosphere at 260 °C. By comparing the fitted peak areas of the CO2 signal recorded by MS in the effluent gas, the formation rate of surface carbonaceous species was accessed. As shown in Figure 7, under the same treatment conditions, the Co2Fe1 can effectively catalyze a disproportionation reaction of CO to form CO2 and surface carbonaceous species, indicating the higher CO dissociation rate of Co2Fe1 than that of the sole Co or Fe sample. The concentration of surface carbonaceous species commonly determines the carburization rate and Co2C formation. Therefore, it is easily to understand that the Co2Fe1 catalyst was more easily carbonized to form the carbide phase. This phenomenon also explains the observed highest activity of the Co2Fe1 catalyst.
Based on the above results, the synergistic effect of Fe and Co could be confirmed. The addition of Fe to the Co catalysts results in the formation of the CoFe composite oxide, as confirmed by the X-ray diffraction results. The formation of a composite structure inhibited the reduction of the CoFe catalyst, and the H2 consumption peaks shifted to a higher temperature with the increasing Fe/Co molar ratio. Previous studies suggested that the reduction process possesses a significant effect on the Co2C-based FTO performance [14]. The Co-based composite oxide with low valence states contributed to the formation of Co2C nanoprisms, while the metallic Co would lead to the formation of Co2C nanospheres during the carburization, whose catalytic activity was much lower that of Co2C nanoprisms. XRD characterization indicated that the addition of Fe also restrains the growth of Co2C. Our previous work has indicated that the Co2C catalyst shows remarkable particle size effects on syngas conversion [43]. However, a further increase in the Fe/Co molar ratio would weaken the synergetic effect and decrease the number of Co active sites, resulting in a decrease in CO conversion. The presence of Co2C nanoprisms also inhibited methane formation, with only a 4.3 C% CH4 selectivity obtained. No obvious deactivation was observed within 160 h of the stability test, suggesting promising practical applications.

3. Materials and Methods

3.1. Catalyst Synthesis

The Na-modified CoFe catalysts with different Co/Fe mole ratios were prepared by the co-precipitation method [14]. Since Mn and Al are important promoters that promote the formation and stabilization of Co2C and Fe2C, a certain amount Mn and Al was also added into the catalytic system [30,44,45]. Typically, a metal nitrate aqueous solution with a total cation concentration of 2 M was fabricated with the required Fe/Co molar ratio ([Co + Fe]: Mn: Al = 1:1:1, Co/Fe = 5, 2, 1, and 0.5, atom ratio). The mixed salt solution was precipitated with Na2CO3 aqueous solution (1M) at 40 °C. Then, the suspension was washed with deionized water and then separated by centrifugation. Subsequently, the filtered cake was dried and calcined at 400 °C in static air for 5 h. The as-prepared catalysts were denoted as CoxFey, where the x/y denotes the Co/Fe atom ratio. The calcined sample was ground and sieved to about 250~425 μm (40~60 mesh) for testing. For comparison, sole Fe or Co catalysts were also prepared using the same methods.

3.2. Catalyst Characterization

X-ray fluorescence (XRF) measurements were conducted using a Rigaku ZSX PrimusⅡ (Rigaku, Tokyo, Japan) to determine the elemental composition of the catalysts.
The textural properties of various catalysts were assessed at −196 °C using a Micromerictics TriStar 3020 instrument (Micromeritics, Unterschleissheim, Germany). Before testing, the sample was degassed in a N2 atmosphere at 200 °C for 10 h.
X-ray diffraction (XRD) patterns of the catalysts were obtained on a Rigaku Ultima IV X-ray powder diffractometer (Rigaku, Tokyo, Japan) with Cu Kα radiation, and the operating voltage and current were 40 kV and 40 mA, respectively. Phase identification was based on the PDF4-2015 database. The crystallite sizes were estimated using the Scherrer equation.
H2-temperature-programmed reduction (TPR) profiles were performed using a Micromeritics Autochem II 2920 Analyzer equipped with a thermal conductivity detector (Micromeritics, Norcross, GA, USA). In total, 50 mg of each sample was treated in He flow at 200 °C for 2 h to remove adsorbed water, and then heated from ambient temperature to 800 °C with a ramping rate of 10 °C/min in flowing 5 vol% H2/Ar.
Transmission electron microscopy (TEM) images were collected on a JEOL JEM 2011 transmission electron microscope (JEOL, Tokyo, Japan), and the accelerating voltage was 200 kV.
The catalytic activity for CO dissociation and disproportionation to form CO2 and surface carbon species was conducted by exposing the reduced catalyst with CO flow at 260 °C in a U-type fixed-bed reactor. The CO2 signal in the effluent gas was recorded using a TILON LC-D200 M mass spectrometer (Ametek, Berwyn, PA, USA).

3.3. Catalytic Performance Tests

The catalytic performance was evaluated in a fixed bed reactor (id = 9 mm). Before the catalytic test, 1.5 g of the catalyst (250~425 μm) diluted with 3 g silica was in situ activated with 10% H2/N2 (200 mL/min) at 300 °C for 5 h. After reduction, the pressure was gradually pressurized to the desired value (5~20 bar) with syngas (H2/CO ratios of 0.5, 0.75, and 1, respectively). Then, the reactor was heated to the desired reaction temperature. For catalyst characterization, the reduced and spent catalysts were passivated with 0.5% O2/N2 at ambient temperature prior to exposure to air.
The exhaust gas after passing through the reactor was analyzed online by Agilent 7890B gas chromatograph (Agilent Technologies, Santa Clara, CA, USA). The C1–C7 hydrocarbons were analyzed using an Al2O3 capillary column equipped with flame ionization (FID), and H2, N2, CO, CH4, and CO2 were analyzed using a carbon molecular sieve packed column connected to a thermal conductivity detector (TCD). The liquid and solid wax products were collected from the cold and hot trap and analyzed by Shimadzu GC2010 plus gas chromatograph (Shimadzu, Kyoto, Japan).
CO conversion (XCO) and products’ selectivity (SCO2, Si) were calculated according to the following formula:
X CO = CO inlet   CO outlet CO inlet × 100 %
S CO 2 = CO 2 CO inlet   CO outlet × 100 %
S i = N i × n i ( N i × n i ) × 100 %
in which, COinlet and COoutlet mean the CO moles in the feed gas and outlet gas, respectively, CO2 represents the CO2 moles in the outlet gas, Ni represents the moles of product i in the outlet gas, and ni is the carbon number of product i.
The chain growth probability (α) of hydrocarbons was calculated according to the Ander–Schulz–Flory (ASF) model:
W n n = 1 α 2 α n 1
where n is the carbon number of products. Wn is the weight fraction of hydrocarbons (including paraffins and olefins) products with carbon atoms of n.

4. Conclusions

In summary, we present a Na-modified CoFe catalyst that facilitates the production of olefin through direct CO hydrogenation. It was observed that an appropriate Co/Fe ratio improved the catalyst performance. The addition of Fe restrained the growth of Co2C nanoparticles and the synergistic effect of Co and Fe also promoted the CO dissociation rate and carburization rate, thereby enhancing the catalytic activity. However, with the increase in Fe content, the number of Co2C active sites decreased, resulting in the deterioration of catalytic performance. For the Co2Fe1 catalyst, the desired olefins selectivity reached 66.1 C% at a CO conversion of 37.5%. The formation of methane was significantly suppressed, with only 4.3% undesired CH4 selectivity. The CoFe catalyst also demonstrated good catalytic stability during a 160 h stability test.

Author Contributions

X.W.: investigation, data curation, formal analysis, writing—original draft, validation, visualization. T.L.: methodology, writing—review and editing, conceptualization, validation, funding acquisition. D.L.: investigation. Y.A.: investigation, funding acquisition. X.Q.: investigation, formal analysis. K.G.: investigation, formal analysis. L.Z.: supervision, methodology, writing—review and editing, conceptualization, validation, project administration, funding acquisition. All authors have read and agreed to the published version of the manuscript.

Funding

This research was funded by the Natural Science Foundation of China (U22B20136, 22072177, 22202230), the Natural Science Foundation of Shanghai (21ZR1471700), and the Shanghai Youth Science and Technology Talents Sailing Program (21YF1453600).

Data Availability Statement

Data are contained within this article.

Conflicts of Interest

The authors declare no conflict of interest.

References

  1. Iglesia, E. Design, synthesis, and use of cobalt-based Fischer-Tropsch synthesis catalysts. Appl. Catal. A Gen. 1997, 161, 59–78. [Google Scholar] [CrossRef]
  2. Zhang, Q.; Deng, W.; Wang, Y. Recent advances in understanding the key catalyst factors for Fischer-Tropsch synthesis. J. Energy Chem. 2013, 22, 27–38. [Google Scholar] [CrossRef]
  3. Khodakov, A.Y.; Chu, W.; Fongarland, P. Advances in the Development of Novel Cobalt Fischer−Tropsch Catalysts for Synthesis of Long-Chain Hydrocarbons and Clean Fuels. Chem. Rev. 2007, 107, 1692–1744. [Google Scholar] [CrossRef] [PubMed]
  4. Cheng, K.; Gu, B.; Liu, X.; Kang, J.; Zhang, Q.; Wang, Y. Direct and Highly Selective Conversion of Synthesis Gas into Lower Olefins: Design of a Bifunctional Catalyst Combining Methanol Synthesis and Carbon–Carbon Coupling. Angew. Chem. Int. Ed. 2016, 55, 4725–4728. [Google Scholar] [CrossRef]
  5. Jiao, F.; Li, J.; Pan, X.; Xiao, J.; Li, H.; Ma, H.; Wei, M.; Pan, Y.; Zhou, Z.; Li, M. Selective conversion of syngas to light olefins. Science 2016, 351, 1065–1068. [Google Scholar] [CrossRef]
  6. Pan, X.; Jiao, F.; Miao, D.; Bao, X. Oxide–Zeolite-Based Composite Catalyst Concept That Enables Syngas Chemistry beyond Fischer–Tropsch Synthesis. Chem. Rev. 2021, 121, 6588–6609. [Google Scholar] [CrossRef]
  7. Xu, Y.; Li, X.; Gao, J.; Wang, J.; Ma, G.; Wen, X.; Yang, Y.; Li, Y.; Ding, M. A hydrophobic FeMn@Si catalyst increases olefins from syngas by suppressing C1 by-products. Science 2021, 371, 610–613. [Google Scholar] [CrossRef]
  8. Cheng, K.; Kang, J.; King, D.L.; Subramanian, V.; Zhou, C.; Zhang, Q.; Wang, Y. Advances in Catalysis for Syngas Conversion to Hydrocarbons. In Advances in Catalysis; Song, C., Ed.; Academic Press: Cambridge, MA, USA, 2017; Volume 60, pp. 125–208. [Google Scholar]
  9. Lyu, S.; Wang, L.; Li, Z.; Yin, S.; Chen, J.; Zhang, Y.; Li, J.; Wang, Y. Stabilization of ε-iron carbide as high-temperature catalyst under realistic Fischer–Tropsch synthesis conditions. Nat. Commun. 2020, 11, 6219. [Google Scholar] [CrossRef]
  10. Torres Galvis, H.M.; Bitter, J.H.; Khare, C.B.; Ruitenbeek, M.; Dugulan, A.I.; de Jong, K.P. Supported iron nanoparticles as catalysts for sustainable production of lower olefins. Science 2012, 335, 835–838. [Google Scholar] [CrossRef]
  11. Torres Galvis, H.M.; Koeken, A.C.J.; Bitter, J.H.; Davidian, T.; Ruitenbeek, M.; Dugulan, A.I.; de Jong, K.P. Effects of sodium and sulfur on catalytic performance of supported iron catalysts for the Fischer–Tropsch synthesis of lower olefins. J. Catal. 2013, 303, 22–30. [Google Scholar] [CrossRef]
  12. Koeken, A.C.; Torres Galvis, H.M.; Davidian, T.; Ruitenbeek, M.; de Jong, K.P. Suppression of carbon deposition in the iron-catalyzed production of lower olefins from synthesis gas. Angew. Chem. Int. Ed. 2012, 124, 7302–7305. [Google Scholar] [CrossRef]
  13. Zhai, P.; Xu, C.; Gao, R.; Liu, X.; Li, M.; Li, W.; Fu, X.; Jia, C.; Xie, J.; Zhao, M.; et al. Highly Tunable Selectivity for Syngas-Derived Alkenes over Zinc and Sodium-Modulated Fe5C2 Catalyst. Angew. Chem. Int. Ed. 2016, 55, 9902–9907. [Google Scholar] [CrossRef] [PubMed]
  14. Zhong, L.; Yu, F.; An, Y.; Zhao, Y.; Sun, Y.; Li, Z.; Lin, T.; Lin, Y.; Qi, X.; Dai, Y.; et al. Cobalt carbide nanoprisms for direct production of lower olefins from syngas. Nature 2016, 538, 84–86. [Google Scholar] [CrossRef] [PubMed]
  15. Li, Z.; Yu, D.; Yang, L.; Cen, J.; Xiao, K.; Yao, N.; Li, X. Formation Mechanism of the Co2C Nanoprisms Studied with the CoCe System in the Fischer–Tropsch to Olefin Reaction. ACS Catal. 2021, 11, 2746–2753. [Google Scholar] [CrossRef]
  16. Kim, K.Y.; Lee, H.; Noh, W.Y.; Shin, J.; Han, S.J.; Kim, S.K.; An, K.; Lee, J.S. Cobalt Ferrite Nanoparticles to Form a Catalytic Co–Fe Alloy Carbide Phase for Selective CO2 Hydrogenation to Light Olefins. ACS Catal. 2020, 10, 8660–8671. [Google Scholar] [CrossRef]
  17. Hwang, S.-M.; Han, S.J.; Park, H.-G.; Lee, H.; An, K.; Jun, K.-W.; Kim, S.K. Atomically Alloyed Fe–Co Catalyst Derived from a N-Coordinated Co Single-Atom Structure for CO2 Hydrogenation. ACS Catal. 2021, 11, 2267–2278. [Google Scholar] [CrossRef]
  18. Numpilai, T.; Witoon, T.; Chanlek, N.; Limphirat, W.; Bonura, G.; Chareonpanich, M.; Limtrakul, J. Structure–activity relationships of Fe-Co/K-Al2O3 catalysts calcined at different temperatures for CO2 hydrogenation to light olefins. Appl. Catal. A Gen. 2017, 547, 219–229. [Google Scholar] [CrossRef]
  19. Falkenhagen, J.P.; Maisonneuve, L.; Paalanen, P.P.; Coste, N.; Malicki, N.; Weckhuysen, B.M. Cobalt-Iron-Manganese Catalysts for the Conversion of End-of-Life-Tire-Derived Syngas into Light Terminal Olefins. Chem. A Eur. J. 2018, 24, 4597–4606. [Google Scholar] [CrossRef]
  20. Yuan, F.; Zhang, G.; Wang, M.; Zhu, J.; Zhang, M.; Ding, F.; Cheng, Z.; Song, C.; Guo, X. Boosting the Production of Light Olefins from CO2 Hydrogenation over Fe–Co Bimetallic Catalysts Derived from Layered Double Hydroxide. Ind. Eng. Chem. Res. 2023, 62, 8210–8221. [Google Scholar] [CrossRef]
  21. Yang, C.; Zhao, B.; Gao, R.; Yao, S.; Zhai, P.; Li, S.; Yu, J.; Hou, Y.; Ma, D. Construction of Synergistic Fe5C2/Co Heterostructured Nanoparticles as an Enhanced Low Temperature Fischer–Tropsch Synthesis Catalyst. ACS Catal. 2017, 7, 5661–5667. [Google Scholar] [CrossRef]
  22. Zhang, L.; Dang, Y.; Zhou, X.; Gao, P.; Petrus van Bavel, A.; Wang, H.; Li, S.; Shi, L.; Yang, Y.; Vovk, E.I.; et al. Direct conversion of CO2 to a jet fuel over CoFe alloy catalysts. Innovation 2021, 2, 100170. [Google Scholar] [CrossRef] [PubMed]
  23. Gong, K.; Wei, Y.; Lin, T.; Qi, X.; Sun, F.; Jiang, Z.; Zhong, L. Maximizing the Interface of Dual Active Sites to Enhance Higher Oxygenate Synthesis from Syngas with High Activity. ACS Catal. 2023, 13, 4533–4543. [Google Scholar] [CrossRef]
  24. Zeng, Z.; Li, Z.; Guan, T.; Guo, S.; Hu, Z.; Wang, J.; Rykov, A.; Lv, J.; Huang, S.; Wang, Y.; et al. CoFe alloy carbide catalysts for higher alcohols synthesis from syngas: Evolution of active sites and Na promoting effect. J. Catal. 2022, 405, 430–444. [Google Scholar] [CrossRef]
  25. Zeng, Z.; Li, Z.; Kang, L.; Han, X.; Qi, Z.; Guo, S.; Wang, J.; Rykov, A.; Lv, J.; Wang, Y.; et al. A Monodisperse ε′-(CoxFe1–x)2.2C Bimetallic Carbide Catalyst for Direct Conversion of Syngas to Higher Alcohols. ACS Catal. 2022, 12, 6016–6028. [Google Scholar] [CrossRef]
  26. Gnanamani, M.K.; Jacobs, G.; Hamdeh, H.H.; Shafer, W.D.; Liu, F.; Hopps, S.D.; Thomas, G.A.; Davis, B.H. Hydrogenation of Carbon Dioxide over Co–Fe Bimetallic Catalysts. ACS Catal. 2016, 6, 913–927. [Google Scholar] [CrossRef]
  27. Ismail, A.S.M.; Casavola, M.; Liu, B.; Gloter, A.; van Deelen, T.W.; Versluijs, M.; Meeldijk, J.D.; Stéphan, O.; de Jong, K.P.; de Groot, F.M.F. Atomic-Scale Investigation of the Structural and Electronic Properties of Cobalt–Iron Bimetallic Fischer–Tropsch Catalysts. ACS Catal. 2019, 9, 7998–8011. [Google Scholar] [CrossRef]
  28. Bezemer, G.L.; Radstake, P.B.; Falke, U.; Oosterbeek, H.; Kuipers, H.P.C.E.; van Dillen, A.J.; de Jong, K.P. Investigation of promoter effects of manganese oxide on carbon nanofiber-supported cobalt catalysts for Fischer–Tropsch synthesis. J. Catal. 2006, 237, 152–161. [Google Scholar] [CrossRef]
  29. Bezemer, G.L.; Bitter, J.H.; Kuipers, H.P.C.E.; Oosterbeek, H.; Holewijn, J.E.; Xu, X.; Kapteijn, F.; van Dillen, A.J.; de Jong, K.P. Cobalt Particle Size Effects in the Fischer−Tropsch Reaction Studied with Carbon Nanofiber Supported Catalysts. J. Am. Chem. Soc. 2006, 128, 3956–3964. [Google Scholar] [CrossRef]
  30. Xu, Y.; Zhai, P.; Deng, Y.; Xie, J.; Liu, X.; Wang, S.; Ma, D. Highly Selective Olefin Production from CO2 Hydrogenation on Iron Catalysts: A Subtle Synergy between Manganese and Sodium Additives. Angew. Chem. Int. Ed. 2020, 59, 21736–21744. [Google Scholar] [CrossRef]
  31. Xu, D.; Li, W.; Duan, H.; Ge, Q.; Xu, H. Reaction performance and characterization of Co/Al2O3 Fischer–Tropsch catalysts promoted with Pt, Pd and Ru. Catal. Lett. 2005, 102, 229–235. [Google Scholar] [CrossRef]
  32. Keyvanloo, K.; Mardkhe, M.K.; Alam, T.M.; Bartholomew, C.H.; Woodfield, B.F.; Hecker, W.C. Supported Iron Fischer–Tropsch Catalyst: Superior Activity and Stability Using a Thermally Stable Silica-Doped Alumina Support. ACS Catal. 2014, 4, 1071–1077. [Google Scholar] [CrossRef]
  33. Dry, M.E. The Fischer–Tropsch process: 1950–2000. Catal. Today 2002, 71, 227–241. [Google Scholar] [CrossRef]
  34. Abelló, S.; Montané, D. Exploring iron-based multifunctional catalysts for Fischer-Tropsch synthesis: A review. ChemSusChem 2011, 4, 1538–1556. [Google Scholar] [CrossRef] [PubMed]
  35. Chai, J.; Jiang, J.; Gong, Y.; Wu, P.; Wang, A.; Zhang, X.; Wang, T.; Meng, X.; Lin, Q.; Lv, Y.; et al. Recent Mechanistic Understanding of Fischer-Tropsch Synthesis on Fe-Carbide. Catalysts 2023, 13, 1052. [Google Scholar] [CrossRef]
  36. Guo, L.; Sun, J.; Ge, Q.; Tsubaki, N. Recent advances in direct catalytic hydrogenation of carbon dioxide to valuable C2+ hydrocarbons. J. Mater. Chem. A 2018, 6, 23244–23262. [Google Scholar] [CrossRef]
  37. Liu, S.; Sun, B.; Zhang, Y.; Li, J.; Resasco, D.E.; Nie, L.; Wang, L. The role of intermediate CoxMn1−xO (x = 0.6–0.85) nanocrystals in the formation of active species for the direct production of lower olefins from syngas. Chem. Commun. 2019, 55, 6595–6598. [Google Scholar] [CrossRef]
  38. Cheng, K.; Ordomsky, V.V.; Legras, B.; Virginie, M.; Paul, S.; Wang, Y.; Khodakov, A.Y. Sodium-promoted iron catalysts prepared on different supports for high temperature Fischer–Tropsch synthesis. Appl. Catal. A Gen. 2015, 502, 204–214. [Google Scholar] [CrossRef]
  39. An, X.; Wu, B.; Wan, H.; Li, T.; Tao, Z.; Xiang, H.; Li, Y. Comparative study of iron-based Fischer–Tropsch synthesis catalyst promoted with potassium or sodium. Catal. Commun. 2007, 8, 1957–1962. [Google Scholar] [CrossRef]
  40. van Steen, E.; Claeys, M.; Möller, K.P.; Nabaho, D. Comparing a cobalt-based catalyst with iron-based catalysts for the Fischer-Tropsch XTL-process operating at high conversion. Appl. Catal. A Gen. 2018, 549, 51–59. [Google Scholar] [CrossRef]
  41. Zhou, W.; Cheng, K.; Kang, J.; Zhou, C.; Subramanian, V.; Zhang, Q.; Wang, Y. New horizon in C1 chemistry: Breaking the selectivity limitation in transformation of syngas and hydrogenation of CO2 into hydrocarbon chemicals and fuels. Chem. Soc. Rev. 2019, 48, 3193–3228. [Google Scholar] [CrossRef]
  42. Ding, M.; Yang, Y.; Li, Y.; Wang, T.; Ma, L.; Wu, C. Impact of H2/CO ratios on phase and performance of Mn-modified Fe-based Fischer Tropsch synthesis catalyst. Appl. Energy 2013, 112, 1241–1246. [Google Scholar] [CrossRef]
  43. Dai, Y.; Zhao, Y.; Lin, T.; Li, S.; Yu, F.; An, Y.; Wang, X.; Xiao, K.; Sun, F.; Jiang, Z.; et al. Particle Size Effects of Cobalt Carbide for Fischer–Tropsch to Olefins. ACS Catal. 2019, 9, 798–809. [Google Scholar] [CrossRef]
  44. Molares, F.; de Groot, F.M.F.; Gijzeman, O.L.J.; Mens, A.; Stephan, O.; Weckhuysen, B.M. Mn promotion effects in Co/TiO2 Fischer–Tropsch catalysts as investigated by XPS and STEM-EELS. J. Catal. 2005, 230, 301–308. [Google Scholar] [CrossRef]
  45. Bezemer, G.L.; Radstake, P.B.; Koot, V.; van Dillen, A.J.; Geus, J.W.; de Jong, K.P. Preparation of Fischer–Tropsch cobalt catalysts supported on carbon nanofibers and silica using homogeneous deposition-precipitation. J. Catal. 2006, 237, 291–302. [Google Scholar] [CrossRef]
Figure 1. Textural properties of the CoFe catalysts: (a) N2 adsorption–desorption isotherms; (b) Pore size distribution.
Catalysts 13 01472 g001
Figure 2. XRD patterns of various samples: (a,b) Calcined samples; (c,d) Reduced samples; (e) Spent samples; and (f) H2-TPR profile of calcined samples.
Catalysts 13 01472 g002
Figure 3. HRTEM images of the spent catalysts: (a1,a2) Co; (b1,b2) Co5Fe1; (c1,c2) Co2Fe1; (d1,d2) Co1Fe1; (e1,e2) Co1Fe2; (f1,f2) Fe.
Catalysts 13 01472 g003
Figure 4. Catalytic performance of various catalysts. CO conversion (a), product selectivity (b), and olefin yield (c) for various catalysts. Reaction condition: H2/CO = 0.5, 10 bar, 260 °C, 2000 mL/g/h. (df) Effect of the reaction condition on CO conversion and product selectivity over the Co2Fe1 catalyst. (Reaction condition in (d): H2/CO = 0.5, 10 bar, 2000 mL/g/h; reaction condition in (e): H2/CO = 0.5, 255 °C, 2000 mL/g/h; reaction condition in (f): 255 °C, 10 bar, 2000 mL/g/h).
Catalysts 13 01472 g004
Figure 5. Hydrocarbon products distribution and the corresponding chain growth probability (α) of various catalysts. The blue dots in (af) denotes the value of Ln(Wn/n), where the Wn is defined as the weight fraction of hydrocarbon product with carbon number of n. The pink dash line denotes the fitted trend. The carbon chains probability (α) is obtained by fitting the results using the ASF model. Reaction conditions: H2/CO = 0.5, 260 °C, 10 bar, 2000 mL/g/h.
Catalysts 13 01472 g005
Figure 6. Stability test over Co2Fe1 catalyst. Reaction condition: H2/CO = 0.5, 10 bar, 250 °C, 2000 mL/g/h.
Catalysts 13 01472 g006
Figure 7. MS signal of CO2 for the disproportionation reaction of CO to form CO2 and surface carbonaceous species. Experiments were conducted at 260 °C.
Catalysts 13 01472 g007
Table 1. Composition and textural properties of the various catalysts.
SamplesCo a (wt.%)Fe a (wt.%)Na a (wt.%)Co/Fe b (Co + Fe)/Mn/Al bSBET (m2/g)Pore Volume (cm3/g)Pore Size (nm)
Co26.603.8-1.0:1.0:1.22220.498.8
Co5Fe122.74.02.35.31.1:1.0:1.02160.427.8
Co2Fe117.58.23.52.01.0:1.0:0.91410.4412.4
Co1Fe113.412.53.01.01.0:1.0:0.91660.4510.8
Co1Fe28.716.13.80.50.6:1.0:1.01840.337.2
Fe026.63.601.1:1.0:0.81780.368.0
a The element composition was determined by XRF. b The molar ratio of the element composition.
Table 2. Catalytic performance over various catalysts for the FTO reaction a.
CatalystsCO Conv. (C%)CO2 Sele. (C%)Product Sele. (C%, CO2-Free)Olefin/Paraffin RatioOlefins Yield (C%)
OlefinsOxy. bC2+ RH cOlefins + Oxy.CH4C2C3C4O/P
Co13.547.567.325.04.992.32.912.420.414.28.79.1
Co5Fe124.549.665.818.510.284.35.53.39.36.74.216.1
Co2Fe137.546.166.117.112.583.24.33.08.86.03.924.8
Co1Fe133.840.961.812.021.073.95.12.67.14.92.420.9
Co1Fe225.035.062.37.924.470.25.42.56.95.32.115.6
Fe13.649.270.110.212.580.37.25.88.56.53.69.5
a Reaction conditions: 10 bar, 260 °C, H2/CO = 0.5, 2000 mL/g/h. b Oxy. (aldehydes and alcohols). c The fraction of paraffin with two or more carbon numbers in all products.
Table 3. The effect of reaction conditions on FTO performance over the Co2Fe1 catalyst a.
H2/COP (bar)Temp. (°C)XCO (C%) CO2 Sele. (C%)Product Selectivity (C%, CO2-Free) Olefin/Paraffin RatioOlefins Yield (C%)
OlefinsOxy. bC2+ RH cOlefins + Oxy.CH4C2C3C4O/P
0.51025022.548.766.520.69.187.03.96.09.76.85.114.9
25528.949.163.818.913.182.74.23.58.86.53.717.8
26037.546.166.117.112.583.24.33.08.86.03.924.8
0.5525517.850.363.222.510.785.73.69.515.110.84.411.2
1532.847.660.217.218.077.44.62.66.44.82.719.7
2034.850.157.717.419.075.25.82.35.33.82.320.1
0.751025532.541.950.616.427.467.05.51.95.13.31.516.5
11041.935.144.416.233.660.65.71.03.52.81.118.6
a Reaction conditions: 250~260 °C, 5~20 bar, H2/CO = 0.5~1, 2000 mL/g/h. b Oxy. (aldehydes and alcohols). c The fraction of paraffin with two or more carbon numbers in all products.
Disclaimer/Publisher’s Note: The statements, opinions and data contained in all publications are solely those of the individual author(s) and contributor(s) and not of MDPI and/or the editor(s). MDPI and/or the editor(s) disclaim responsibility for any injury to people or property resulting from any ideas, methods, instructions or products referred to in the content.

