Article

Green Synthesis of Mixed ZnO-SnO2 Nanoparticles for Solar-Assisted Degradation of Synthetic Dyes

by
Tahani Saad Algarni
*,
Amal M. Al-Mohaimeed
,
Naaser A. Y. Abduh
,
Reem Abdulrahman Habab
and
Saad Mohammed Alqahtani
*
Department of Chemistry; College of Science, King Saud University, Riyadh 11451, Saudi Arabia
*
Authors to whom correspondence should be addressed.
Catalysts 2023, 13(12), 1509; https://doi.org/10.3390/catal13121509
Submission received: 31 October 2023 / Revised: 30 November 2023 / Accepted: 7 December 2023 / Published: 13 December 2023
(This article belongs to the Special Issue Catalysts and Photocatalysts Based on Mixed Metal Oxides)

Abstract

:
In this work, ZnO, SnO2, and their mixed ZnO-SnO2(25%) nanoparticles (NPs) were successfully green synthesized in a straightforward manner with a low-cost and environmentally friendly approach using a banana peel extract. The synthesized nanophotocatalysts were characterized using various techniques including FTIR, XRD, UV-Vis, TEM, SEM, BET, PL, EDS, and TGA. The characterization results showed that the ZnO and SnO2 powders were crystallized in a hexagonal wurtzite and rutile-type tetragonal structures, respectively, and their mixed ZnO-SnO2(25%) NPs contain both structures. Also, it was found that the addition of SnO2 into the ZnO structure reduces the PL intensity of the latter, confirming better separation of electron/hole pairs. The average particle size of a ZnO-SnO2(25%) NP photocatalyst was found to be 7.23 nm. The cationic dyes methylene blue (MB) and crystal violet (CV) as well as the anionic dyes naphthol blue black (NBB) and Coomassie brilliant blue R 250 (CBB) were employed as model dyes to assess the dye removal efficiencies of the biosynthesized nanophotocatalysts under sunlight. In all cases, the mixed ZnO-SnO2(25%) NP photocatalyst showed much better photocatalytic activity than individual photocatalysts. The degradation percent of dyes using ZnO-SnO2(25%) NPs ranged between 92.2% and 98%. The efficient photocatalytic activity of ZnO-SnO2(25%) NPs is attributed to the effective charge separation and reduced electron/hole recombination rate. The kinetic study results conformed to a pseudo first-order reaction rationalized in terms of the Langmuir–Hinshelwood model. Furthermore, the results showed that the ZnO-SnO2(25%) NP photocatalyst is highly stable and could be recycled several times without a noticeable reduction in its catalytic activity towards dye removal.

1. Introduction

From ancient times to the nineteenth century, natural dyes extracted from natural resources such as flowers, vegetables, woods, roots, insect secretions, and minerals were the only dyes used by people for coloring textiles [1,2]. However, the increasing demands for and the excessive costs of natural dye extraction engendered the discovery of synthetic dyes that are manufactured from petrochemicals [3]. Synthetic dyes are easy to synthesize, soluble in water, act fast in fabric coloration, and have a wide range of color options. Therefore, textile companies prefer synthetic dyes over natural dyes [4]. In addition to their use in textiles, synthetic dyes are used in large quantities in various industries. For example, they are used in leather, paints, printing, paper, tannery, rubber, cosmetics, plastics, pharmaceutical products, and the food industry [5]. However, the continuous discharge of synthetic dyes originating from the textile industry and other industrial activities contributes significantly to water pollution. The adverse effect of the discharge of untreated aqueous solutions of dyes not only affects water ecosystems but also represents a serious threat to human, plant, and animal health [6,7]. The various synthetic organic dyes are main water toxins, and they cause environmental issues with extensive production due to their poor biodegradability, aromaticity, chemical stability, toxicity, and carcinogenic nature [8]. Even at very low concentrations (<1 ppm), dyes are clearly visible in water and severely deteriorate aquatic environments [9]. Hence, dye removal from wastewater before it is discharged back into the environment is a subject of great importance [10].
Despite the extensive efforts that have been made in the successful removal of dyes from wastewater, designing an efficient method for dye removal is still an area requiring a great deal of research [11]. To protect the environment from pollutants, various strategies have been suggested and adopted by many studies to eliminate or reduce the amount of dyes in wastewaters to an acceptable concentration before draining [12]. The methods used for the remediation of dye-containing wastewater are grouped into three categories, namely the physical, chemical, and biological methods [13]. The physical methods include adsorption, coagulation–flocculation, reverse osmosis, and membrane filtration methods [14]. The chemical methods include advanced oxidation processes (AOPs), electrochemical destruction, Fenton reactions, oxidation, ozonation, and photochemical and ultraviolet irradiation [15]. The biological methods include biosorption and enzymatic degradation [16]. Despite the intensive use of these conventional methods as solutions to the problem, none of these methods are adequate for the degradation of all dyes from water. This is due to each approach having its own set of limitations. Such limitations include a high cost, an unsatisfactory efficiency, difficulty in recycling, a potential impact on health, and the production of secondary pollutants [17]. However, in particular, photocatalysts offered a promising approach as one of the most effective techniques for the treatment of dye-containing wastewaters owing to their magnificent photocatalytic removal efficiency, low cost, rapid oxidation process, and non-toxicity [18]. In the past few years, metal oxide semiconductor (MOS) nanoparticles (NPs) such as ZnO, TiO2, CuO, CdO, NiO, ZrO2, etc., have received a great deal of attention due to their promising performances in destroying organic dyes in wastewaters with minimal side pollution [19,20]. However, the intrinsic properties of a heterogenous photocatalyst such as its light absorption range, redox potential, charge separation lifetime, photosensitivity, and stability have significantly influenced its photodegradation efficiency [21]. Therefore, metal oxides exhibit different catalytic activities toward the degradation of dyes under identical reaction conditions due to the differences in their inherent properties. For example, ZnO showed greater activity for the degradation of several organic dyes in water than TiO2 due to the reason that ZnO absorbs a large fraction of the solar spectrum [21]. The photocatalytic reaction using a heterogeneous nanophotocatalyst takes place when the photon energy from the light source is equal to or higher than that of the band gap of the semiconductor. An advanced oxidation process (AOP) starts when light of sufficient energy reaches the semiconductor and the electrons residing in the valence band (VB) of atoms of the nanophotocatalyst are excited to the conduction band (CB). Consequently, the reactive radicals of ( OH ) and superoxide anions ( O 2 ) are generated when H2O molecules (and/or OH ions) and the dissolved O2 molecules in the dye solution react with the hole in the VB and with the electrons in the CB of the semiconductor, respectively. The generated active radicals of ( OH and   O 2 ) react with dye molecules, which will be then quickly and efficiently fragmented and converted into CO2 and H2O [22,23].
Over the years, metal oxides such as SnO2, TiO2, and ZnO have been extensively applied for the photocatalytic decomposition of organic pollutants in wastewater. The removal effectiveness of organic pollutants in the presence of a tin semiconductor is not very promising, despite its many advantages, which limits its employment in comparison to other semiconductors, whereas TiO2 and ZnO semiconductor nanoparticles are frequently employed in photocatalytic processes to eliminate organic contaminates. When exposed to radiation, TiO2 and ZnO function as electron acceptors/donors [24]. ZnO NPs have become one of the most recognized materials for photodegradation of dye pollutants in wastewaters due to their environmental compatibility, low cost, strong oxidizing power, and suitable band gap, and non-toxic nature [24,25]. Unfortunately, the photocatalytic activities of single-component materials such as ZnO and TiO2 are weakened by their high electron–hole pair recombination rate, wide band gap, and the need for UV light for excitation [25,26]. However, it is known that only 5% of UV radiation is available in the total solar spectrum while the remaining 95% falls in the visible region [22]. Therefore, the photocatalytic activities of such systems are enhanced by various approaches such as metal ion doping, nonmetallic element doping, sensitization with organic dyes, and coupling with semiconducting metal oxides [27].
This work aims to synthesize ZnO NPs, SnO2 NPs, and their mixed ZnO-SnO2 NPs (at a molar ratio of Zn:Sn equal to 0.75:0.25) through a green manner using the aqueous banana peel extract (ABPE) as a medium of synthesis for wastewater treatment application. The ABPE would be employed to serve as a capping agent as some studies revealed that flavonoids in BPE are able to chelate metal ions with their carbonyl groups or π-electrons, which stabilizes the nanoparticles and prevents further growth and agglomeration, which leads to the formation of nanoparticles with a small average particle size [28]. The structures, morphologies, optical properties, compositions, and thermal stabilities of the biosynthesized nanophotocatalysts were investigated using FTIR, XRD, UV-Vis, BET, TEM, SEM, PL, EDS, and TGA techniques. The photocatalytic efficiencies of the green synthesized nanophotocatalysts toward photodegradation of organic dyes were examined. For this purpose, the photodegradation efficiency of some model synthetic dyes containing the cationic dyes methylene blue (MB) and crystal violet (CV) as well as the anionic dyes naphthol blue black (NBB) and Coomassie brilliant blue R 250 (CBB) (Scheme 1) over the green synthesized nanophotocatalysts under sunlight irradiation was investigated.

2. Results and Discussion

2.1. Characterization of Nanophotocatalysts

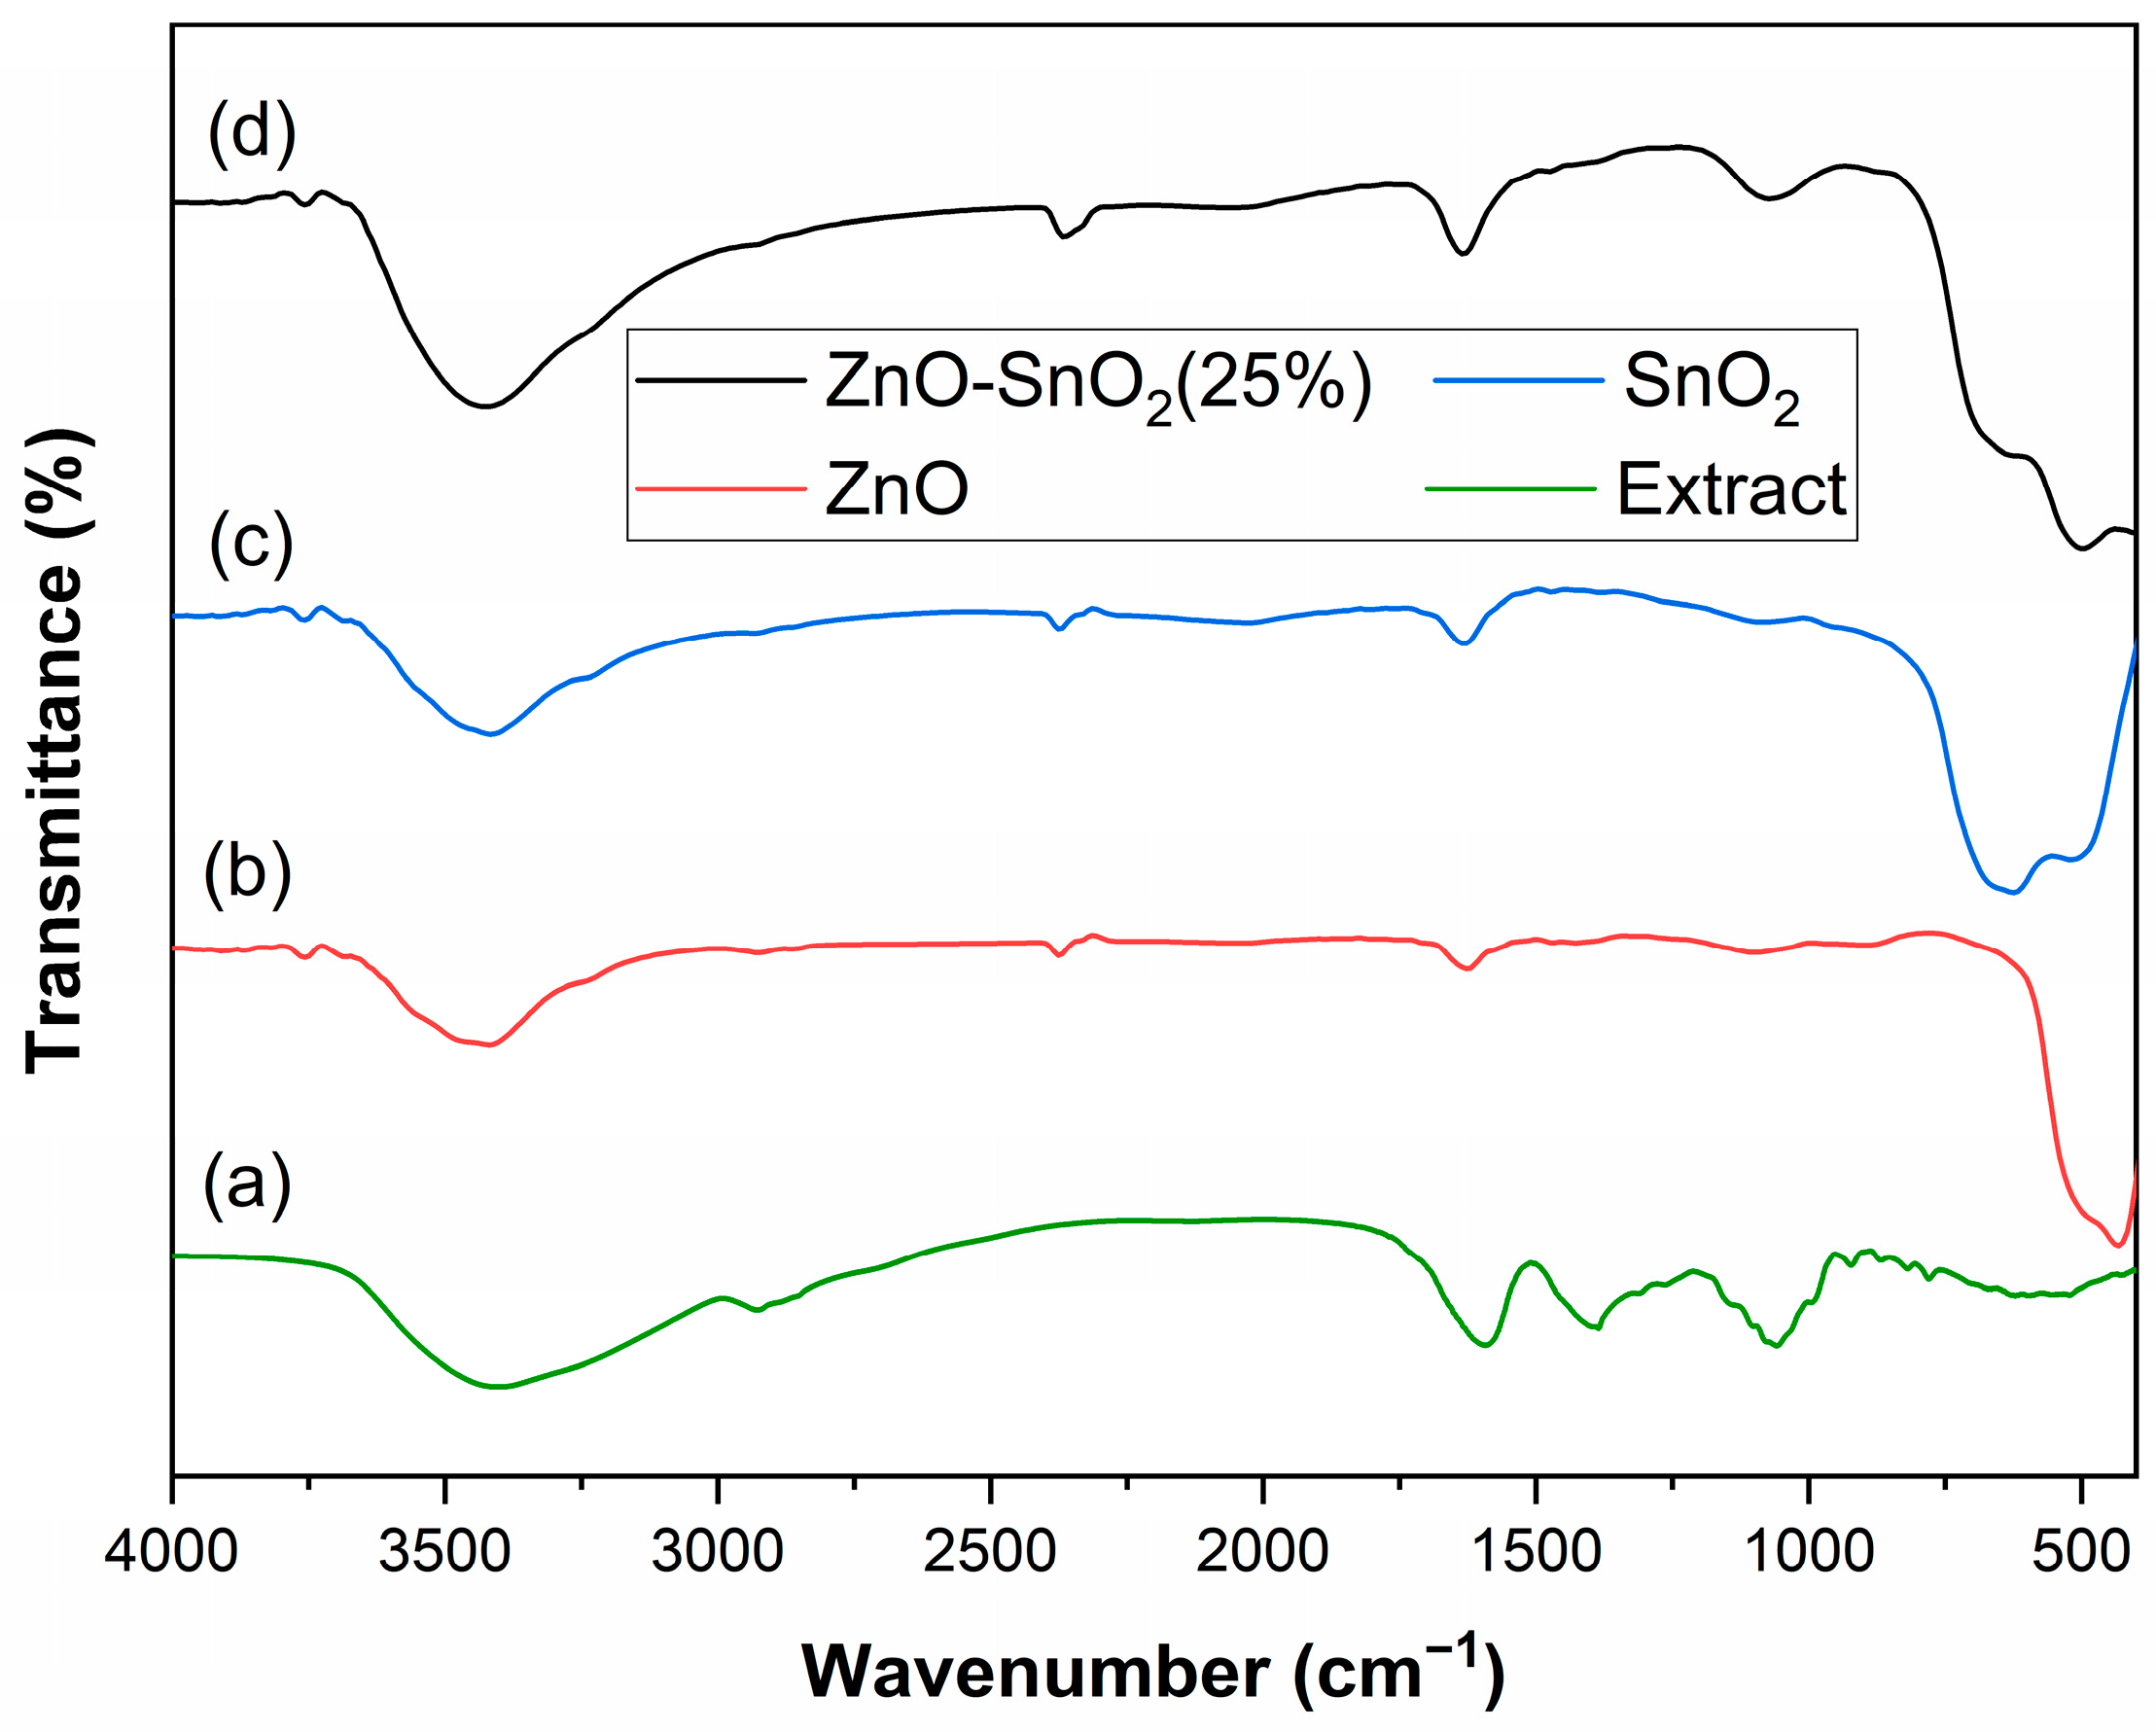
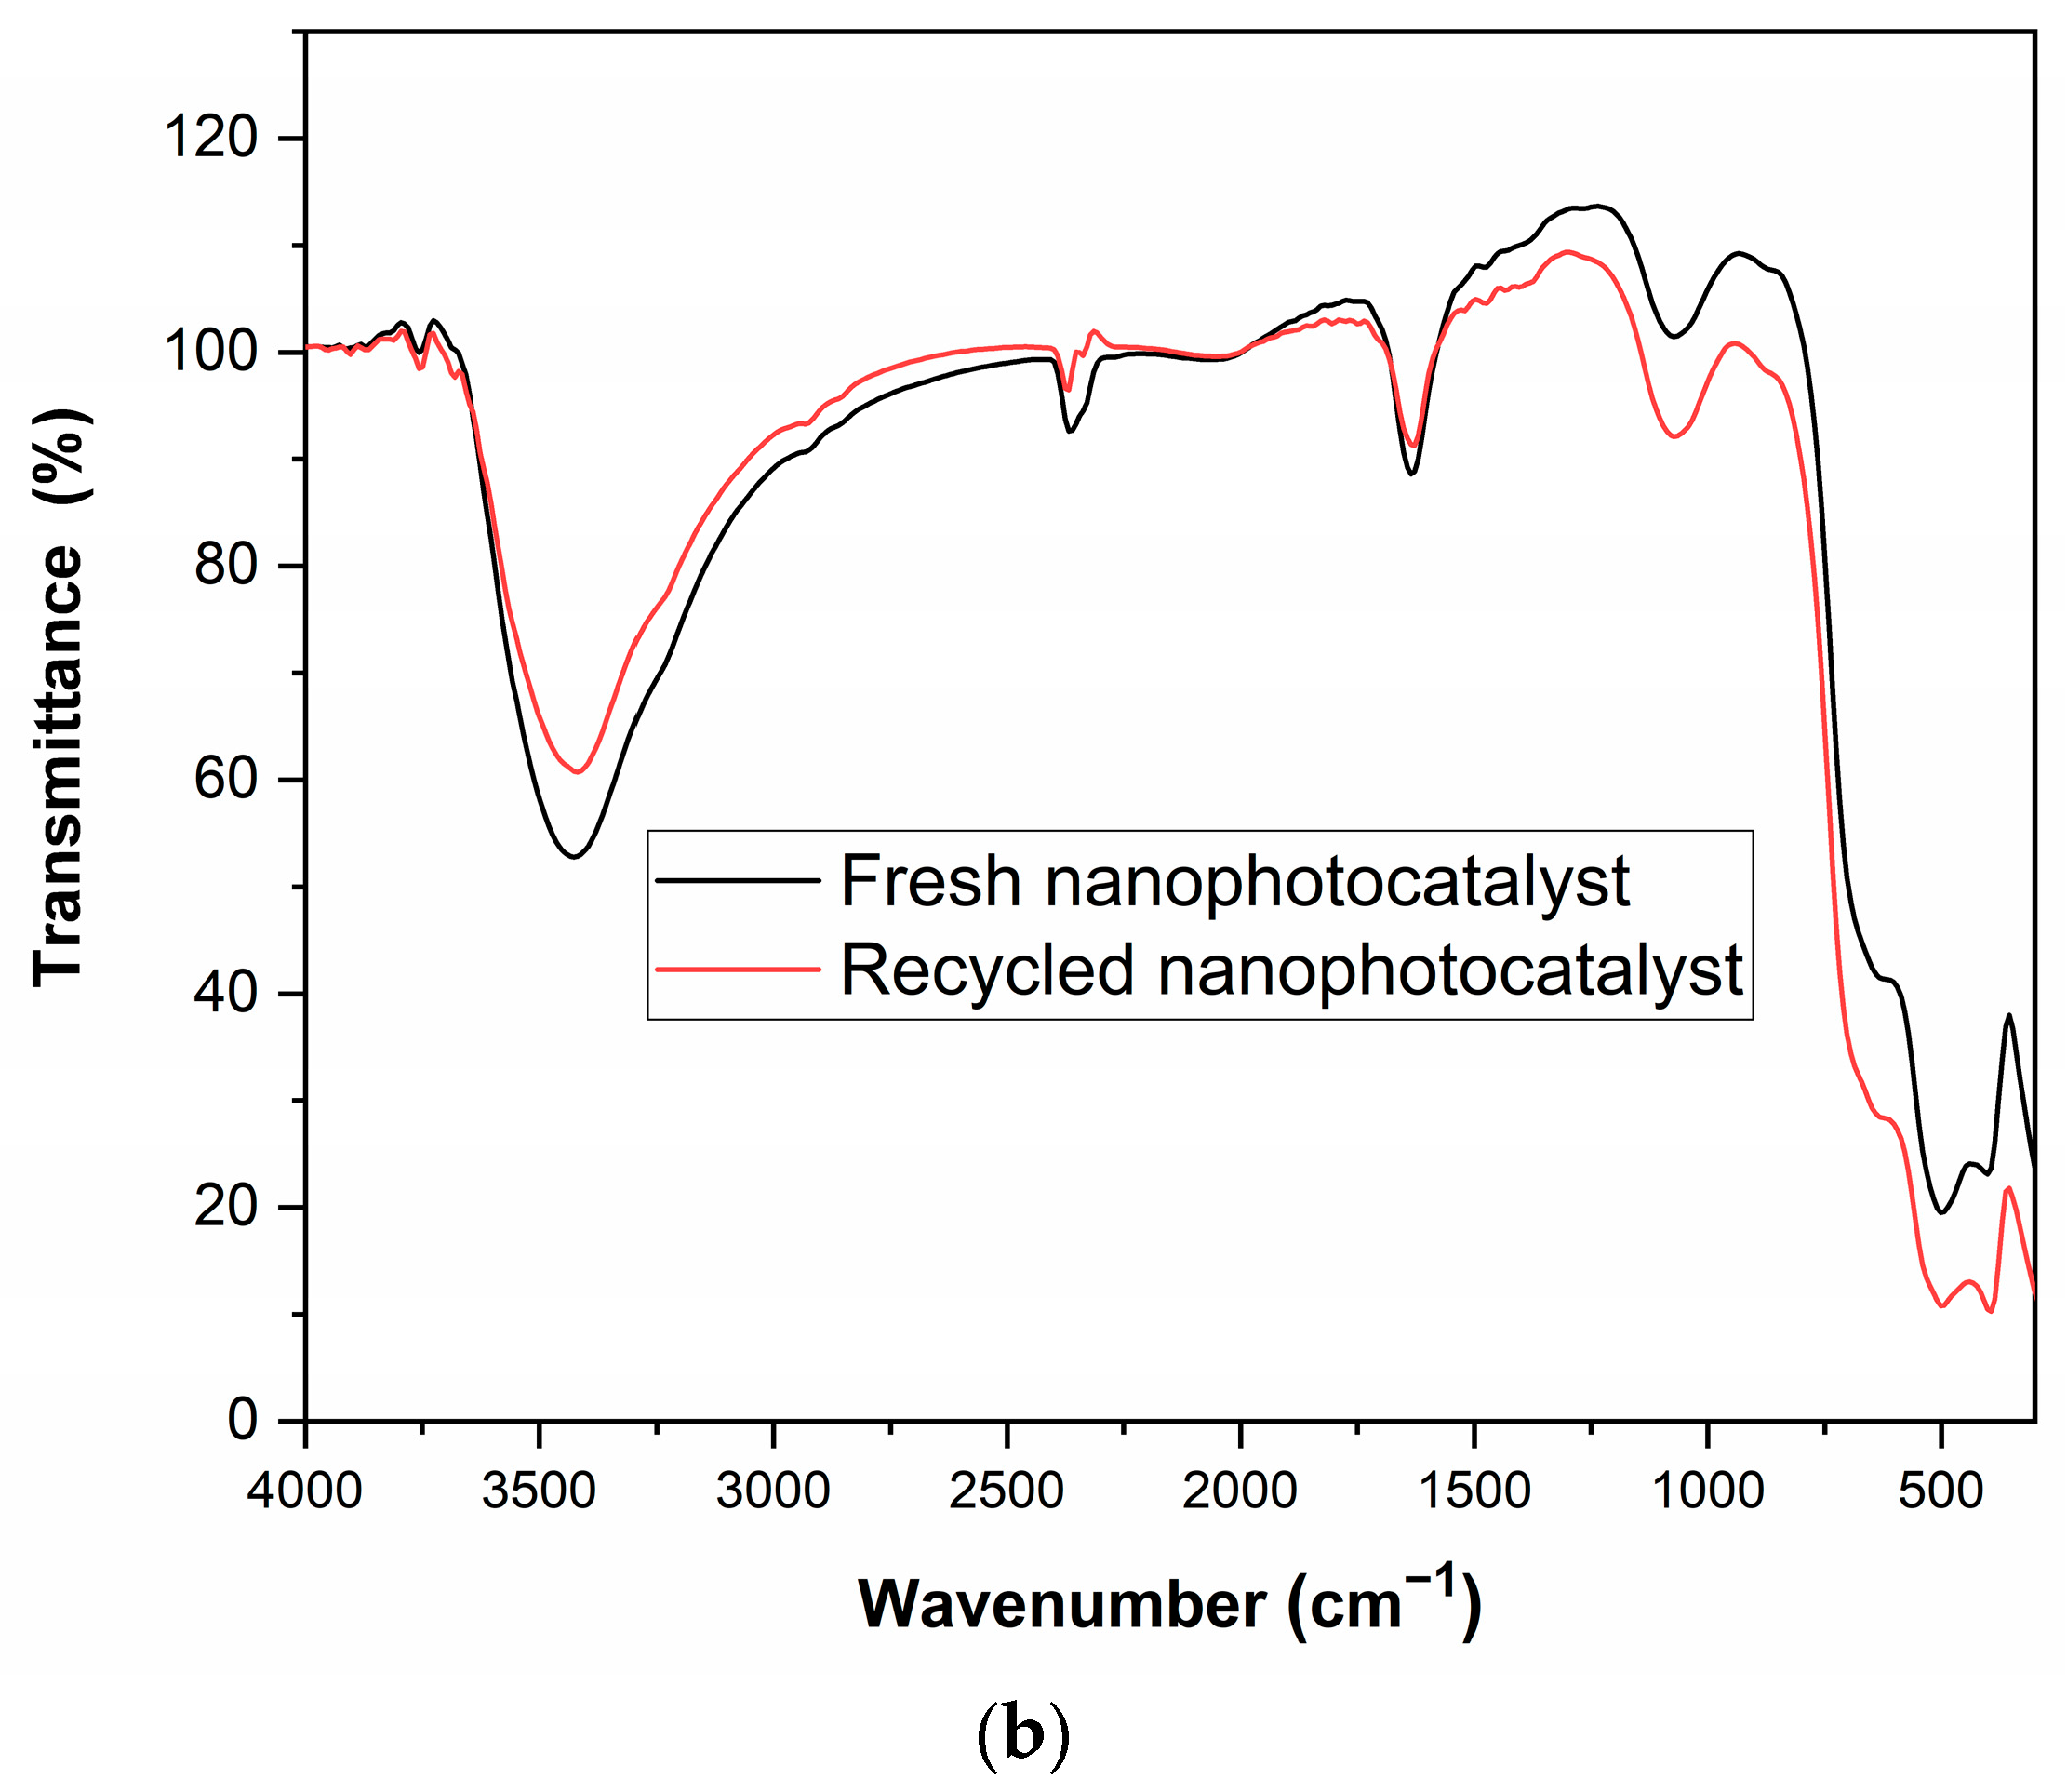
2.1.1. FTIR Analysis
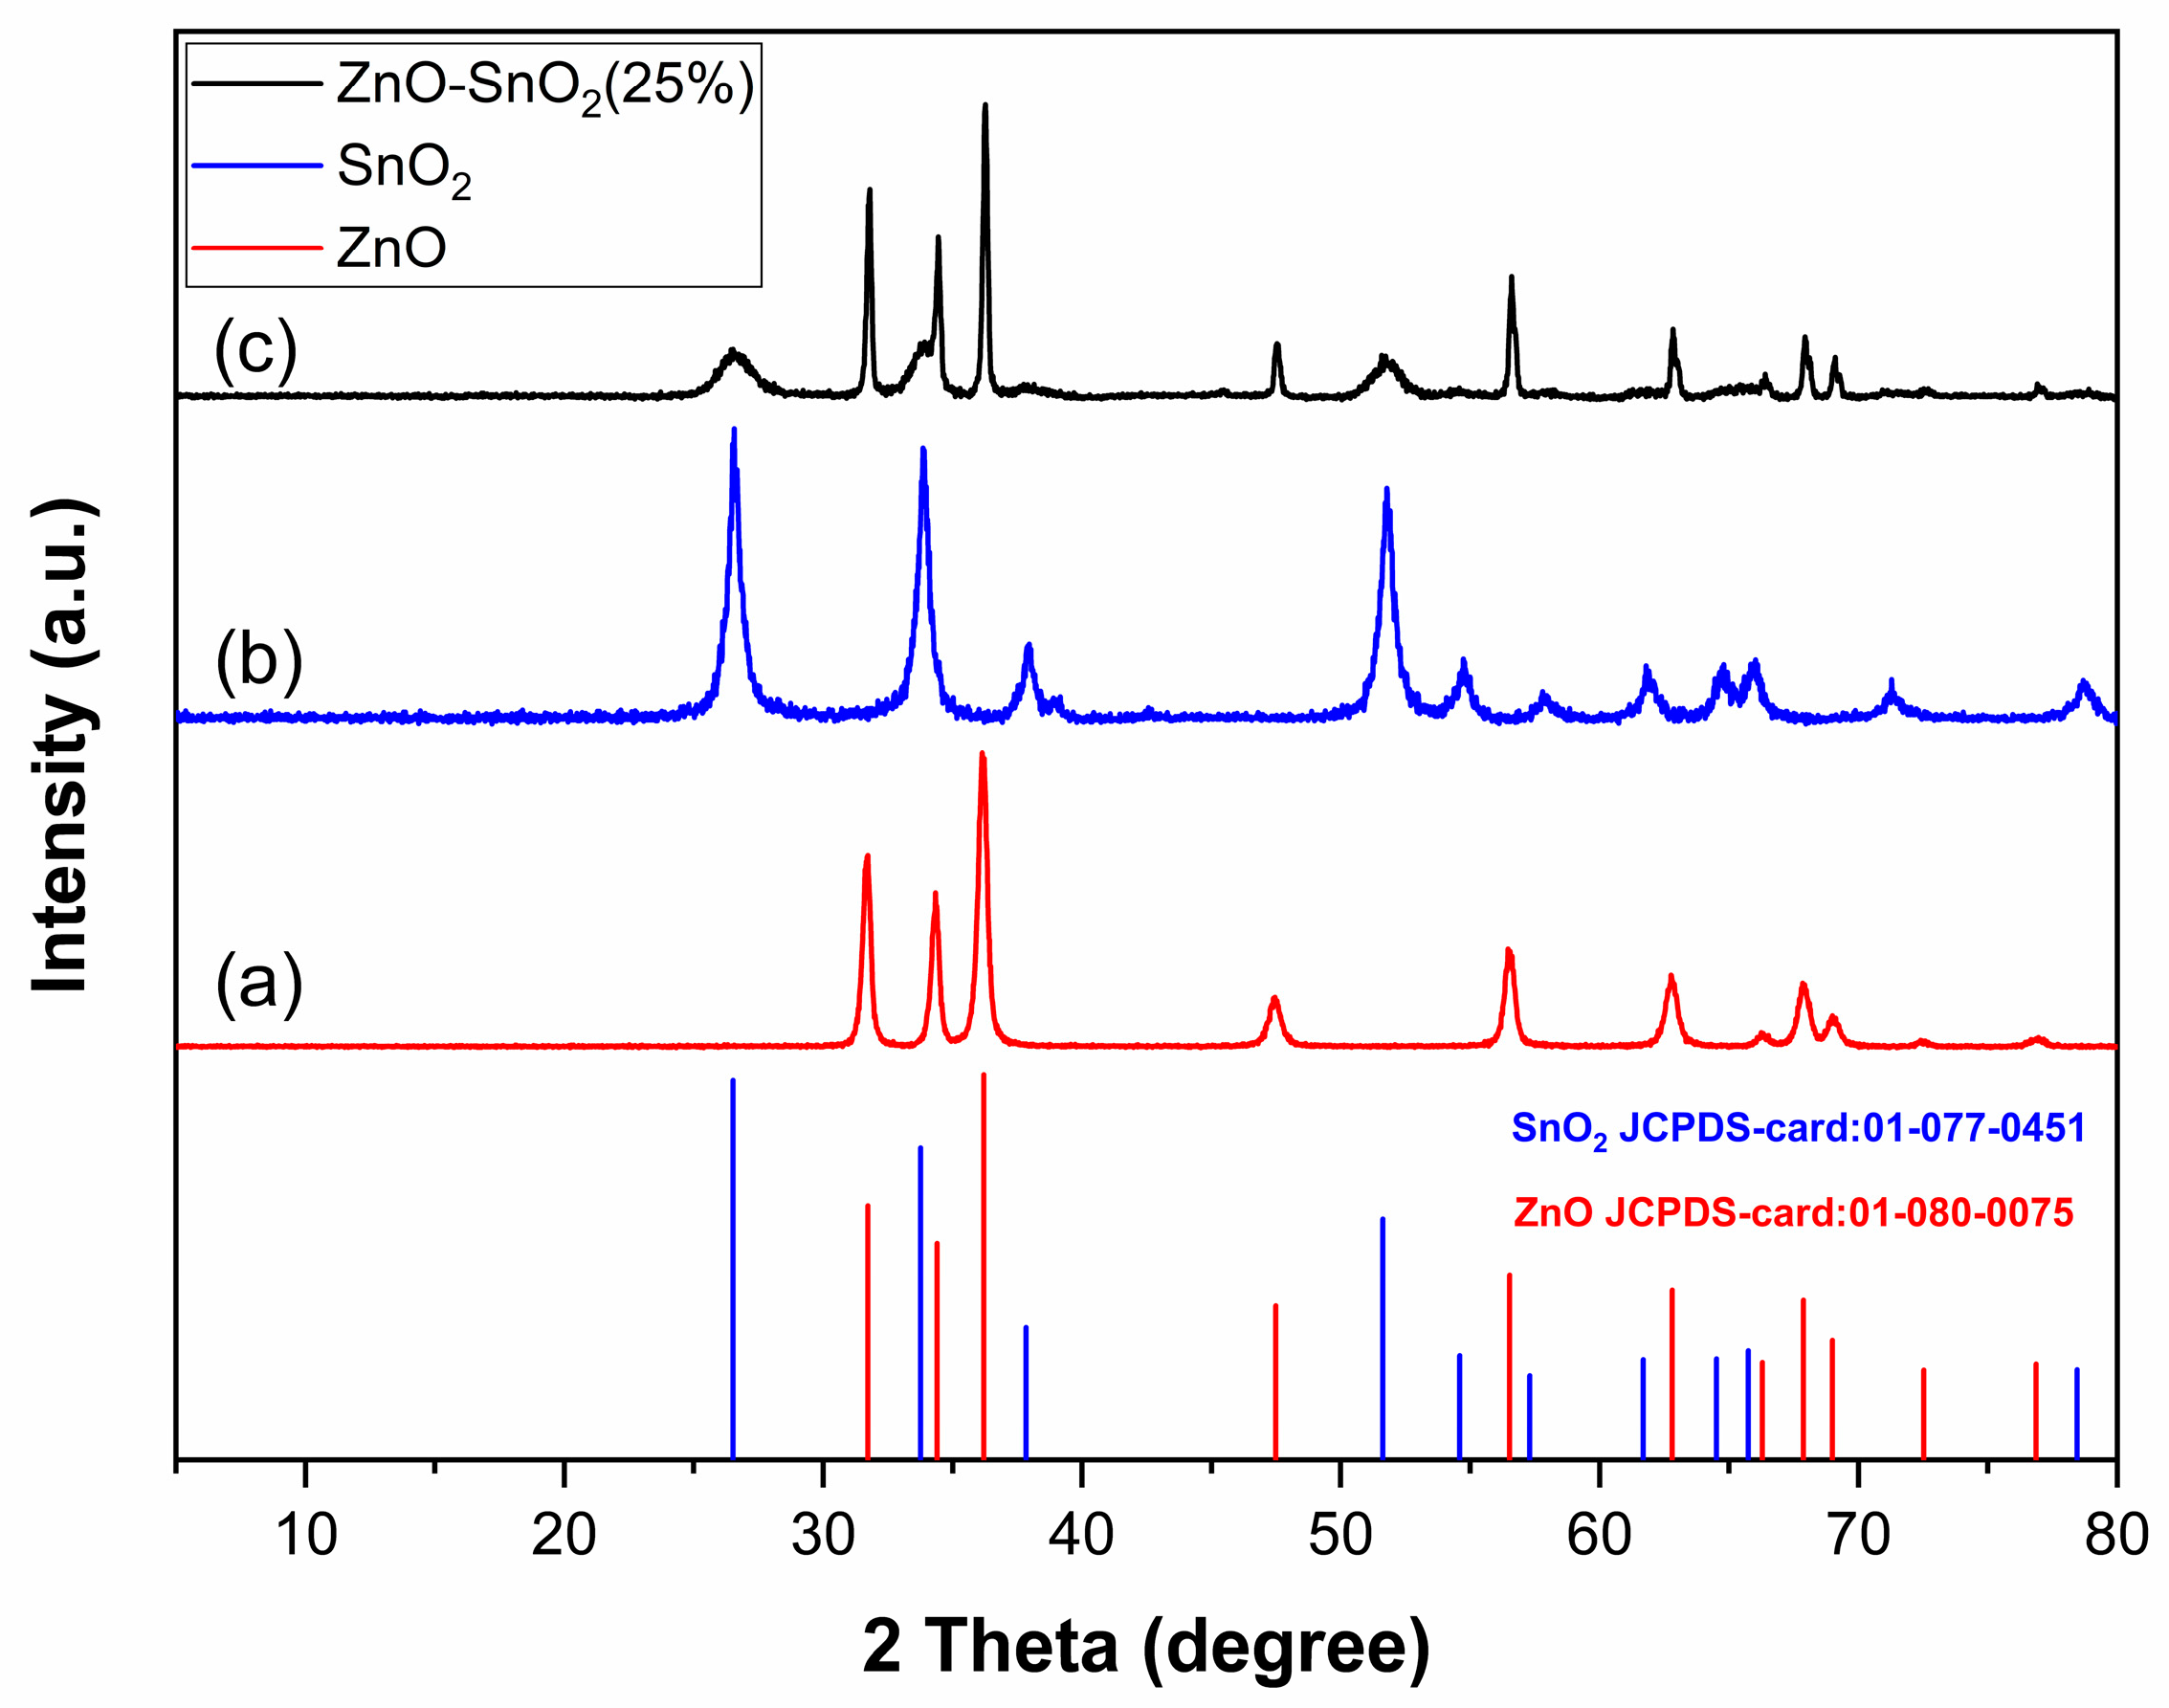
The composition of a banana peel extract (BPE) includes many carbohydrate compounds such as cellulose, hemicellulose, lignin, as well as pectic polysaccharides (pectin) and is also found to contain bioactive compounds such as flavonoids, tannins, alkaloids, glycosides, anthocyanins, and phenols [29,30,31]. In the current study, the aqueous extract of a banana peel includes only the water-soluble substances like pectin, tannins, glycosides, and phenols. Hence, the mechanisms of nanophotocatalyst synthesis are expected to be influenced by the presence of these components [32]. The FTIR spectra of BPE, ZnO NPs, SnO2 NPs, and mixed ZnO-SnO2(25%) NPs are shown in Figure 1. Figure 1 (a) identifies the main functional groups present in the extract. The broad peak observed in the region between 3300 and 3500 cm−1 is associated with the stretching of O-H groups from pectin. The absorption peak occurring at 2931 cm−1 is due to C-H vibration modes. The presence of a high-intensity peak at 1597 cm−1 and 1384 cm−1 is attributed to the vibration of the ionic COO group of pectin. The peak at 1054 cm−1 is ascribed to the C-O-C glycosidic bond vibration. The several peaks in the region between 569 cm−1 and 924 cm−1 are attributed to the vibrations of carbohydrates [33,34]. The peaks of the FTIR spectrum of BPE are suggestive that pectin is the main component in the extract [35].
The intense peaks observed at ~ 3420 cm−1 in all spectra (b–d) were assigned to the O-H stretching bond vibrations, which indicates the presence of water adsorption on the surface of ZnO NPs, SnO2 NPs, and ZnO-SnO2(25%) NPs [36]. In Figure 1 (b), the strong peak observed at 429 cm−1 and the peak at 517 cm−1 correspond to the vibration of the Zn-O bond [37,38]. In Figure 1 (c), the absorption peak at around 508 cm−1 and 641 cm−1 is attributed to Sn-O stretching vibration and O-Sn-O bending vibration, respectively [39,40,41]. In Figure 1 (d), the characteristic peaks of ZnO NPs and SnO2 NPs are present. The existence of these characteristic bands in FTIR spectra confirms the successful formation of ZnO NPs, SnO2 NPs, as well as the ZnO-SnO2(25%) NPs [42,43].

2.1.2. XRD Analysis

The crystalline natures of biosynthesized ZnO NPs, SnO2 NPs, and ZnO-SnO2(25%) NPs were analyzed via their XRD patterns.
The XRD spectrum of ZnO NPs (Figure 2 (a)) exhibits distinct peaks at 2θ values of 31.68°, 34.33°, 36.16°, 47.45°, 56.53°, 62.78°, 66.32°, 67.89°, 69.02°, 72.47°, and 76.91°, which are assigned to the indices (100), (002), (101), (102), (110), (103), (200), (112), (201), (004), and (202) crystal planes, respectively. They can be indexed as a hexagonal wurtzite crystal structure by matching with the Joint Committee on Powder Diffraction Standard (JCPDS) card number 01-080-0075 [44]. The XRD patterns of ZnO NPs agreed with previously reported studies [45,46,47,48]. The XRD diffraction of SnO2 NPs is depicted in Figure 2 (b). The distinct diffraction peaks at 2θ = 26.57°, 33.87°, 37.93°, 51.80°, 54.73°, 57.90°, 61.92°, 64.77°, 65.95°, 71.32°, and 78.74° correspond to the crystalline planes (110), (101), (200), (211), (220), (002), (310), (112), (301), (202), and (321), respectively. These results are in good agreement with that of pure SnO2 crystalline phases according to the JCPDS card number 01-077-0451; therefore, the SnO2 NPs have a rutile-type tetragonal crystal structure [49,50,51,52]. The presence of ZnO and SnO2 crystal phases in the XRD patterns of the ZnO-SnO2(25%) nanocomposite shown in Figure 2 (c) is evidence of the coexistence of both hexagonal ZnO and tetragonal SnO2 crystal structures in the composite. The XRD analysis revealed that all of the characteristic peaks in these three spectra were of ZnO NPs and SnO2 NPs and no other patterns of possible impurities were observed, which indicated that the samples are of high purities. The sharp and narrow peaks in all spectra implied that the nanoparticles have high crystallinity degrees. These XRD spectra indicated that the nanomaterials were successfully green synthesized using ABPE as a medium of synthesis.

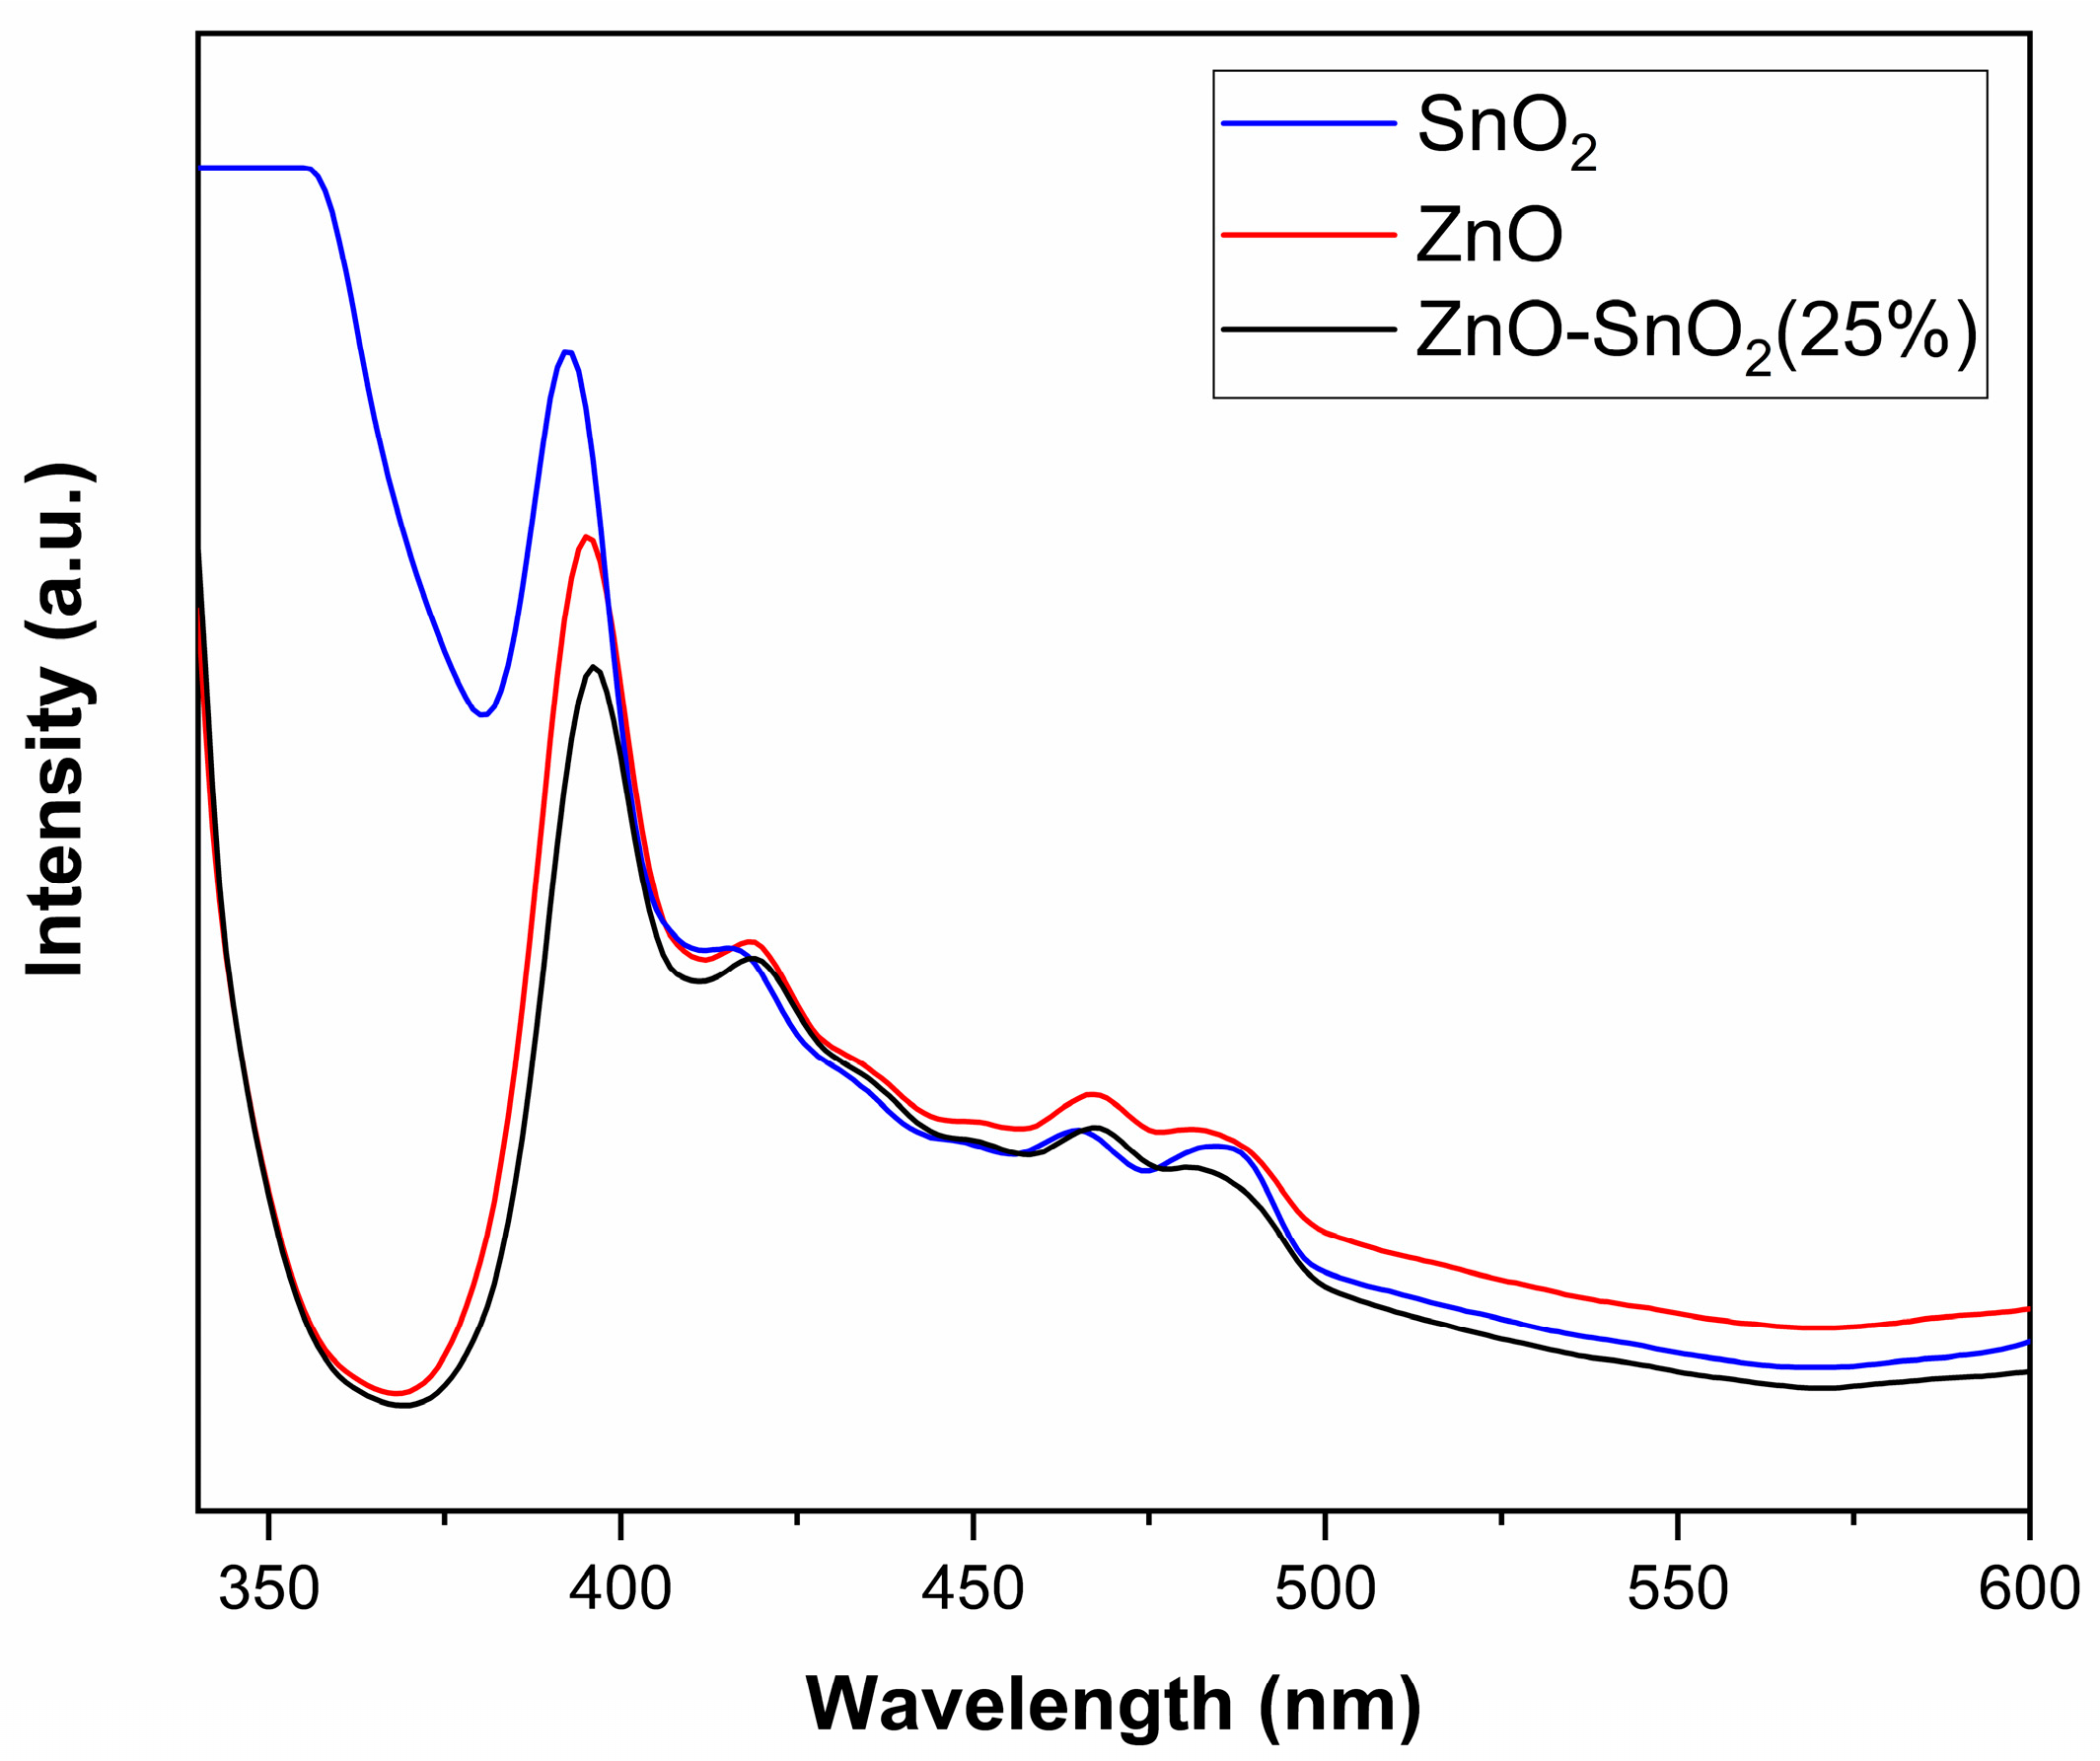
2.1.3. Optical Analysis—Band Gap Determination

The optical band gap (Eg) is an essential characteristic of semiconductor materials that can be influenced by the material compositions and particle sizes. To confirm the formation of ZnO NPs, SnO2 NPs, and ZnO-SnO2 NPs synthesized in the ABPE and to evaluate their band gap values (Eg), the optical properties of these three nanomaterials were analyzed through the UV–Vis spectroscopy technique at a wavelength ranging from 250 to 800 nm. The obtained results of this analysis are displayed in Figure 3. The band gap energies of the nanomaterials were found by means of the Tauc equation:
(αhν)1/n = A(Eg)
where the symbols h, ν, α, and Eg represent Planck’s constant, frequency, absorption coefficient, and band gap energy, respectively. The symbol A is the proportionality constant and n denotes the type of electronic transition and it has the value of ½ for permitted transition, which is the case for all of the NPs discussed in this study. By plotting the curve (αhν)2 versus energy, the band gap (Eg) values for all of the prepared nanomaterials were readily determined by extrapolating the linear section of the curve (αhν)2 to the x-axis (energy axis) as illustrated in Figure 3. The band gap (Eg) energies for ZnO NPs and SnO2 NPs were found to be 3.21 and 3.55 eV, respectively. The energy band gap energy (Eg) of ZnO-SnO2(25%) NPs was found to be 3.18 eV. The obtained values of band gap (Eg) energies are comparable to their reported values [53,54].

2.1.4. Photoluminescence (PL) Measurements

The influence of the addition of SnO2 NPs into the lattice of ZnO NPs on the photoluminescence (PL) emission of the latter was investigated. The PL emission spectra of pure ZnO NPs, pure SnO2 NPs, and ZnO-SnO2(25%) NPs were measured using ultraviolet light with a wavelength of 330 nm as an excitation source. The PL spectra of ZnO NPs, SnO2 NPs, and ZnO-SnO2(25%) NPs are displayed in Figure 4.
The distinctive peaks appearing around 396 nm are ascribed to the recombination of an electron–hole pair in the metal vacancy [19,55]. By comparing the intensities of peaks at 396 nm, it was found that the intensity of this peak in the spectrum of ZnO-SnO2(25%) NPs is lower than that of pure ZnO NPs’ spectrum. The decrease in the peak intensity in the ZnO-SnO2(25%) NPs implies that the inserted SnO2 NPs in the ZnO NPs’ lattice act as an electron collector and decrease the recombination rate of the electron–hole pair in the Zn vacancy.

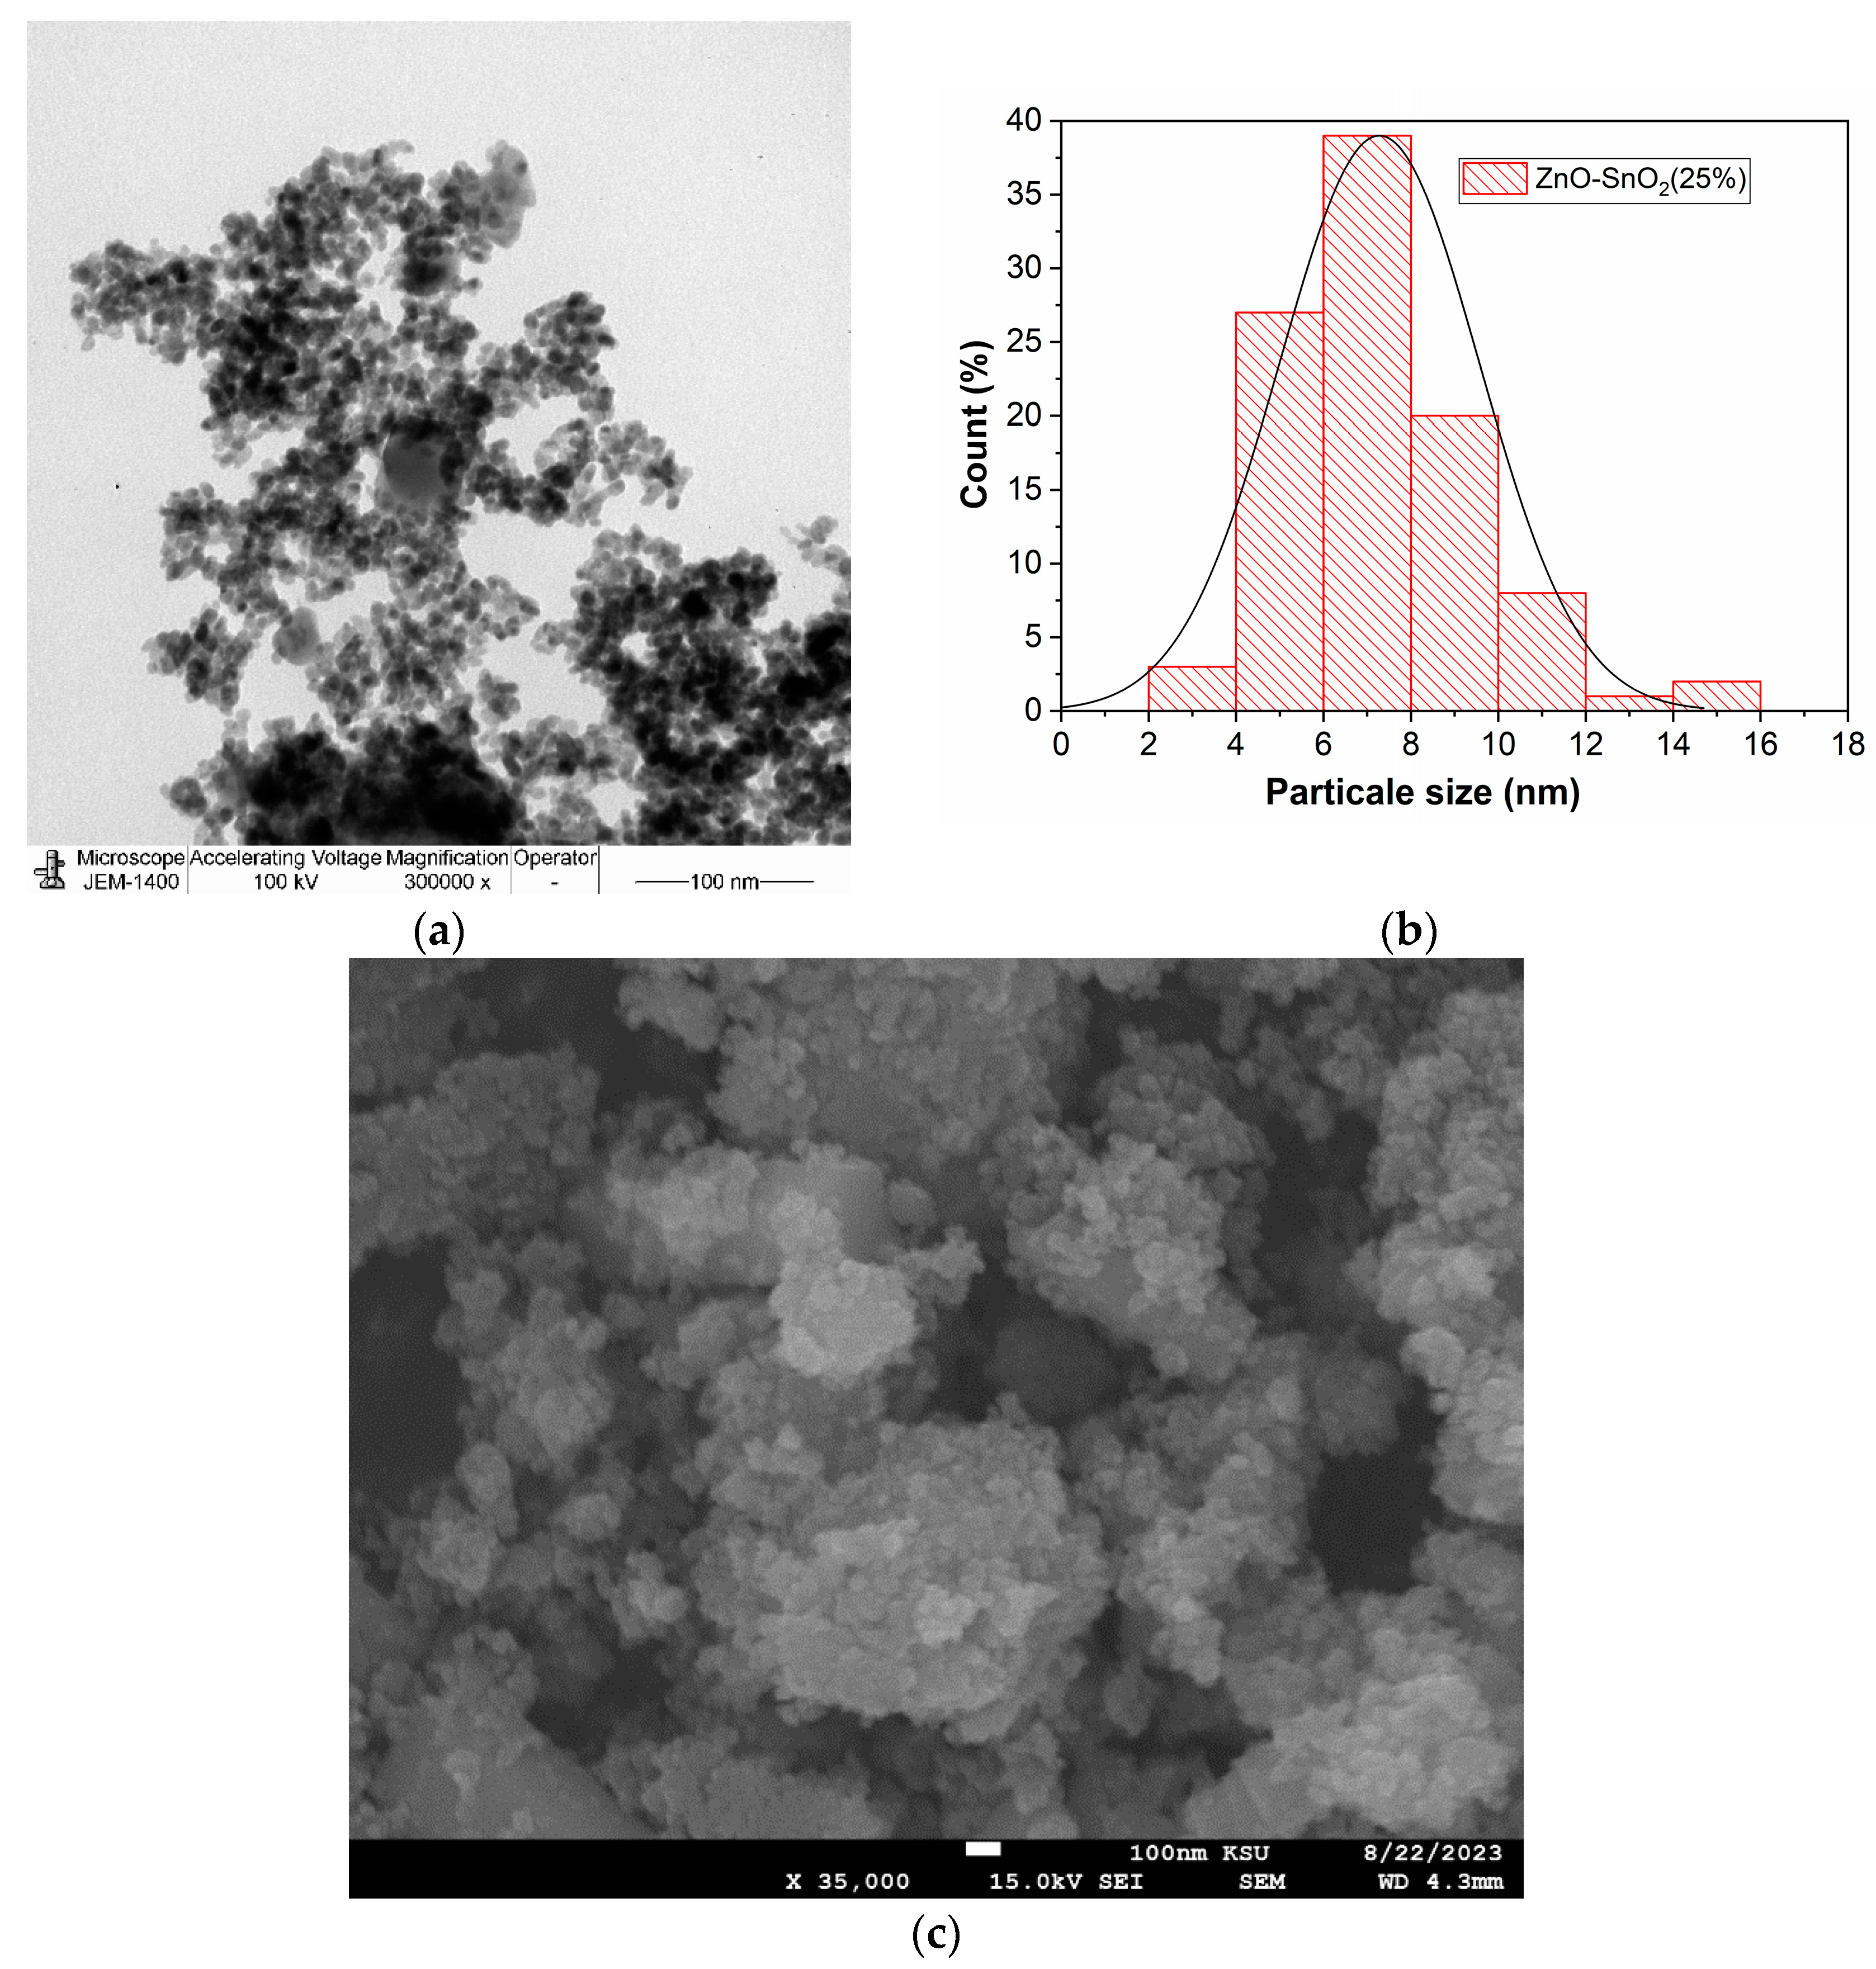
2.1.5. Morphology Analysis

The particle sizes, shape, and morphology of the crystallites of the biosynthesized ZnO-SnO2(25%) NPs were examined by transmission electron microscopy (TEM). The TEM image and the corresponding particle size distributions of the ZnO-SnO2(25%) NPs are given in Figure 5a,b. As observed in the TEM image, the ZnO-SnO2(25%) NPs are composed of aggregated ZnO and SnO2 NPs and the shapes of ZnO NPs and SnO2 NPs are almost spherical. The average particle size of the ZnO-SnO2(25%) NPs as estimated from the TEM analysis is found to be 7.28 nm.
The SEM image of ZnO–SnO2(25%) NPs deciphered that the nanocomposite is composed of aggregates of particles. As shown in Figure 5c, the SEM image revealed the presence of two morphologies. In a close inspection of the SEM image, one can observe a large number of particles that appeared to seemingly be of a hexagonal shape, which are ascribed to be the ZnO NPs and other particles of a sphere-like morphology, which are thought to be the SnO2 NPs. The nanocrystallites of both phases are tightly bound in nanoclusters.

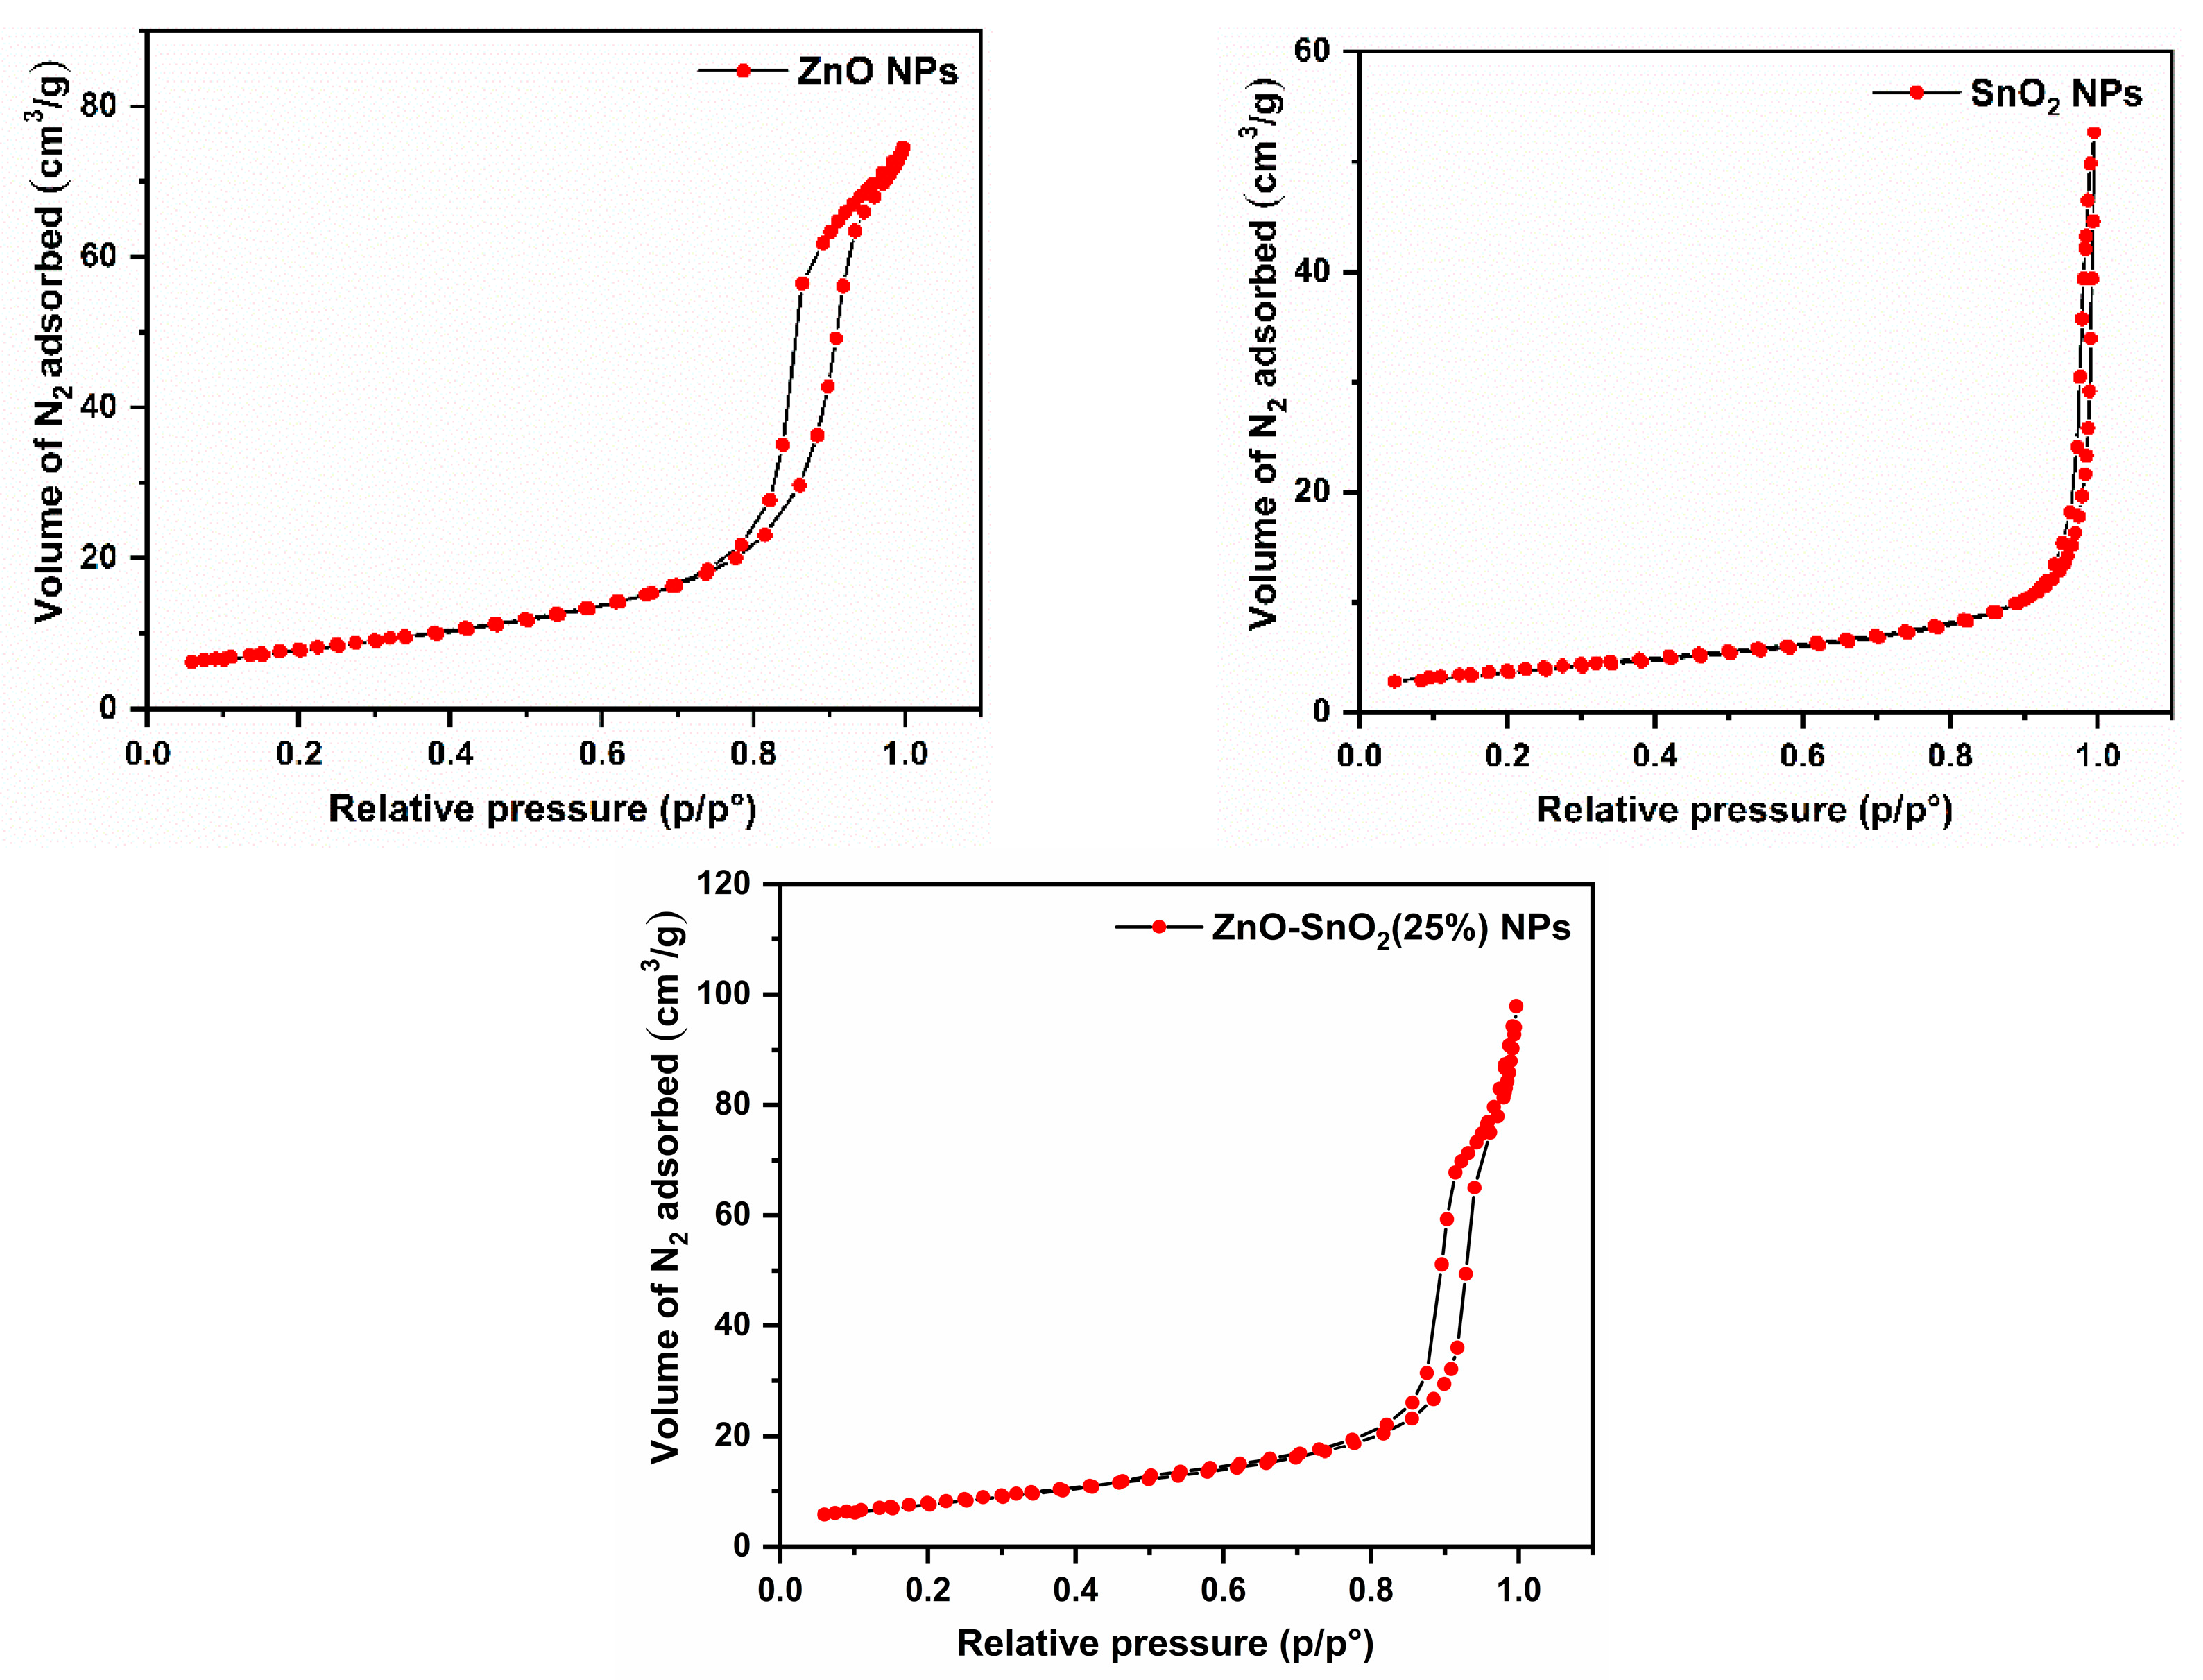
2.1.6. BET/BJH Analyses

The BET/BJH analyses were carried out to study the textural properties of the biosynthesized ZnO NPs, SnO2 NPs, and ZnO-SnO2(25%) NPs. The nitrogen adsorption–desorption isotherms are shown in Figure 6. The results indicate that according to the IUPAC classification of adsorption isotherms [56], the N2 isotherm exhibits a type IV isotherm with a hysteresis loop of type H3 in the case of ZnO NPs and ZnO-SnO2(25%) NPs. These isotherms indicate the mesoporous nature of the samples [57,58]. On the other hand, the N2 isotherm of SnO2 NPs exhibits a type III isotherm and H3 hysteresis loop, which indicates that the sample has a mesoporous texture [59,60]. The BET surface areas as well as the average pore volumes and the average pore diameters for the three samples as revealed by the BJH method are shown in Table 1.

2.1.7. EDS Analysis

The elemental compositions of the biosynthesized ZnO NPs, SnO2 NPs, and ZnO-SnO2(25%) NPs were investigated using the EDS method. The EDS spectra of the prepared nanomaterials are presented in Figure 7. This analysis revealed the presence of zinc (Zn) and oxygen (O) peaks in the EDS spectrum of ZnO NPs (Figure 7a), the presence of tin (Sn) and oxygen (O) peaks in the EDS spectrum of SnO2 NPs (Figure 7b), and the presence of zinc (Zn), tin (Sn), and oxygen (O) peaks in the EDS spectrum of ZnO-SnO2(25%) NPs (Figure 7c). The absence of peaks from other elements in the EDS spectra indicates the purity of samples. Moreover, the molar ratio of Zn:Sn in the ZnO-SnO2(25%) NPs is calculated from the EDS spectrum and was found to be 0.76:0.24, demonstrating an excellent agreement with the intended molar ratio, which is Zn:Sn = 0.75:0.

2.1.8. TGA Analysis

The thermal stability of the biosynthesized ZnO NPs, SnO2 NPs, and ZnO-SnO2(25%) NPs was assessed using the TGA technique and the results are shown in Figure 8. The TGA thermograms show that ZnO NPs and ZnO-SnO2(25%) NPs have good thermal stabilities up to 700 °C whereas SnO2 NPs are thermally stable up to 600 °C. The total weight loss as temperature increased from room temperature to 700 °C is 2.1% and 4.9% for ZnO NPs and ZnO-SnO2(25%) NPs, respectively. In the case of SnO2 NPs, there was a total weight loss of 3.9% as the temperature is changed from room temperature to 600 °C. As the temperature exceeds 600 °C, a sudden reduction in the weight of SnO2 NPs is observed. In the case of SnO2 NPs and ZnO-SnO2(25%) NP samples, there is a weight loss of about 1% below 125 °C, which is assigned to the removal of adsorbed water molecules from the surfaces of biosynthesized nanomaterials.

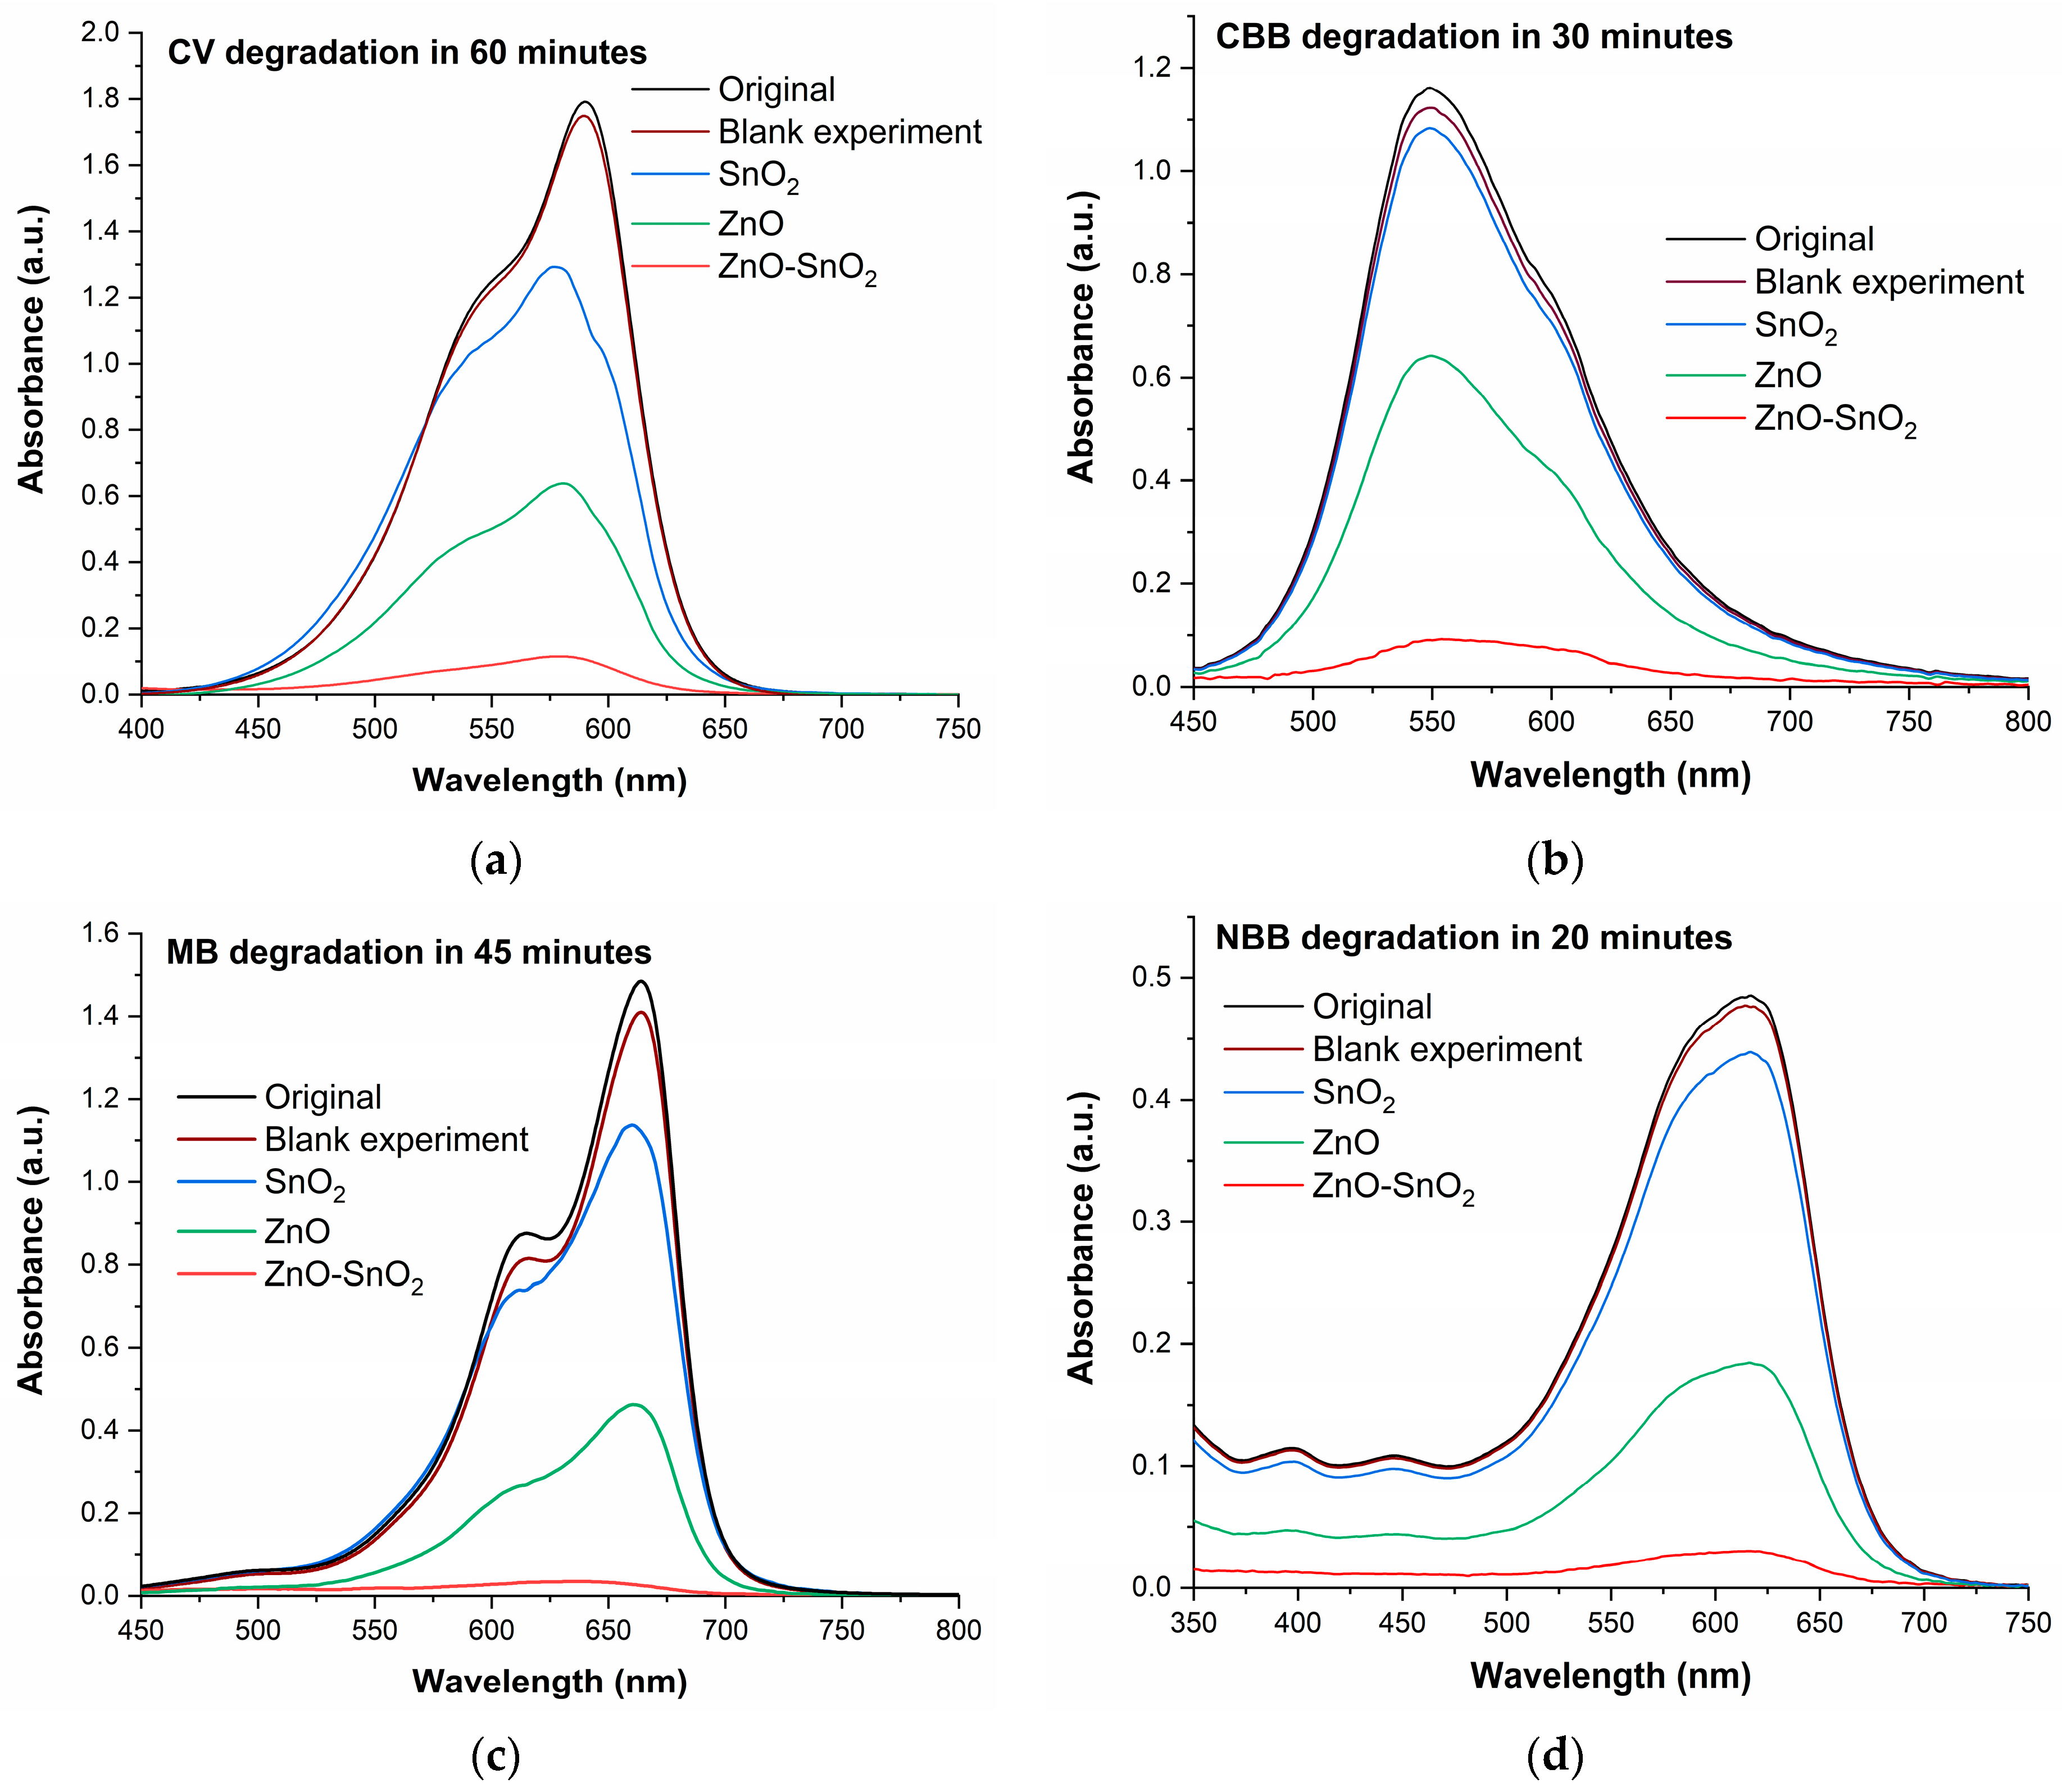
2.2. Photocatalytic Activities

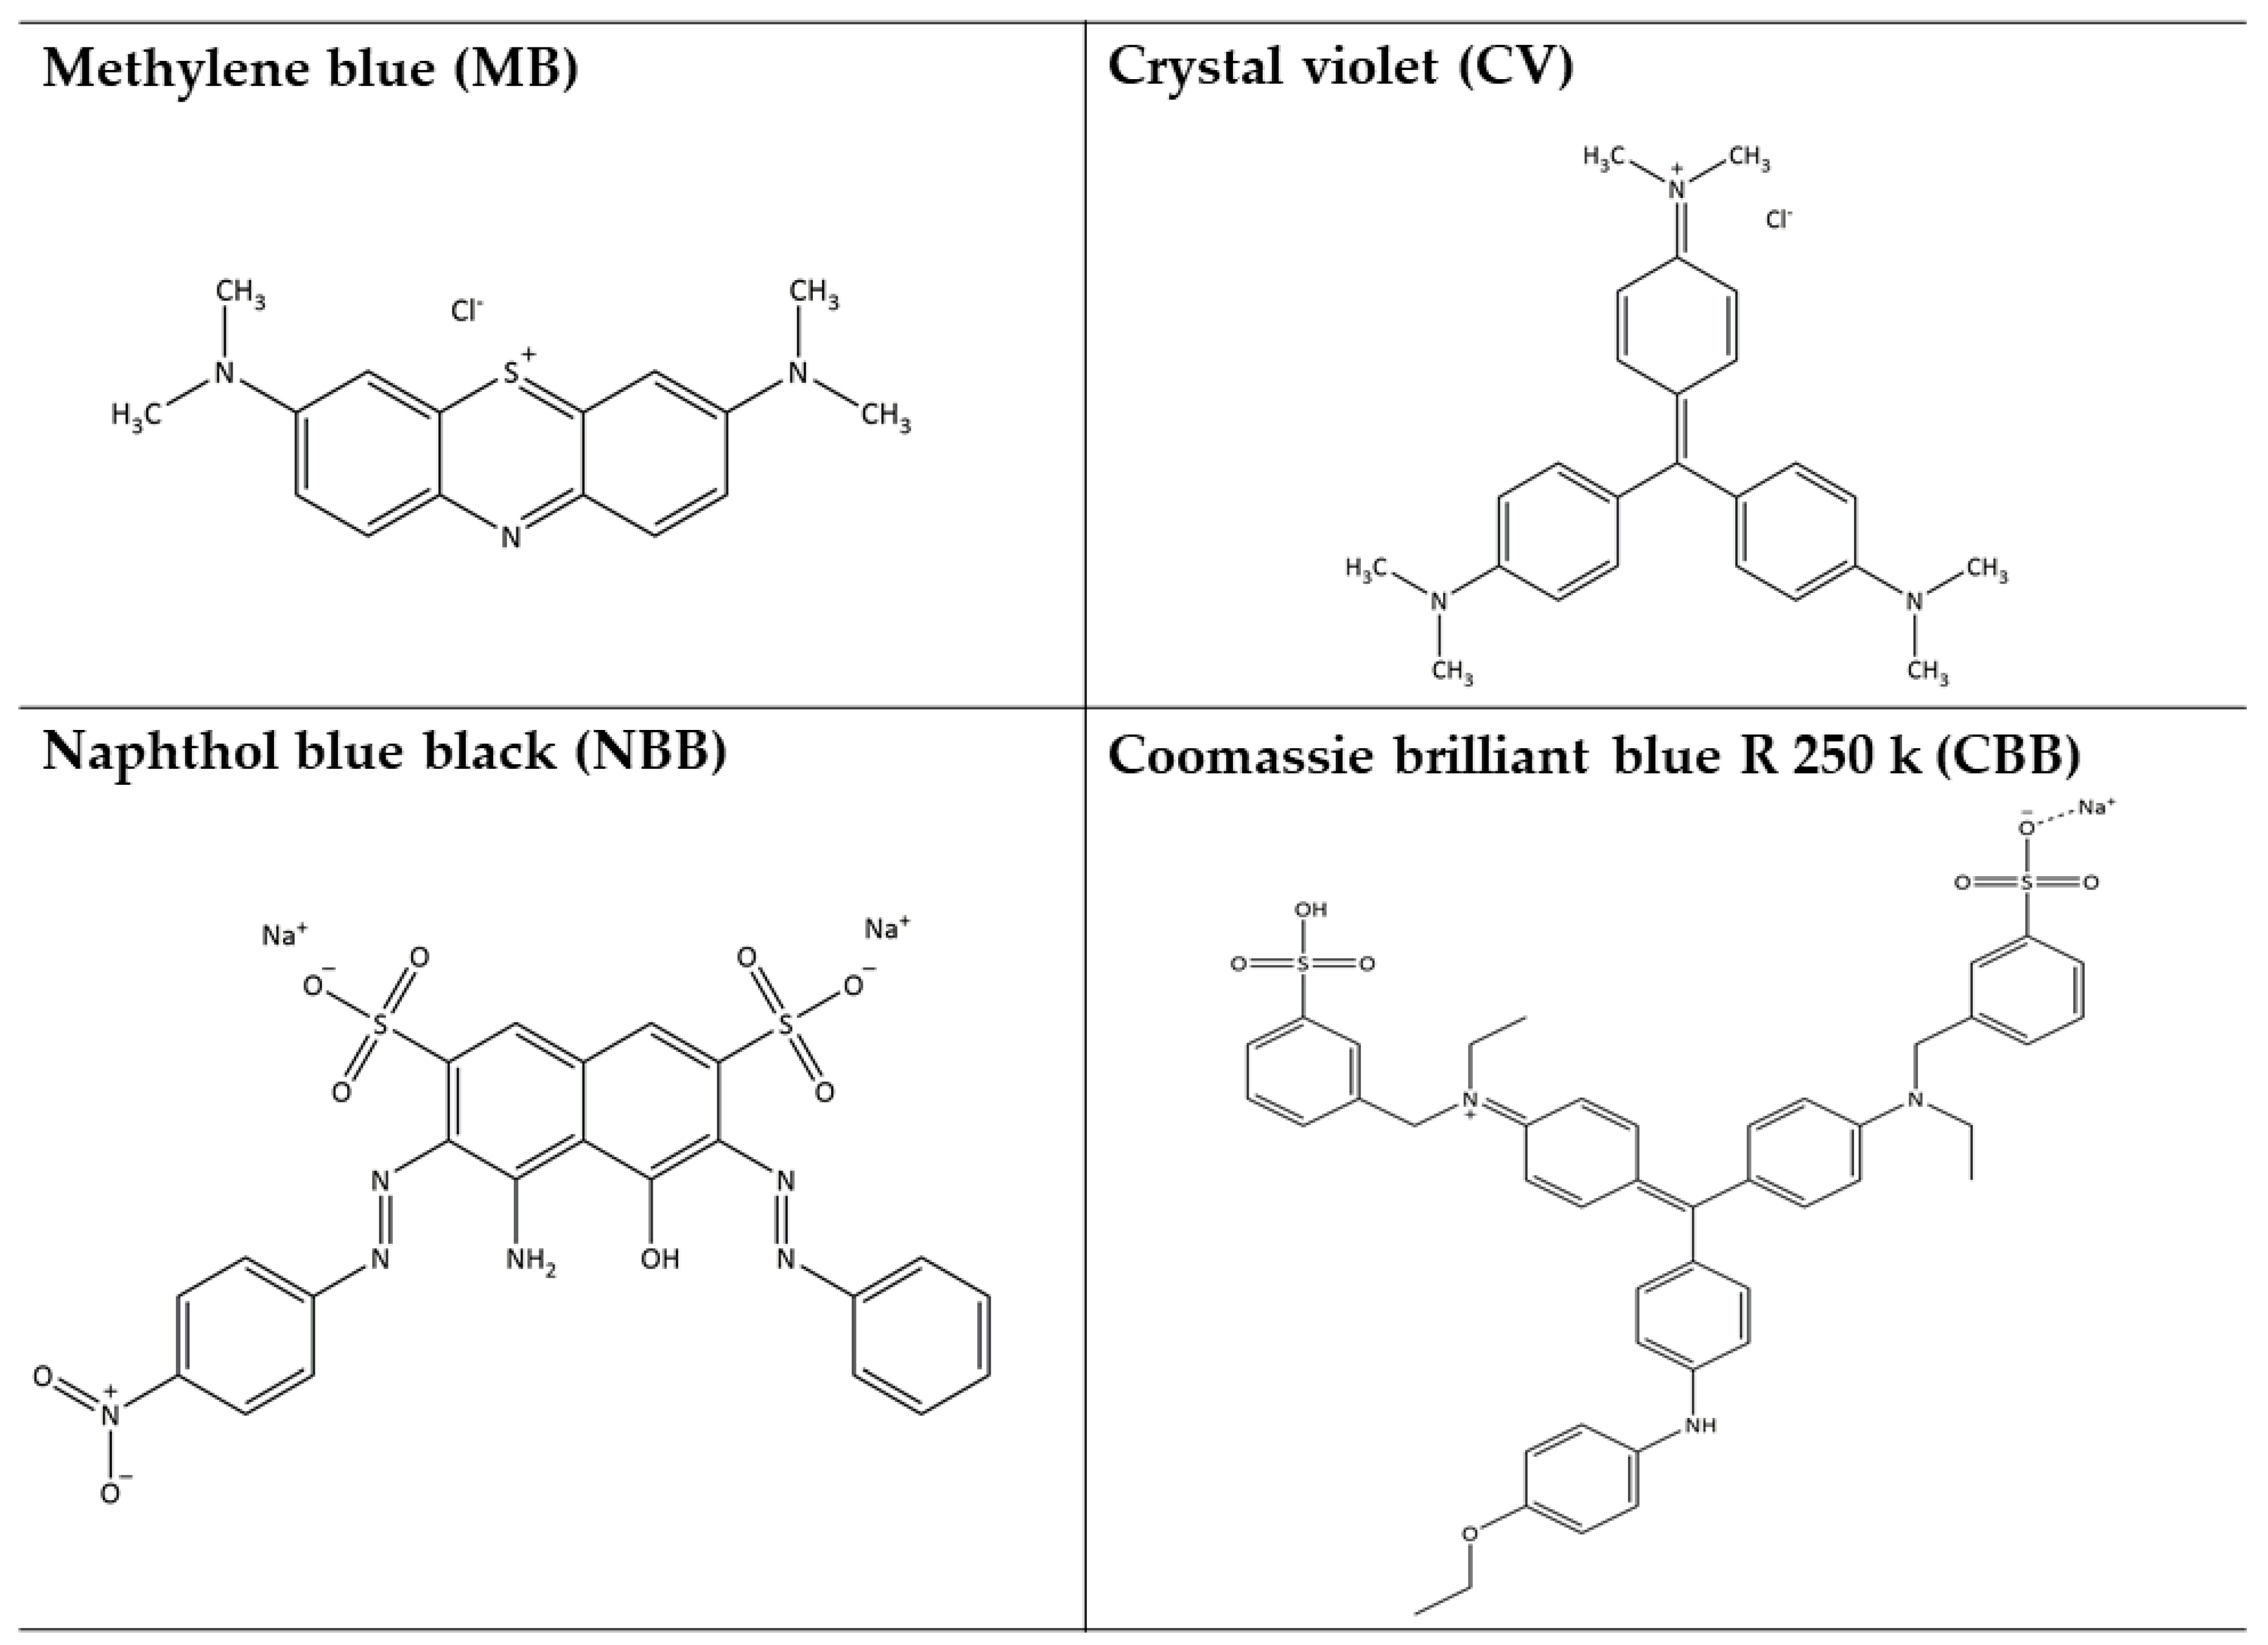
2.2.1. Comparative Analysis

The photocatalytic activities of the biosynthesized ZnO NPs, SnO2 NPs, and ZnO-SnO2(25%) NPs toward sunlight-assisted degradation of crystal violet (CV), Coomassie brilliant blue R 250 (CBB), methylene blue (MB), and naphthol blue black (NBB) were evaluated. The performances of these nanophotocatalysts were compared by measuring the degradation percent of CV, CBB, MB, and NBB when their catalyzed aqueous solutions are subjected to sunlight for 60, 30, 45, and 20 min, respectively. The analyses were performed by monitoring the reduction in the absorbance of dye aqueous solutions at λ max for each dye. Equation (11) was used to evaluate photocatalytic activities of the nanophotocatalysts. The results of these analyses are shown in Figure 9 and given in Table 2. It was found that the ZnO-SnO2(25%) NP photocatalysts showed higher photocatalytic activity than that of the pure ZnO and SnO2 nanophotocatalysts for the degradation of all dyes under sunlight. These findings revealed that the inadequate sunlight absorbance capacity of the ZnO nanophotocatalyst is greatly enhanced by insertion of SnO2 NPs into ZnO NPs’ lattice. Therefore, the heterojunction nanophotocatalyst ZnO-SnO2(25%) exhibited higher photocatalytic activities for the removal of all dyes considered in this study under sunlight radiation. The ZnO-SnO2(25%) NPs’ nanophotocatalyst achieves its superior photocatalytic activities by means of decreasing or even suppressing the recombination process of electron–hole pairs, which consequently elongates the lifetime of charge carriers, allowing light absorption at higher wavelengths. This in turn led to the better performance of the ZnO-SnO2(25%) nanophotocatalyst compared with the single-component nanophotocatalysts (i.e., ZnO and SnO2).

2.2.2. Effect of Irradiation Time

Figure 10 displays the effect of the contact time on the CV, CBB, MB, and NBB degradation over ZnO-SnO2(25%) NPs’ photocatalyst. The results show that by increasing the contact time of the catalyzed aqueous solutions of dyes with the direct sunlight, the degradation extents of all dyes increase. These findings proved that the practically complete decompositions of all dyes considered in this work are attained by using ZnO-SnO2(25%) NPs as the photocatalyst. A degradation percent of 92.2% of CV, 94.1% of CBB, 98.0% of MB, and 93.8% of NBB is achieved after 60, 30, 30, and 20 min of solar radiation, respectively. The remarkable performance of ZnO-SnO2(25%) NPs is evidence of their efficiency as potent photocatalysts for CV, CBB, MB, and NBB photodegradation.

2.2.3. Mechanism of Photocatalytic Degradation

The energy diagram shown in Figure 11 helps in understanding the outstanding photocatalytic performance of ZnO-SnO2(25%) NPs toward dye photodegradation. The position of the conduction band (CB) and valence band (VB) edges of ZnO and SnO2 versus a normal hydrogen electrode was calculated using the following equations:
ECB = χEe − 0.5Eg
EVB = χEe + 0.5Eg
where χ is the absolute electronegativity of the semiconductor, which is reported for ZnO and SnO2 to be 5.79 eV and 6.25 eV, respectively; Ee is the energy of a free electron on the hydrogen scale, which is equal to 4.5 eV, and Eg is the band gap of the semiconductor [61]. Using Equation (2), the E CB ZnO and E CB SnO 2 were found to be −0.30 eV and 0.03 eV, respectively. Likewise, by using Equation (3), it was found that the E VB ZnO and E VB SnO 2 are 2.88 eV and 3.47 eV, respectively. Since the conduction band of ZnO is more negative than that of SnO2 and the valence band of ZnO is less positive than that of SnO2, ZnO-SnO2(25%) forms a heterostructure with a type II band alignment [62]. According to type II alignment in heterojunctions, the electrons and holes are separated in two semiconductors, leading to a better separation of charge carriers.
Therefore, the mechanism of action in the ZnO-SnO2(25%) heterostructure takes place in the following steps [63]:
(i)
The electron transfer from ZnO to SnO2 and the hole traders from SnO2 to ZnO until a stable equilibrium state is achieved.
ZnO - SnO 2 h ( 25 % ) + h ν ZnO ( h VB + ) + SnO 2 ( e CB )
(ii)
The hole at VB of ZnO2 is trapped by physically adsorbed water molecules or hydroxyl groups (OH) at the ZnO surface, and hydroxyl radicals ( OH ) are generated, whereas the electron at the CB band of SnO2 is captured by dissolved O2 molecules, and superoxide ions ( O 2 ) are produced.
ZnO ( h VB + ) +   H 2 O   OH +   H +
SnO 2 ( e CB ) +   O 2 SnO 2 + O 2
(iii)
The reactive hydroxyl radicals ( OH ) and superoxide ions ( O 2 ) degrade organic contaminants (dyes) in the aqueous media due to their potent oxidizing and reducing ability.
C o n t a m i n a n t   ( d y e ) + OH / O 2 CO 2 + H 2 O
Therefore, the ZnO-SnO2(25%) NPs’ photocatalyst performance surpassed that of both ZnO NPs and SnO2 NPs’ photocatalysts due to the effective separation of charge carriers.

2.2.4. Photocatalytic Kinetics

The photodegradation reactions of CV, CBB, MB, and NBB catalyzed by nanocomposite ZnO-SnO2(25%) proceed via two general successive steps. In the first step, the pollutant dyes are adsorbed on the surface of the photocatalyst. In the second step, the photocatalyzed oxidation reaction is prompted by means of the reactive hydroxyl ion ( OH ) and superoxide ion ( O 2 ) radicals generated upon the exposure of the aqueous solutions of dyes containing a nanophotocatalyst to the sunlight.
In general, the kinetics of heterogeneous catalytic degradation of most organic wastewaters are represented by a pseudo first-order reaction rationalized in terms of the Langmuir–Hinshelwood (L-H) model [64]. In the L-H kinetic model, the rate of degradation takes the following form [65]:
r deg = d C d t = k app C 1 + KC
where k app is the apparent rate constant (which is equal to the intrinsic rate constant multiplied by the adsorption equilibrium constant), K is the adsorption equilibrium constant, and C is the concentration of dye at time t.
When the concentration C of the substrate (dye) is small (less than 10−3 mol L−1), the term KC will have a small value (i.e., KC  1). Therefore, the L-H model (Equation (8)) is simplified to a pseudo first-order equation as follows:
d C d t = k app C
To determine the rate constant of the photodegradation process, Equation (9) is integrated from C0 at t = 0 to Ct at the interval time t, which gives the expression
ln C 0 C t = k app t
The curves ln(C0/Ct) representing the photodegradation with time of all dyes considered in this study over ZnO-SnO2(25%) NPs under sunlight irradiation are summarized in Table 3. It was found that the pseudo first-order kinetic model highly fits the photodegradation reactions of all dyes. The slopes correspond to the apparent pseudo first-order reaction rate constants. These findings emphasize the excellent efficiency of ZnO-SnO2(25%) NPs toward CV, CBB, MB, and NBB degradation.

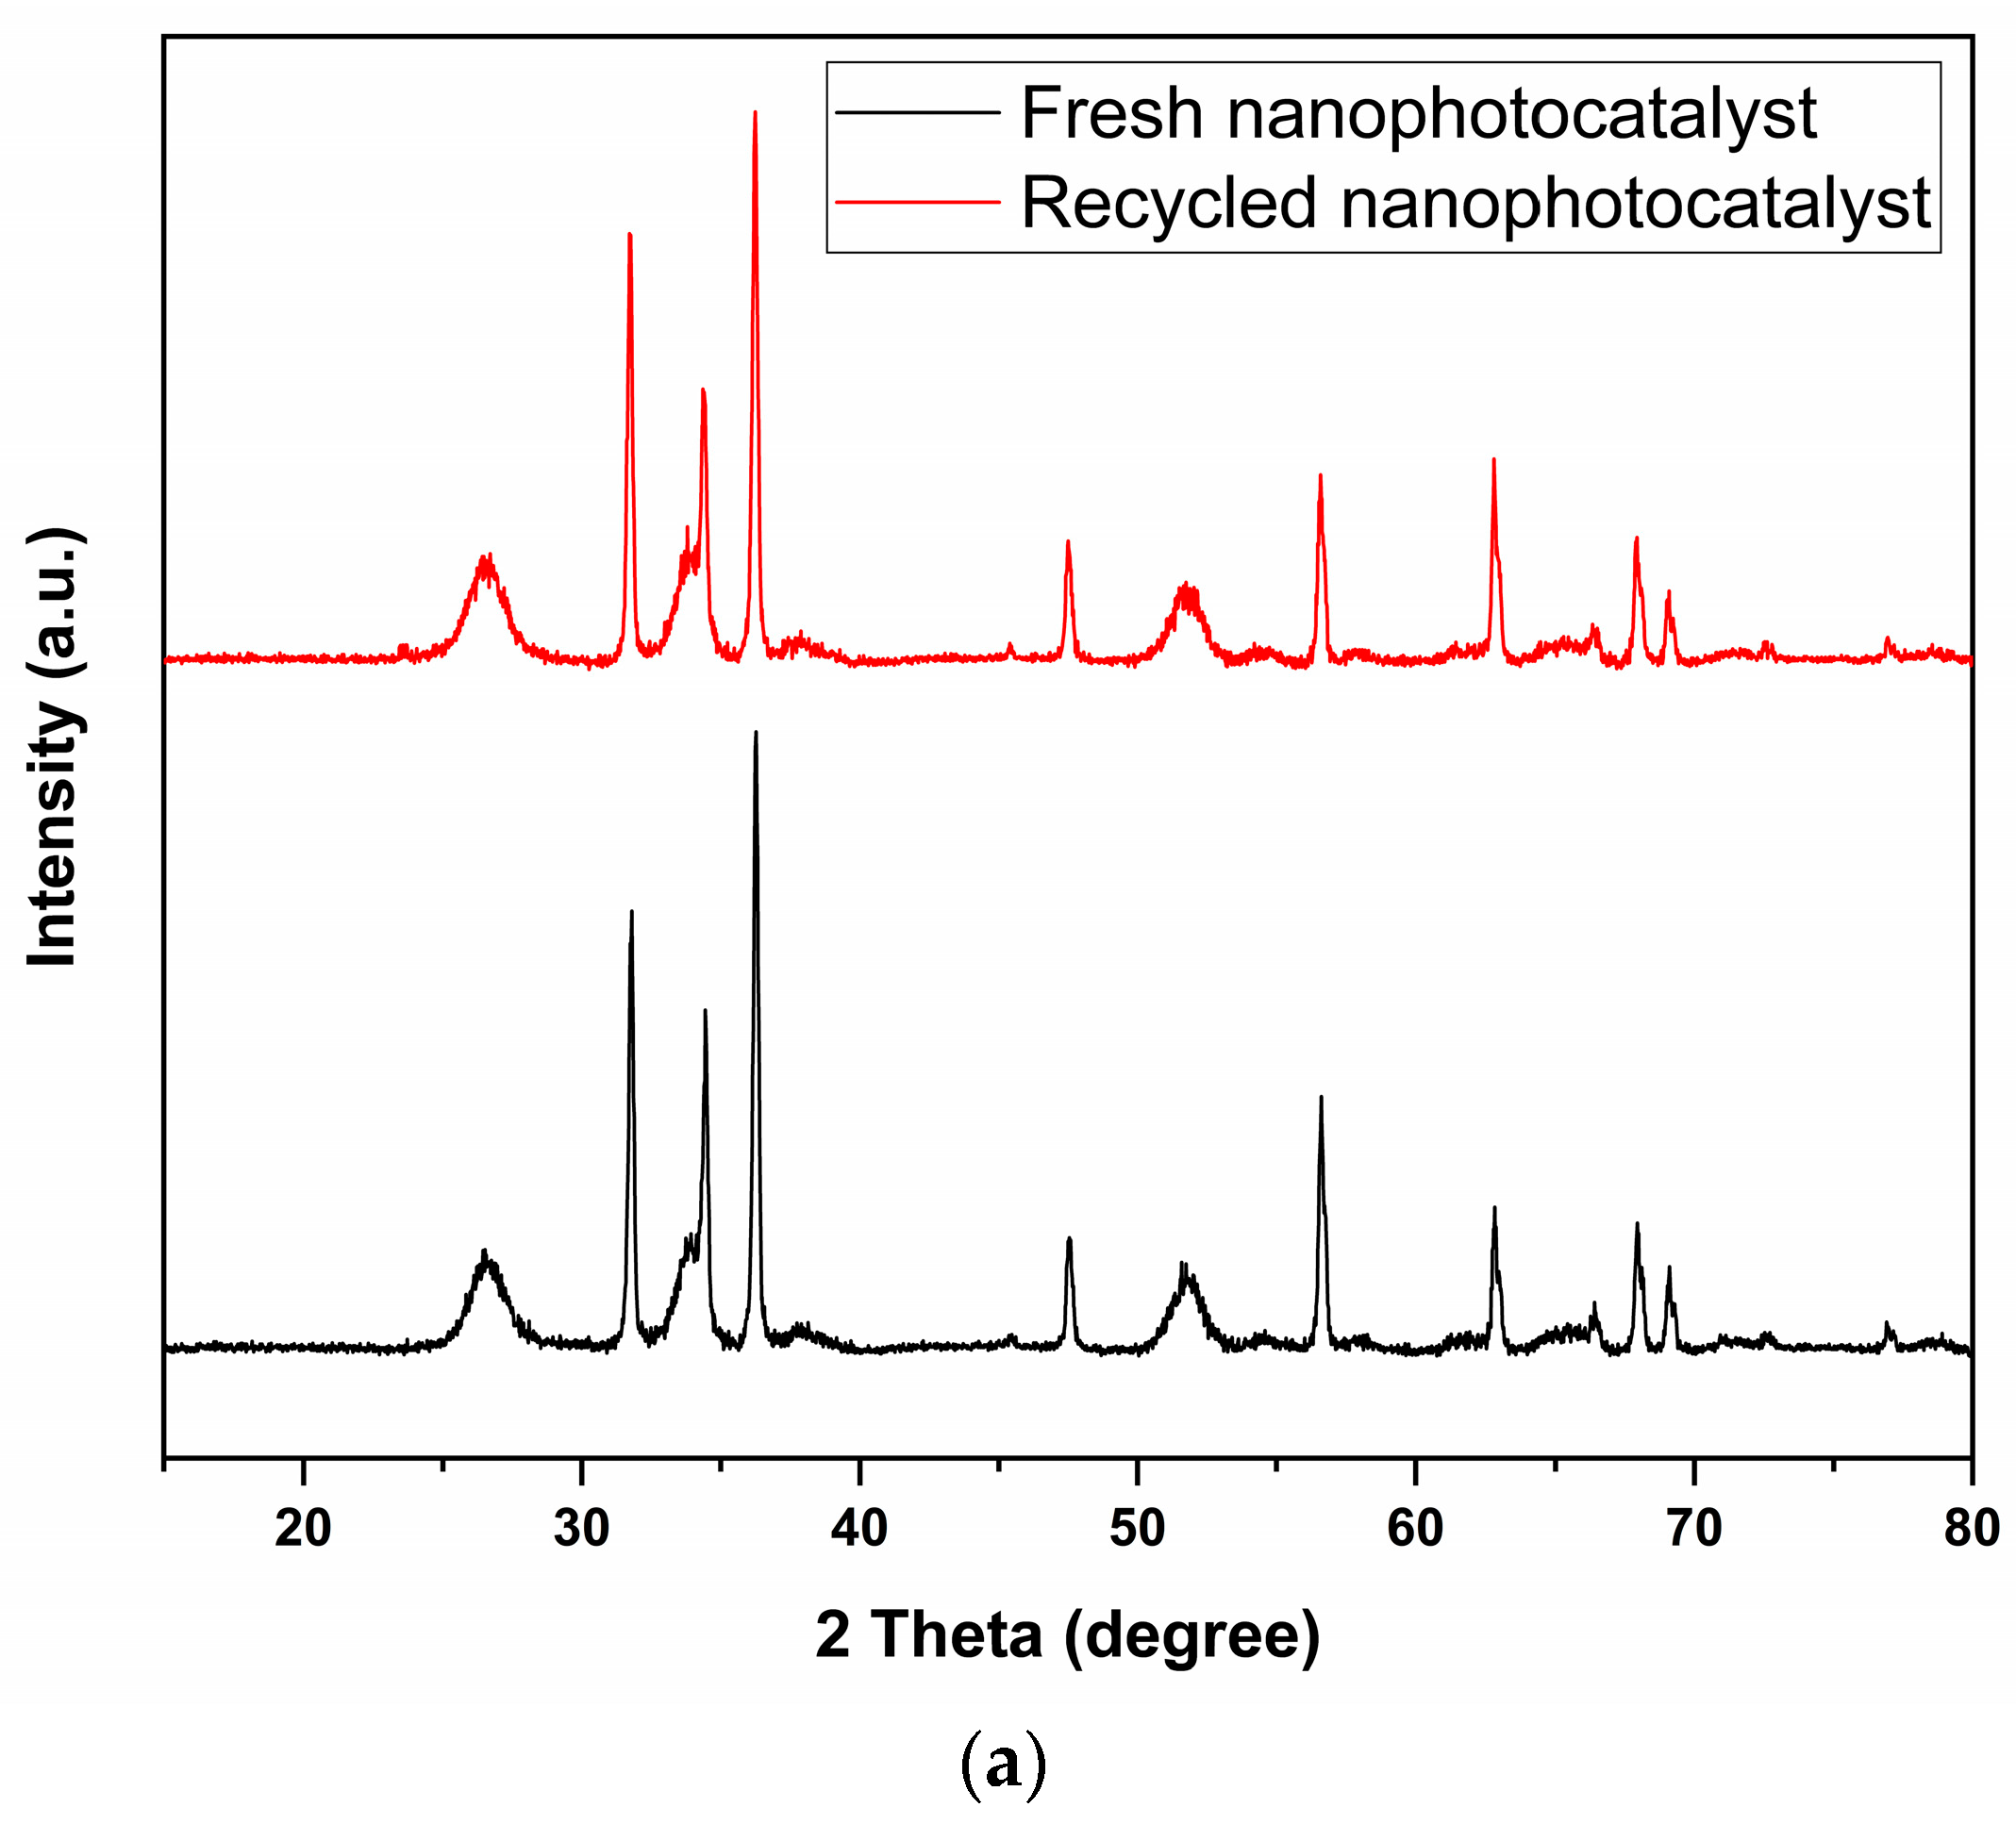
2.2.5. Reusability of ZnO-SnO2(25%) Nanophotocatalyst

An important aspect of every catalytic process is the ability to recover and reuse the catalyst for further reaction rounds without any considerable decrease in its catalytic activity. The reusability of a catalyst is a key factor from an environmental and economic standpoint. Solid heterogenous catalysts can easily be recovered through simple approaches such as filtration and centrifugation, magnetic separation, etc. The ease of separation of heterogenous catalysts from the reaction mixture facilitates their recycling.
In this work, the recycled experiments for the catalyzed photodegradation of CV, CBB, MB, and NBB under sunlight irradiation were carried out to evaluate photostability of the biosynthesized ZnO-SnO2(25%) nanophotocatalyst. Recycling experiments of the photocatalyst for dye degradation were performed at the same conditions of the first photocatalytic experiment. After each experiment, the photocatalyst was separated from the aqueous solution of the dye via centrifugation. Then, the recovered catalyst was then washed three times with an ethanol–acetone solution of a 1:1 volume ratio and then put in an oven set to 80 °C overnight. The recovered photocatalyst was reused four times. The results of the recycling experiments are given in Table 4.
The obtained results evidently demonstrated that the biosynthesized ZnO-SnO2(25%) nanophotocatalyst degraded all dyes efficiently even after four rounds of use. By comparing the degradation percent in the first cycle and the fourth cycle for all dyes, it was found that the ZnO-SnO2(25%) nanophotocatalyst retained 92.7%, 96.7%, 94.2, and 95.8% of its catalyst efficiency toward sunlight-assisted degradation of MB, CV, NBB, and CBB, respectively. The slight reductions in the degradation extents of dyes with the repeating use of the nanophotocatalysts were expected and similar findings were observed in many studies that photocatalysts lose some of their activities after being reused [66,67]. These outcomes of this analysis clearly demonstrated that the nanocomposite ZnO-SnO2(25%) has a remarkable photostability toward the degradation of dyes under sunlight irradiation and could be efficiently reutilized for dye degradations in several cycles.
The crystalline nature of both the fresh and the recovered ZnO-SnO2(25%) was analyzed using an XRD analysis and is compared in Figure 12a. The peaks’ locations and intensity of the recycled catalyst are the same as that of the fresh catalyst, indicating that the biosynthesized nanophotocatalyst possesses a high photostability. Furthermore, the FTIR spectrum of the recycled ZnO-SnO2(25%) nanophotocatalyst (Figure 12b) was very similar to that of the fresh one, confirming that the ZnO-SnO2(25%) nanophotocatalyst is highly stable.

3. Materials and Methods

3.1. Materials

Zinc nitrate hexahydrate and sodium hydroxide, methylene blue (MB), and crystal violet (CV) are from BHD. Tin (IV) chloride pentahydrate is from Sigma Aldrich, Burlington, MA, USA. Coomassie brilliant blue R 250 (CBB) is from fluka AG chemie, Buchs, Switzerland and naphthol blue black (NBB) is from Riedel-de Haën, Hanover, Germany. All the chemicals were used without any further purification.

3.2. Preparation of Aqueous Banana Peel Extract (ABPE)

The collected fresh and healthy banana peel was washed with deionized water, shadow-dried for 3 weeks, and then powdered using a mixer grinder. The ABPE solution was then prepared by mixing 10 g of the dried banana peel powder with 100 mL of deionized water. The mixture was kept under constant stirring and was heated to 60 °C and then kept at this temperature for 15 min for an effective extraction of the water-soluble components in the banana peel. After cooling, the ABPE solution was filtered using filter paper and stored at 4 °C for further use.

3.3. Synthesis of Nanophotocatalysts

3.3.1. Synthesis of Zinc Oxide Nanoparticles (ZnO NPs)

Zinc oxide nanoparticles (ZnO NPs) were prepared by dissolving 5.0 g of Zn(NO3)2·6H2O in 30 mL of the ABPE in an Erlenmeyer flask. This step was followed by adding 17.0 mL of a 2 M NaOH solution to the previous mixture under constant stirring. The Erlenmeyer flask containing the resulting mixture was loosely sealed with a glass sheet and then heated to 75 °C. The mixture was maintained at 75 °C and was kept under constant stirring for 5 h. The formed precipitate was then separated from the solution via filtration and was washed several times with an aqueous solution of ethanol with a volume ratio of water/ethanol equal to 3/1. The obtained nanoparticles were dried in an oven at 60 °C overnight and then calcinated in a tube furnace under atmospheric air at 500 °C for 3 h.

3.3.2. Synthesis of Tin Oxide Nanoparticles (SnO2 NPs)

In a similar manner to the steps followed in the preparation of ZnO NPs, the SnO2 nanoparticles (SnO2 NPs) were prepared by replacing Zn(NO3)2·6H2O by SnCl4·5H2O and using an amount of 30 mL of the 2 M NaOH solution instead of 17.0 mL. The remaining steps were exactly the same.

3.3.3. Synthesis of Mixed ZnO-SnO2(25%) Nanoparticles

The ZnO-SnO2 NPs (in a molar ratio of ZnO/SnO2 equal to 0.75/0.25) were prepared by dissolving 3.5 g of Zn(NO3)2·6H2O and 1.37 g of SnCl4·5H2O in 30 mL of the aqueous solution of the banana peel extract in an Erlenmeyer flask. Upon dissolving, an amount of 20.0 mL of a 2 M NaOH solution was added to the mixture. The remaining steps were exactly the same as those mentioned in the preparation of ZnO NPs.

3.4. Photocatalysis

The photodegradation of methylene blue (MB), crystal violet (CV), Coomassie brilliant blue R 250 (CBB), and naphthol blue black (NBB) was carried out under solar irradiation at atmospheric pressure. The experiments were conducted on a clear sunny day of June with an outside temperature of 41 °C in Riyadh (24.7136° N, 46.6753° E). The average radiation of sunlight was 0.787 kW/m2. At first, 10 mg of a biosynthesized nanophotocatalyst was added gradually under continuous stirring to a closed bottle containing 10 mL of a dye aqueous solution (10 ppm). Under magnetic stirring, the mixture was kept in the dark for 30 min to equilibrate adsorption–desorption processes. A control solution was prepared and subjected to the same conditions to see if there was a degradation in the aqueous dye solution. Upon exposure to the sunlight, the photodegradation of dyes was monitored at given time intervals. At predetermined time intervals, the sunlight-exposed dye solutions were taken and centrifuged at 7000 rpm for 10 min. The absorbances of the dye solutions were measured using a UV-Vis spectrometer (SHIMADZU UV-2600 spectrophotometer, Tokyo, Japan). The extents of dye degradation using the prepared nanophotocatalysts were evaluated as a degradation percent using the following Equation:
Degradation % = A 0 A t A 0 ×   100 %
where A 0 is the initial absorbance of the aqueous solution of dye before sunlight irradiation and A t is the absorbance of the aqueous solution of dye at time t of irradiation.

3.5. Characterization

Various analytical techniques were employed to explore structures, morphologies, optical properties, compositions, and thermal stabilities of the biosynthesized nanophotocatalysts. Fourier transform infrared (FTIR) spectra were measured on a wavenumber ranging from 400 to 4000 cm−1 with a Perkin Elmer spectrum BX spectrometer (Perkin Elmer, Waltham, MA, USA) using KBr pellets. The X-ray diffraction (XRD) patterns of the prepared nanophotocatalysts were identified using a Rigaku XtaLAB mini II benchtop X-Ray 110 crystallography system (The Woodlands, TX, USA), with incident copper K α radiation of the wavelength λ = 1.5418 Å. Data were collected at room temperature and diffraction patterns were recorded over a 2θ ranging from 10° to 80° at a scanning rate of 3°/min. The optical band gaps of the photocatalysts were estimated using a SHIMADZU UV-2600 spectrophotometer, Tokyo, Japan. The morphologies and particle size distributions of the prepared nanophotocatalysts were inspected using TEM and SEM techniques. The TEM analysis was performed using a JEM-1400 Plus (JEOL, Tokyo, Japan) with an acceleration voltage of 100 kV at a magnification factor of 300,000×. The average size of particles was deduced from the TEM image using ImageJ software based on the scale associated with the TEM image. For this purpose, a drop of diluted NPs’ suspension in ethanol was deposited on a lacey-carbon copper grid. The SEM analysis was carried out on a JEOL JSM-6060LV scanning electron microscope, SEM (JEOL, Tokyo, Japan), at 15.0 kV and a magnification power of 35,000×. For SEM imagining, the sample was platinum-coated and then mounted on aluminum stubs. The total surface areas, pore volumes, and average pore diameters of the prepared nanophotocatalysts were calculated by the Brunauer–Emmett–Teller (BET) isotherm method using a Micromeritics Tristar II 3020 surface area and porosity analyzer (Micromeritics Instrument Corporation, Norcross, GA, USA). The surface area and the pore size distributions were calculated using the Barrett–Joyner–Halenda (BJH) method. To probe the elemental compositions of the prepared nanomaterials, the dispersive X-ray spectrometry (EDS) spectra were obtained using an X-MaxN system from Oxford instruments (Abingdon, UK). Thermogravimetric analyses (TGAs) of the prepared nanophotocatalysts were examined using a Mettler Toledo TGA/DSC Star system (Columbus, OH, USA). Thermographs were obtained under nitrogen gas from 25 to 700 °C at a heating rate of 10 °C/min.

4. Conclusions

In this work, the ABPE was utilized as a medium to synthesize ZnO, SnO2, and their mixed ZnO-SnO2(25%) NPs by an eco-friendly green method. Here, the ABPE was employed to serve as a capping agent to prevent further growth and agglomeration of the nascent NPs. The XRD analysis indicated the coexistence of crystal structures of ZnO and SnO2 in ZnO-SnO2(25%) NPs. The TEM analysis showed that the biosynthesized ZnO-SnO2(25%) nanophotocatalyst has particles with an average size of 7.28 nm. The photocatalytic activity of the biosynthesized ZnO-SnO2(25%) NPs was examined for degradation of four model organic pollutants (namely MB, CV, CBB, and NBB) under sunlight. The excellent catalytic efficiency of ZnO-SnO2(25%) NPs toward dye degradation is attributed to the formation of a heterostructure of ZnO and SnO2 with a lowered or retarded recombination process of electron–hole pairs. The recycled experiments for the photodegradation of dyes over ZnO-SnO2(25%) NPs under sunlight irradiation revealed that the nanophotocatalyst is highly photostable and can be recycled several times without any appreciable loss of its photocatalytic efficiency. Overall, the biosynthesized ZnO-SnO2(25%) NPs effectively destroyed synthetic dyes under sunlight irradiation and showed stable photocatalytic efficiency even after being reused four times. It is clear, therefore, that the eco-friendly green process adopted in this work successfully provided an efficient feasible way to prepare ZnO-SnO2(25%) NPs for dye-containing effluents’ treatment application.

Author Contributions

Conceptualization, T.S.A., S.M.A. and N.A.Y.A.; Data curation, N.A.Y.A. and R.A.H.; Formal analysis, T.S.A., S.M.A., A.M.A.-M., N.A.Y.A. and R.A.H.; Funding acquisition, T.S.A.; Investigation, T.S.A., A.M.A.-M. and N.A.Y.A.; Methodology, T.S.A., A.M.A.-M., N.A.Y.A. and R.A.H.; Project administration, T.S.A. and N.A.Y.A.; Resources, T.S.A. and A.M.A.-M.; Supervision, T.S.A.; Writing—original draft, S.M.A.; Writing—review and editing, T.S.A., S.M.A., A.M.A.-M. and N.A.Y.A. All authors have read and agreed to the published version of the manuscript.

Funding

This article no received external funding.

Data Availability Statement

The data presented in this study are available in the article.

Acknowledgments

The authors extend their appreciation to Researchers Supporting Project (number RSP2023R254), King Saud University, Riyadh, Saudi Arabia.

Conflicts of Interest

The authors declare no conflict of interest.

References

  1. Saxena, S.; Asm, R. Natural Dyes: Sources, Chemistry, Application and Sustainability Issues. In Roadmap to Sustainable Textiles and Clothing: Eco-Friendly Raw Materials, Technologies, and Processing Methods; Springer: Singapore, 2014; pp. 37–80. [Google Scholar]
  2. Vivek, M.; Joshi, K.; Sharma, K.; Dave, A. A Brief Review on: Extraction of Natural Dyes from Barks of Mangrove and Walnut Tree and their Applications. Int. J. Sci. Res. (IJSR) 2020, 9, 669–673. [Google Scholar] [CrossRef]
  3. Jamee, R.; Siddique, R. Biodegradation of Synthetic Dyes of Textile Effluent by Microorganisms: An Environmentally and Economically Sustainable Approach. Eur. J. Microbiol. Immunol. 2019, 9, 114–118. [Google Scholar] [CrossRef]
  4. Pandey, A.; Sarada, D.; Kumar, A. Microbial Decolorization and Degradation of Reactive Red 198 Azo Dye by a Newly Isolated Alkaligenes Species. Proc. Natl. Acad. Sci. India Sect. B Biol. Sci. 2015, 86, 805–815. [Google Scholar] [CrossRef]
  5. Ben Slama, H.; Chenari Bouket, A.; Pourhassan, Z.; Alenezi, F.; Silini, A.; Cherif-Silini, H.; Oszako, T.; Luptakova, L.; Golinska, P.; Lassaad, B. Diversity of Synthetic Dyes from Textile Industries, Discharge Impacts and Treatment Methods. Appl. Sci. 2021, 11, 6255. [Google Scholar] [CrossRef]
  6. Nazri, M.K.H.M.; Sapawe, N. A short review on photocatalytic toward dye degradation. Mater. Today Proc. 2020, 31, A42–A47. [Google Scholar] [CrossRef]
  7. Yaseen, D.; Scholz, M. Textile dye wastewater characteristics and constituents of synthetic effluents: A critical review. Int. J. Environ. Sci. Technol. 2018, 16, 1193–1226. [Google Scholar] [CrossRef]
  8. Khan, I.; Sadiq, M.; Khan, I.; Saeed, K. Manganese dioxide nanoparticles/activated carbon composite as efficient UV and visible-light photocatalyst. Env. Sci. Pollut. Res. Int. 2019, 26, 5140–5154. [Google Scholar] [CrossRef] [PubMed]
  9. Hsuan, C.; Chang, T.-F.; Chen, C.-Y.; Sone, M.; Hsu, Y.-J. Mechanistic Insights into Photodegradation of Organic Dyes Using Heterostructure Photocatalysts. Catalysts 2019, 9, 430. [Google Scholar] [CrossRef]
  10. Rafiq, A.; Ikram, M.; Ali, S.; Niaz, F.; Khan, M.; Khan, Q.; Maqbool, M. Photocatalytic degradation of dyes using semiconductor photocatalysts to clean industrial water pollution. J. Ind. Eng. Chem. 2021, 97, 111–128. [Google Scholar] [CrossRef]
  11. Naseem, K.; Farooqi, Z.H.; Begum, R.; Wu, W.; Irfan, A.; Al-Sehemi, A.G. Silver Nanoparticles Engineered Polystyrene-Poly(N-isopropylmethacrylamide-acrylic acid) Core Shell Hybrid Polymer Microgels for Catalytic Reduction of Congo Red. Macromol. Chem. Phys. 2018, 219, 1800211. [Google Scholar] [CrossRef]
  12. Bal, G.; Thakur, A. Distinct approaches of removal of dyes from wastewater: A review. Mater. Today Proc. 2022, 50, 1575–1579. [Google Scholar] [CrossRef]
  13. Alsukaibi, A. Various Approaches for the Detoxification of Toxic Dyes in Wastewater. Processes 2022, 10, 1968. [Google Scholar] [CrossRef]
  14. Damiri, F.; Andra, S.; Kommineni, N.; Balu, S.K.; Bulusu, R.; Boseila, A.; Akamo, D.; Ahmad, Z.; Khan, F.; Rahman, M.; et al. Recent Advances in Adsorptive Nanocomposite Membranes for Heavy Metals Ion Removal from Contaminated Water: A Comprehensive Review. Materials 2022, 15, 5392. [Google Scholar] [CrossRef]
  15. Katheresan, V.; Kansedo, J.; Lau, S.Y. Efficiency of various recent wastewater dye removal methods: A review. J. Environ. Chem. Eng. 2018, 6, 4676–4697. [Google Scholar] [CrossRef]
  16. Hariani, P.; Said, M.; Salni, S.; Aprianti, N.; Naibaho, Y. High Efficient Photocatalytic Degradation of Methyl Orange Dye in an Aqueous Solution by CoFe2O4-SiO2-TiO2 Magnetic Catalyst. J. Ecol. Eng. 2022, 23, 118–128. [Google Scholar] [CrossRef]
  17. Iqbal, A.; Yusaf, A.; Usman, M.; Bokhari, T.; Mansha, A. Insight into the degradation of different classes of dyes by advanced oxidation processes: A detailed review. Int. J. Environ. Anal. Chem. 2023, 1–35. [Google Scholar] [CrossRef]
  18. Lee, D.-E.; Kim, M.-K.; Danish, M.; Jo, W. State-of-the-art review on photocatalysis for efficient wastewater treatment: Attractive approach in photocatalyst design and parameters affecting the photocatalytic degradation. Catal. Commun. 2023, 183, 106764. [Google Scholar] [CrossRef]
  19. Jayasankari, S.; Pramothkumar, A.; Mani, P. Facile synthesis and characterization of ZnO NPs, ZnO/CdO and ZnO/SnO2 nanocomposites for photocatalytic degradation of Eosin Yellow and Direct Blue 15 under UV light irradiation. J. Mater. Sci. Mater. Electron. 2022, 33, 9858–9874. [Google Scholar] [CrossRef]
  20. Zarei, S.; Hasheminiasari, M.; Masoudpanah, S.M.; Javadpour, J. Photocatalytic properties of ZnO/SnO2 nanocomposite films: Role of morphology. J. Mater. Res. Technol. 2022, 17, 2305–2312. [Google Scholar] [CrossRef]
  21. Groeneveld, I.; Kanelli, M.; Ariese, F.; Bommel, M.R. Parameters that affect the photodegradation of dyes and pigments in solution and on substrate—An overview. Dye. Pigment. 2022, 210, 110999. [Google Scholar] [CrossRef]
  22. Shafiq, A.; Chen, S.-Q.; Nazar, M. A Comprehensive Review on Adsorption, Photocatalytic and Chemical Degradation of Dyes and Nitro-Compounds over Different Kinds of Porous and Composite Materials. Molecules 2023, 28, 1081. [Google Scholar] [CrossRef]
  23. Bekele, M. Photocatalytic degradation of organic pollutants in the presence of selected transition metal nanoparticles: Review. J. Plant Sci. Phytopathol. 2022, 6, 115–125. [Google Scholar] [CrossRef]
  24. Navidpour, A.H.; Abbasi, S.; Li, D.; Mojiri, A.; Zhou, J.L. Investigation of advanced oxidation process in the presence of TiO2 semiconductor as photocatalyst: Property, principle, kinetic analysis, and photocatalytic activity. Catalysts 2023, 13, 232. [Google Scholar] [CrossRef]
  25. Munawar, T.; Yasmeen, S.; Hussain, F.; Mahmood, K.; Hussain, A.; Asghar, M.; Iqbal, F. Synthesis of novel heterostructured ZnO-CdO-CuO nanocomposite: Characterization and enhanced sunlight driven photocatalytic activity. Mater. Chem. Phys. 2020, 249, 122983. [Google Scholar] [CrossRef]
  26. Khan, S.; Noor, A.; Khan, I.; Muhammad, M.; Sadiq, M.; Muhammad, N. Photocatalytic Degradation of Organic Dyes Contaminated Aqueous Solution Using Binary CdTiO2 and Ternary NiCdTiO2 Nanocomposites. Catalysts 2022, 13, 44. [Google Scholar] [CrossRef]
  27. Ali, A. Review on the Synthesis Method of Nanocomposites and Approach to Making Semiconductors Visible Light Active. 2022. Available online: https://www.longdom.org/open-access/review-on-the-synthesis-method-of-nano-composites-and-approach-to-making-semiconductors-visible-light-active-96837.html#ai (accessed on 1 October 2023).
  28. Ibrahim, H.M. Green synthesis and characterization of silver nanoparticles using banana peel extract and their antimicrobial activity against representative microorganisms. J. Radiat. Res. Appl. Sci. 2015, 8, 265–275. [Google Scholar] [CrossRef]
  29. Mandavgane, S.; Pathak, P.; Kulkarni, B. Fruit Peel Waste: Characterization and its Potential Uses. Curr. Sci. 2017, 113, 444–454. [Google Scholar] [CrossRef]
  30. Feumba, D.R. Chemical composition of some selected fruit peels. Eur. J. Food Sci. Technol. 2016, 4, 12–21. [Google Scholar]
  31. Zaini, H.; Roslan, J.; Saallah, S.; Munsu, E.; Sulaiman, N.; Pindi, W. Banana peels as a bioactive ingredient and its potential application in the food industry. J. Funct. Foods 2022, 92, 105054. [Google Scholar] [CrossRef]
  32. Kapadia, S.P.; Pudakalkatti, P.S.; Shivanaikar, S. Detection of antimicrobial activity of banana peel (Musa paradisiaca L.) on Porphyromonas gingivalis and Aggregatibacter actinomycetemcomitans: An in vitro study. Contemp. Clin. Dent. 2015, 6, 496–499. [Google Scholar] [CrossRef]
  33. Aburto, J.; Moran, M.; Galano, A.; Torres-García, E. Non-isothermal pyrolysis of pectin: A thermochemical and kinetic approach. J. Anal. Appl. Pyrolysis 2015, 112, 94–104. [Google Scholar] [CrossRef]
  34. Chen, Y.; Zhang, J.G.; Sun, H.J.; Wei, Z.J. Pectin from Abelmoschus esculentus: Optimization of extraction and rheological properties. Int. J. Biol. Macromol. 2014, 70, 498–505. [Google Scholar] [CrossRef] [PubMed]
  35. Dmochowska, A.; Czajkowska, J.; Jędrzejewski, R.; Stawiński, W.; Migdał, P.; Fiedot-Toboła, M. Pectin based banana peel extract as a stabilizing agent in zinc oxide nanoparticles synthesis. Int. J. Biol. Macromol. 2020, 165, 1581–1592. [Google Scholar] [CrossRef]
  36. Ferreira, N.S.; Sasaki, J.M.; Silva, R.S., Jr.; Attah-Baah, J.M.; Macêdo, M.A. Visible-Light-Responsive Photocatalytic Activity Significantly Enhanced by Active [V(Zn)+V(O)(+)] Defects in Self-Assembled ZnO Nanoparticles. Inorg. Chem. 2021, 60, 4475–4496. [Google Scholar] [CrossRef] [PubMed]
  37. Xiong, G.; Pal, U.; Serrano, J.; Ucer, K.B.; Williams, R.T. Photoluminescence and FTIR study of ZnO nanoparticles: The impurity and defect perspective. Phys. Status Solidi C 2006, 3, 3577–3581. [Google Scholar] [CrossRef]
  38. Wasly, D.-H.; Abd El-sadek, M.S.; Henini, M. Influence of reaction time and synthesis temperature on the physical properties of ZnO nanoparticles synthesized by the hydrothermal method. Appl. Phys. A 2018, 124, 76. [Google Scholar] [CrossRef]
  39. Luque, P.; Nava, O.; Soto-Robles, C.A.; Garrafa Galvez, H.; Martinez-Rosas, M.; Chinchillas-Chinchillas, M.J.; Vilchis-Nestor, A.; Castro-Beltrán, A. SnO2 nanoparticles synthesized with Citrus aurantifolia and their performance in photocatalysis. J. Mater. Sci. Mater. Electron. 2020, 31, 16859–16866. [Google Scholar] [CrossRef]
  40. Paramarta, V.; Taufik, A.; Saleh, R. Better adsorption capacity of SnO2 nanoparticles with different graphene addition. J. Phys. Conf. Ser. 2016, 776, 012039. [Google Scholar] [CrossRef]
  41. Chandrasekaran, S.; Surendhiran, S.; Kumar, P.; Kumar, E.; Khadar, Y.; Balamurugan, A. Green synthesis of SnO2 nanoparticles using Delonix elata leaf extract: Evaluation of its structural, optical, morphological and photocatalytic properties. SN Appl. Sci. 2020, 2, 1735. [Google Scholar] [CrossRef]
  42. Mahalakshmi, S.; Hema, N.; Vijaya, P.P. In Vitro Biocompatibility and Antimicrobial activities of Zinc Oxide Nanoparticles (ZnO NPs) Prepared by Chemical and Green Synthetic Route—A Comparative Study. BioNanoScience 2019, 10, 112–121. [Google Scholar] [CrossRef]
  43. Elango, G.; Roopan, S.M. Efficacy of SnO2 nanoparticles toward photocatalytic degradation of methylene blue dye. J. Photochem. Photobiol. B Biol. 2016, 155, 34–38. [Google Scholar] [CrossRef]
  44. Obaidullah, M.; Furusawa, T.; Siddiquey, I.; Bahadur, N.; Sato, M.; Suzuki, N. A fast and facile microwave irradiation method for the synthesis of ZnO@ZrO2 core-shell nanocomposites and the investigation of their optical properties. Adv. Powder Technol. 2018, 29, 1804–1811. [Google Scholar] [CrossRef]
  45. Ishwarya, R.; Vaseeharan, B.; Kalyani, S.; Banumathi, B.; Govindarajan, M.; Alharbi, N.S.; Kadaikunnan, S.; Al-Anbr, M.N.; Khaled, J.M.; Benelli, G. Facile green synthesis of zinc oxide nanoparticles using Ulva lactuca seaweed extract and evaluation of their photocatalytic, antibiofilm and insecticidal activity. J. Photochem. Photobiol. B Biol. 2018, 178, 249–258. [Google Scholar] [CrossRef] [PubMed]
  46. Rad, S.S.; Sani, A.M.; Mohseni, S. Biosynthesis, characterization and antimicrobial activities of zinc oxide nanoparticles from leaf extract of Mentha pulegium (L.). Microb. Pathog. 2019, 131, 239–245. [Google Scholar] [CrossRef] [PubMed]
  47. Faisal, S.; Jan, H.; Shah, S.A.; Shah, S.; Khan, A.; Akbar, M.T.; Rizwan, M.; Jan, F.; Wajidullah; Akhtar, N.; et al. Green Synthesis of Zinc Oxide (ZnO) Nanoparticles Using Aqueous Fruit Extracts of Myristica fragrans: Their Characterizations and Biological and Environmental Applications. ACS Omega 2021, 6, 9709–9722. [Google Scholar] [CrossRef]
  48. Arakha, M.; Saleem, M.; Mallick, B.C.; Jha, S. The effects of interfacial potential on antimicrobial propensity of ZnO nanoparticle. Sci. Rep. 2015, 5, 9578. [Google Scholar] [CrossRef]
  49. Wongsaprom, K.; Winyayong, A.; Maensiri, S. Synthesis and room-temperature ferromagnetism in flower-like SnO2 nanostructures. J. Phys. Conf. Ser. 2018, 1144, 012042. [Google Scholar] [CrossRef]
  50. Lamdhade, G.; Raghuwanshi, F.C.; Agrawal, R.M.; Balkhande, V.M.; Shripathi, T. SnO2 Nanoparticles Synthesis Via Liquid-Phase Co-Precipitation Technique. Adv. Mater. Lett. 2015, 6, 738–742. [Google Scholar] [CrossRef]
  51. Chen, S.; Sun, Z.; Zhang, L.; Xie, H. Photodegradation of Gas Phase Benzene by SnO2 Nanoparticles by Direct Hole Oxidation Mechanism. Catalysts 2020, 10, 117. [Google Scholar] [CrossRef]
  52. Luque, P.A.; Nava, O.; Soto-Robles, C.A.; Chinchillas-Chinchillas, M.J.; Garrafa-Galvez, H.E.; Baez-Lopez, Y.A.; Valdez-Núñez, K.P.; Vilchis-Nestor, A.R.; Castro-Beltrán, A. Improved photocatalytic efficiency of SnO2 nanoparticles through green synthesis. Optik 2020, 206, 164299. [Google Scholar] [CrossRef]
  53. Petrov, V.; Sysoev, V.; Ivanishcheva, A.; Volkova, M.; Kalazhokov, Z.; Storozhenko, V.; Khubezhov, S.; Bayan, E. Synthesis, Characterization and Gas Sensing Study of ZnO-SnO2 Nanocomposite Thin Films. Chemosensors 2021, 9, 124. [Google Scholar] [CrossRef]
  54. Alfaro Cruz, M.R.; Saldaña-Ramírez, A.; Juárez-Ramírez, I.; Torres-Martínez, L.M. Development of SnO2–ZnO thin films as a photocatalyst for obtaining alternative fuels through photocatalytic reactions. Solid. State Sci. 2023, 137, 107112. [Google Scholar] [CrossRef]
  55. Karthika, K.; Ravichandran, K. Tuning the Microstructural and Magnetic Properties of ZnO Nanopowders through the Simultaneous Doping of Mn and Ni for Biomedical Applications. J. Mater. Sci. Technol. 2015, 31, 1111–1117. [Google Scholar] [CrossRef]
  56. Thommes, M.; Kaneko, K.; Neimark, A.; Olivier, J.; Rodriguez-Reinoso, F.; Rouquerol, J.; Sing, K. Physisorption of gases, with special reference to the evaluation of surface area and pore size distribution (IUPAC Technical Report). Pure Appl. Chem. 2015, 87, 1051–1069. [Google Scholar] [CrossRef]
  57. Ikim, M.; Gromov, V.; Gerasimov, G.; Spiridonova, E.; Erofeeva, A.; Kurmangaleev, K.; Polunin, K.; Ilegbusi, O.; Trakhtenberg, L. Structure, Conductivity, and Sensor Properties of Nanosized ZnO-In2O3 Composites: Influence of Synthesis Method. Micromachines 2023, 14, 1685. [Google Scholar] [CrossRef] [PubMed]
  58. Kadam, A.N.; Bhopate, D.P.; Kondalkar, V.V.; Majhi, S.M.; Bathula, C.D.; Tran, A.-V.; Lee, S.-W. Facile synthesis of Ag-ZnO core–shell nanostructures with enhanced photocatalytic activity. J. Ind. Eng. Chem. 2018, 61, 78–86. [Google Scholar] [CrossRef]
  59. Peng, S.; Hong, P.; Li, Y.; Xing, X.; Yang, Y.; Wang, Z.; Zou, T.; Wang, Y. Pt decorated SnO2 nanoparticles for high response CO gas sensor under the low operating temperature. J. Mater. Sci. Mater. Electron. 2019, 30, 3921–3932. [Google Scholar] [CrossRef]
  60. Pudukudy, M.; Yaakob, Z. Facile Synthesis of Quasi Spherical ZnO Nanoparticles with Excellent Photo catalytic Activity. J. Clust. Sci. 2014, 26, 1187–1201. [Google Scholar] [CrossRef]
  61. Xu, Y.; Schoonen, M.A.A. The absolute energy positions of conduction and valence bands of selected semiconducting minerals. Am. Mineral. 2000, 85, 543–556. [Google Scholar] [CrossRef]
  62. Makuła, P.; Pacia, M.; Macyk, W. How To Correctly Determine the Band Gap Energy of Modified Semiconductor Photocatalysts Based on UV–Vis Spectra. J. Phys. Chem. Lett. 2018, 9, 6814–6817. [Google Scholar] [CrossRef]
  63. Talinungsang; Upadhaya, D.; Kumar, P.; Dhar Purkayastha, D. Superhydrophilicity of photocatalytic ZnO/SnO2 heterostructure for self-cleaning applications. J. Sol-Gel Sci. Technol. 2019, 92, 575–584. [Google Scholar] [CrossRef]
  64. Szczepanik, B.; Slomkiewicz, P.; Widel, D.; Czaplicka, M.; Frydel, L. Kinetics and Mechanism of Aniline and Chloroanilines Degradation Photocatalyzed by Halloysite-TiO2 and Halloysite-Fe2O3 Nanocomposites. Catalysts 2021, 11, 1548. [Google Scholar] [CrossRef]
  65. Hai, T.; Nguyen, D.; Do, P.; Tran, U. Kinetics of photocatalytic degradation of organic compounds: A mini-review and new approach. RSC Adv. 2023, 13, 16915–16925. [Google Scholar] [CrossRef]
  66. Al-Mamun, M.R.; Iqbal Rokon, M.Z.; Rahim, M.A.; Hossain, M.I.; Islam, M.S.; Ali, M.R.; Bacchu, M.S.; Waizumi, H.; Komeda, T.; Hossain Khan, M.Z. Enhanced photocatalytic activity of Cu and Ni-doped ZnO nanostructures: A comparative study of methyl orange dye degradation in aqueous solution. Heliyon 2023, 9, e16506. [Google Scholar] [CrossRef]
  67. Khan, M.; Ware, P.; Shimpi, N. Synthesis of ZnO nanoparticles using peels of Passiflora foetida and study of its activity as an efficient catalyst for the degradation of hazardous organic dye. SN Appl. Sci. 2021, 3, 528. [Google Scholar] [CrossRef]
Scheme 1. Structural formulas of model synthetic dyes used.
Catalysts 13 01509 sch001
Figure 1. FTIR spectra of (a) banana peel extract (BPE), and the biosynthesized (b) ZnO NPs, (c) SnO2 NPs, and (d) ZnO-SnO2(25%) NPs.
Catalysts 13 01509 g001
Figure 2. Diffractograms of the biosynthesized (a) ZnO NPs, (b) SnO2 NPs, and (c) ZnO-SnO2(25%) NPs.
Catalysts 13 01509 g002
Figure 3. (a) The optical absorption spectra for the biosynthesized ZnO NPs, SnO2 NPs, and ZnO-SnO2(25%) NPs. (b) Their estimated band gap (Eg) energies.
Catalysts 13 01509 g003
Figure 4. The photoluminescence (PL) emission spectra of the biosynthesized ZnO NPs, SnO2 NPs, and ZnO-SnO2(25%) NPs.
Catalysts 13 01509 g004
Figure 5. (a) TEM image of ZnO-SnO2(25%) NPs; (b) particle size distributions as revealed by TEM analysis; (c) SEM image of ZnO-SnO2(25%) NPs.
Catalysts 13 01509 g005
Figure 6. Nitrogen adsorption–desorption isotherms of the biosynthesized ZnO NPs, SnO2 NPs, and ZnO-SnO2(25%) NPs.
Catalysts 13 01509 g006
Figure 7. EDS spectra of the biosynthesized (a) ZnO NPs; (b) SnO2 NPs; and (c) ZnO-SnO2(25%) NPs.
Catalysts 13 01509 g007
Figure 8. TGA plots of the biosynthesized ZnO NPs, SnO2 NPs, and ZnO-SnO2(25%) NPs.
Catalysts 13 01509 g008
Figure 9. UV-visible absorbance spectra of degraded (a) CV, (b) CBB, (c) MB, and (d) NBB dye over biosynthesized ZnO NPs, SnO2 NPs, and ZnO-SnO2(25%) NPs under sunlight irradiation.
Catalysts 13 01509 g009
Figure 10. Degradation as a function of time of (a) CV, (b) CBB, (c) MB, and (d) NBB dye over biosynthesized ZnO-SnO2(25%) NPs under sunlight irradiation.
Catalysts 13 01509 g010
Figure 11. Schematic representation of energy band gap illustrating charge-transfer process in the biosynthesized ZnO-SnO2(25%) NPs under sunlight irradiation.
Catalysts 13 01509 g011
Figure 12. (a) XRD patterns of fresh and recycled biosynthesized ZnO-SnO2(25%) nanophotocatalyst; (b) FTIR spectra of fresh and recycled biosynthesized ZnO-SnO2(25%) nanophotocatalyst.
Catalysts 13 01509 g012aCatalysts 13 01509 g012b
Table 1. BET surface areas and the BJH porosities’ results of the biosynthesized ZnO NPs, SnO2 NPs, and ZnO-SnO2(25%) NPs.
NanophotocatalystTotal Surface Area (m2/g)Average Pore Volume (cm3/g)Average Pore Diameter (nm)
ZnO 27.80.1215.9
SnO213.30.0723.2
ZnO-SnO2(25%) 28.20.1519.7
Table 2. Performance of the biosynthesized ZnO NPs, SnO2 NPs, and ZnO-SnO2(25%) NPs toward degradation of organic dyes.
Degradation (%)
NanophotocatalystCV
(in 60 min)
CBB
(in 30 min)
MB
(in 45 min)
NBB
(in 20 min)
ZnO-SnO2(25%)94.192.298.093.8
ZnO67.445.266.662.0
SnO236.07.617.89.5
Table 3. The pseudo first-order rate constants using the Langmuir–Hinshelwood model for CV, CBB, MB, and NBB degradation over the biosynthesized ZnO-SnO2(25%) nanophotocatalyst under sunlight irradiation.
Organic PollutantInitial Concentration (M)Rate Constant, k (min−1)Correlation Coefficient (R2)Degradation (%)
(in × Minute)
CV2.45 × 10−30.04810.998592.2% (in 60 min)
CBB1.21 × 10−30.08560.978194.1% (in 30 min)
MB3.13 × 10−30.11190.992596.2% (in 30 min)
NBB1.62 × 10−30.1310.983293.8% (in 20 min)
Table 4. Recycling efficiency of the biosynthesized ZnO-SnO2(25%) nanophotocatalyst in degradation of MB, CV, NBB, and CBB organic pollutants under sunlight irradiation.
DyeFirst UseSecond UseThird UseFourth UseLost Activity (%) after Four Uses
MB96.294.291.489.27.3
CV94.293.592.991.13.3
NBB93.891.190.388.45.8
CBB92.291.788.688.34.2
Disclaimer/Publisher’s Note: The statements, opinions and data contained in all publications are solely those of the individual author(s) and contributor(s) and not of MDPI and/or the editor(s). MDPI and/or the editor(s) disclaim responsibility for any injury to people or property resulting from any ideas, methods, instructions or products referred to in the content.

