Article

Sodium Promoted FeZn@SiO2-C Catalysts for Sustainable Production of Low Olefins by CO2 Hydrogenation

School of Mechanical Engineering & Urban Rail Transit, Changzhou University, Changzhou 213001, China
*
Author to whom correspondence should be addressed.
Catalysts 2023, 13(12), 1508; https://doi.org/10.3390/catal13121508
Submission received: 2 October 2023 / Revised: 17 November 2023 / Accepted: 28 November 2023 / Published: 12 December 2023
(This article belongs to the Special Issue Catalysis for Selective Hydrogenation of CO and CO2)

Abstract

:
A prepared FeZnNa@SiO2-C catalyst with graphitized carbon (C)-modified mesoporous SiO2 supports metal nanoparticles with the sol–gel method. The effect of adding metal Na and Zn promoters as a dispersion on the CO2 hydrogenation to low olefins was systematically studied. The results showed that Zn–Na, as a combination, could promote the absorption of CO2 and improved the conversion rate of CO2. Na as an alkaline substance can improve the absorption of more acidic CO2, which could increase the conversion rate of CO2 to 59.03%. Meanwhile, the addition of secondary metal Zn to Fe-based catalysts to form a surface alloy could alter the adsorption of CO2 and the activation of C-O bonds, inhibit the subsequent hydrogenation of olefins to paraffins, and facilitate the reduction of Fe2O3 and the formation of active Fe5C2 species. The formation of active Fe5C2 species was found in TEM and XRD, and the selectivity of the target product was 41.07%. The deep hydrogenation of olefins was inhibited, and the space–time yield (STY) of low olefins was raised again by inhibiting their deep hydrogenations, up to 0.0436. However, the corresponding STY did not increase infinitely with the increase of Na doping, and higher catalytic performance for CO2 hydrogenation could be exhibited when the Na doping reached 6.4%. Compared with Fe@SiO2-C catalyst, Na- and Zn-promoted Fe-based catalysts, prepared by the modified sol-gel method, can be used directly for highly efficient CO2 hydrogenation to low olefins and thus has a more promising application prospect in the future.

Graphical Abstract

1. Introduction

Increasing carbon dioxide emissions (CO2) have a significant impact on climate change. CO2 capture and utilization has received much attention as a viable pathway towards a low carbon economy [1,2,3,4]. CO2 hydrogenation is a promising route to convert CO2 into value-added C2+ hydrocarbons, such as olefins, aromatics, and gasoline, and has attracted industry and academic research worldwide [4,5,6,7,8,9,10]. Among them, the process of CO2 hydrogenation to olefins should be divided into two steps. Firstly, CO intermediates are formed by the Reverse Water Gas Shift (RWGS) reaction and then hydrogenated to hydrocarbons by the Fischer–Tropsch Synthesis (FTS) reaction [11].
Compared to other catalysts [12,13,14], iron-based catalysts remain a promising system for the hydrogenation of CO2 to low olefins due to their high reverse water–gas shift activity, flexible operating conditions and low cost [15]. However, the competitive carburization of a single iron phase in the catalyst and the evolvement into active phase Fe5C2 are not efficient. Therefore, the addition of other promoters could improve the structural evolution of the iron phase to increase the selectivity of olefin and long-chain hydrocarbons, and the study of the effect of promoters on the dynamic transformation of the iron phase is important for the development of efficient catalysts.
To date, alkaline species (AMs, M = Na [16,17,18,19] and K [20,21,22]) and transition metals (TMs, M = Ni, Co, Cr and Mn) [23,24,25] have been commonly introduced into Fe-based catalysts to compete carburizing and the evolution into active phase Fe5C2 for improving the selectivity of olefins. In particular, the addition of Na promotes the ability of Fe5C2 formation as the interaction between Na and Fe species inhibited the hydrogenation of olefins by increasing the electron density of the active sites, leading to a higher CO2 conversion rate and improved olefin selectivity [26,27]. Yao [18] and Zhang [11] reconfirmed that the low olefins/paraffins (O/P) and CO2 conversion rate were significantly increased by the addition of the adjuvant Na doping. More recently, co-modification with TMs and AMs is gaining high popularity as an emerging strategy to accelerate CO2 dissociative adsorption and improve iron carbide phase formation for favor olefin synthesis [28]. However, the effects of secondary metal and Na promoters on catalyst structures and performances of CO2 hydrogenation remain ambiguous. For instance, the Zn promoter is usually considered as the structure promoter, but it has also been proposed as an electronic promoter or the active phase in the form of ZnO for RWGS. Furthermore, the studies on the synergistic effects of Zn and Na promoters were seldom in the previous literature.
Combined with our previous work [29,30], GC-modified mesoporous silica-encapsulated metal nanoparticles can effectively improve reducibility and electron conductivity properties similar to those of expensive noble metals (Pt [31] and Ru [32]). In this study, FeZnNa@SiO2-C catalysts were prepared by the sol–gel method via regulating the amount of Na loading. The role of these Zn and Na promoters was rigorously analyzed by decoupling the rates of the RWGS and FTS steps and considering the proximity to the reaction equilibrium. In addition, a combination of quasi in situ structural characterization measurements, including X-ray photoelectron spectroscopy and Transmission Electron Microscope (TEM), etc., were used to establish a clear structure–property relationship for CO2 hydrogenation on Fe-based catalysts. During this process, synergetic promoting effects by Zn and Na are elucidated, which were responsible for the concurrently enhanced CO2 conversion rates and olefin selectivity. These results would contribute to the rational regulation of catalytic performance by multiple additives, especially for complex reaction systems that are generally encountered in heterogeneous catalysis.

2. Results and Discussion

2.1. Characterization of the Fe-Based Catalysts

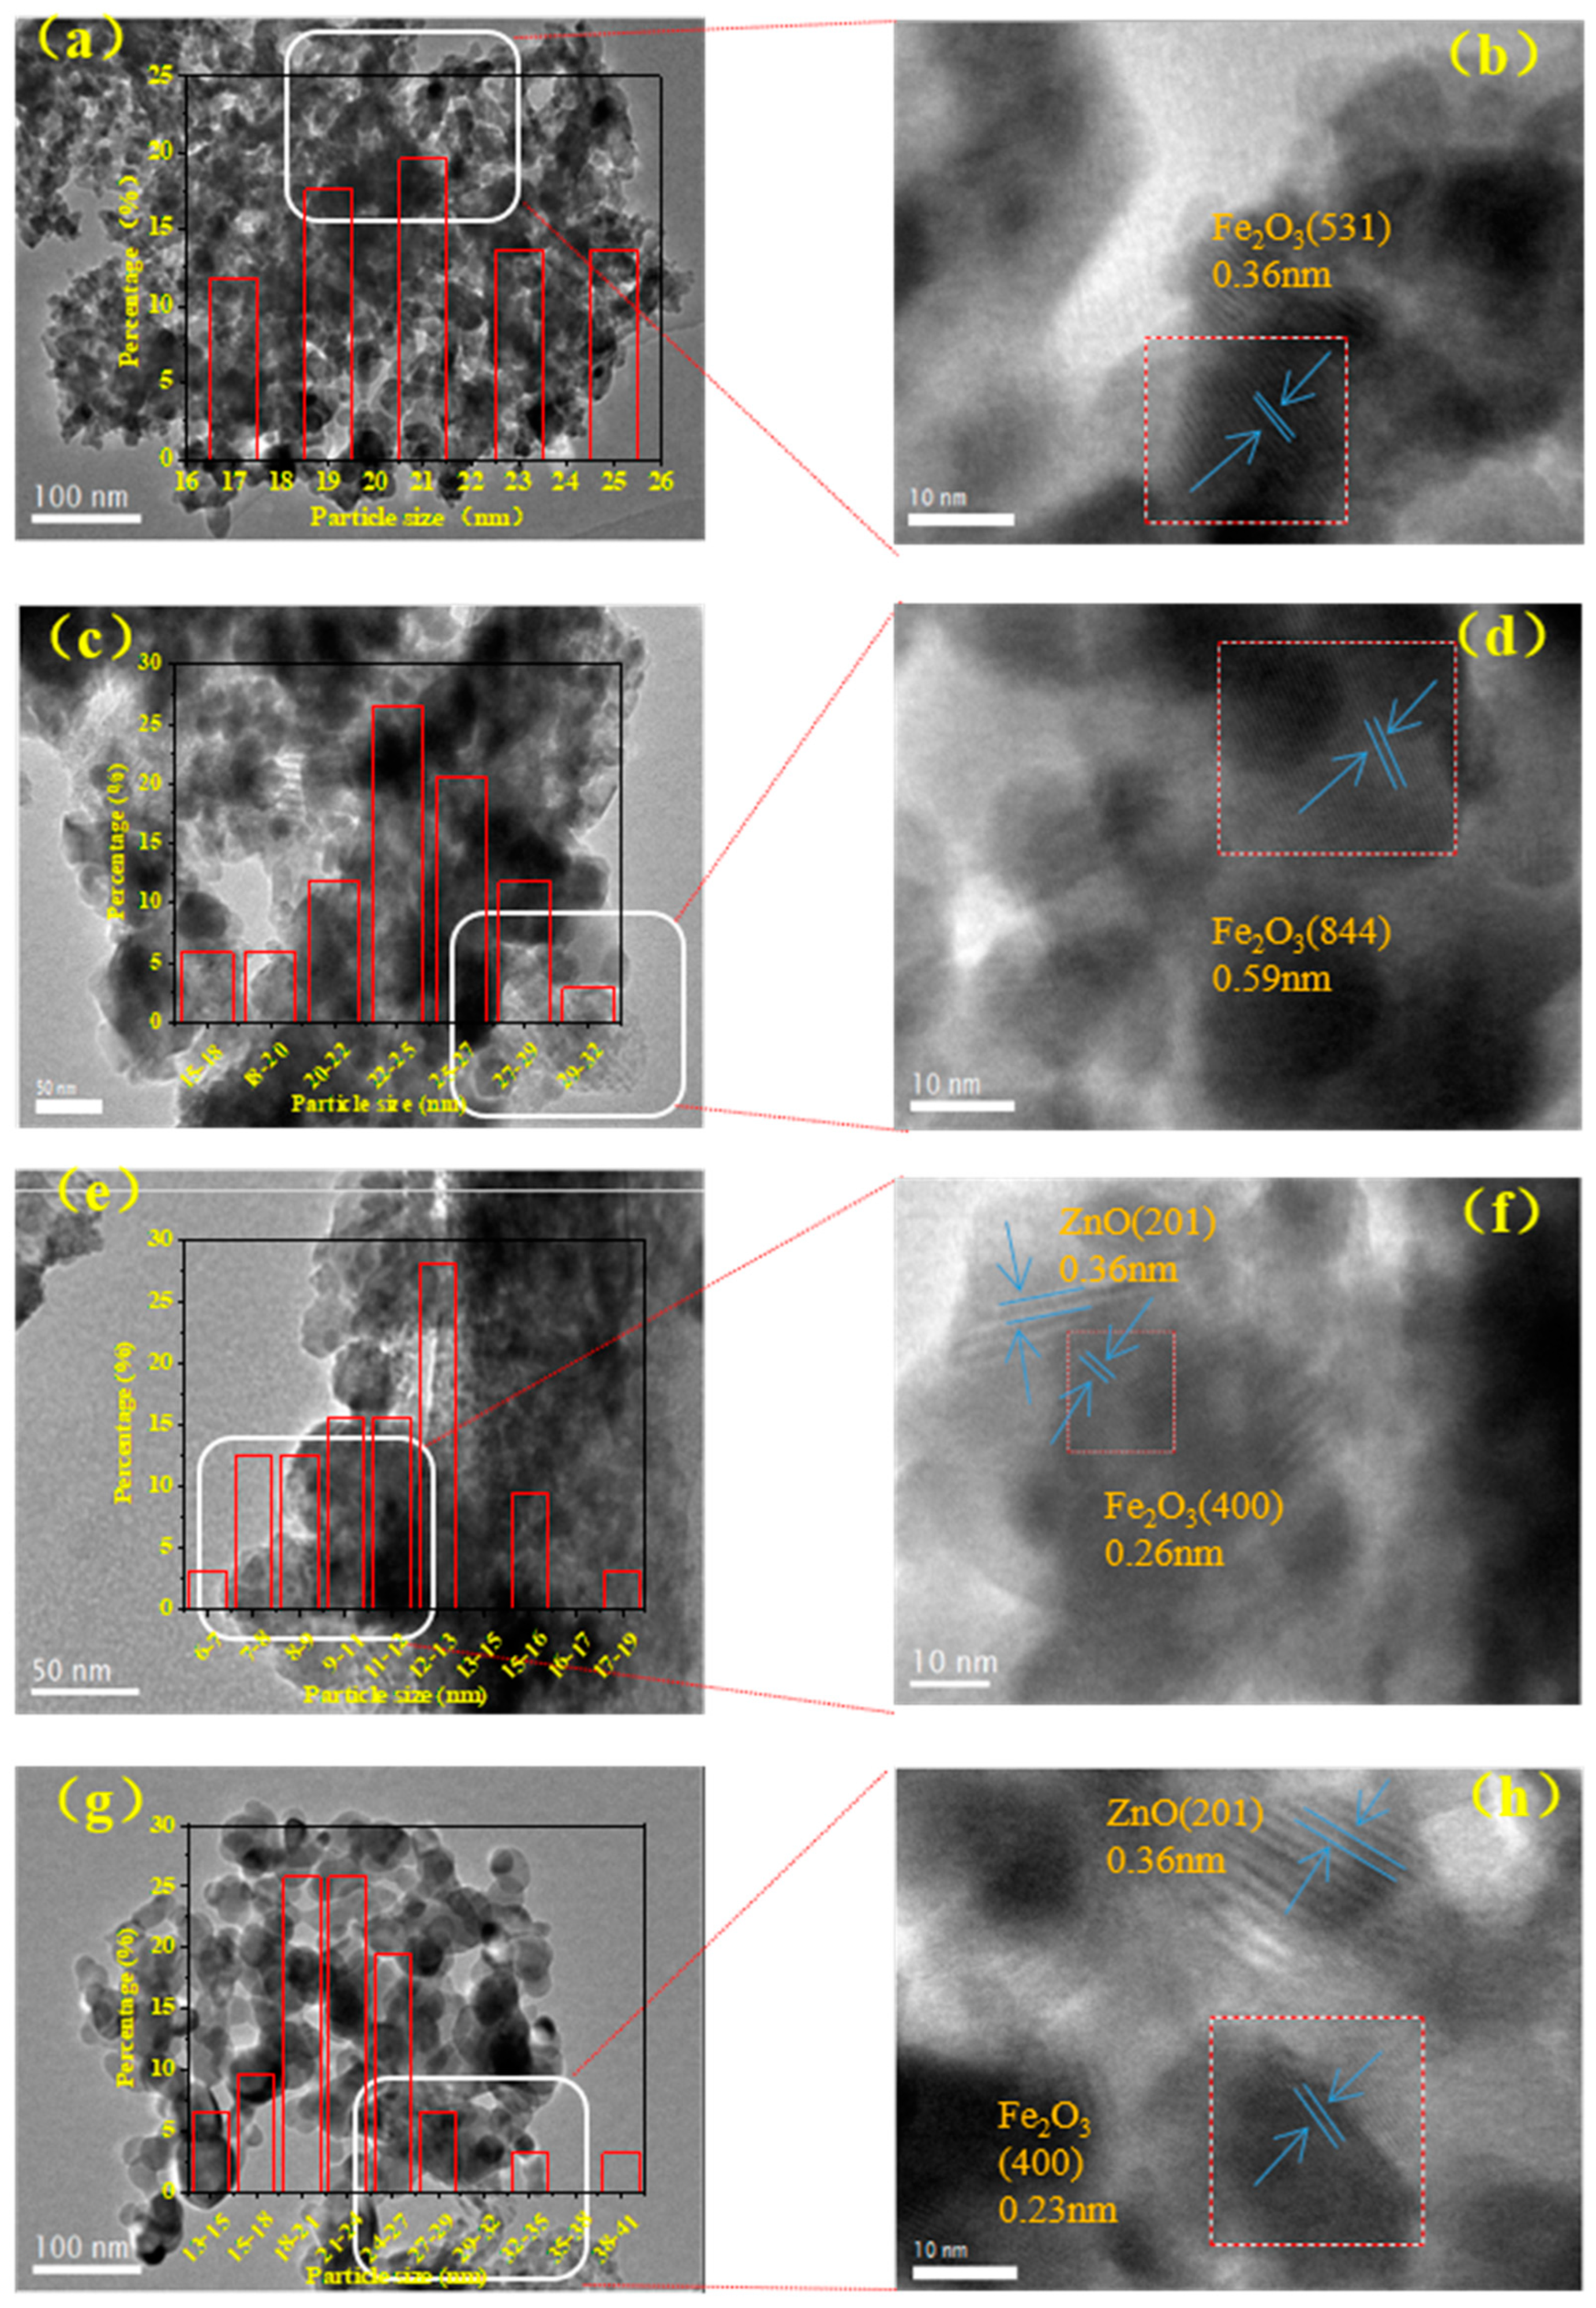
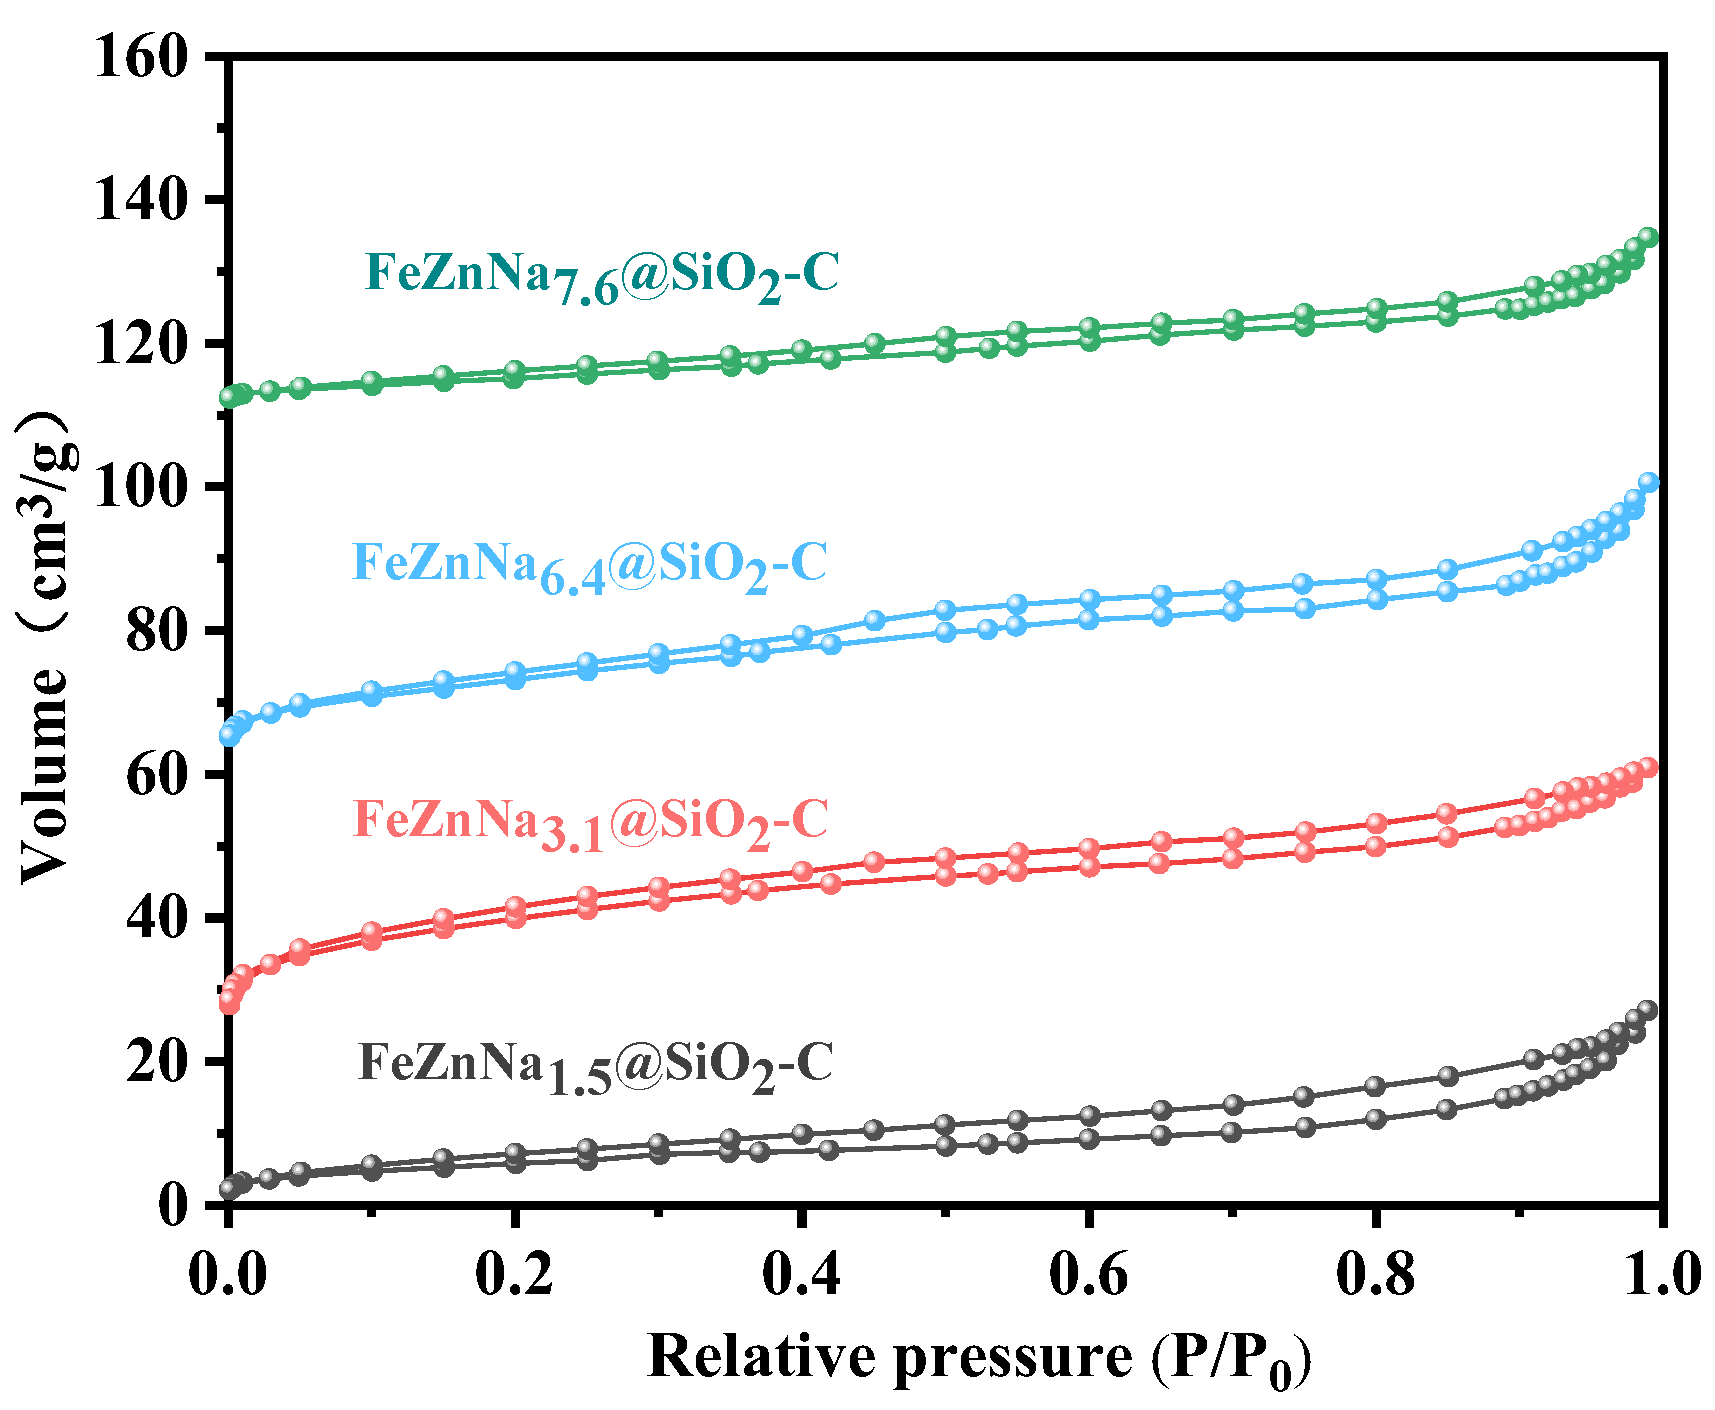
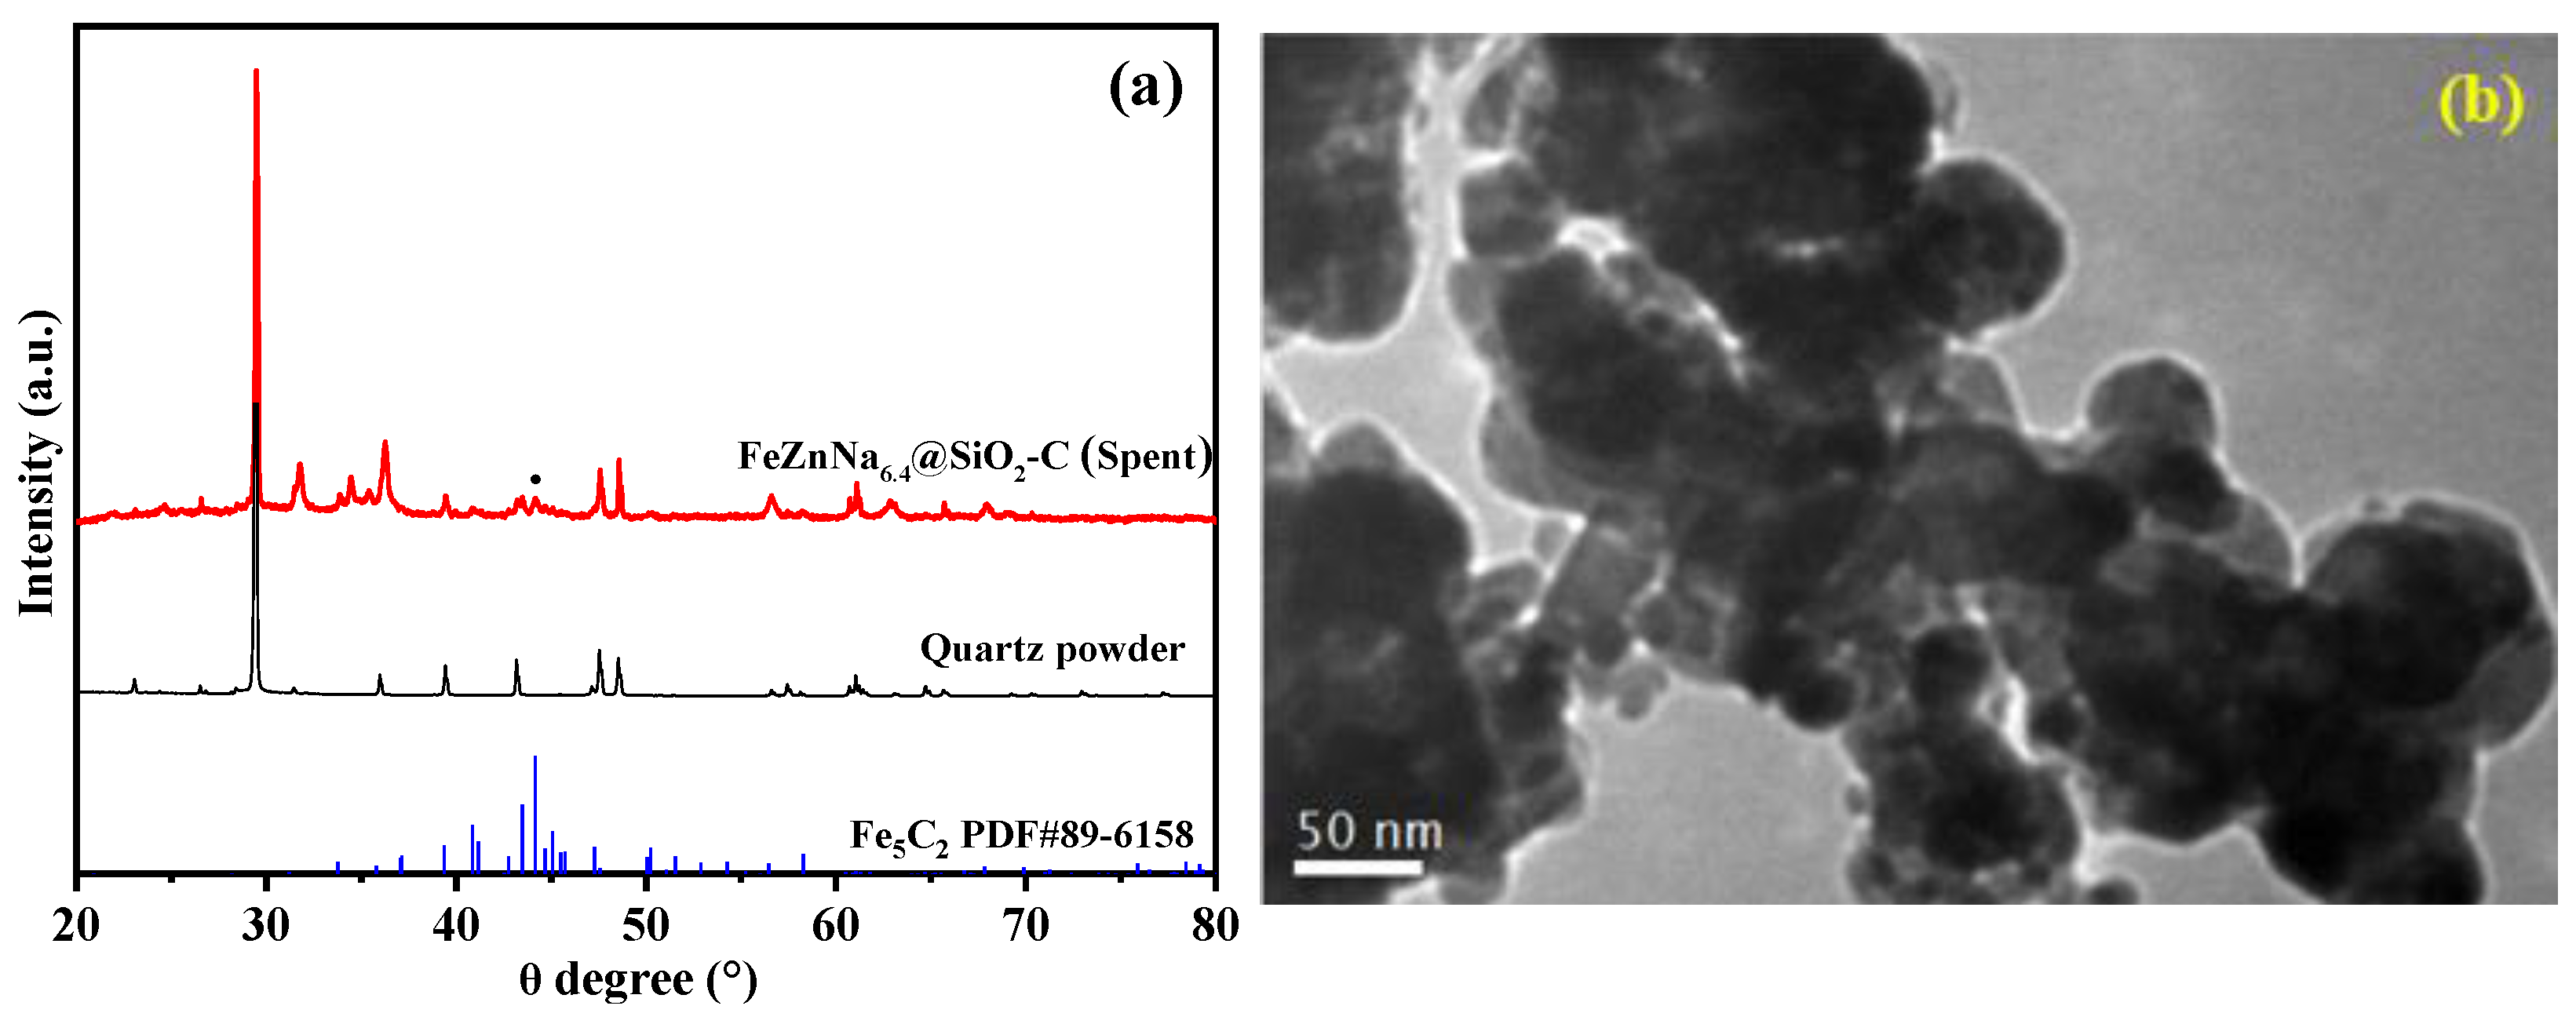
2.1.1. Textural Property, Structure and Morphology

As shown in Figure 1a,b, the calcined SiO2-C, Zn@SiO2-C, Na@SiO2-C, Fe@SiO2-C and FeNa@SiO2-C catalysts exhibit the characteristic diffraction patterns of the Fe2O3 phase (JCPDS No. 39-1346) and SiO2 phase (JCPDS No. 39-1425), while the Zn@SiO2-C and FeZnNax@SiO2-C catalysts provide diffraction peaks mainly assigned to ZnFe2O4 spinel phases (JCPDS No. 22-1012), in addition to the weak signals for the ZnO (JCPDS No. 36-1451) phase. The specific results are shown in Figure 1a,b and Table 1. The particle size of Fe2O3 in FeZn@SiO2-C catalysts, evaluated by the Scherrer equation ( D = K × γ / ( B × cos θ )   formula [33], means that K, B, θ, γ are the Scherrer constant, the half peak width or integral width of the measured sample diffraction peak, and the Prague angle, which was ~15 nm, respectively, much smaller than those of the Fe@SiO2-C (~23 nm), FeNa@SiO2-C (~33 nm) and FeZnNax@SiO2-C (~20 nm). These results indicate that the Zn promoter significantly decreases the size of Fe species over Fe catalysts [11]. However, the addition of Na changed the particle size of the phase in the FeZnNax@SiO2-C catalysts. The particle size of Fe2O3 generally showed a trend of first increasing and then decreasing with the increase in Na doping. Xiong [34] reported that the introduction of alkali metals promoted the agglomeration of iron particles, thereby increasing the size of iron oxide particles. The presence of alkali metals appears to promote the agglomeration of the iron precursor, thus enlarging the crystallite size of the iron oxide. In conjunction with Figure 1b, no Na2O (JCPDS No. 03-1074) phase was found in FeNax@SiO2-C and FeZnNax@SiO2-C samples, which is mainly due to the low Na doping [11]. Moreover, it is also possible that there are no XRD patterns associated with the Na2O/Na phase, which suggests a high dispersion of Na2O/Na in these catalysts [18]. Figure 1b shows that the diffraction peaks of ZnO (36.25° and 34.42°) are more obvious when the Na doping in FeNax@SiO2-C and FeZnNax@SiO2-C samples reached 6.4%. It can be found that the specific surface area (SSA) of FeZnNax@SiO2-C catalysts increased from 9.261 m2/g to 20.572 m2/g as the particle size of Fe2O3 decreases. Combined with the larger specific surface area of the remaining catalysts and the final actual CO2 conversion rate, it can be found that although the remaining catalysts have a larger specific surface area, the actual CO2 conversion rate is lower than that of any of FeZnNax@SiO2-C catalysts, which shows that Zn and Na as promoters can overcome the disadvantage of its own smaller specific surface area and obtain a more practical advantage of higher CO2 conversion rate. If we only consider alkaline Na as a promoter of the absorption of acidic CO2, it can be found that there is still a clear difference between their CO2 conversion rate by comparing FeZnNax@SiO2-C catalysts. Therefore, the increase in CO2 conversion rate was still attributed to the bifunctional effect of Zn and Na.
Figure 2 shows the TEM images and high-resolution TEM images of FeZnNax@SiO2-C; it can be determined that the FeZnNax@SiO2-C series catalysts have a mesoporous structure with a large number of particles distributed. The nanoparticles are not easy to produce carbon deposits with critical particle size. The small particle size is attributed to the fact that P123 is rich in hydroxyl groups (-OH), which are able to bind tightly with TEOS molecules to form micelles. The C overlay produced by polymer carbonation inhibits the sintering of metal nanoparticles and metal, and support interaction is enhanced during high-temperature treatment. The well-dispersed Fe2O3 nanoparticles, with an average diameter of 15–21 nm on Fe2O3, can be clearly observed, as shown in Figure 2. The lattice spacing of the Fe2O3 particle on SiO2 is 0.26 nm, which can be attributed to the (400) planes, suggesting that the catalyst exists in the form of Fe2O3 and retains good crystallinity, consistent with the XRD results. Figure 2f,h shows that there are two different oxides, Fe2O3 and ZnO. These metal particles have a very small particle size and are dispersed on mesoporous SiO2, including Fe2O3 and ZnO or Na2O/Na. In the reduction step, these metal oxides are reduced to Fe2O3/ZnO at a temperature of 673 K. In the catalytic process, more active Fe5C2 particles are generated to improve the selectivity of the target product.
Apparently, in Figure 3, the FeZnNax@SiO2-C nanoparticles give a type-IV isotherm with a long hysteresis loop at relative pressure (P/P0) of 0.4–1.0, which is characteristic of mesoporous materials according to the classification of International Union of Pure and Applied Chemistry (IUPAC). As shown in Table 1, the specific surface area generally shows a trend of first increasing and then decreasing with the increase in Na doping; FeZnNa6.4@SiO2-C had the highest specific surface area compared with other catalysts at 20.572 m2/g. Liang [35] found that when the Na doping was 0.1%, 0.5% and 5%, respectively, the specific surface area also increased first and then decreased, which were 31, 45, 28 m2/g. Although the specific surface area of the other three catalysts was higher than that of FeZnNa6.4@SiO2-C catalysts, the actual CO2 conversion rate was lower than that of FeZnNa6.4@SiO2-C catalysts, which indicated that ZnNa can significantly improve the CO2 conversion rate. Herein, the change in conversion rate is also consistent with Liang’s study [35] that alkaline additives can promote the adsorption and conversion of CO2.
The results are consistent with the related reports that an Na promoter will increase the CO2 adsorption and adsorption strength. Therefore, the adsorption of CO2 on the surface of the FeZnNax@SiO2-C catalyst is stronger than other catalysts, and it is easier to activate CO2, which is conducive to the subsequent conversion. The pore volume of FeZnNa6.4@SiO2-C also reached the maximum value of 0.047 cm3/g. The average pore size reached a maximum at 1.5%, and the remaining three groups of catalysts did not differ much, and still achieved the maximum value of 2.956 nm at 6.4%, and the pore volume decreased from 0.047 cm3/g at 6.4%Na to 0.035 cm3/g at 7.6% Na. However, the change in pore volume was very small, which showed that the excessive increase in Na doping did not have much effect on the volume of the pore. However, the pores of the catalyst do got clogged by excess Na. When the Na doping were 1.5%, 3.1 and 6.4%, which was not excessive, the pores were not clogged. Therefore, the decrease in surface area is suggested to be due to crystallite size growth rather than pore clogging [34].

2.1.2. XPS Results

The valence states of components in catalysts were investigated by XPS, the FeZn@SiO2-C catalyst delivered a Fe 2p3/2 peak at the binding energy of 711.23 eV and a satellite peak around 719.07 eV, which was slightly higher than the corresponding peak of the standard Fe2O3 sample, which confirmed the existence of the Fe species in a form of Fe3+ species. The Fe 2p3/2 binding energy of the FeZnNa1.5@SiO2-C catalyst in Figure 4a was reduced by about ~0.18 eV compared to that of the FeZn@SiO2-C catalyst, which indicates that the introduction of Na promoter reduced the Fe 2p3/2 binding energy of the FeZnNa1.5@SiO2-C catalyst. The decrease in binding energy suggests the charge transfer from Na ions to the vacant d orbits of Fe species [11]. Among them, the existence of C-O bonds indicates that there may be close interactions between C-Fe2O3-SiO2 in the form of C-O-Fe/Fe-C-O or C-O-Si (Figure 4b). The O/Si ratio is higher than that of 2.0 for SiO2, indicating that it may be due to the enhanced interaction between C and Fe nanoparticles and SiO2. The satellite peak is approximately 718.81 eV, it is consistent with standard Fe2O3 samples, which confirms the existence of the Fe species in a form of Fe3+ species [16]. The catalyst has part of ZnFe2O4, so there is Fe2+ inside (Figure 1), and in Figure 4a, the binding energy peak (B.E.P.) at 711.05, 714.82, 718.81 and 724.49 eV are associated with Fe2+ and Fe3+ species.

2.1.3. Reduction Behavior

H2-TPR experiments (Figure 5) showed that with Na doping in the FeZnNa1.5@SiO2-C, the peaks ascribed to H2 consumption rose up to 550 °C, related to the reduction of the Fe2O3 to Fe3O4 and/or to FeO, and Fe2O3 to FeO and/or to Fe0 shifted to a lower temperature, which suggests that the Na promoter concentration favored the initial reduction of the iron species [20]. On the contrary, the reduction peaks displaced towards high temperature for the FeZnNa1.5@SiO2-C, FeZnNa3.1@SiO2-C, FeZnNa6.4@SiO2-C and FeZnNa7.6@SiO2-C catalysts as the Na concentration increased. This displacement could be attributed to the closer contact between the iron oxides and potassium, as discussed in the previous XPS section. As for the peaks located at the high-temperature region (>550 °C), which were related to the reduction of Fe3+ species to Fe0. The noticed shift to high temperature and the increase in their intensities in FeZnNax@SiO2-C catalysts could be attributed to a stronger interaction between the iron oxides and the SiO2-C support, as suggested by the XPS results. Combined with TEM image (Figure 2), it can be found that the variation trend of Fe2O3 particle sizes in FeZnNax@SiO2-C is almost the same as that of the H2 reduction temperature.

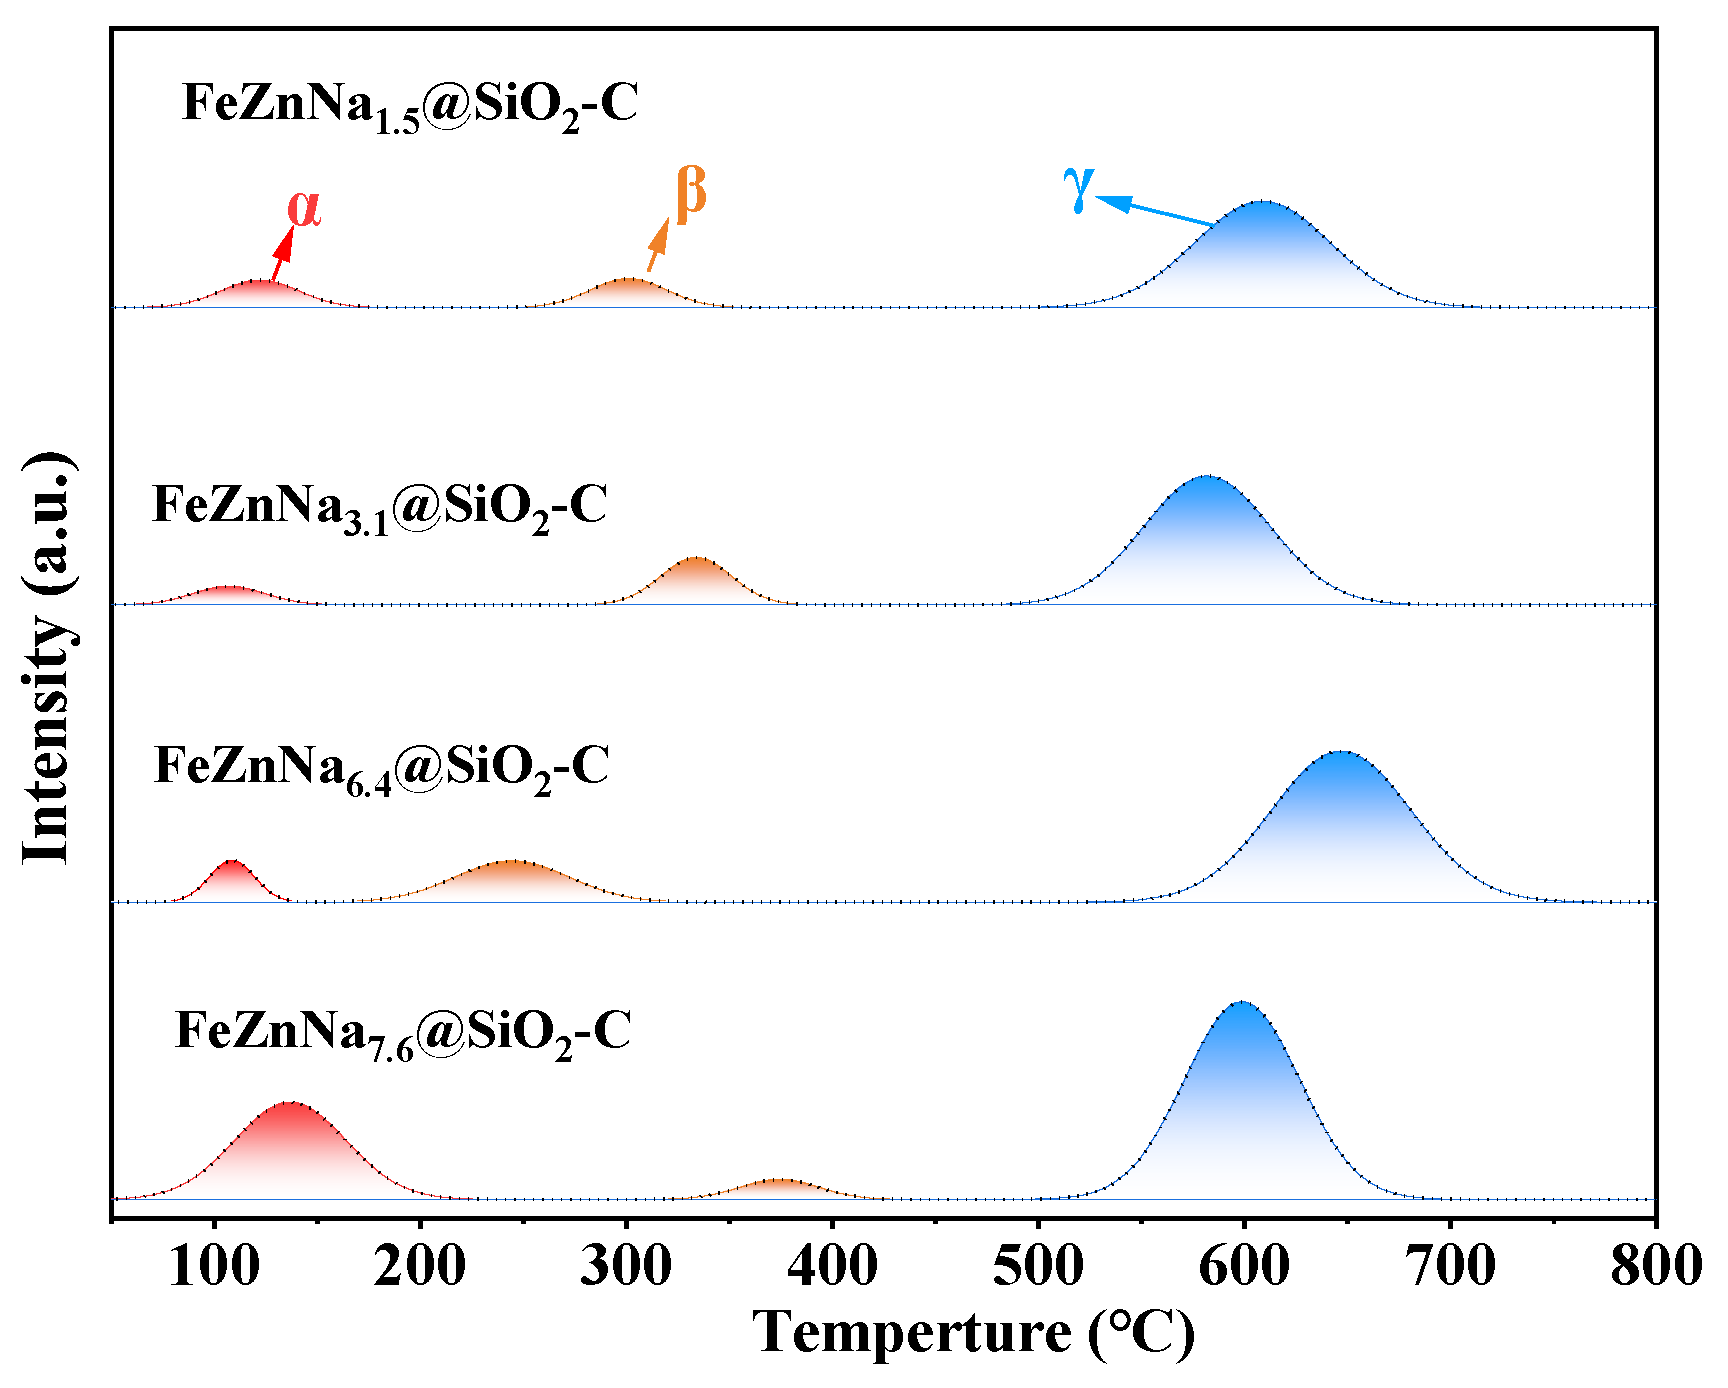
2.1.4. Chemisorption Behavior

The CO2 adsorption properties of FeZnNax@SiO2-C with different Na doping were further investigated by CO2 temperature-programmed desorption (CO2-TPD). As shown in Figure 6, three distinct peaks were observed for all the samples. The lower temperature peak around 130 °C (α peak) was ascribed to the desorption of CO2 weakly adsorbed in the bulk phase. The peaks in the temperature range of 300–400 °C (β peak) and 500–700 °C (γ peak) were due to the decomposition of SiO2 or the desorption of CO2, interacting strongly with the surface basic sites [36], which shift gradually to higher temperatures with increasing Na content. The increased Na loading also enhances the amount of CO2 uptake at strong basic sites (Table 2) with the increased Na doping as well. The amounts of desorbed CO2 for β peak listed in Table 2 follow the sequence: FeZnNa6.4@SiO2-C >  FeZnNa3.1@SiO2-C >  FeZnNa1.5@SiO2-C >  FeZnNa7.6@SiO2-C, which was consistent with the variation pattern of CO2 conversion in Table 3. Considering that FeZnNa1.5@SiO2-C has a weaker CO2 adsorption in the early stage, the FeZnNa6.4@SiO2-C catalyst has better CO2 adsorption and support structure than other catalysts (Figure 2e), which may be related to the SSA enhancement and particle size reduction of the catalyst. The advantage of specific surface area also proved the adsorption of CO2 was better, and the two characterizations could support each other.

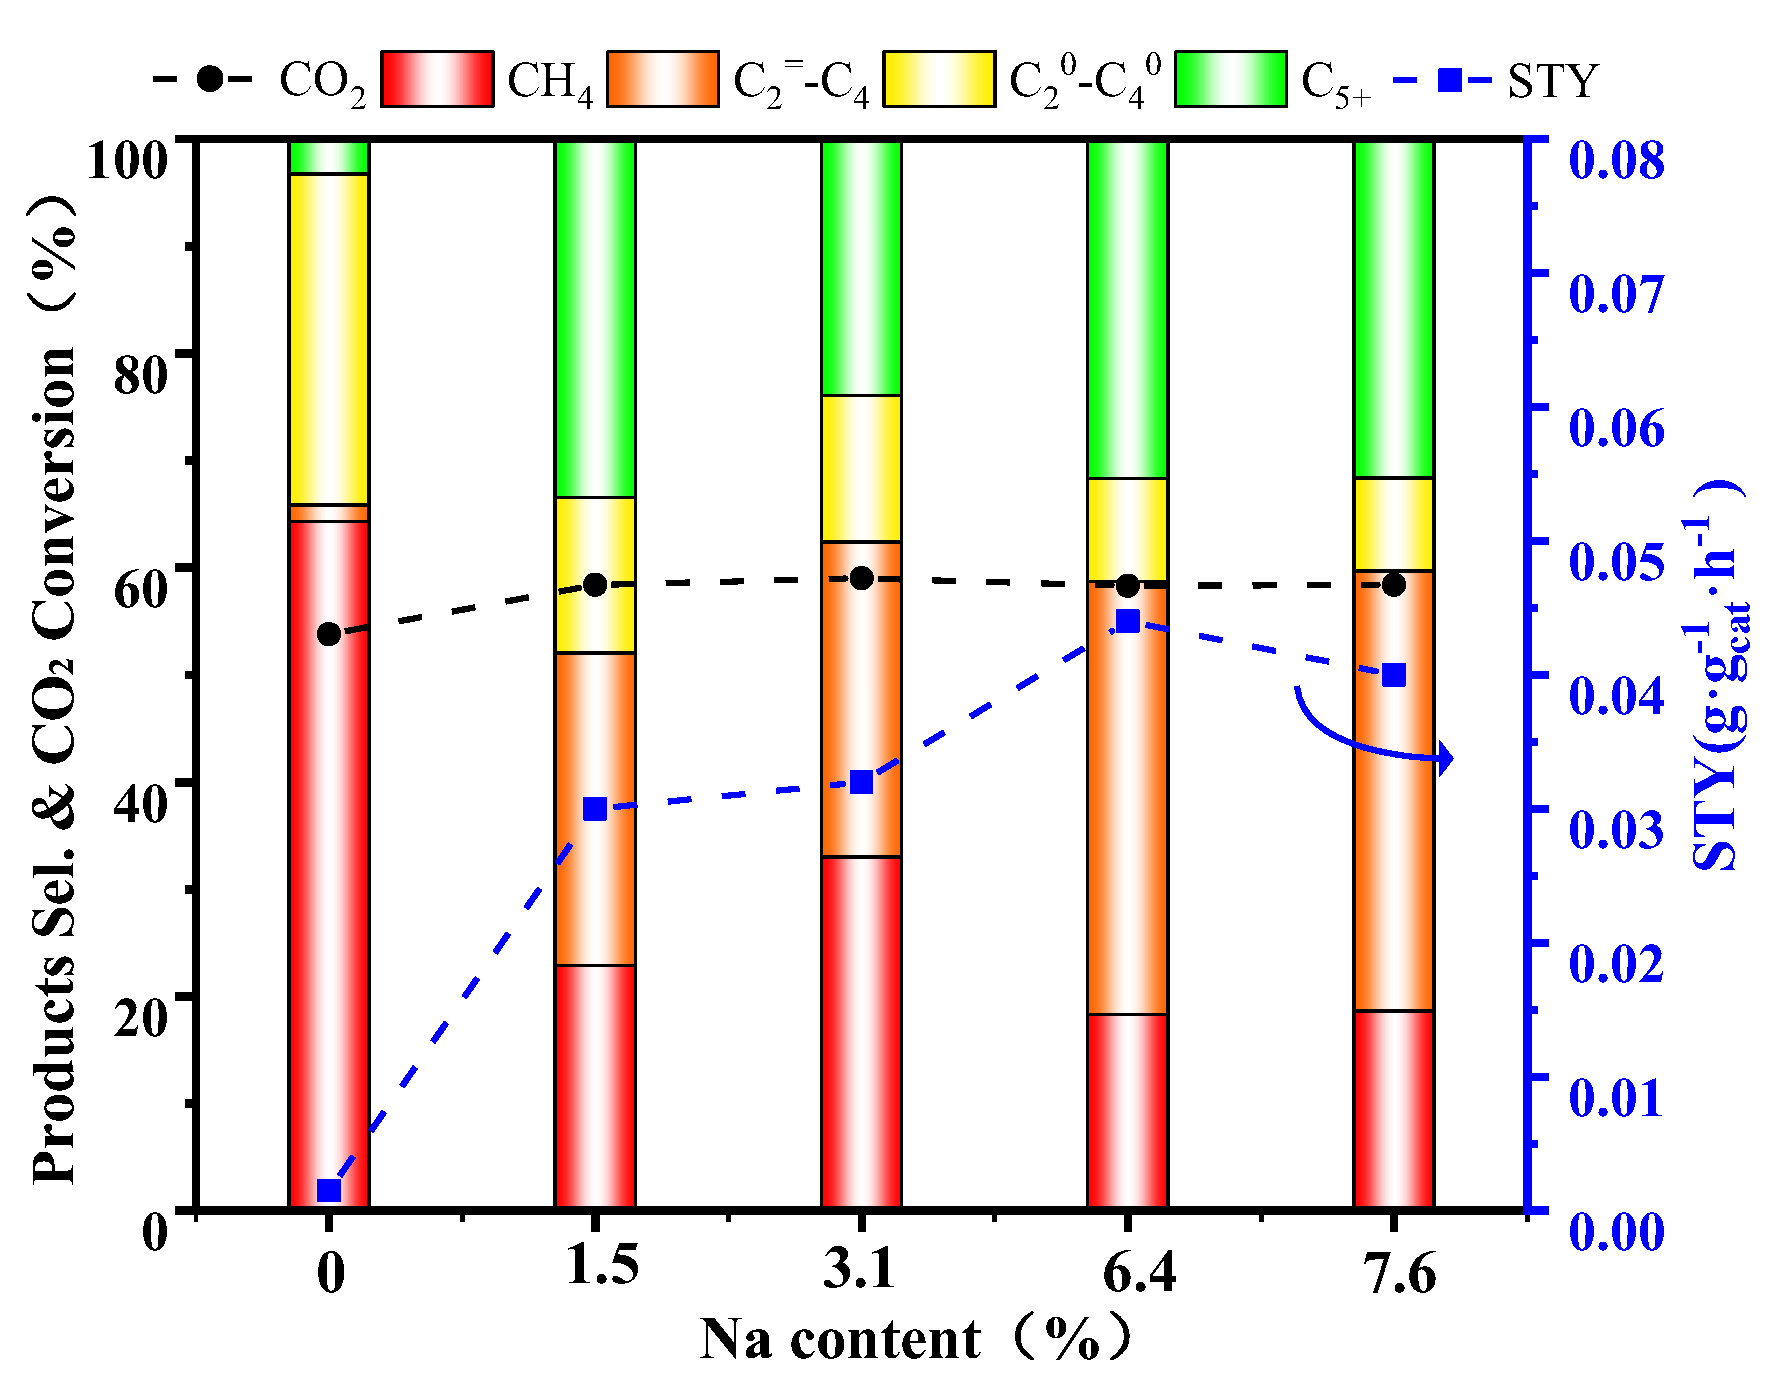
2.2. Catalytic Performances for CO2 Hydrogenation

Table 3 shows the catalytic performance of this series of catalysts for CO2 hydrogenation reaction. The ultimate goal of this series of catalysts is to improve the selectivity of olefin, so this section needs to focus on STY (space–time yield) of C 2 = C 4 = . The catalysts discussed were divided into seven types, each of which was an average of multiple samples. Among them, the maximum value of STY was 0.0436 when the Na doping was 6.4%, and the observation of FeZnNa7.6@SiO2-C revealed that although the corresponding Na doping exceeded that of FeZnNa6.4@SiO2-C, the STY was relatively low, which shows that this series of catalysts are the best-quality catalyst when Na doping is less than 7.6%. The results of four catalysts with different Na doping (1.5–7.6%) were analyzed, and it was found that a further increase in Na doping did not improve the conversion rate of CO2 any further, but rather suppressed the methane selectivity, improved the selectivity of C2+, and significantly increased the value of low-carbon olefin STY. Compared with FeZnNa1.5@SiO2-C, FeZnNa3.1@SiO2-C and FeZnNa7.6@SiO2-C, FeZnNa6.4@SiO2-C exhibited higher CO2 conversion, which probably had appropriate particle sizes and surface areas, providing more active sites and thereby increasing the CO2 hydrogenation catalytic activity. Moreover, it is noteworthy in Table 3 that turnover frequencies of CO2 conversion (TOF) for the FeZnNax@SiO2-C catalyst (3.61 × 10⁻³ s−1) is lower than that of FeSb (3.6 × 10⁻⁵ mol/g·s), and FeBi (3.2 × 10⁻⁵ mol/g·s) [37]. Although a high TOF value of 3.6 × 10⁻⁵ mol/g·s was reported for FeSb, it should be noted that this value was obtained by the addition of the promoter Sb. All of these indicate that the catalysts (addition of promoters such as Na, Sb and Bi) can obviously promote TOF and STY, but Na was the lowest cost in all the above promoters.

2.3. Effect of Different Na Doping on Final Catalytic Performance

Figure 7 shows the effects of different Na-doping levels on the selectivity, CO2 conversion rate and STY of CO, CH4, C 2 = C 4 = , C 2 0 C 4 0 and C5+ in the same series of catalysts. The CO2 conversion has increased from about 54% to about 59% with the addition of Na, but the subsequent increase in Na doping has not increased significantly. With the increase in Na doping in the catalyst, the selectivity of the target product C 2 = C 4 = raised from 1.54% to 41.07%. STY achieved the maximum value when Na doping was 6.4%, which showed that although Na increased the activity of the catalyst, it inhibited the activity of the catalyst when the Na doping was too high. From above catalytic characterization, it can be found that FeZnNa6.4@SiO2-C had the most excellent performance with excellent mesoporous structure, highly dispersed metal nanoparticles, and the active component Fe5C2 (labeled as “●”, Figure 8a) particles were also more obvious, and the metal and support had a strong interaction, which shows the advantages of accelerating the electron transport, improving the hydrothermal stability and catalytic activity, and the results of the characterization are consistent with the convincing experimental results. Furthermore, the synergistic effect of Na and Zn promoters not only increased the CO2 adsorption amount, thereby promoting the complete transformation of Fe species into Fe5C2, but also reduced the Fe5C2 size and exposed more active sites, which was conducive to the FTO to consume CO and accelerated the conversion of CO2. Therefore, the FeZnNax@SiO2-C catalyst gave a higher CO2 hydrogenation rate and C 2 = C 4 = formation rate.
Figure 8b shows the TEM images of the spent sample; the metal particles had a slight enlargement, but did not congregate uncontrollably, which showed that graphitized carbon played a certain role, and when combined with the 100 h working condition diagram of Figure 9, it can be concluded that the catalyst has good structural stability.
XRD showed that iron-based catalysts containing Fe2O3 and ZnO components were successfully prepared. The approximate metal particle size (Fe2O3, ZnO) was calculated by the corresponding formula. The presence of Na and the proportion of components of each element were confirmed by XPS testing. From BET and TEM, it can be concluded that the FeZnNax@SiO2-C catalysts were indeed mesoporous in structure. The pore size, pore volume, specific surface area and precise metal particle size were also obtained; the high-resolution TEM diagram displayed the carbon layer wrapped on the surface of the catalyst and the highly dispersed metal nanoparticles. From the H2-TPR test, the increase in Na doping significantly changed the reduction temperature of Fe2O3 species. The lowest reduction temperatures were observed for FeZnNa6.4@SiO2-C: 580 °C (Fe2O3→FeO), 741 °C (FeO→αFe). The initially prepared Fe2O3 phase was reduced to Fe3O4 at about 400 °C [11]. CO2-TPD showed that more basic sites were provided for adsorption of more acidic CO2 in the early stage due to the introduction of Na, which once again proved that the introduction of Na enhanced the CO2 adsorption. In the later stage, support was decomposed with the increase in temperature. Compared with other catalysts, FeZnNa6.4@SiO2-C has a more stable support structure and CO2 adsorption. Combining the above analyses, it is found that the reduction temperature, specific surface area, pore volume, average pore size and CO2 adsorption are closely related to the particle size of Fe2O3. The reason for the change in particle size is due to the addition of alkaline elements (Na), Fe particle promotion, and the increase in metal particle size [34]. When Na reached a certain amount, Na acted as a dispersant and inhibited the aggregation of Fe particles, thereby reducing the particle size of Fe2O3. But as the Na doping increased again, the amount that acted as a dispersant was broken, and then the pore was blocked. Fe particles with a slightly larger particle size do not have extra positions to enter, and therefore the agglomeration phenomenon is produced again, and the particle size of Fe particles increases again. Therefore, the phenomenon of particle size change in Fe2O3 was first increasing, then reducing, and finally increasing. The reduction temperature, specific surface area, pore volume and average pore size are all affected by the Fe2O3 particle size and change accordingly. The specific internal connection is referred to above.

3. Experimental

3.1. Catalyst Preparation

FeZnNa1.5@SiO2-C was prepared by dissolving Fe(NO3)3·9H2O, Zn(NO3)2·6H2O, NaNO3 and P123 in a mixed solvent formed by ethanol and deionized water and vigorously stirring for two hours to form a homogeneous solution. The mass of P123, Fe(NO3)3·9H2O, Zn(NO3)2·6H2O and NaNO3 were 2.5 g, 6.87 g, 4.36 g, 0.21 g, respectively. The volume ratio of ethanol deionized water in 40 mL mixed solvent was 1:1, and 4.46 mL of tetraethyl orthosilicate was added dropwise into the solution hydrolyzed in the previous step, and a homogeneous solution was formed by stirring for 1 h. After the end of the reaction, the solution was put into a reaction dish and placed in a fume hood for ventilation for 12–24 h, with the purpose of removing the surface ethanol and deionized water. The sample with the surface solvent removed were placed in an oven for heating and holding at 80 °C for 12 h. The sample was taken out and placed in a tubular furnace for calcination at 600 °C in air for 4 h at a rate of 2 °C/min to obtain the final catalyst material.
Two groups of catalysts were prepared according to the different Zn doping, namely Fe@SiO2-C and FeZn@SiO2-C; Fe accounted for 25% of the entire catalyst mass. Four groups of catalysts were prepared with Na doping as variables, with loading of 1.5%, 3.1%, 6.4% and 7.6%, respectively. Both Fe and Zn accounted each for 25% of the mass of the entire catalyst, named FeZnNa1.5@SiO2-C FeZnNa3.1@SiO2-C, FeZnNa6.4@SiO2-C and FeZnNa7.6@SiO2-C. Among them, the FeNa catalyst was additionally produced, named FeNa@SiO2-C; Fe accounted for 25% of the mass of the entire catalyst, and Na accounted for 6.4% of the mass of the entire catalyst.

3.2. Nanocomposite Characterization

TEM images were obtained on a JEM-2010 electron microscope (JEOL (BEIJING) CO., Ltd., Beijing, China) with an acceleration voltage of 200 kV. XRD patterns were recorded on a Rigaku D/Max-2rB-II XRD meter (Cu Kα radiation, λ = 1.5406 Å, Rigaku, Tokyo, Japan), with 2θ = 10° to 90° scanned at 8°·min−1. The texture properties of the nanocomposites were determined by N2 adsorption/desorption isotherms on a Micromeritics ASAP 2010 apparatus (Micromeritics instrument (Shanghai) Ltd., Shanghai, China). The pore size distribution, pore volume and specific surface area were determined by the multipoint Brunauer–Emmett–Teller (BET) method. The concentration of surface metal atoms was determined using CO chemisorption in a Micromeritics ASAP 2010 (Micromeritics instrument (Shanghai) Ltd., Shanghai, China) automated system. A 0.1 g sample of a freshly calcined catalyst was first evacuated to 10−6 mm Hg at 100 °C for 30 min and then reduced under flowing H2 by ramping at 2 °C/min to 280 °C and holding there for 12 h. The catalyst was then evacuated at 280 °C for 60 min to desorb H2. CO chemisorption was carried out at 35 °C. X-ray photoelectron spectroscopy (XPS, Shimadzu (Shanghai) Experimental Equipment Co., Ltd., Shanghai, China) characterization was carried out in an UHV chamber equipped with a monochromatized Al Kα X-ray source and a Sphere 2 analyzer. All the binding energies were calibrated by the adventitious C1s line at 284.8 eV. Hydrogen temperature-programmed reduction (H2-TPR, BSD Instrument Technology (Beijing) Co., Ltd., Beijing, China) experiments were conducted on homemade apparatus equipped with a thermal conductivity detector (CO2-TCD, BSD Instrument Technology (Beijing) Co., Ltd., Beijing, China). The reactor was loaded with 50 mg of sample at a time and heated to 1073 K at 10 K/min with a gas of 10% H2/Ar.

3.3. Catalytic Reaction

It was used as a catalyst for the hydrogenation reaction of carbon dioxide in order to evaluate its catalytic performance. Firstly, the catalyst was placed in a mesh screen with the help of a grinding rod to obtain an experimental catalyst of about 0.5 g (40–50 mesh). Prior to CO2 hydrogenation, 300 mg of catalyst was diluted with 600 mg of quartz powder (60–80 mesh) and reduced on site in flowing 5 vol % H2/Ar (gas hourly space velocity (GHSV) = 2500 mL/g·h) at 400 °C for 18 h with a heating rate of 2 °C·min−1. Catalytic testing was performed under industrially relevant operation conditions of 300 °C, 2.5 MPa, and a H2/CO2/N2 ratio of 23/69/8 by volume (GHSV = 1500 mL/g·h) in a tubular fixed-bed reactor with an inner diameter of 10 mm. N2 was used as the internal standard during gas-phase product analysis. All tubing and connections were wrapped with heating tape and heated at 150 °C to avoid condensation. The effluent of the reactor was analyzed on-stream by using a gas chromatograph (GC, Agilent 7890B, Agilent Technologies, Inc., Santa Clara, California, United States) equipped with a thermal conductivity detector (TCD, GC-2014AT, SHIMADZU, a TDX-01 column) and a flame ionization detector (FID, Agilent, a capillary column of PONA type). H2, N2, CO, CH4 and CO2 were detected by the TCD, hydrocarbons (CnHm), and the FID. To reduce the uncertainty in the product analysis, we collected the liquid products during every 12 h for one sample. The calculated carbon balance for all catalytic performance tests were between 95% and 105%. All listed data were obtained at 100 h on-stream when achieving the steady state.
The conversion of C O 2 ( C O 2   c o n v . ) and the selectivity of hydrocarbons ( C n H m   s e l . ), CO ( C O   s e l . ) and C 2 = C 4 = ( C 2 = C 4 =   s e l . ) were calculated via the following equations:
C O 2   c o n v . ( % ) = C O 2 i n C O 2 o u t C O 2 i n × 100 C O   s e l . ( % ) = C O o u t C O 2 i n C O 2 o u t × 100 C n H m   s e l . ( % ) = C n H m × n 1 n C n H m × n × 100 C 2 = C 4 =   s e l . ( % ) = 2 4 C n H 2 n × n 1 n C n H m × n × 100 C a r b o n   b a l a n c e ( % ) = C O o u t + 1 n C n H m × n + C O 2 o u t C O 2 i n × 100
where C O 2 i n and C O 2 o u t expressed the mole of C O 2 , the inlet and the outlet of the reactor, respectively. C O o u t was the mole of CO in the outlet. C n H m was the mole of the hydrocarbon product with carbon number n.
S T Y C 2 = C 4 = = 2 4 C n H 2 n × n × M C 2 = C 4 = T O F = C O 2 i n C O 2 o u t ω F e × D F e ÷ M F e
where S T Y C 2 = C 4 = is the time–space yield of C 2 = C 4 = based on unit mass catalyst ( g g c a t 1 h 1 ) . TOF is the conversion frequency of catalyst ( h 1 ). ω F e is the mass fraction of Fe (%). M F e is the relative atomic mass of Fe (56 g·mol−1), and DFe is the dispersion of Fe (%), which was based on total CO2 chemisorbed, CO2/Fes = 0.5, n C O / n F e = 0.5 , DFe (%) = 2 × n t o t a l   C O   c h e m i s o r b e d / n t o t a l   n u m b e r   o f   F e   a t o m s .

4. Conclusions

The iron-based catalysts containing sodium and zinc additives have a stable mesoporous structure with graphitized carbon on the surface of the active component and are highly selective for the production of high-value olefins by CO2 hydrogenation. In this paper, the CO2 conversion of the FeZnNa catalyst was stable at about 59%, and the CH4 selectivity was significantly inhibited compared with other catalysts, and its STY value was the highest 0.0436. The results showed that the presence of Na and Zn additives favored the carburizing of Fe species to generate smaller active Fe5C2 particles, improved the adsorption of carbon dioxide, and inhibited the deep hydrogenation of olefins, which is the key to the conversion of carbon dioxide into olefins. Catalysts with a sinter resistance and mesoporous resistance to collapse have more stable and long-lasting catalytic performance than other catalysts. The catalyst in this paper has sinter resistance and mesoporous collapse resistance, so it has a more stable structure than other catalysts. However, during the above reaction, the generated water inhibits the RWGS step, which reduces the conversion rate of CO2 and hinders the formation of olefins in the FTO process, affecting the final catalytic performance. Therefore, the development of catalysts with hydrophobic surfaces to ensure the stability and durability of the catalytic performance is a difficult point for further development.

Author Contributions

Conceptualization, Z.N.; methodology, Z.N.; synthesis, Z.N. and M.C.; catalytic activity investigation, Z.N., M.C. and S.Z.; catalytic measurement preparation, M.C. and S.Z.; catalytic activity analysis and interpretation, Z.N. and X.C.; XRD investigation and data analysis, Z.N. and H.S.; N2 physisorption measurements, X.C.; TEM investigation and interpretation, Z.N. and X.C.; TPR, TPD investigation and interpretation, Z.N. and L.S.; XPS data analysis and interpretation, Z.N. and M.C.; writing—original draft preparation, Z.N.; writing—review and editing, Z.N., M.C., S.Z., X.C., H.S. and L.S.; project administration, Z.N.; funding acquisition, Z.N. All authors have read and agreed to the published version of the manuscript.

Funding

The authors kindly acknowledge the financial support of National Natural Science Foundation of China (Grant No. 21905031) and Science Foundation of Changzhou university (ZMF18020299).

Data Availability Statement

The data presented in this study are openly available.

Conflicts of Interest

The authors declare no conflict of interest. The funders had no role in the design of the study; in the collection, analyses, or interpretation of the data; in the writing of the manuscript; or in the decision to publish the results.

References

  1. Peter, S.C. Reduction of CO2 to Chemicals and Fuels: A Solution to Global Warming and Energy Crisis. ACS Energy Lett. 2018, 3, 1557–1561. [Google Scholar] [CrossRef]
  2. Zhang, F.; Chen, W.; Li, W. Recent advances in the catalytic conversion of CO2 to chemicals and demonstration projects in China. Mol. Catal. 2023, 541, 113093. [Google Scholar] [CrossRef]
  3. Gao, D.; Li, W.; Wang, H.; Wang, G.; Cai, R. Heterogeneous Catalysis for CO2 Conversion into Chemicals and Fuels. Trans. Tianjin Univ. 2022, 28, 245–264. [Google Scholar] [CrossRef]
  4. Gao, P.; Zhang, L.; Li, S.; Zhou, Z.; Sun, Y. Novel Heterogeneous Catalysts for CO2 Hydrogenation to Liquid Fuels. ACS Cent. Sci. 2020, 6, 1657–1670. [Google Scholar] [CrossRef]
  5. Zhang, W.; Wang, S.; Guo, S.; Qin, Z.; Dong, M.; Wang, J.; Fan, W. Effective conversion of CO2 into light olefins along with generation of low amounts of CO. J. Catal. 2022, 413, 923–933. [Google Scholar] [CrossRef]
  6. Wang, J.; Xu, Y.; Ma, G.; Lin, J.; Wang, H.; Zhang, C.; Ding, M. Directly Converting Syngas to Linear alpha-Olefins over Core-Shell Fe3O4@MnO2 Catalysts. ACS Appl. Mater. Interfaces 2018, 10, 43578–43587. [Google Scholar] [CrossRef]
  7. Liu, W.; Cheng, S.; Malhi, H.S.; Gao, X.; Zhang, Z.; Tu, W. Hydrogenation of CO2 to Olefins over Iron-Based Catalysts: A Review. Catalysts 2022, 12, 1432. [Google Scholar] [CrossRef]
  8. Liu, G.; Liu, P.; Meng, D.; Zhao, T.; Qian, X.; He, Q.; Guo, X.; Qi, J.; Peng, L.; Xue, N.; et al. CO(x) hydrogenation to methanol and other hydrocarbons under mild conditions with Mo3S4@ZSM-5. Nat. Commun. 2023, 14, 513. [Google Scholar] [CrossRef]
  9. Gao, R.; Zhang, C.; Jun, K.-W.; Kim, S.K.; Park, H.-G.; Zhao, T.; Wang, L.; Wan, H.; Guan, G. Transformation of CO2 into liquid fuels and synthetic natural gas using green hydrogen: A comparative analysis. Fuel 2021, 291, 120111. [Google Scholar] [CrossRef]
  10. Aresta, M.; Dibenedetto, A.; Quaranta, E. State of the art and perspectives in catalytic processes for CO2 conversion into chemicals and fuels: The distinctive contribution of chemical catalysis and biotechnology. J. Catal. 2016, 343, 2–45. [Google Scholar] [CrossRef]
  11. Zhang, Z.; Huang, G.; Tang, X.; Yin, H.; Kang, J.; Zhang, Q.; Wang, Y. Zn and Na promoted Fe catalysts for sustainable production of high-valued olefins by CO2 hydrogenation. Fuel 2022, 309, 122105. [Google Scholar] [CrossRef]
  12. Liu, X.; Wang, M.; Yin, H.; Hu, J.; Cheng, K.; Kang, J.; Zhang, Q.; Wang, Y. Tandem Catalysis for Hydrogenation of CO and CO2 to Lower Olefins with Bifunctional Catalysts Composed of Spinel Oxide and SAPO-34. ACS Catal. 2020, 10, 8303–8314. [Google Scholar] [CrossRef]
  13. Shekari, A.; Labrecque, R.; Larocque, G.; Vienneau, M.; Simoneau, M.; Schulz, R. Conversion of CO2 by reverse water gas shift (RWGS) reaction using a hydrogen oxyflame. Fuel 2023, 344, 127947. [Google Scholar] [CrossRef]
  14. Ma, Z.; Porosoff, M.D. Development of Tandem Catalysts for CO2 Hydrogenation to Olefins. ACS Catal. 2019, 9, 2639–2656. [Google Scholar] [CrossRef]
  15. Zhu, J.; Mu, M.; Liu, Y.; Zhang, M.; Zhang, G.; Cheng, Z.; Yin, B.H.; Yip, A.C.K.; Song, C.; Guo, X. Unveiling the promoting effect of potassium on the structural evolution of iron catalysts during CO2 hydrogenation. Chem. Eng. Sci. 2023, 282, 119228. [Google Scholar] [CrossRef]
  16. Zhai, P.; Xu, C.; Gao, R.; Liu, X.; Li, M.; Li, W.; Fu, X.; Jia, C.; Xie, J.; Zhao, M.; et al. Highly Tunable Selectivity for Syngas-Derived Alkenes over Zinc and Sodium-Modulated Fe5C2 Catalyst. Angew. Chem. Int. Ed. Engl. 2016, 55, 9902–9907. [Google Scholar] [CrossRef]
  17. Zhang, Z.; Liu, Y.; Jia, L.; Sun, C.; Chen, B.; Liu, R.; Tan, Y.; Tu, W. Effects of the reducing gas atmosphere on performance of FeCeNa catalyst for the hydrogenation of CO2 to olefins. Chem. Eng. J. 2022, 428, 131388. [Google Scholar] [CrossRef]
  18. Xu, Y.; Zhai, P.; Deng, Y.; Xie, J.; Liu, X.; Wang, S.; Ma, D. Highly Selective Olefin Production from CO2 Hydrogenation on Iron Catalysts: A Subtle Synergy between Manganese and Sodium Additives. Angew. Chem. Int. Ed. Engl. 2020, 59, 21736–21744. [Google Scholar] [CrossRef]
  19. Wu, H.C.; Chen, T.C.; Wu, J.H.; Pao, C.W.; Chen, C.S. Influence of sodium-modified Ni/SiO2 catalysts on the tunable selectivity of CO2 hydrogenation: Effect of the CH4 selectivity, reaction pathway and mechanism on the catalytic reaction. J. Colloid Interface Sci. 2021, 586, 514–527. [Google Scholar] [CrossRef]
  20. Yang, Y.; Zhang, H.; Ma, H.; Qian, W.; Sun, Q.; Ying, W. Effect of alkalis (Li, Na, and K) on precipitated iron-based catalysts for high-temperature Fischer-Tropsch synthesis. Fuel 2022, 326, 125090. [Google Scholar] [CrossRef]
  21. Zeng, F.; Mebrahtu, C.; Xi, X.; Liao, L.; Ren, J.; Xie, J.; Heeres, H.J.; Palkovits, R. Catalysts design for higher alcohols synthesis by CO2 hydrogenation: Trends and future perspectives. Appl. Catal. B Environ. 2021, 291, 120073. [Google Scholar] [CrossRef]
  22. Kangvansura, P.; Chew, L.M.; Saengsui, W.; Santawaja, P.; Poo-arporn, Y.; Muhler, M.; Schulz, H.; Worayingyong, A. Product distribution of CO2 hydrogenation by K- and Mn-promoted Fe catalysts supported on N -functionalized carbon nanotubes. Catal. Today 2016, 275, 59–65. [Google Scholar] [CrossRef]
  23. Yang, H.; Dang, Y.; Cui, X.; Bu, X.; Li, J.; Li, S.; Sun, Y.; Gao, P. Selective synthesis of olefins via CO2 hydrogenation over transition-metal-doped iron-based catalysts. Appl. Catal. B Environ. 2023, 321, 122050. [Google Scholar] [CrossRef]
  24. Shadravan, V.; Kennedy, E.; Stockenhuber, M. An experimental investigation on the effects of adding a transition metal to Ni/Al2O3 for catalytic hydrogenation of CO and CO2 in presence of light alkanes and alkenes. Catal. Today 2018, 307, 277–285. [Google Scholar] [CrossRef]
  25. Wu, Y.; Lin, J.; Xu, Y.; Ma, G.; Wang, J.; Ding, M. Transition Metals Modified Ni−M (M=Fe, Co, Cr and Mn) Catalysts Supported on Al2O3−ZrO2 for Low-Temperature CO2 Methanation. ChemCatChem 2020, 12, 3553–3559. [Google Scholar] [CrossRef]
  26. Liang, J.; Wang, X.-Y.; Gao, X.-H.; Tian, J.-M.; Duan, B.; Zhang, W.; Jiang, Y.-J.; Reubroycharoen, P.; Zhang, J.-L.; Zhao, T.-S. Effect of Na promoter and reducing atmosphere on phase evolution of Fe-based catalyst and its CO2 hydrogenation performance. J. Fuel Chem. Technol. 2022, 50, 1573–1580. [Google Scholar] [CrossRef]
  27. Wei, C.; Tu, W.; Jia, L.; Liu, Y.; Lian, H.; Wang, P.; Zhang, Z. The evolutions of carbon and iron species modified by Na and their tuning effect on the hydrogenation of CO2 to olefins. Appl. Surf. Sci. 2020, 525, 146622. [Google Scholar] [CrossRef]
  28. Xu, D.; Ding, M.; Hong, X.; Liu, G.; Tsang, S.C.E. Selective C2+ Alcohol Synthesis from Direct CO2 Hydrogenation over a Cs-Promoted Cu-Fe-Zn Catalyst. ACS Catal. 2020, 10, 5250–5260. [Google Scholar] [CrossRef]
  29. Ni, Z.; Qin, H.; Kang, S.; Bai, J.; Wang, Z.; Li, Y.; Zheng, Z.; Li, X. Effect of graphitic carbon modification on the catalytic performance of Fe@SiO2-GC catalysts for forming lower olefins via Fischer-Tropsch synthesis. J. Colloid Interface Sci. 2018, 516, 16–22. [Google Scholar] [CrossRef]
  30. Ni, Z.; Zhang, X.; Bai, J.; Wang, Z.; Li, X.; Zhang, Y. Potassium promoted core–shell-structured FeK@SiO2-GC catalysts used for Fischer–Tropsch synthesis to olefins without further reduction. New J. Chem. 2020, 44, 87–94. [Google Scholar] [CrossRef]
  31. Kuwahara, Y.; Jinda, A.; Ge, H.; Hamahara, K.; Yamashita, H. CO2 Hydrogenation to Methanol over a Pt-Loaded Molybdenum Suboxide Nanosheet with Abundant Surface Oxygen Vacancies. J. Phys. Chem. C 2023, 127, 4942–4952. [Google Scholar] [CrossRef]
  32. Chen, B.; Dong, M.; Liu, S.; Xie, Z.; Yang, J.; Li, S.; Wang, Y.; Du, J.; Liu, H.; Han, B. CO2 Hydrogenation to Formate Catalyzed by Ru Coordinated with a N,P-Containing Polymer. ACS Catal. 2020, 10, 8557–8566. [Google Scholar] [CrossRef]
  33. Nasiri, S.; Rabiei, M.; Palevicius, A.; Janusas, G.; Vilkauskas, A.; Nutalapati, V.; Monshi, A. Modified Scherrer equation to calculate crystal size by XRD with high accuracy, examples Fe2O3, TiO2 and V2O5. Nano Trends 2023, 3, 100015. [Google Scholar] [CrossRef]
  34. Xiong, H.; Motchelaho, M.A.; Moyo, M.; Jewell, L.L.; Coville, N.J. Effect of Group I alkali metal promoters on Fe/CNT catalysts in Fischer–Tropsch synthesis. Fuel 2015, 150, 687–696. [Google Scholar] [CrossRef]
  35. Liang, B.; Duan, H.; Sun, T.; Ma, J.; Liu, X.; Xu, J.; Su, X.; Huang, Y.; Zhang, T. Effect of Na Promoter on Fe-Based Catalyst for CO2 Hydrogenation to Alkenes. ACS Sustain. Chem. Eng. 2018, 7, 925–932. [Google Scholar] [CrossRef]
  36. Cui, X.; Gao, P.; Li, S.; Yang, C.; Liu, Z.; Wang, H.; Zhong, L.; Sun, Y. Selective Production of Aromatics Directly from Carbon Dioxide Hydrogenation. ACS Catal. 2019, 9, 3866–3876. [Google Scholar] [CrossRef]
  37. Barrios, A.J.; Peron, D.V.; Chakkingal, A.; Dugulan, A.I.; Moldovan, S.; Nakouri, K.; Thuriot-Roukos, J.; Wojcieszak, R.; Thybaut, J.W.; Virginie, M.; et al. Efficient Promoters and Reaction Paths in the CO2 Hydrogenation to Light Olefins over Zirconia-Supported Iron Catalysts. ACS Catal. 2022, 12, 3211–3225. [Google Scholar] [CrossRef]
Figure 1. XRD pattern of (a) SiO2-C, Zn@SiO2-C, Na@SiO2-C, Fe@SiO2-C, FeNa@SiO2-C and FeZn@SiO2-C catalysts, (b) FeZnNax@SiO2-C catalysts with different Na doping.
Catalysts 13 01508 g001
Figure 2. TEM images and High-resolution TEM images of (a,b) FeZnNa1.5@SiO2-C, (c,d) FeZnNa3.1@SiO2-C, (e,f) FeZnNa6.4@SiO2-C, (g,h) FeZnNa7.6@SiO2-C.
Catalysts 13 01508 g002
Figure 3. N2 adsorption–desorption curves of the FeZnNax@SiO2-C catalysts with the different Na doping.
Catalysts 13 01508 g003
Figure 4. (a) Fe 2p and (b) C 1s XPS spectra of the FeZnNax@SiO2-C catalyst.
Catalysts 13 01508 g004
Figure 5. H2-TPR profiles of the FeZnNax@SiO2-C catalysts with different Na loading.
Catalysts 13 01508 g005
Figure 6. CO2-TPD profiles of the FeZnNax@SiO2-C catalysts with different Na doping in 50–800 °C.
Catalysts 13 01508 g006
Figure 7. Effect of different Na doping on final catalytic performance.
Catalysts 13 01508 g007
Figure 8. (a) XRD pattern and (b) TEM images of the spent sample-FeZnNa6.4@SiO2-C.
Catalysts 13 01508 g008
Figure 9. Change in (a) CO2 conversion and (b) CH4 selectivity with time on-stream for the FeZnNax@SiO2-C catalysts.
Catalysts 13 01508 g009
Table 1. Physicochemical characteristics of the Fe@SiO2-C, FeNa@SiO2-C and FeZnNax@SiO2-C catalysts.
CatalystFe Loading (wt%) aNa Loading (wt%) aTotal CO
Chemisorbed
(μmol/g) b
% Fe
Dispersion b
Fe2O3 Size
(nm) c
SSA
(m2/g) d
PV
(cm3/g) d
APS
(nm) d
Fe@SiO2-C25.404725.22375.50.0873.19
FeNa@SiO2-C24.21.55706.63378.40.1114.18
FeZn@SiO2-C25.305516.11548.50.1444.19
FeZnNa1.5@SiO2-C23.71.55766.8219.20.0354.46
FeZnNa3.1@SiO2-C23.53.15967.12316.40.0352.95
FeZnNa6.4@SiO2-C22.16.45767.31620.50.0472.95
FeZnNa7.6@SiO2-C23.47.65686.81814.60.0352.95
a Measured by XRF; b Based on total CO chemisorbed (corrected), n C O / n F e = 0.5 , % dispersion = 2 × n t o t a l   C O   c h e m i s o r b e d / n t o t a l   n u m b e r   o f   F e   a t o m s ; c Measured with the Scherrer equation by XRD; d Measured by N2 physical adsorption.
Table 2. CO2 uptake feature of the FeZnNax@SiO2-C catalysts with different Na doping.
CatalystsThe Amount of CO2 Desorbed (μmol/g)
α Peakβ Peakγ PeakTotal
FeZnNa1.5@SiO2-C58.560.4396.4515.3
FeZnNa3.1@SiO2-C36.691.3446.0573.9
FeZnNa6.4@SiO2-C51.4128.6576.7756.6
FeZnNa7.6@SiO2-C295.443.1621.7960.2
Table 3. Comparison of CO2 hydrogenation Catalytic Performances: STY, selectivity of CH4, C2-C4 olefins ( C 2 = C 4 = ), C2-C4 paraffins ( C 2 0 C 4 0 ) and C5+.
CatalystCO2
Con (%)
Selectivity a (%)O/P bTOF c
(10−3 s−1)
STY
(g/gcat·h)
CH4 C 2 = C 4 = C 2 = C 4 = C 5 +
Fe@SiO2-C52.1783.065.935.595.451.060.560.0057
FeZn@SiO2-C53.7864.321.5430.873.290.050.120.0015
FeNa@SiO2-C52.2666.566.4820.238.330.320.530.0090
FeZnNa1.5@SiO2-C58.4122.8929.1514.5033.422.012.530.0315
FeZnNa3.1@SiO2-C59.0333.0029.4013.6723.832.152.490.0321
FeZnNa6.4@SiO2-C58.3218.3040.409.6031.694.213.500.0436
FeZnNa7.6@SiO2-C58.418.6341.078.6831.724.733.610.0400
Reaction condition: T = 300 °C, P = 2.5 MPa, H2/CO2 = 3, GHSV = 1500 mL/g·h, TOS = 100 h; Reduced in 5% H2/Ar for 16 h at 400 °C before CO2 hydrogenation. a Hydrocarbon selectivity was normalized with the exception of CO. b O/P is the molar ratio of olefin ( C 2 = C 4 = ) to paraffin ( C 2 0 C 4 0 ). c TOF: turnover frequencies for CO2 conversion, i.e., the number of CO2 molecules converted per surface catalytic site per second at present CO2 hydrogenation.
Disclaimer/Publisher’s Note: The statements, opinions and data contained in all publications are solely those of the individual author(s) and contributor(s) and not of MDPI and/or the editor(s). MDPI and/or the editor(s) disclaim responsibility for any injury to people or property resulting from any ideas, methods, instructions or products referred to in the content.

