Article

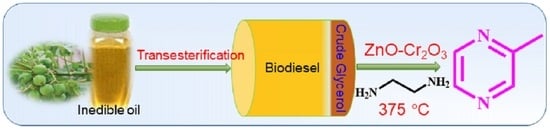
Synthesis of 2-Methylpyrazine Using Crude Glycerol over Zn-Cr-O Catalyst: A Value Addition Process for the Utilization of Biodiesel By-Product

1
Catalysis and Fine Chemicals Division, CSIR—Indian Institute of Chemical Technology, Tarnaka, Hyderabad 500 007, TS, India
2
Department of Chemistry, University College of Science, Osmania University, Hyderabad 500 007, TS, India
*
Authors to whom correspondence should be addressed.
Catalysts 2023, 13(2), 318; https://doi.org/10.3390/catal13020318
Submission received: 30 October 2022 / Revised: 27 January 2023 / Accepted: 29 January 2023 / Published: 1 February 2023

Abstract

:
Mixed oxides of ZnO and Cr2O3 with varied mole ratios were synthesized, characterized, and evaluated for the dehydrocyclization of crude glycerol for the production of 2-methylpyrazine (2-MP). The Zn-Cr-O composition was optimized using the bulk and surface properties of the catalysts rationalized by BET-SA, XRD, XPS, H2-TPR, O2 pulse chemisorption, and Raman spectroscopic techniques to achieve a high rate of 2-MP.

Graphical Abstract

1. Introduction

The development of alternate clean fuels from renewable resources is a difficult task, particularly using inedible raw materials. One of the identified paths was biodiesel with known limitations due to the inevitable formation of glycerol in about 10–20 wt% in H2O [1]. The safe disposal of such glycerol into economically attractive routes is crucial, not only from an atom economy point of view but also for further handling and utilization of by-products [2]. Glycerol is a valuable chemical while it is in pure form for fine chemical synthesis, whereas conversion of crude glycerol obtained during the biodiesel process that contains H2O and other impurities remains a challenge [3]. Several methods were reported on the conversion of crude glycerol to highly value-added chemicals and fuel additives. Synthesis of 2-methylpyrazine (2-MP) and 2,6-dimethylpyrazine (2,6-DMP) using crude glycerol became prominent due to their wide range of applications, both from the fertilizer and nutrition industry [4]. Our group has established the protocols on the synthesis of 2-MP and 2,6-DMP over metal chromite catalysts which were identified as suitable catalysts for the vapor phase dehydrocyclization of crude glycerol and ethylene diamine (EDA) and/or 1,2-propylenediamine (1,2-PDA) [5]. The conventional method for 2-MP synthesis involves cyclocondensation of EDA and 1,2-propanediol (1,2-PDO) over Pd-modified ZnCr2O4 catalyst [6]. Cyclocondensation of these substrates proceeds on surface acid sites and subsequent dehydrogenation reaction is facilitated on surface basic sites present on the solid oxide or mixed metal oxide catalyst. Determination of the surface active sites which govern the activity and product selectivity is crucial in the development of catalytic process, especially when solid acid–base catalysts are employed [7]. It has been established that the formation of alkylpyrazines occurs through dehydrocyclization reaction that proceeds via cyclocondensation of diamines, and diols followed by dehydrogenation of hetero-aromatic ring thus produce substituted hetero-alkyl aromatic compounds [8,9]. In the present work, detailed investigations were performed on ZnO (a basic nature) and an acidic catalyst, i.e., Cr2O3, by varying the mole ratios of these metal oxides for the dehydrocyclization of crude glycerol and EDA. The role of ZnO, Cr2O3, and Zn-Cr-O (mixed oxide) on the dehydrocyclization activity and product selectivity also explained by Zn-Cr-O obtained through different preparation methods and the physicochemical properties of the catalysts was determined by BET—surface area, powder XRD, FT-IR, H2-TPR, UV-DRS, O2 pulse chemisorption, Raman Spectroscopy, XPS, DT/TGA, and CHNS analyses. Finally, the catalyst composition was optimized for higher rate of 2-methylpyrazine, which is an anti-TB drug intermediate.

2. Results and Discussion

2.1. Catalysts with Different Zn/Cr Mole Ratio

2.1.1. XRD Analysis and BET Surface Area of Zn-Cr Samples

XRD patterns of the oven-dried samples with different mole ratios of Zn:Cr are shown in Figure 1A (d,e), which indicated a hydrotalcite-like structure with polytypism 3R [10]. Among these the diffraction lines with basal planes, i.e., d (003) ~ 2d (006) ~ 3d (009) for samples Zn3Cr1 and Zn2Cr1 reveals highly packed stacks of brucite-like layers (Figure 1A (b,c)). In contrast, such planes were absent in Figure 1A (a,f,g) [11,12]. This is obviously due to the absence of the required amount of Zn2+ and Cr3+ to form the HT structure.
The diffraction patterns of the calcined samples are presented in Figure 1B. The Zn4Cr1 show peaks due to the ZnO phase only (ICDD # 89-0510). As the Zn/Cr ratio decreased, intensity of peaks due to ZnO phase also decreased and finally disappeared at a Zn:Cr ratio of 0.5 (Zn1Cr2). The sample with Zn3Cr1exhibited minor peaks due to ZnCr2O4 phase (ICDD # 22-1107), along with the ZnO phase. The Zn2Cr1 and Zn1Cr1 exhibited both ZnO and ZnCr2O4 phases predominantly [6]. A sample with 1:2 mole ratio (Zn1Cr2) showed only the distinct ZnCr2O4 phase [13].
At a higher Cr ratio, the Zn1Cr3 has shown peaks due to ZnCr2O4(major), along with the Cr2O3 phase in minor intensity (ICDD # 85-0730), whereas Zn1Cr4 showed diffraction peaks due to the Cr2O3 phase alone. The average crystallite size of ZnO, Cr2O3, and ZnCr2O4 was measured using the Scherrer formula, and the data are reported in Table 1. It was observed that samples with a higher crystallite size and multiple phases possessed a lower BET-surface area than the samples with a smaller crystallite size, which showed one phase.

2.1.2. FT-IR Analysis of Calcined Zn-Cr Samples

FT-IR spectra of the samples with different mole ratio of zinc and chromium are presented in Figure 2. The structure of Cr2O3 is a hexagonal close packed array of O atoms in which Cr3+ ions occupy two-thirds of the octahedral holes with the symmetry of rhombohedral [14]. The bands at 933 cm−1 and 770 cm−1 are the characteristic vibrational modes of symmetric CrO6 octahedra of Cr2O3 [15]. These bands around 930 cm−1 and 770 cm−1 are more intense in catalysts with a higher concentration of chromium viz., Zn1Cr4, Zn1Cr3, and Zn1Cr2. The strongest bands at 623 and 506 cm−1 are characteristic bands of chromium oxide with chromium in 3+ valence (Cr2O3) [16,17,18]. These bands arise due to various combinations of O2− and Cr3+ displacements in the lattice. In samples that have a high zinc content, i.e., Zn3Cr1 and Zn4Cr1, one band is recorded around 437 cm−1, which is a diagnostic band of ZnO species [19,20], and the absence of this band in higher Cr-containing samples can be explained due to ZnO interacting with Cr2O3.
It is clearly evident that a band around 1122 cm−1 is recorded only in the samples that have a higher zinc ratio than the chromium. The bands at 943 cm−1 are characteristic of the vibrations of CrO4 tetrahedra due to Cr6+ ions [21]. Figure 2 shows the presence of Cr6+ species in fresh calcined Zn–Cr samples, and its intensity is low at a high ratio of Zn. The intensity of band at 943 cm−1 was high, with the samples containing a high ratio of Cr (Figure 2 (e–g)). A decrease in peak intensity of the band up to Zn2Cr1 (ascribed to Cr6+ species) and a steady increase up to Zn1Cr4 was explained by segregated Cr6+ species. However, XRD analysis did not show the peaks due to chromate species, which is presumably due to the smaller crystallite size of chromate species. The vibrational band at 627 cm−1 in all the samples is due to ν1 mode, and a broad signal at 504 cm−1 is due to mode ν2, which corresponds to the vibrations of ZnO4 tetrahedra and octahedra of complexes of trivalent chromium atom with oxygen assigned to ZnCr2O4 spinel [21]. These results are in good agreement with earlier reports on the surface chromate formation of Zn-Cr-O [22].

2.1.3. H2-TPR and O2 Pulse Chemisorption Results of Zn-Cr Samples

TPR patterns of Zn/Cr (varied mole ratio) samples are presented in Figure 3, and the H2 uptakes are reported in Table 1. The major reduction peak found in the TPR patterns is due to chromium oxide species’ reduction to a lower oxidation state. The final oxidation state of chromium in the reduction process with hydrogen is Cr3+, under the experimental conditions adopted [23]. It can be seen from TPR profiles that, with an increase in Cr loading, the Tmax shifted towards higher temperatures. These patterns suggest that upon increasing the Cr content; chromium species become hard to reduce, which is explained due to a strong interaction of chromium with zinc oxide.
Typically, the reduction of well-crystallized ZnO takes place at very high temperatures (>800 °C). In this study, the ZnO is formed after thermal decomposition of hydrotalcite precursor during calcination; it has high concentration of defects due to which a fraction of Zn2+ could be reduced at lower temperatures than expected [24]. The second peak that appeared in TPR patterns of Zn4Cr1 and Zn3Cr1, located around 550 °C, could be because of partial reduction of ZnO [3]. A higher hydrogen uptake was observed over Zn2Cr1, Zn1Cr1, and Zn1Cr2 samples. The temperature maximum shifted towards the higher side as the chromium content in the sample increased, due to changes in the Cr6+ polymerization degree [25].
The O2 uptakes measured by pulse chemisorption at 335 °C are presented in Table 1. The results show that O2 uptake increased with an increase in Cr ratio up to Zn:Cr = 1:2 with 68.3 µmol (gcat)−1. A further increase in Cr content led to a fall in O2 uptake, even at a ratio of Zn:Cr = 1:4. The Zn rich samples showed low O2 uptakes compared the samples containing high Cr contents, due to a low re-oxidation nature of the reduced ZnO surface. The reasons for measuring the O2 uptakes are as follows. (1) Chromium exists in multiple oxidation states, one of which is Cr6+ and is water-soluble. Since the reaction substrate contains a large amount of H2O, there could be a possibility of catalyst leaching. To avoid this, we have pre-reduced the catalyst to completely reduce the Cr6+ (if any traceable are present in the sample) to Cr3+, which is H2O insoluble and highly stable. However, we did not find any catalyst leaching during the course of the reaction. To understand the reversible oxygen of the catalyst surface which contains CUS (coordinatively unsaturated sites), we measured the O2 uptakes. (2) Generally, hopping of the electron is quite possible in chromium oxide crystal, as it is a small polaron semi-conductor. Consequently, the surface oxygen/CUS ratios may be varied.

2.1.4. UV-DRS Analysis of Zn-Cr Samples

The UV-DR spectroscopy has proven to be a useful technique for the estimation of the presence of Cr6+ and Cr3+ species in Zn-Cr catalysts [25]. UV-DR spectra of different molar ratio of Zn/Cr samples are presented in Figure S1. The Zn4Cr1 and Zn3Cr1 samples showed a broad absorption band near 280 nm along with 390 nm, which correspond to nano-sized ZnO particles (Table 1) [26]. The broad absorption band in the region 330–360 nm appeared in Zn1Cr1, Zn1Cr2, and Zn2Cr1, and is due to charge transfer transitions of chromate species [25,27,28]. The presence of chromite species in the sample Zn1Cr4 is confirmed by a broad absorption band located at 540 nm that is due to d–d transitions of Cr3+ (A2g → T2g) in octahedral symmetry [3,25,26,27,28,29]. This fact is also confirmed by TPR studies, as the hydrogen uptakes are very low over Zn1Cr3 and Zn1Cr4 samples because of the stable nature of chromite species.

2.1.5. X-ray Photoelectron Spectroscopic Studies of Zn-Cr Samples

The XP spectra of different mole ratio of Zn/Cr samples are presented in Figure 4. The binding energy (BE) of 575 to 581 eV falls in the Cr 2p region. The BE values that appeared in the range 576.4–576.9 eV correspond to Cr3+ and in-between 579.1–579.6 eV to Cr6+ species present at the near-surface region [30,31,32,33,34,35]. Signals seen in the range 576.1 to 576.6 eV were observed up to the Zn1Cr2 sample (Figure 4 (a–e)). Samples at high Cr content, i.e., Zn1Cr3 and Zn1Cr4, have shown BE at 577.2 and 577.9 eV corresponding to Cr 2p3/2. These chromium signals might have arisen due to high chromium loading and due to the intrinsic complexity of Cr3+ component [33,34,36]. The BE in the range 1022 to 1044 eV (Figure 4) represents Zn 2p3/2 and Zn 2p1/2, respectively. The BE values of 1021.5 to 1022.2 eV are characteristic signals of ZnO and ZnCr2O4, respectively [37,38]. As the Cr loadings are increased, there is shift in binding energies of Zn 2p1/2 to lower values, from 1022.3 eV (Zn4Cr1) to 1021.1 eV (Zn1Cr4). The O 1s lines in the region 529.8 to 532.8 eV are attributed to signal contributions from multiple oxygen-containing species in the near-surface region. Upon increasing the Cr content, the spectra clearly showed a shift in (Cr 2p) towards higher BE; Zn 2p towards lower BE and the O 1s at higher BE values, exemplifying that the surface species become hard to reduce at higher loadings of chromium. Although the H2-TPR technique is a bulk analysis, the structural characteristics of the catalysts in bulk are generally expected to be more or less similar at the near-surface region. Therefore, the Tmax of these catalysts has increased with an increase in chromium ratio (Figure 3). Further, these results are in good agreement with the O2 pulse chemisorption data (Table 1).

2.1.6. DTA-TGA Analysis of Zn-Cr Samples

TG patterns of different Zn/Cr mole ratio samples are shown in Figure S2A. It can be seen that there are no phase transitions above 400 °C. The samples with Zn3Cr1 and Zn2Cr1 exhibited hydrotalcite structure. Hydrotalcite-type materials decompose in three successive steps, resulting in endothermic peaks in the DTA pattern and plateaus in the TGA diagram. The first endothermic peak is due to the removal of weakly adsorbed water molecules present on the external surface of the particles [39]. The next stage starts instantly after this step and remains up to 250 °C. This peak is possibly due to the removal of water of crystallization accompanied with dehydroxylation of the hydroxyl groups from a brucite-like layered structure (Figure S2B). The last stage starts with the end of the second stage, producing an endothermic peak at 320 °C in the DTA pattern, and this stage stops at 455 °C due to loss of carbonate removal from the interstitial region [12,40]. Figure S2A clearly demonstrates approximately 30% of the weight loss. It is also observed that ZnO, Cr2O3, and ZnCr2O4 mixed metal oxides were obtained after calcination, and these phases were identified from XRD analysis (Figure 1).

2.1.7. Catalytic Activity Measurements

The dehydrocyclization of aqueous glycerol and EDA was carried out at 375 °C, over Zn-Cr-O samples prepared by varying Zn/Cr mole ratios, and the product distribution is reported in Figure 5. At a high ratio of Zn, the Zn4Cr1 catalyst showed about 51.8% conversion of EDA and 61% glycerol, while the Zn1Cr4 demonstrated EDA ~32.9% and glycerol at 12.2%. At lower Zn concentration, poor conversions of EDA and glycerol were noticed. The catalyst with Zn3Cr1 showed 45% glycerol and 65% EDA conversion, while the bulk individual oxides such as ZnO and Cr2O3 showed r2-MP ~0.94 × 10⁻³ and 0.061 mol s−1 (gcat)−1, respectively, which is inferior to the activity of mixed oxides of Zn-Cr catalysts [3].
The Zn2Cr1 sample demonstrated 89% conversion of EDA and 84% conversion of glycerol. An equimolar concentration of Zn1Cr1 has given comparably good results, with 86% conversion of EDA and 81% of glycerol. At higher chromium loadings, conversion of EDA and glycerol are decreased. Both Zn2Cr1 and Zn1Cr1 catalysts exhibited better rates of formation of 2MP with 1.81 and 1.85 mmol s−1 g−1, respectively, with a reasonably lower amount of pyrazine as a co-product.
The TPD of NH3 and CO2 analysis is performed for the best catalyst system, i.e., Zn:Cr mole ratio = 1, and the results are reported in Figure 6. The TPD results revealed that about 685 μmol g−1 of CO2 and 98 μmol g−1 of NH3 uptake was observed. These results further indicate that there was a high proportion of basic sites compared to the acid sites present on the catalyst surface, which is in good agreement with our previous studies for the synthesis of alkylpyrazines using crude glycerol over Zn-Cr-O catalysts [3,4,5]. Based on these results, it can be summarized that the HT precursors of Zn-Cr (with Zn/Cr = 0.25 to 4) were transformed to ZnO, ZnCr2O4, and Cr2O3 species depending on the loadings, as was observed from XRD analysis of the calcined samples. The synergetic interaction between Zn and Cr species led to the formation of ZnCr2O4, which is present in all the samples and seems to be an active phase for the dehydrocyclization of glycerol and ethylenediamine. A high ratio of pyrazine was found at low Zn/Cr ratio. These catalysts performed better selectivity towards 2-MP, up to a Zn/Cr ratio of 0.5. It has been established that strong basic sites in conjunction with mild acid sites are desirable for the dehydrocyclization reaction [9]. In the comparative analysis, a higher basicity was observed than the surface acidity of the Zn1Cr1 catalyst. The O 1s spectra of these catalysts exhibited a shift towards lower BE up to a Zn/Cr ratio of 1. With a further increase in Cr loading, the binding energies have also increased. The normalized O2 uptake data (Table 1, w.r.t the corresponding specific surface areas of the catalysts) indicated an optimum value of about 1.05 μmol m−2 observed over the Zn1Cr1 catalyst that showed the highest 2-MP yield.

3. Materials and Methods

3.1. Catalyst Preparation

Preparation of Zn-Cr Samples with Varied Zn/Cr Mole Ratios

A series of catalysts with varying Zn and Cr mole ratio were prepared by the co-precipitation method. In a typical method that required amounts of mixture of aqueous Zn(NO3)2 6H2O and Cr(NO3)3 9H2O, the solution was precipitated at a constant pH of 9 using a mixture of 2M NaOH + 1M Na2CO3 as the precipitating agent. The gels were washed thoroughly, filtered, and oven-dried for 12 h at 120 °C before being calcined in static air for 5 h at 450 °C. Catalysts thus prepared with Zn:Cr mole ratio of 4, 3, 2, 1, 0.5, 0.33, and 0.25 were labelled as Zn4Cr1, Zn3Cr1, Zn2Cr1, Zn1Cr1, Zn1Cr2, Zn1Cr3, and Zn1Cr4, respectively.

3.2. Catalyst Characterization

The surface areas of the samples were measured by N2 adsorption at −196 °C in an Autosorb 3000 physical adsorption apparatus. The specific surface areas were calculated by applying the BET method. The O2 pulse chemisorption measurements were done using 5.01% O2 (balance He) at 335 °C. Prior to O2 pulse chemisorption, the samples were reduced in 5%H2/Ar at 400 °C for 5 h at a ramping rate of 10 °C min−1, followed by flushing with helium at 400 °C for 1 h, after which the temperature was reduced to 335 °C and regular pulses were given using a sample loop volume of 0.5 mL connected to a six way auto sampling valve interfaced to GC-TCD. For TPR analysis, approximately 0.150 g of the catalyst sample was loaded in an isothermal zone of a quartz reactor (i.d = 6 mm, length = 300 mm) and heated by an electric furnace at a rate of 10 °C min−1 to 300 °C in helium gas flow at a rate of 30 mL min−1 to facilitate the desorption of physically adsorbed water. After degassing, the sample was cooled to room temperature, the helium gas was switched with 30 mL min−1 of reducing gas (5% H2 in argon), and the temperature was increased to 700 °C at a ramping rate of 5 °C min−1. Hydrogen consumption was measured by analyzing effluent gas using a calibration curve of Ag2O TPR under a similar protocol, and the steam formed during reduction process was removed by a molecular sieve trap. The UV-DR spectra were measured on a UV-2000, Shimadzu spectrometer equipped using a diffuse reflectance attachment using an integrating sphere consisting of the BaSO4 as a reference standard. Thermo gravimetric analysis (TGA) and differential thermal analysis (DTA) were used to study the stability of solids with respect to temperature changes recorded using a Leeds and Northup (USA) unit at a heating rate of 10 °C min−1, ranging 20–800 °C under nitrogen flow. The catalysts were characterized by powder XRD analysis using a Rigaku Miniflex X-ray diffractometer using Ni filtered Cu Kα radiation (λ = 0.15406 nm) from 2θ = 20 to 80°, at a scan rate of 2° min−1 with generator voltage and current of 30 kV and 15 mA, respectively. The XPS patterns were recorded using a Kratos Axis Ultra Imaging X-ray photoelectron spectrometer, equipped with Mg anode and a multichannel detector. Charge referencing was done against adventitious carbon (C 1s, 284.8 eV). A Shirley-type background was subtracted from the signals. The recorded spectra were fitted using Gauss–Lorentz curves to determine the binding energies of the different elements. The Raman spectra for the structural characterization of Zn-Cr-O catalysts were acquired with a Horiba Jobin-Yvon lab ram HR spectrometer using a laser beam excitation of λ = 632.81 nm. The Fourier transformed infrared spectra were recorded in KBr pellets using a Thermo Nicolet Nexus 670 spectrometer in the region of 4000–400 cm−1. FT-IR spectra were recorded for air-calcined samples at 450 °C/5 h, which were designated as fresh, reduced (calcined in air at 450 °C/5 h followed by reductive pre-treatment in 5%H2/Ar at 400 °C/5 h) samples. The carbon contents in used catalysts (recovered after 6 h of continuous operation) were measured using a VARIO EL, CHNS analyzer.

3.3. Catalyst Activity Testing

The dehydrocyclization activities were carried out using −18/+23 sieved (BSS) catalyst particles. The carbon mass balance was done based on the inlet and outlet concentration of the organic moiety. In a typical reaction prior to the reaction, about 0.2 g of calcined catalyst (sieved particles −18/+25 BSS) was reduced in 5% H2 balance Ar at 400 °C for 5 h. A 20 wt.% aqueous glycerol solution was used with the glycerol to EDA mole ratio of 1:1 and flow rate of the reaction mixture of 5 mL h−1 in N2 as carrier (GHSV = 9.37 mL (gcat)−1 s−1). The samples were collected after 6 h of continuous operation at each temperature and analyzed by gas chromatograph (Shimadzu, GC-17A, Japan) equipped with flame ionization detector (FID) using ZB-5 capillary column at a ramping rate of 10 °C min−1 from 60 to 280 °C.
The samples were analyzed by GC-MS (QP5050A Shimadzu) using a ZB-5 capillary column with EI mode. The mass spectra confirmed the product distribution and the corresponding m/z values for 2-methylpyrazine: M+. m/z: 94, (M-HCN)+. m/z: 67, (M-CH3CN)+. m/z: 53, (M-C3H4N)+ m/z: 40; pyrazine: M+. m/z: 80, (MHCN)+. m/z: 53; EDA: (M-H)+ m/z: 59, (M-NH3)+. m/z: 43; glycerol: (M-CH2OH)+ m/z: 61; {M-(CH2OH, H2O)}+ m/z: 43; 2,5-dimethylpyrazine: M+. m/z: 108; (MCH3)+ m/z: 93; (M-HCN)+. m/z: 81; (M-CH3CN)+. m/z: 67; (M-C3H6N)+ m/z: 52; (M-C4H4N)+ m/z: 42; pyrazinealdehyde: M+. m/z: 108; (M-H)+ m/z: 107; (M-CO)+. m/z: 80; (M-C2N2)+. m/z: 56; {M-(H,CO,C2H2)}+ m/z: 53; and 2,3-dimethylpyrazine: M+. m/z: 108; (M-CH3CN)+. m/z: 67; (M-C4H6N)+ m/z: 40. The 2-methylpyrazine was isolated and analyzed by 1H NMR spectra, which revealed 1H NMR (CDCl3, 200 MHz): δ = 8.32–8.5 (m, 3H); 2.56 (s, 3H), attributed to 2-methylpyrazine.
%Conversion of EDA = [molesEDAin − molesEDAout/molesEDAin] × 100
%Conversion of Glycerol = [molesGly.in − molesGly.out/molesGly.in] × 100
Yield2MP = [Conv.Glycerol × Sel.2MP]/100
Yield2-pyrazinylmethanol = [Conv.Glycerol × Sel.2-pyrazinylmethanol]/100
Rate2MP = [(Yield2MP) × (EDA + Glycerol) flow rate/wt. of Cat.]

4. Conclusions

Bulk and surface properties of the catalysts suggested that a combination of both ZnO and Cr2O3 was required for dehydrocyclization of ethylenediamine and glycerol. Zn-Cr prepared by co-precipitation method was suitable to obtain better dehydrocyclization activity to attain a high rate of 2-MP. Upon varying the mole ratio of Zn:Cr, the product distribution tremendously changed. Catalysts containing a zinc to chromium ratio of 1:1 showed a higher rate of 2-methylpyrazine than the rest of Zn-Cr catalysts.

Supplementary Materials

The following supporting information can be downloaded at: https://www.mdpi.com/article/10.3390/catal13020318/s1, Figure S1: UV-DR spectra of (a) Zn4Cr1, (b) Zn3Cr1, (c) Zn2Cr1, (d) Zn1Cr1, (e) Zn1Cr2, (f) Zn1Cr3 and (g) Zn1Cr4 samples; Figure S2: (A) TGA and (B) DTA patterns of Zn/Cr with varied mole ratio (a) Zn4Cr1, (b) Zn3Cr1, (c) Zn2Cr1, (d) Zn1Cr1, (e) Zn1Cr2, (f) Zn1Cr3 and (g) Zn1Cr4 samples.

Author Contributions

R.S.: Catalysts synthesis and Activity Studies; K.K.M.: H2-TPR analysis; S.M.: Data Curation; K.R.: Formal Analysis; H.P.A.: Conceptualization and interpretation of results; V.A.: Planning, execution, writing manuscript and PhD supervisor to Reema Sarkari. All authors have read and agreed to the published version of the manuscript.

Funding

This research received no external funding.

Data Availability Statement

Required data is available in supplementary material.

Acknowledgments

AV thanks DST, New Delhi for the funding under India-Poland program DST/INT/Pol/P-31/2016. All the authors thank Director CSIR-IICT for constant help and support. CSIR-IICT Communication number IICT/Pubs./2022/318.

Conflicts of Interest

The authors declare no conflict of interest.

References

  1. Parate, R.; Mane, R.; Dharne, M.; Rode, C. Mixed bacterial culture mediated direct conversion of bio-glycerol to diols. Bioresour. Technol. 2018, 250, 86–93. [Google Scholar] [CrossRef] [PubMed]
  2. Pereira, E.B.; Ramírez de la Piscina, P.; Homs, N. Efficient hydrogen production from ethanol and glycerol by vapour-phase reforming processes with new cobalt-based catalysts. Bioresour. Technol. 2011, 102, 3419–3423. [Google Scholar] [CrossRef] [PubMed]
  3. Akula, V.; Sarkari, R.; Chatla, A.; Vankudoth, K.; Mandari, K.K. Synthesize 2-methylpyrazine using aqueous glycerol and ethylenediamine over zinc oxide–zinc chromite catalysts: Structure–activity relationship. Appl. Catal. A Gen. 2012, 441–442, 108–118. [Google Scholar] [CrossRef]
  4. Krishna, V.; Kumar, S.N.; Reema, S.; Padmasri, A.H.; Chary, K.V.R.; Venugopal, A. Bio-glycerol utilization: Synthesis of 2,6-dimethylpyrazine over MxOy–MCr2O4 (M = Mg, Fe, Co, Ni, Cu and Zn) catalysts. Appl. Catal. A Gen. 2014, 488, 275–284. [Google Scholar] [CrossRef]
  5. Krishna, V.; Naresh, G.; Kumar, V.V.; Sarkari, R.; Padmasri, A.H.; Venugopal, A. Synthesis of 2,6-dimethylpyrazine by dehydrocyclization of aqueous glycerol and 1,2-propanediamine over CuCrO catalyst: Rationalization of active sites by pyridine and formic acid adsorbed IR studies. Appl. Catal. B Environ. 2016, 193, 58–66. [Google Scholar] [CrossRef]
  6. Forni, L. Structural analysis of ZnO/ZnCr2O4/Pd catalyst. J. Catal. 1988, 111, 199–209. [Google Scholar] [CrossRef]
  7. Vankudoth, K.; Gutta, N.; Velisoju, V.K.; Mutyala, S.; Aytam, H.P.; Akula, V. CuCr2O4 derived by the sol-gel method as a highly active and selective catalyst for the conversion of glycerol to 2,6-dimethylpyrazine: A benign and eco-friendly process. Catal. Sci. Technol. 2017, 7, 3399–3407. [Google Scholar] [CrossRef]
  8. Rani, V.R.; Srinivas, N.; Kishan, M.R.; Kulkarni, S.; Raghavan, K.V. Zeolite-catalyzed cyclocondensation reaction for the selective synthesis of 3,4-dihydropyrimidin-2(1H)-ones. Green Chem. 2001, 3, 305–306. [Google Scholar] [CrossRef]
  9. Vankudoth, K.; Padmasri, A.H.; Sarkari, R.; Velisoju, V.K.; Gutta, N.; Sathu, N.K.; Rohita, C.N.; Akula, V. The role of Lewis acid-base pair sites in ZnO-ZnCr2O4 catalysts for cyclization: Via dehydrogenative condensation of crude glycerol and 1,2-propanediamine for the synthesis of 2,6-dimethylpyrazine. New J. Chem. 2017, 41, 9875–9883. [Google Scholar] [CrossRef]
  10. Sarkari, R.; Anjaneyulu, C.; Krishna, V.; Kishore, R.; Sudhakar, M.; Venugopal, A. Vapor phase synthesis of methylpyrazine using aqueous glycerol and ethylenediamine over ZnCr2O4 catalyst: Elucidation of reaction mechanism. Catal. Commun. 2011, 12, 1067–1070. [Google Scholar] [CrossRef]
  11. Rojas Delgado, R.; Arandigoyen Vidaurre, M.; De Pauli, C.P.; Ulibarri, M.A.; Avena, M.J. Surface-charging behavior of Zn-Cr layered double hydroxide. J. Colloid Interface Sci. 2004, 280, 431–441. [Google Scholar] [CrossRef] [PubMed]
  12. del Arco, M.; Rives, V.; Trujillano, R.; Malet, P. Thermal behaviour of Zn–Cr layered double hydroxides with hydrotalcite-like structures containing carbonate or decavanadate. J. Mater. Chem. 1996, 6, 1419–1428. [Google Scholar] [CrossRef]
  13. Simard, F.; Sedran, U.A.; Sepúlveda, J.; Fígoli, N.S.; de Lasa, H.I. ZnO Cr2O3 + ZSM-5 catalyst with very low Zn/Cr ratio for the transformation of synthesis gas to hydrocarbons. Appl. Catal. A Gen. 1995, 125, 81–98. [Google Scholar] [CrossRef]
  14. Dhas, N.A.; Koltypin, Y.; Gedanken, A. Sonochemical Preparation and Characterization of Ultrafine Chromium Oxide and Manganese Oxide Powders. Chem. Mater. 1997, 9, 3159–3163. [Google Scholar] [CrossRef]
  15. Murakami, Y.; Sawata, A.; Tsuru, Y. Crystallization behavior of amorphous solid solutions and phase separation in the Cr2O3-Fe2O3 system. J. Mater. Sci. 1999, 34, 951–955. [Google Scholar] [CrossRef]
  16. Cheng, R.; Borca, C.N.; Dowben, P.A.; Stadler, S.; Idzerda, Y.U. Potential phase control of chromium oxide thin films prepared by laser-initiated organometallic chemical vapor deposition. Appl. Phys. Lett. 2001, 78, 521–523. [Google Scholar] [CrossRef]
  17. Steger, W.E.; Landmesser, H.; Boettcher, U.; Schubert, E. Infrared spectra of amorphous oxides. J. Mol. Struct. 1990, 217, 341–346. [Google Scholar] [CrossRef]
  18. Carta, G.; Natali, M.; Rossetto, G.; Zanella, P.; Salmaso, G.; Restello, S.; Rigato, V.; Kaciulis, S.; Mezzi, A. A comparative study of Cr2O3 thin films obtained by MOCVD using three different precursors. Chem. Vap. Depos. 2005, 11, 375–380. [Google Scholar] [CrossRef]
  19. Menon, R.; Gupta, V.; Tan, H.H.; Sreenivas, K.; Jagadish, C. Origin of stress in radio frequency magnetron sputtered zinc oxide thin films. J. Appl. Phys. 2011, 109, 064905. [Google Scholar] [CrossRef]
  20. Ashkenov, N.; Mbenkum, B.N.; Bundesmann, C.; Riede, V.; Lorenz, M.; Spemann, D.; Kaidashev, E.M.; Kasic, A.; Schubert, M.; Grundmann, M.; et al. Infrared dielectric functions and phonon modes of high-quality ZnO films. J. Appl. Phys. 2002, 93, 126–133. [Google Scholar] [CrossRef]
  21. Itina, G.V.; Davydov, A.A.; Osipova, M.A.; Kurina, L.N. Promoting effect of potassium on catalytic and surface properties and phase commposition of catalysts for synthesis of alcohols. React. Kinet. Catal. Lett. 1991, 45, 243–249. [Google Scholar] [CrossRef]
  22. Venugopal, A.; Sarkari, R.; Anjaneyulu, C.; Krishna, V.; Kumar, M.K.; Narender, N.; Padmasri, A.H. Influence of acid-base sites on ZnO–ZnCr2O4 catalyst during dehydrocyclization of aqueous glycerol and ethylenediamine for the synthesis of 2-methylpyrazine: Kinetic and mechanism studies. Appl. Catal. A Gen. 2014, 469, 398–409. [Google Scholar] [CrossRef]
  23. Gaspar, A.B.; Brito, J.L.F.; Dieguez, L.C. Characterization of chromium species in catalysts for dehydrogenation and polymerization. J. Mol. Catal. A Chem. 2003, 203, 251–266. [Google Scholar] [CrossRef]
  24. Park, S.W.; Joo, O.S.; Jung, K.D.; Kim, H.; Han, S.H. Development of ZnO/Al2O3 catalyst for reverse-water-gas-shift reaction of CAMERE (carbon dioxide hydrogenation to form methanol via a reverse-water-gas-shift reaction) process. Appl. Catal. A Gen. 2001, 211, 81–90. [Google Scholar] [CrossRef]
  25. Michorczyk, P.; Ogonowski, J.; Zeńczak, K. Activity of chromium oxide deposited on different silica supports in the dehydrogenation of propane with CO2—A comparative study. J. Mol. Catal. A Chem. 2011, 349, 185–192. [Google Scholar] [CrossRef]
  26. Dhakshinamoorthy, A.; Visuvamithiran, P.; Tharmaraj, V.; Pitchumani, K. Clay encapsulated ZnO nanoparticles as efficient catalysts for N-benzylation of amines. Catal. Commun. 2011, 16, 15–19. [Google Scholar] [CrossRef]
  27. Weckhuysen, B.M.; Schoonheydt, R.A.; Jehng, J.-M.; Wachs, I.E.; Cho, S.J.; Ryoo, R.; Kijlstra, S.; Poels, E. Combined DRS–RS–EXAFS–XANES–TPR study of supported chromium catalysts. J. Chem. Soc. Faraday Trans. 1995, 91, 3245–3253. [Google Scholar] [CrossRef]
  28. Weckhuysen, B.M.; Verberckmoes, A.A.; De Baets, A.R.; Schoonheydt, R.A. Diffuse Reflectance Spectroscopy of Supported Chromium Oxide Catalysts: A Self-Modeling Mixture Analysis. J. Catal. 1997, 166, 160–171. [Google Scholar] [CrossRef]
  29. Rodrigues, S.; Ranjit, K.T.; Uma, S.; Martyanov, I.N.; Klabunde, K.J. Visible-light photooxidation of trichloroethylene by Cr–Al-MCM-41. J. Catal. 2005, 230, 158–165. [Google Scholar] [CrossRef]
  30. Allen, G.C.; Curtis, M.T.; Hooper, A.J.; Tucker, P.M. X-Ray photoelectron spectroscopy of chromium–oxygen systems. J. Chem. Soc. Dalt. Trans. 1973, 23, 1675–1683. [Google Scholar] [CrossRef]
  31. Allen, G.C.; Tucker, P.M. Multiplet splitting of X-ray photoelectron lines of chromium complexes. The effect of covalency on the 2p core level spin-orbit separation. Inorg. Chim. Acta 1976, 16, 41–45. [Google Scholar] [CrossRef]
  32. Cimino, A.; De Angelis, B.A.; Luchetti, A.; Minelli, G. The characterization of CrOxSiO2 catalysts by photoelectron spectroscopy (XPS), X-ray and optical measurements. J. Catal. 1976, 45, 316–325. [Google Scholar] [CrossRef]
  33. Yasuaki, O.; Masaki, F.; Toshinobu, I.; Shiichiro, T. X-Ray Photoelectron Spectroscopic Studies of Catalysts—Chromia–Alumina Catalysts. Bull. Chem. Soc. Jpn. 2006, 49, 859–863. [Google Scholar] [CrossRef]
  34. Jagannathan, K.; Srinivasan, A.; Rao, C.N.R. An XPS study of the surface oxidation states of metals in some oxide catalysts. J. Catal. 1981, 69, 418–427. [Google Scholar] [CrossRef]
  35. Best, S.A.; Squires, R.G.; Walton, R.A. The X-ray photoelectron spectra of heterogeneous catalysts: II. The chromia-silica catalyst system. J. Catal. 1977, 47, 292–299. [Google Scholar] [CrossRef]
  36. Grünert, W.; Feldhaus, R.; Anders, K.; Shpiro, E.S.; Antoshin, G.V.; Minachev, K.M. Reduction and aromatization activity of chromia-alumina catalysts: II. An XPS investigation of chromia-alumina catalysts. J. Catal. 1986, 100, 138–148. [Google Scholar] [CrossRef]
  37. Hoflund, G.B.; Epling, W.S.; Minahan, D.M. Reaction and surface characterization study of higher-alcohol synthesis catalysts XII: K- and Pd-promoted Zn/Cr/Mn spinel. Catal. Today 1999, 52, 99–109. [Google Scholar] [CrossRef]
  38. Parhi, P.; Manivannan, V. Microwave metathetic approach for the synthesis and characterization of ZnCr2O4. J. Eur. Ceram. Soc. 2008, 8, 1665–1670. [Google Scholar] [CrossRef]
  39. Venugopal, A.; Palgunadi, J.; Deog, J.K.; Joo, O.S.; Shin, C.H. Hydrotalcite derived Cu-Zn-Cr catalysts admixed with γ-Al2O3 for single step dimethyl ether synthesis from syngas: Influence of hydrothermal treatment. Catal. Today 2009, 147, 94–99. [Google Scholar] [CrossRef]
  40. Kloprogge, J.T.; Hickey, L.; Frost, R.L. The effect of varying synthesis conditions on zinc chromium hydrotalcite: A spectroscopic study. Mater. Chem. Phys. 2005, 89, 99–109. [Google Scholar] [CrossRef] [Green Version]
Figure 1. XRD patterns of (A) oven-dried and (B) calcined samples of different mole ratio (a) Zn4Cr1, (b) Zn3Cr1, (c) Zn2Cr1, (d) Zn1Cr1, (e) Zn1Cr2, (f) Zn1Cr3, and (g) Zn1Cr4.
Catalysts 13 00318 g001
Figure 2. FTIR patterns of (a) Zn4Cr1, (b) Zn3Cr1, (c) Zn2Cr1, (d) Zn1Cr1, (e) Zn1Cr2, (f) Zn1Cr3, and (g) Zn1Cr4 samples.
Catalysts 13 00318 g002
Figure 3. TPR patterns of different mole ratio of Zn/Cr (a) Zn4Cr1, (b) Zn3Cr1, (c) Zn2Cr1, (d) Zn1Cr1, (e) Zn1Cr2, (f) Zn1Cr3, and (g) Zn1Cr4.
Catalysts 13 00318 g003
Figure 4. X-ray photoelectron spectra of (a) Zn4Cr1, (b) Zn3Cr1, (c) Zn2Cr1, (d) Zn1Cr1, (e) Zn1Cr2, (f) Zn1Cr3, and (g) Zn1Cr4 samples.
Catalysts 13 00318 g004
Figure 5. Influence of different mole ratio on Zn-Cr catalysts in the dehydrocyclization of glycerol and EDA at 375 °C using a reaction mixture flow rate of 5 mL h−1, GHSV = 9.37 mL (gcat)−1 s−1; glycerol: EDA: H2O: N2 = 1:1:20:8 (mole ratio).
Catalysts 13 00318 g005
Figure 6. Temperature programmed desorption of NH3 (A) and CO2 (B) of Zn1Cr1 catalyst.
Catalysts 13 00318 g006
Table 1. Physicochemical properties of the Zn-Cr catalysts.
Zn:Cr
Mole Ratio
a SBET (m2 g−1)b H2 Uptake
(µmol g−1)
c O2 Uptaked Crystallite Size (nm)
(µmol g−1)(µmol m−2)ZnOZnCr2O4Cr2O3
4:178.040.523.20.2915.47.68nf
3:168.074.938.70.5717.38.64nf
2:138.9102.536.80.9419.814.5nf
1:143.9101.646.51.06nf9.2nf
1:256.9124.668.31.20nf13.8nf
1:345.378.955.91.23nf9.8nf
1:462.354.837.20.60nf9.919.9
a BET—surface areas of the fresh calcined catalysts. b H2 uptakes measured by TPR analysis calibrated with TPR of Ag2O. c O2 uptakes measured by pulse chemisorption at 335 °C. d Average crystallite size measured from XRD patterns using Scherrer formula. nf: not found.
Disclaimer/Publisher’s Note: The statements, opinions and data contained in all publications are solely those of the individual author(s) and contributor(s) and not of MDPI and/or the editor(s). MDPI and/or the editor(s) disclaim responsibility for any injury to people or property resulting from any ideas, methods, instructions or products referred to in the content.

