Article

Molten Salt-Assisted Catalytic Preparation of MoS2/α-MoO3/Graphene as High-Performance Anode of Li-Ion Battery

Energy and Environmental Materials Research Centre (E2MC), School of Metallurgy, Northeastern University, Shenyang 110819, China
*
Author to whom correspondence should be addressed.
Catalysts 2023, 13(3), 499; https://doi.org/10.3390/catal13030499
Submission received: 6 February 2023 / Revised: 24 February 2023 / Accepted: 27 February 2023 / Published: 28 February 2023

Abstract

:
We report on the facile and scalable catalytic conversion of natural graphite and MoS2 minerals into α-MoO3 nanoribbons incorporated into hexagonal MoS2 and graphene nanosheets, and evaluate the structural, morphological and electrochemical performances of the hybrid nanostructured material obtained. Mechanochemical treatment of raw materials, followed by catalytic molten salt treatment leads to the formation of nanostructures with promising electrochemical performances. We examined the effect of processing temperature on the electrochemical performance of the products. At 1100 °C, an excellent Li-ion storage capacity of 773.5 mAh g−1 is obtained after 180 cycles, considerably greater than that of MoS2 (176.8 mAh g−1). The enhanced capacity and the rate performance of this electrode are attributed to the well-integrated components, characterized by the formation of interfacial molybdenum oxycarbide layer during the synthesis process, contributing to the reduced electrical/electrochemical resistance of the sample. This unique morphology promotes the charge and ions transfer through the reduction of the Li-ion diffusion coefficient (1.2 × 10⁻¹⁸ cm2 s−1), enhancing the pseudocapacitive performance of the electrode; 59.3% at the scan rate of 0.5 mV s−1. This article provides a green and low-cost route to convert highly available natural graphite and MoS2 minerals into nanostructured hybrid materials with promising Li-ion storage performance.

1. Introduction

The development of efficient and low-cost energy storage devices is a key towards the electrification of various sectors, including the transportation and grid services [1,2,3], supporting the sustainable development goals. Lithium-ion battery (LIB) is the state of the art energy storage device in a wide variety applications and, therefore, its modifications in terms of performance, cost and availability of raw materials are of great importance [4,5,6] Graphite, including synthetic graphite (SG) and modified natural graphite (NG) is a commonly used material for the fabrication of the anode of LIBs, due to its modest theoretical capacity of 372 mAh g−1 and high cycle stability [7,8]. SG is made by the graphitization of carbonaceous material at extremely high temperatures (≈3000 °C) [9], which is an extremely energy-intensive approach. NG originating from carbon-rich organics formed through the prolonged geological interactions [9] is considered as a promising alternative anode material mainly due to its high availability and low cost [10,11,12]. In fact, the world’s NG reserves are huge, exceeding 800 million tons of recoverable graphite [13], with a typical low price of around USD 750 per metric ton (≈94% purity) [11] making NG highly attractive for energy applications. Despite these advantages, however, NG minerals often undergo expensive, energy intensive and time-consuming processes, including high-temperature treatments (>2300 °C), and/or treatment with hazardous chemicals such as HF [13,14,15]. Therefore, the direct application of NG minerals for the fabrication of anode materials without going through expensive/environmentally problematic processes is required in order to appropriately utilize NG for future developments of LIBs.
Apart from NG, other naturally available materials such molybdenum disulfide (MoS2) have also attracted attentions due to their high availability and low-cost. In particular, the theoretical Li-ion storage capacity of MoS2 is approximately three times greater than that of commercial graphite anodes [16,17]. Despite its potential capability, the application of MoS2 as the anode of LIBs is challenging due to the low reversible capacity of the material at large cycle numbers. In contrast to MoS2, other molybdenum compounds such as molybdenum trioxide (MoO3) have also been evaluated as the anode of LIBs. However, the cycling performance of MoO3 is not satisfactory due to the low conductivity of the compound, and its disintegration during discharge/charge cycles [18,19,20]. These issues might be reduced by combining MoO3 and MoS2 so that the latter can enhance the conductivity of the nanocomposite and prevents the rapid disintegration [21,22,23]. The methods suggested for the synthesis of MoS2/MoO3 nanocomposites comprise of chemical vapor deposition [24], hydrothermal methods [25,26], in-situ growth [23], sulfur transfer [27], anion-exchange [28], and annealing treatment [29] using the precursor materials such as (NH4)6Mo7O24 and thiourea [23,28], organic amine, and MoO3 [24], Mo metal powder and H2O2 [27] as well as MoO3 powders, sulfur and N2 [29]. These synthesis methods are typically complicated and require long processing periods involving expensive and/or environmentally problematic raw materials, limiting their capability at large scales.
With this background, the clean and facile preparation MoS2/MoO3 nanocomposites with enhanced Li-ion storage performance using low-cost and highly available minerals is an interesting goal. In a recent work, we suggested the mechanochemical–molten salt treatment of pure synthetic graphite with MoS2 as a possible green way of producing nanostructures with promising Li-ion storage performance [30]. However, the application of pure synthetic graphite would greatly influence the economic and sustainability of the process. In this study, we show that the wet high-energy ball-milling of commercial MoS2, non-purified natural graphite and NaCl, followed by a heat-treatment at temperatures above the melting point of NaCl leads to the formation of well-integrated nanostructured hybrid materials, in which MoO3 nanoribbons are incorporated with hexagonal MoS2 and graphene nanosheets. We further study on the effect of heating regime on the microstructural evolution of the nanocomposite materials, and find out that at 1100 °C, the nanocomposite contains the highest amount of well-integrated α-MO3 nanoribbons providing a promising Li-ion storage performance of 773.5 mAh g−1 after 180 charge/discharge cycles, considerably greater than that of MoS2 (176.8 mAh g−1). We suggest the formation of interfacial molybdenum oxycarbide that reduces the internal impedance, and promotes the ion/electron transfer within the nanostructured material, and its interface with the electrolyte. Furthermore, this article reports on the molten salt synthesis of hexagonal MoS2 nanosheets, which are well incorporated into the nanocomposite and contribute to the high performance of the electrode by improving the electron and ion transportation across the material. The formation of hexagonal MoS2 nanosheets, presented here, is in contrast with alternative techniques reported in the literature for the fabrication of such MoS2 morphologies based on prolonged sulfurization of (NH4)2MoS4 using H2S at 800 °C [31,32]. Other techniques reported on the preparation of hexagonal WS2 nanoflakes include thermal conversion of WxOy nanorods in the presence of S at 750 °C (6 h) under high-vacuum [33], and the electrochemical exfoliation of WS2 in Na2SO4 [34]. Also, the preparation of hexagonal nanosheets of CdI2 [35] and SnS2 [36] have been reported using chemical vapor deposition and steam vapor etching. In this paper, we report on the facile preparation of hexagonally-shaped MoS2 nanosheets incorporated with MoO3 nanoribbons and graphene nanosheets (MoO3/MoS2@Graphene) by a simple mechanochemical–molten salt approach using natural graphite and MoS2 minerals, with promising Li-ion storage performance. The mechanism involved in the preparation and the electrochemical performance of the nanostructured materials are investigated.

2. Results

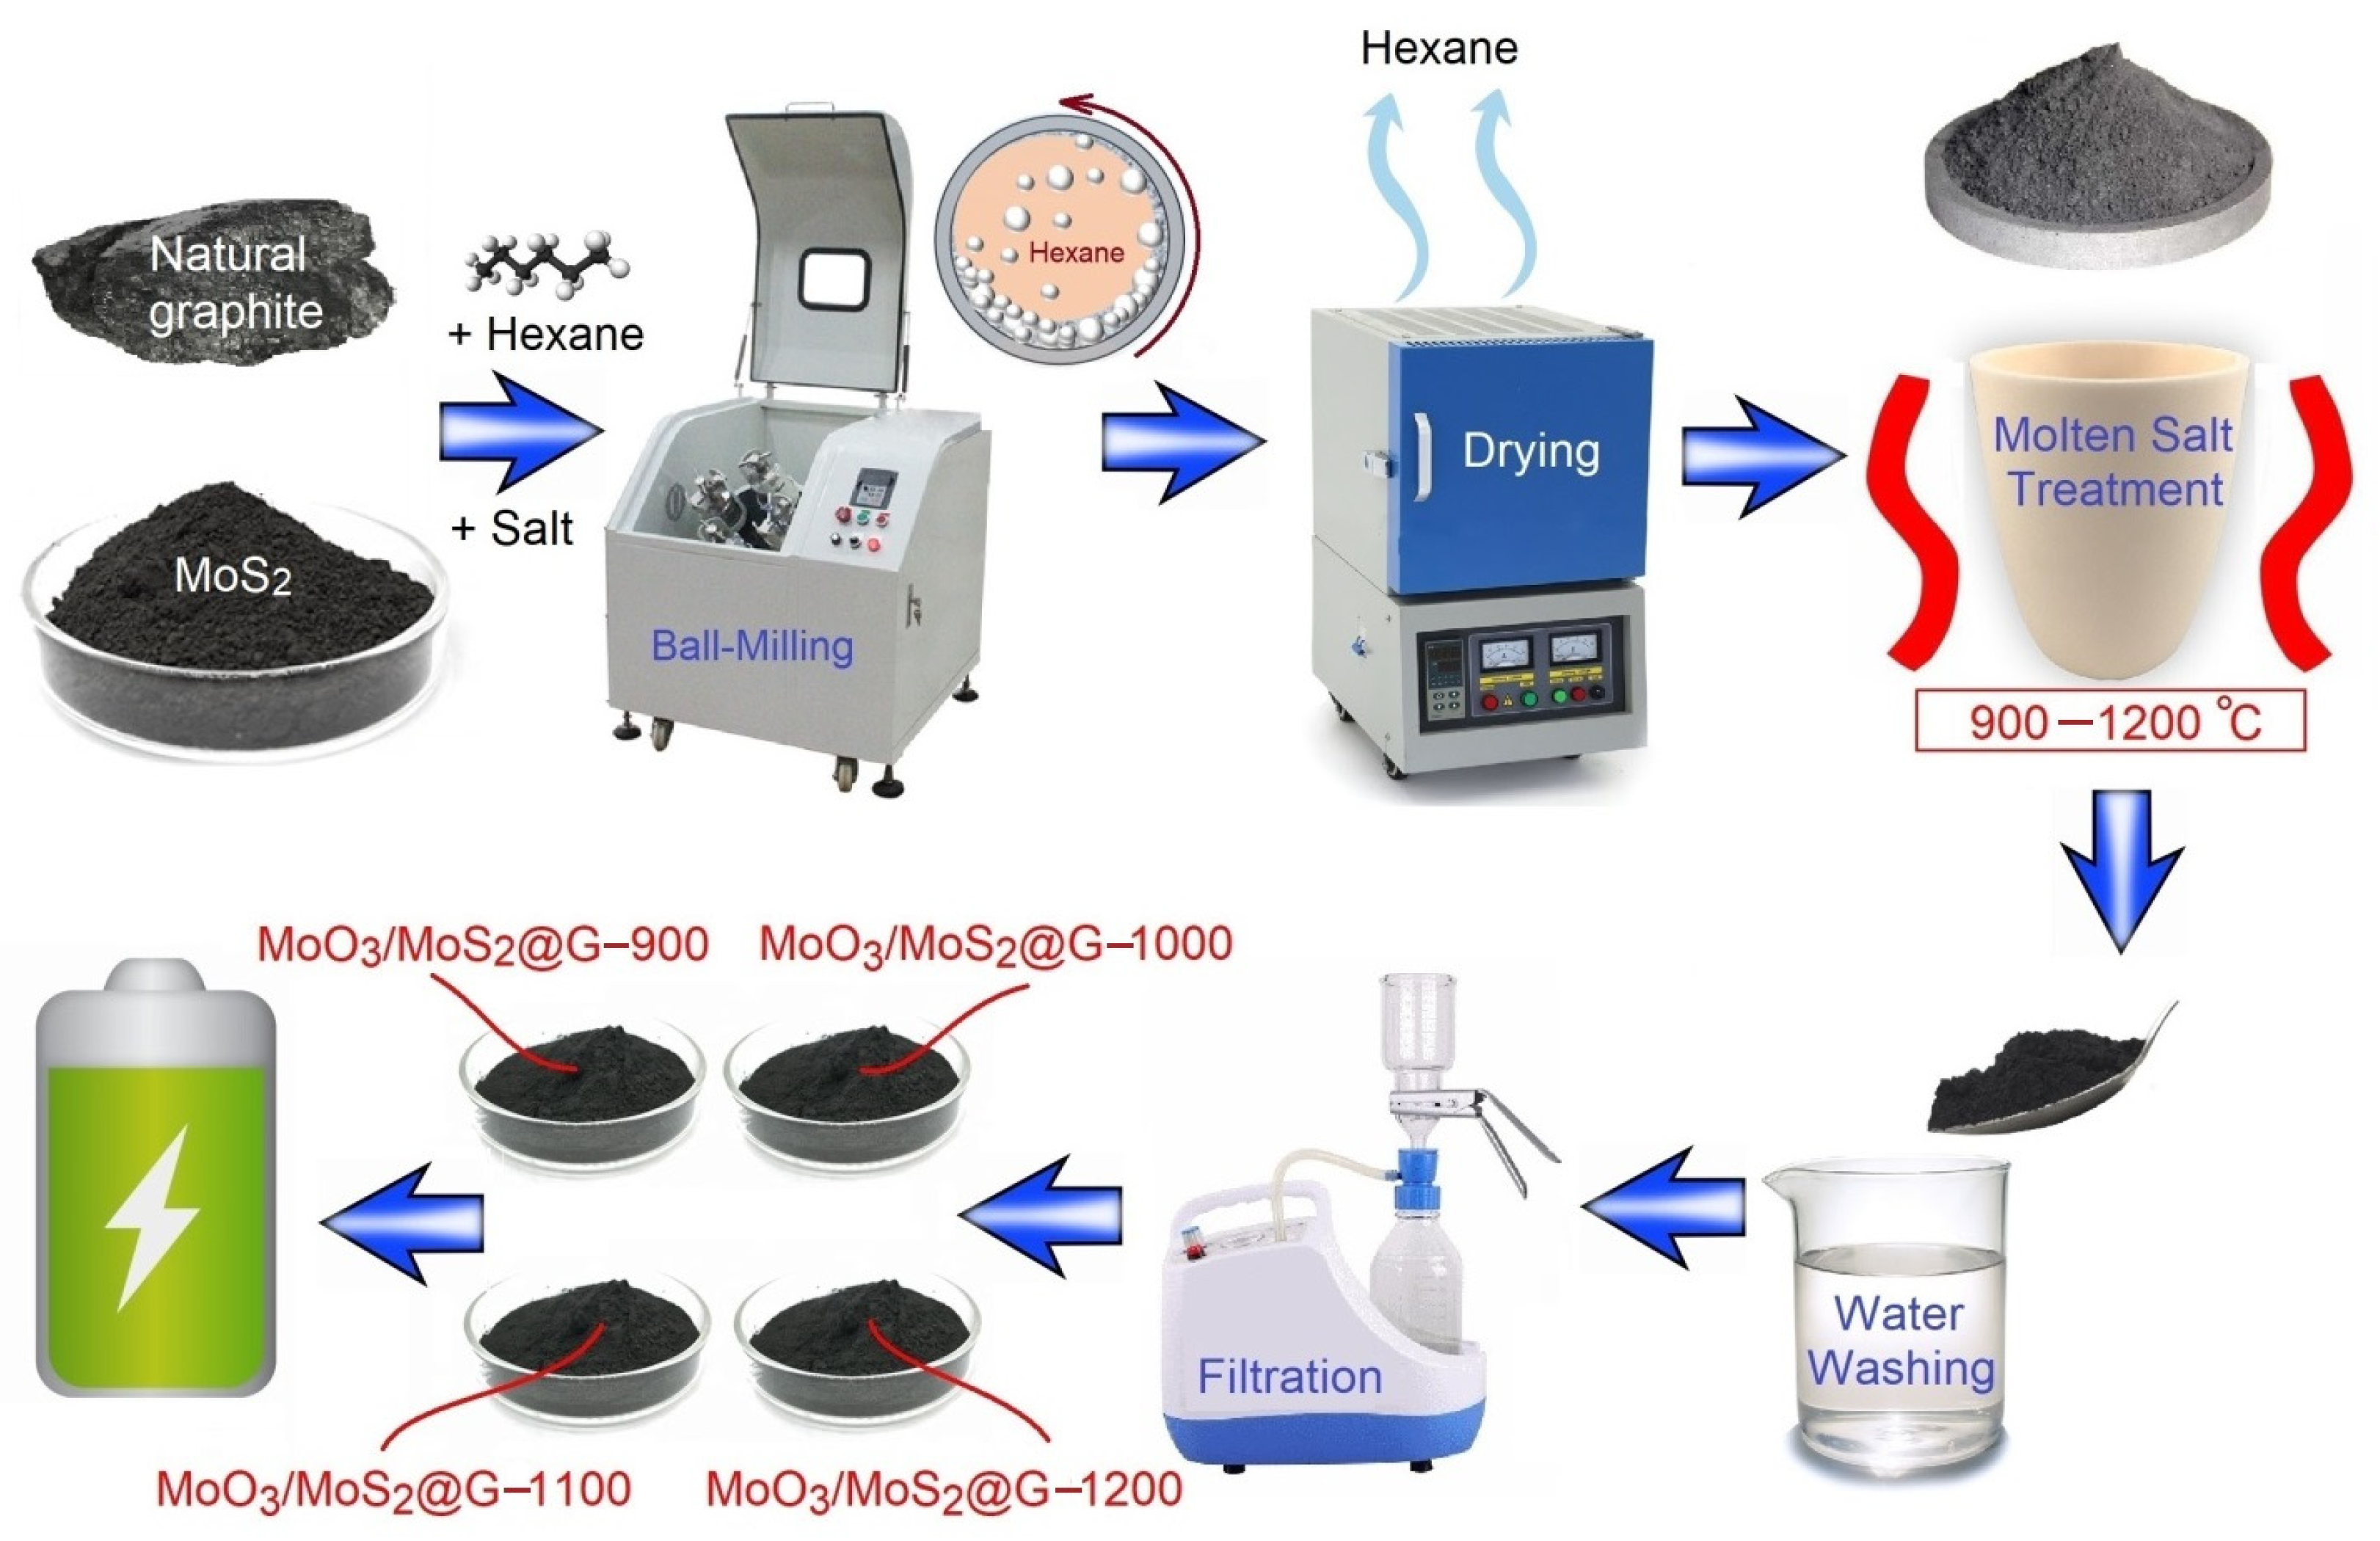
2.1. Preparation of Materials

In this work, MoO3/MoS2@Graphene samples were prepared using natural graphite mineral without conducting extensive modification/purification processes which are often performed to fabricate battery-grade materials. The details of the process are mentioned in “Materials and Methods” and summarized in Figure 1.

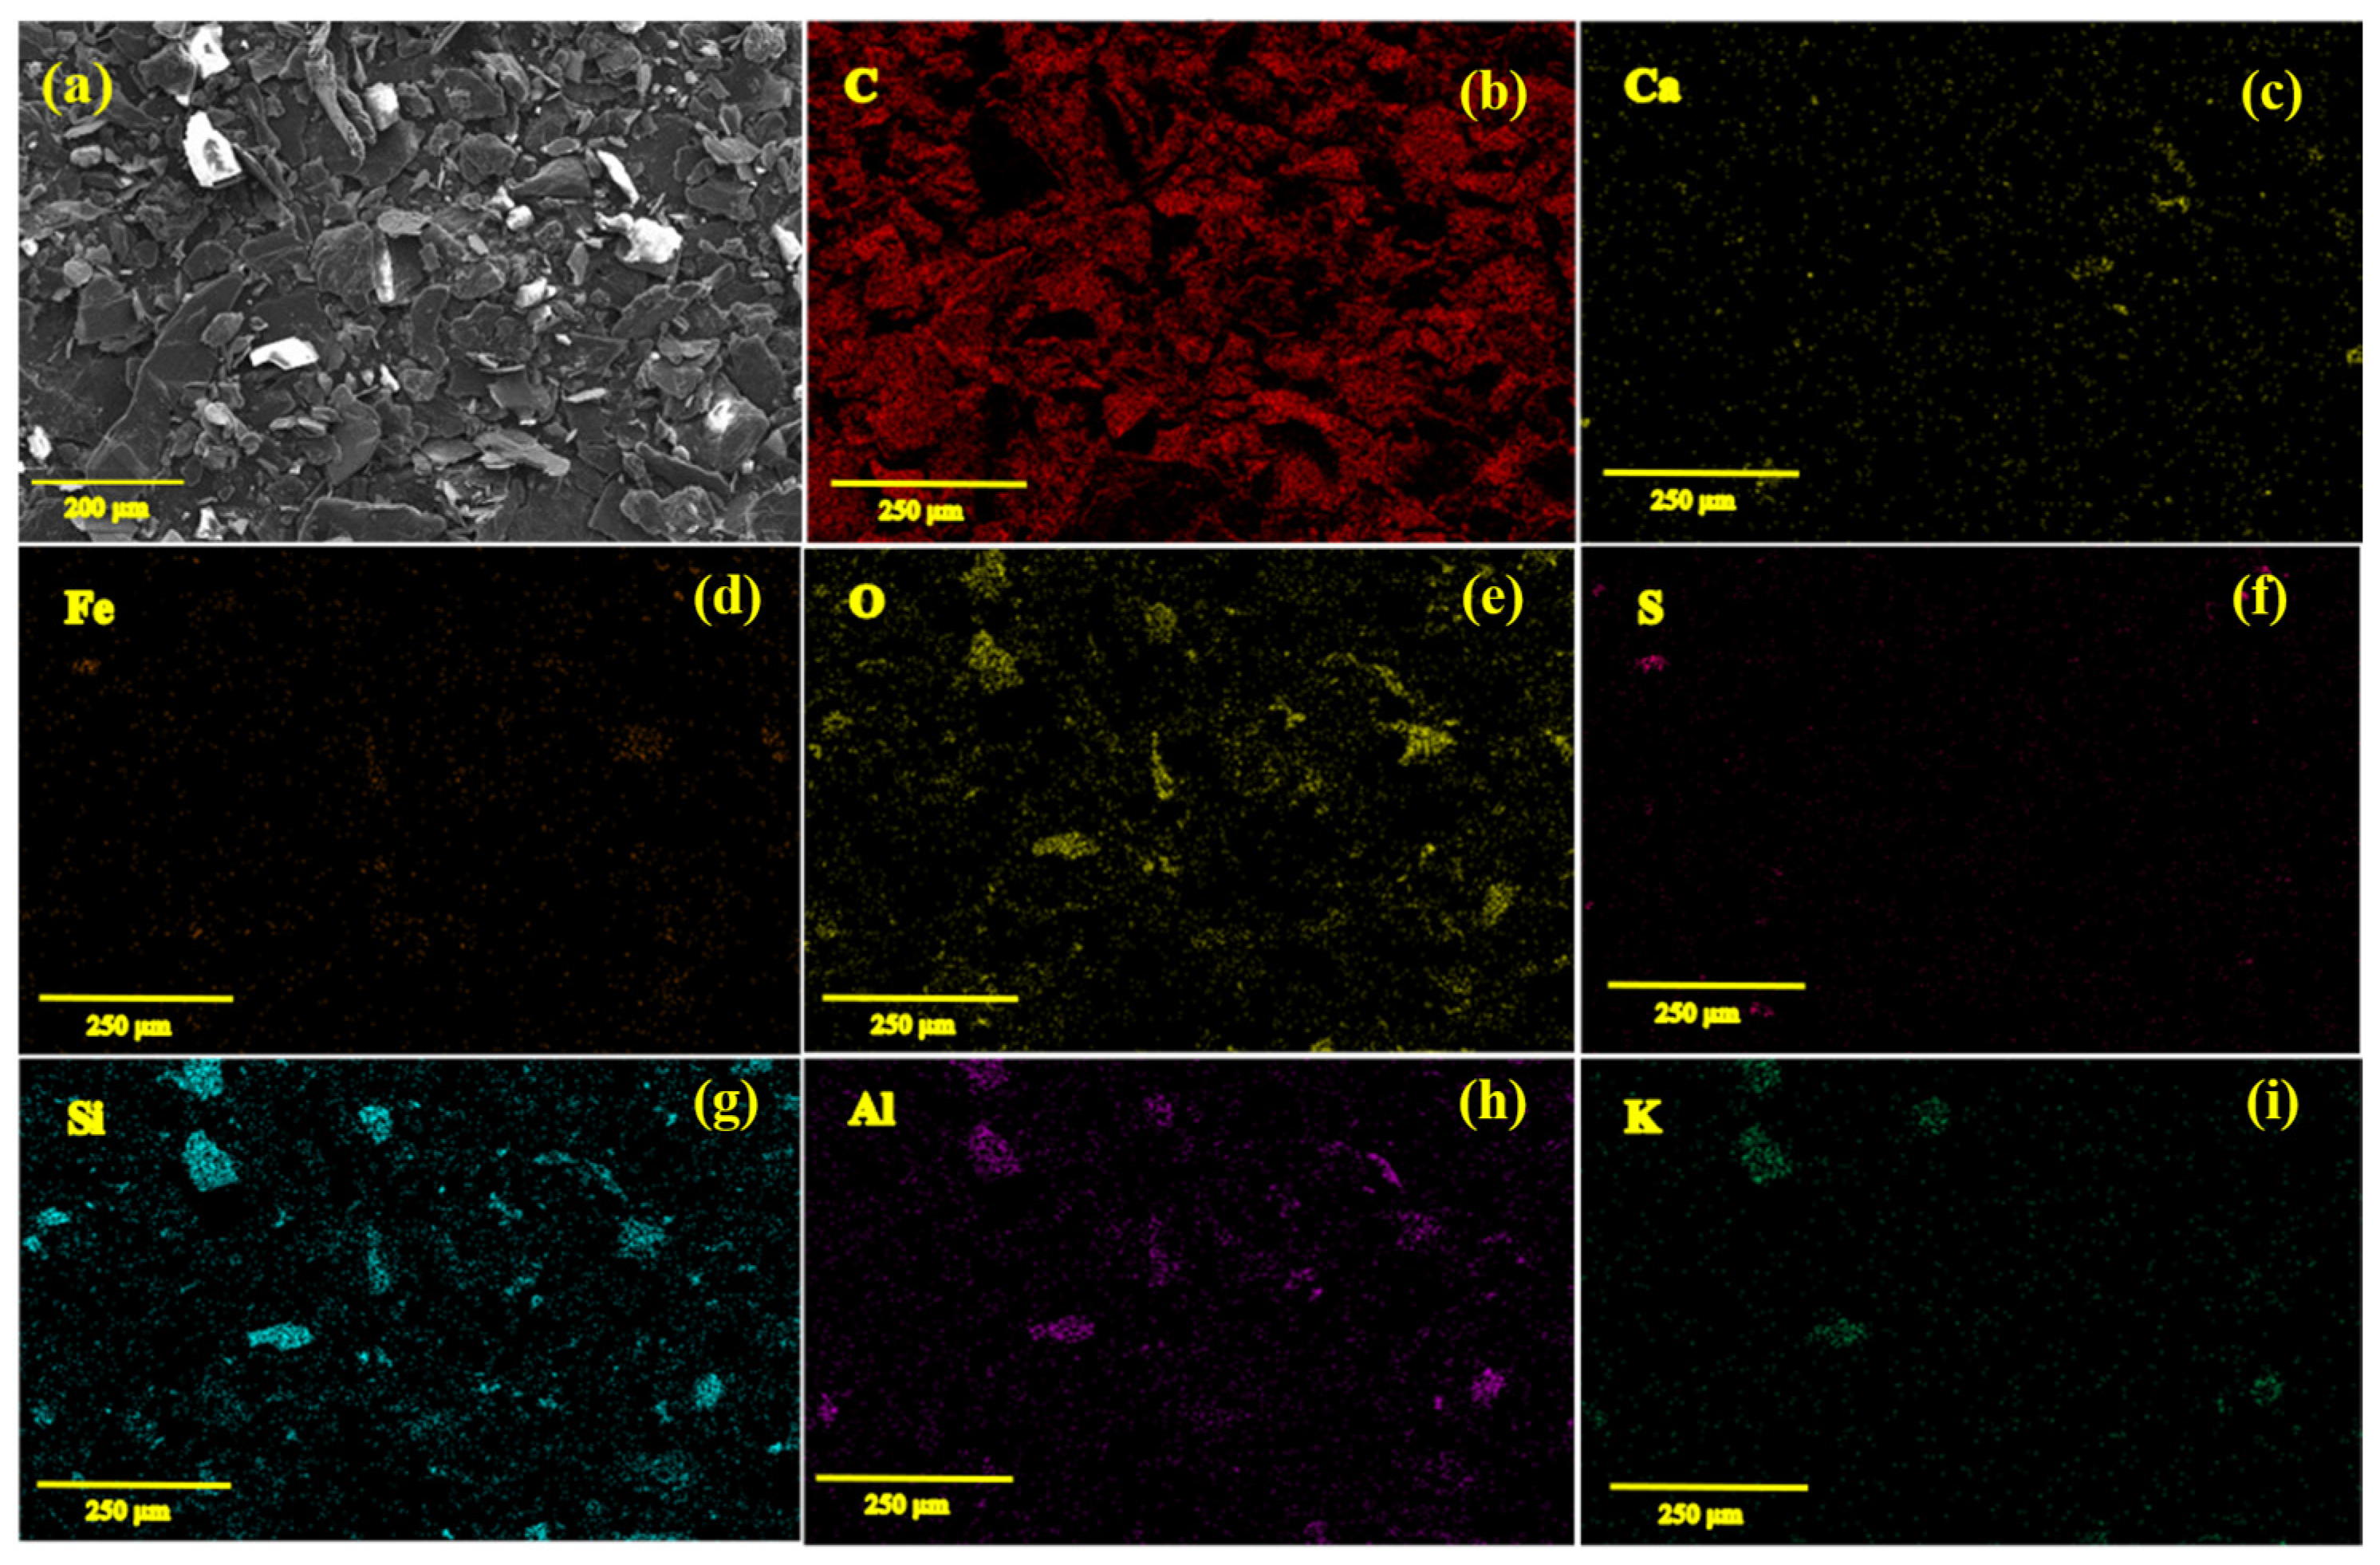
2.2. Characterization of the Natural Graphite Mineral

It is useful to provide insights on to the chemical and microchemical composition of the NG used as the raw material in this research. Figure 2 shows the SEM/EDS element mapping analysis recorded on the sample. As can be seen from Figure 2a, the material contains graphitic flakes with lateral dimensions typically larger than 20 μm. According to the EDS analysis, in addition to carbon, other elements comprising Ca, Fe, O, S, Si, Al, and K could also be detected, indicating the impurity of the natural graphite material.
The presence of oxide impurities can clearly be recognized from the EDS analysis. The data obtained could be confirmed by the X-ray fluorescence (XRF) quantitative analysis recorded on the natural graphite sample, as exhibited in Table 1. The analysis performed shows that the carbon content of the material is 74.3 wt%. Other components include SiO2 (9.27 wt%.), Al2O3 (6.92% wt%), CaO (2.97 wt%), Fe2O3 (2.29 wt%), K2O (2.17 wt%) and S (2.08 wt%). The natural graphite mineral was employed for the synthesis of MoO3/MoS2@graphene samples without purification, as explained in the next section.

2.3. Catalytic Phase Transitions during the Molten Salt Treatment

MoS2 and natural graphite precursors were subjected to a ball-milling process (2 h) in the presence of hexane, and the BMed samples were heat treated with NaCl at 900, 1000, 1100 and 1200 °C in air for 20 min. These temperatures are greater than the melting point of NaCl (~800 °C), causing the progress of the reactions in a molten salt environment. This simple molten salt process led to the formation of MoS2/MoO3@Graphene nanocomposites, as can be realized from Figure 1, and the XRD patterns of Figure 3. Moreover, the XRF quantitative analysis of various samples, namely MoO3/MoS2@G-900, MoO3/MoS2@G-1000, MoO3/MoS2@G-1100 and MoO3/MoS2@G-1200 are shown in Table 2. From the XRD patterns, the graphite and MoS2 materials do not show any change of crystalline structure after ball milling, while a reduction in the thickness of their flakes can be expected under the influence of the shear forces applied during the ball milling process. However, various phases can be detected in products obtained after the heat-treatment process at different temperatures, namely MoS2 (PDF#03-065-0160), orthorhombic-MoO3 (PDF#01-089-5108), monoclinic-MoO3 (PDF#01-085-2405) and graphite (PDF# 01-075-2078).
Figures S1–S3 show high resolution XRD patterns of diffraction peaks corresponding to monoclinic and orthorhombic MoO3 which are close to each other. In addition, Table S1 shows the intensity ratios of various phases in MoO3/MoS2@G-900, MoO3/MoS2@G-1000, MoO3/MoS2@G-1100 and MoO3/MoS2@G-1200. One observation from Figure 3 and Figures S1–S3 is that the monoclinic-MoO3 (PDF#01-085-2405) could be formed only at 1200 °C. Moreover, the combination of Table S1 and Table 2 can lead to the conclusion that the amounts of sulfur, molybdenum, carbon and other elements in the samples heated at 900 and 1000 °C are nearly similar. In the samples heated at 1100 °C, however, the amount of sulfur is less, but the contents of other elements are more than those in the samples prepared at 900 and 1000 °C. Therefore, the amount of sulfur reaches to its maximum in the sample prepared at 1200 °C, while the proportions of other elements in this sample are the lowest among all samples.
Based on the observations mentioned above, it can be concluded that the content of MoS2 gradually decreases, while the temperature is increased from 900 to 1100 °C. On the contrary, the content of MoO3 gradually increases upon the temperature increase. When the temperature exceeds 1100 °C, the content of MoS2 increases, leading to the assumption that MoO3 would further transform into MoS2. The mechanism involved in this phase transition will be discussed in this paper. As the result, the maximum amount of MoO3 could be achieved at the heating temperature of 1100 °C.
Further characterization of samples was performed using Raman spectroscopy, and the results are shown in Figure S4. For C-MoS2, the Raman spectrum shows two major E 2 g 1 (380 cm−1) and A1g (406 cm−1) activation modes.  E 2 g 1 is due to the in-plane vibration of S and Mo atoms, and A1g is attributed to the relative vibration of S atoms in the out of plane direction. The other two relatively weak peaks observed at 285 and 450 cm−1 belong to E1g and longitudinal acoustic phonon mode in C-MoS2, respectively, as shown in Figure S4a. After the ball milling process, the E1g peak of C-MoS2 disappears, and the A1g-LA (M) peak is promoted. However, the structure of C-MoS2 and natural graphite phase has no significant change, as shown in Figure S4a. The Raman spectra of the products obtained at various temperatures are shown in Figure S4b. As can be seen from Figure S4b, in addition to peaks related to graphite and MoS2, there are also peaks related to MoO3, which are marked with red asterisks on the spectrum of the sample prepared at 1100 °C. Therefore, Raman spectra confirm the formation of MoO3/MoS2@Graphene.
On the other hand, the band gap energy indicates the energy required for the excitation of an electron to be moved from the valence band up to the conduction band. The Tauc method of evaluating the bad gap using UV Vis spectroscopy was used to measure the values of the band gap, as shown in Figures S5 and S6 and Table S2. It can be concluded that the values of band gap energy gradually increase with the increase of the content of molybdenum trioxide. The reason behind this variation is based on the fact that MoO3 is an n-type wide band gap (≈3 eV) semiconductor [37], so the value of energy band gap in the sample produced in 1100 °C is the largest.

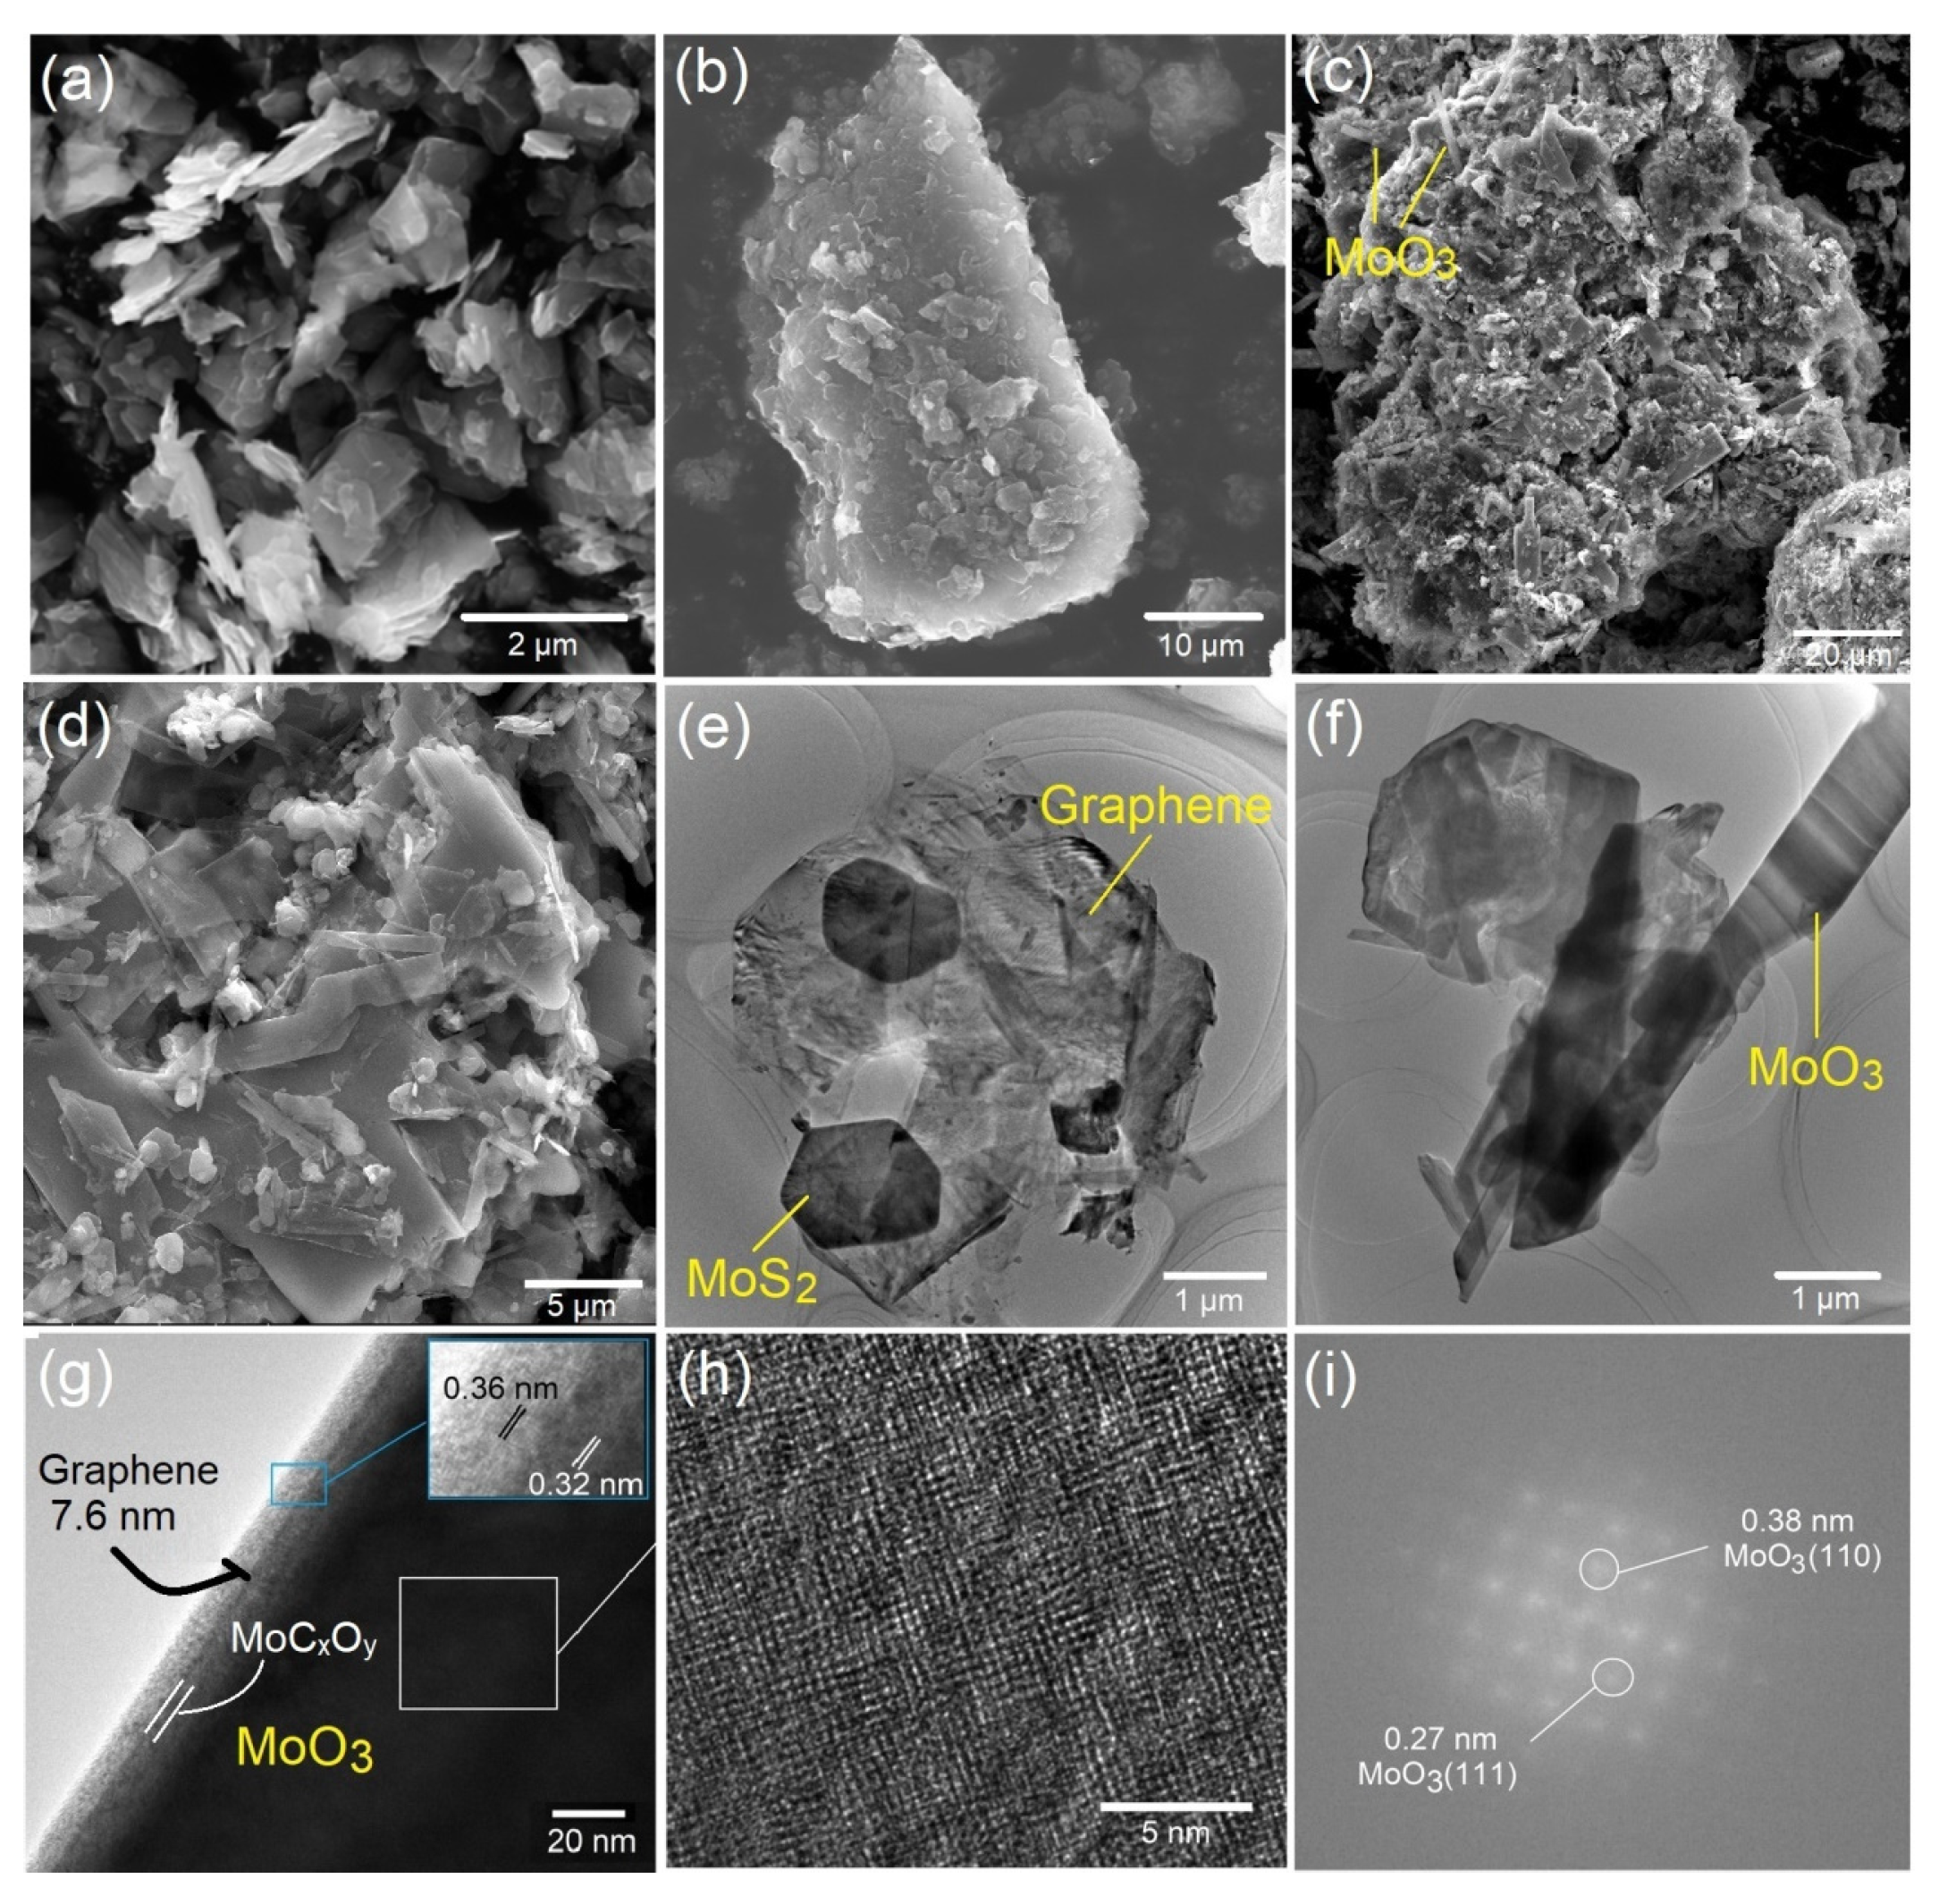
2.4. SEM Characterization

To investigate the effects of the processing temperature on the morphology and microstructure of the nanocomposite materials prepared in this study, SEM characterization was carried out on commercial molybdenum disulfide (C-MoS2), natural graphite and products comprising of MoO3/MoS2@G-900, 1000, 1100, and 1200. The results are shown in Figure S7 and Figure 4. The SEM micrograph of C-MoS2 is shown in Figure 4a, indicating that the material consists of irregularly-shaped flakes with the sizes of typically around 2 μm. SEM micrograph of natural graphite (Figure 4b) shows the sample is made of agglomerated flakes with typical sizes of several tens of micrometers. These two materials in combination with NaCl were used to fabricate MoO3/MoS2@G samples. As shown in Figure S7b–g, the morphology of the synthesized materials is different from those of starting material due to the formation of molybdenum oxides, hexagonal MoS2 and graphene nanosheets. In MoO3/MoS2@G-900, the presence of orthrombic-MoO3 was already confirmed based on XRD analysis of Figure 3c. The oxide phase can be distinguished in Figure S7b as crystals with sizes of around 1 µm, scattered within natural graphite and MoS2 flakes. The presence of orthrombic-MoO3 is attributed to the partial oxidation of MoS2, leading to the formation of the molybdenum oxide and gaseous sulfur dioxide, under the influence of atmospheric air. According to Figure 2, as the temperature increases to 1000 °C, MoS2 is almost fully oxidized into orthrombic-MoO3. Moreover, the dimensions of resulting oxide are increased to form rod-like particles with dimensions in range of around 5–30 μm, as shown in Figure S7c. The directional growth of orthrombic-MoO3 particles may lie on the preferential growth occurred along the-(001) direction in the orthorhombic structure of MoO3, as further observed in TEM micrograph of Figure S8. By increasing the temperature to 1100 °C, the MoO3 nanoribbons could grow even further, to form sheet-like particles with dimensions of around 50 μm, as shown in Figure S7d and Figure 4c,d. This observation suggests that at 1100 °C, other crystallographic directions in the orthorhombic lattice of MoO3 nanoribbons contribute to the growth phenomenon observed, forming sheet-like particles, which is in contrast to the rod-like particles observed in Figure S7c.
According to Figure S7e,f, by raising the temperature to 1200 °C, large-sized MoO3 crystals observed in Figure S7d disappear, and instead, a large number of hexagonally-shaped MoS2 crystals form. This morphological evolution may be described based on the possible reaction between the natural graphite flakes and sulfur dioxide released by the oxidation of the original MoS2 flakes, leading to the formation of elemental sulfur. Then, sulfur formed reacts on the surface of MoO3 nanoribbons particles to form hexagonal MoS2 nanosheets. As exhibited from Figure S7f, the hexagonal MoS2 nanosheets grow from the surface of the MoO3 nanoribbons particles, possibly, by replacing the oxygen of MoO3 with S [28]. The size of hexagonal MoS2 nanosheets is typically less than around 2 μm, as shown in the high-magnification image of Figure S8g. Figure S7h shows the EDS analysis recorded on the hexagonal MoS2 nanosheet shown in Figure 5, providing further evidence for the nature of such hexagonal crystals.
The in-situ formation of hexagonal MoS2 nanosheets on the surfaces of MoO3 nanoribbons leads to the disintegration of the MoO3 into smaller particles, as can be observed in SEM micrographs of Figure S7e,f. This phenomenon also causes the phase transition of MoO3 from the orthorhombic crystalline structure (α-MoO3) to the monoclinic modification (β-MoO3), as shown in Figure 2f. This hypothesized mechanism will be discussed further in next sections in this article. The combination of XRD and XRF analyses suggested that the MoO3 content of the samples reaches its maximum value at 1100 °C. This behavior can be related to the action of molten NaCl to protect the MoO3 particles from being excessively converted into hexagonal-MoS2 nanosheets at 1100 °C, while this temperature allows the maximum oxidation of the original MoS2 into MoO3 nanoribbons. Considering the higher contentment of MoO3 in the sample prepared at 1100°C, the Li-ion storage capacity of this sample is expected to be greater than other samples, and this will be shortly discussed later in this article.

2.5. TEM Characterization

As observed in Figure 4c,d, the SEM morphology of MoS2-MoO3@G-1100 could be characterized by the presence of agglomerated nano-entities. TEM studies were performed to further investigate this morphology, and the results are shown in Figure 4e–i, where the presence of hexagonal MoS2 nanoflakes (≈1 µm), graphene nanosheets and α-MoO3 nanoribbons (W ≈ 400–800 nm; L > 10 µm) can be realized. The formation of such nanoribbons can be related to the presence of oxygen vacancies on the surface of MoO3 crystals, providing the driving force for the solid-phase growth of oxides into nanoribbons [38,39]. The MoO3 nanoribbons appears to be formed as the result of dominant crystal growth along the [001] direction, as shown in Figure S8. In TEM images, the presence of graphene nanosheets (originating from the natural graphite material) combined with hexagonal MoS2 nanoflakes and MoO3 nanoribbons is evident. Figure 4g–i provide further insights into the interface between graphene and MoO3. Figure 4g shows a MoO3 nanoribbon, where the presence of a graphene layer with the thickness of around 7.6 nm on its surface can be seen. The high magnification TEM image shown as the inset of Figure 4g shows the presence graphene layers with the interlayer spacing of 0.36 nm, representing (002) planes of hexagonal carbon. In addition, toward the bulk of sample, the interlayer spacing of 0.32 nm can be assigned to the (021) crystalline planes of orthorhombic-MoO3. Moreover, there is an amorphous interface between the graphene nanosheets and MoO3 which could be assigned to molybdenum oxycarbide formed during the molten salt processing of the sample. Formation of this interfacial phase will be further discussed by XPS analysis in this article. Figure 4h shows a high resolution TEM micrograph recorded on the MoO3 nanoribbons, where the crystalline structure of the materials can clearly be observed. Figure 4i exhibits the fast Fourier transform (FFT) recorded on the micrograph of Figure 4h, where the spots related to the crystalline planes of orthorobmhic-MoO3 are indexed. Overall, XRD, SEM and TEM analyses suggest the formation of nanostructured MoO3/MoS2@G-1100, in which orthorhombic-MoO3 nanoribbons, hexagonal MoS2 nanoflakes and graphene nanosheets are well-integrated. The presence of interfacial molybdenum oxcycarbide was also suggested.

2.6. Surface Characterization

The structural and microstructural characterizations mentioned above could demonstrate the formation of MoO3 nanoribbons incorporated into hexagonal MoS2 and graphene. The Li-ion storage performance of the products will be evaluated shortly in this article. However, before that, it would be interesting to shed light on to nature of the interface between the above mentioned phases. This was examined using XPS analysis, as shown in Figure 5. As can be observed, the characteristic peaks of Mo, O, S and C are debatable in the XPS spectrum of MoO3/MoS2@G-1100. High-resolution XPS spectra obtained on Mo 3d, O 1s and S 2p peaks are exhibited Figure 5a–c. As observed, the strong peak at 229.53 eV corresponds to Mo4+ 3d3/2, and peaks at about 163.1 eV and 161.5 eV to S 2p1/2 and S 2p3/2, respectively, revealing the existence of MoS2 [40,41]. On the other hand, the peaks located at 235.79, 232.95, 530.56 and 532.15 eV correspond to the Mo6+ 3d3/2, Mo6+ 3d5/2. These peaks together with that appeared at 530.65 eV (corresponding to O1s components) indicate the presence of MoO3 [27]. Moreover, the C 1s core level shown in Figure 5d could be deconvoluted into two peaks at 284.38 and 285.16 eV, which originate from the C–C and C-O bonds, respectively [41]. The presence of C-C bond is related to the graphene nanosheets, and C-O bond to the local interaction between graphene nanosheets and MoO3.
Moreover, the presence of peak at 532.15 eV in Figure 5b indicates the presence of Mo-O-C [42] corresponding to the formation of interfacial molybdenum oxycarbide (MoCxOy) at the interface between MoO3 and graphene nanosheets, as also suggested by the TEM micrograph of Figure 4g. Density functional theory calculations have confirmed the possibility of formation of molybdenum oxycarbide by reacting between zeolite-supported Mo and CO2 [43]. Zhu et al. [42] suggested that MoOxCy can be formed from MoO3, when vacancies available on the surface of MoO3 are filled by carbon atoms. In our case, MoO3 nanoribbons are wrapped with graphene nanosheets (Figure 4). Under this condition, the diffusion of carbon atoms into the surface of MoO3 at high-temperatures such as 1100 °C is possible, leading to the formation of interfacial MoOxCy. It should be mentioned that molybdenum oxycarbide is generally considered to possess low electrical resistivity of 3 μΩm at room temperature [44]. The interfacial molybdenum oxycarbide is likely to promote the electrochemical performances of the nanostructured materials. This will be discussed later in this article. The well-incorporated phases in MoO3/MoS2@G-1100, and the possible presence of interfacial molybdenum oxycarbide, can lead to the reduced specific surface area (1.74 m2 g−1) and pore volume (0.008 cm3 g−1. In agreement with these observations, the nitrogen adsorption–desorption isotherms of MoO3/MoS2@G-1100, shown in Figure 6, provide features corresponding to the type III isotherms, characteristic of the non-porous materials [45].

2.7. Catalytic Formation of Hexagonal MoS2 Nanocrystals and α-MoO3

In this research, commercially-available MoS2 flakes and natural graphite mineral were utilized as the initial material, and the product contained hexagonal MoS2 nanocrystals. The conversion of flake MoS2 into hexagonal nanocrystals is an interesting phenomenon discussed in this section. It is known that MoS2 flakes start to oxidize at around 400 °C, leading to the formation of orthorhombic molybdenum trioxide (α-MoO3) [46]. Therefore, the thermochemical reactions occurred in the process initiates with the formation of α-MoO3 through the involvement of oxygen from the atmosphere:
MoS2 + 3.5 O2 (g)= α-MoO3 + 2SO2 (g), ΔG°= −922.1 kJ (T = 400 °C)
In the presence of graphite, the SO2 gas formed based on the reaction (1) is likely to be fixed by graphite flakes to generate elemental sulfur and carbon dioxide gas, as shown in Equation (2).
SO2 (g) + C = S + CO2 (g), ΔG° = −95.6 kJ (T = 400 °C)
The combination of reactions (1) and (2) can lead to the reaction (3):
MoS2 + 2.5O2 (g) + C = α-MoO3 + 2S + CO2 (g), ΔG° = −718.1 kJ (T = 400 °C)
The generated elemental sulfur adhered to the surface of MoO3 is likely to in-situ reduce the MoO3 into hexagonal MoS2 nanocrystals:
α-MoO3 + 3.5S = hexagonally shaped MoS2 + 1.5 SO2 (g), ΔG° = −126.7 kJ (T = 400 °C)
The reactions (1)−(4) demonstrates the thermodynamic possibility of the formation of α-MoO3 and hexagonally shaped MoS2 at temperatures greater than 400 °C initiating with the oxidation of MoS2. In this research, the heating process was performed at temperatures above the melting point of NaCl. Therefore, the molten salt is likely to exfoliate the graphite flakes [47,48]. The formation of graphene nanosheets is evident from the TEM micrographs of Figure 4 and Figure S7. Figure S13 illustrates the possible mechanism involved in the catalytic formation of hexagonal MoS2 nanocrystals and MoO3 observed in this study.
To highlight the role of NaCl in the process, the sample prepared at 1100 °C was washed to remove its NaCl content, and the product (MoO3/MoS2@G-1100) was heated to 1200 °C for 5 min, without the involvement of NaCl. The appearance and X-ray diffraction pattern of the resulting sample are shown in Figures S9 and S10, respectively, providing evidence that the sample heated at 1200 °C mainly contains molybdenum oxide, without the participation of molten NaCl. In this case, carbon and molybdenum disulfide content of the sample are oxidized during the heat-treatment process to form molybdenum oxide and gas species at high temperature.
It should be mentioned that oxidation in air of graphitic carbon materials typically occurs at temperatures in the range 400–800 °C, depending on their grain size, level of crystallinity and presence of impurities that can catalyze the oxidation process [49,50] leading to the formation of gashouse species and ash. It is known that the oxidation of bulk and few-layer MoS2 flakes does not readily take place at ambient conditions due to the high energy barrier involved [51,52,53,54]. However, non-isothermal oxidation of MoS2 flakes initiates at temperatures as low as 350 °C with a limited rate, and increases by enhancing the temperature under an apparent activation energy of ≈1 kcal/mol, representing the bulk oxidation event. The oxidation process leads to the increase of the molybdenum oxide content (typically MoO3), by increasing the temperature [55,56]. This is in agreement with our observation exhibited in Figure S10. Based on the observations mentioned above, the presence of NaCl provides an essential support toward the formation of MoO3/MoS2@G samples at high temperatures. First, molten NaCl provides an ionic environment to enhance the chemical reactions, while preventing the oxidation of species and supporting the exfoliation of graphite into graphenen nanosheets; the latter is discussed elsewhere [57].

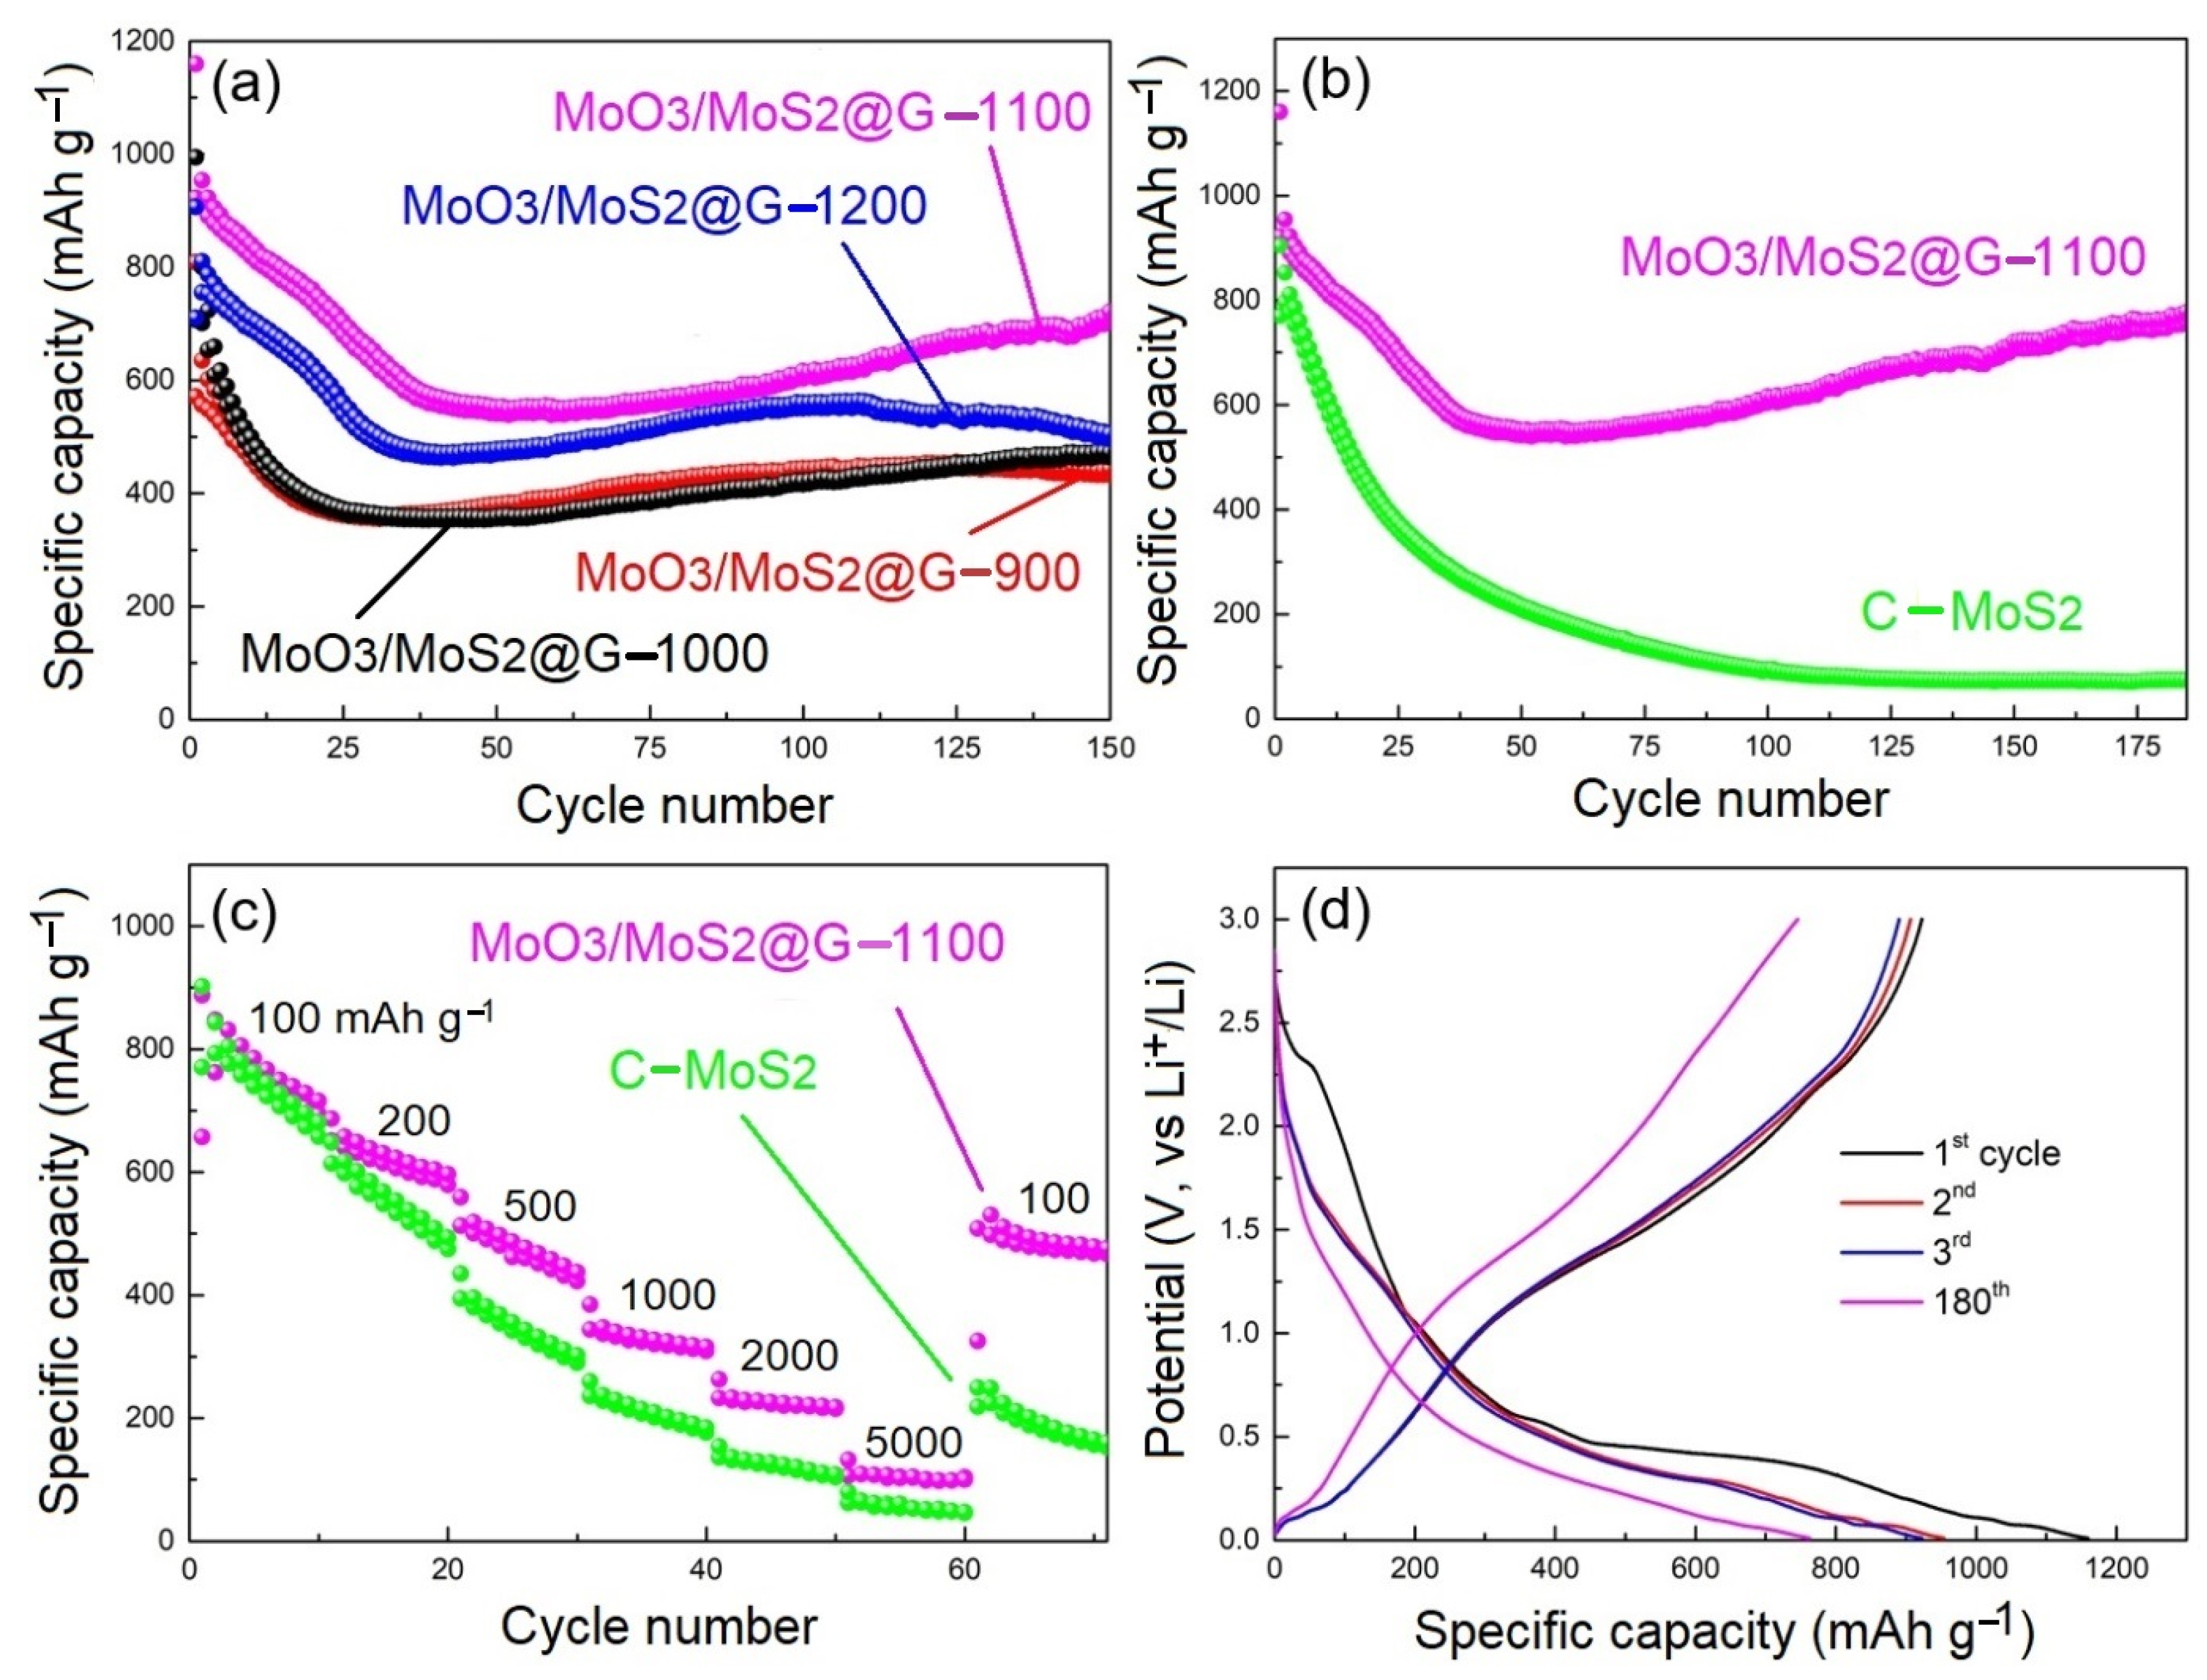
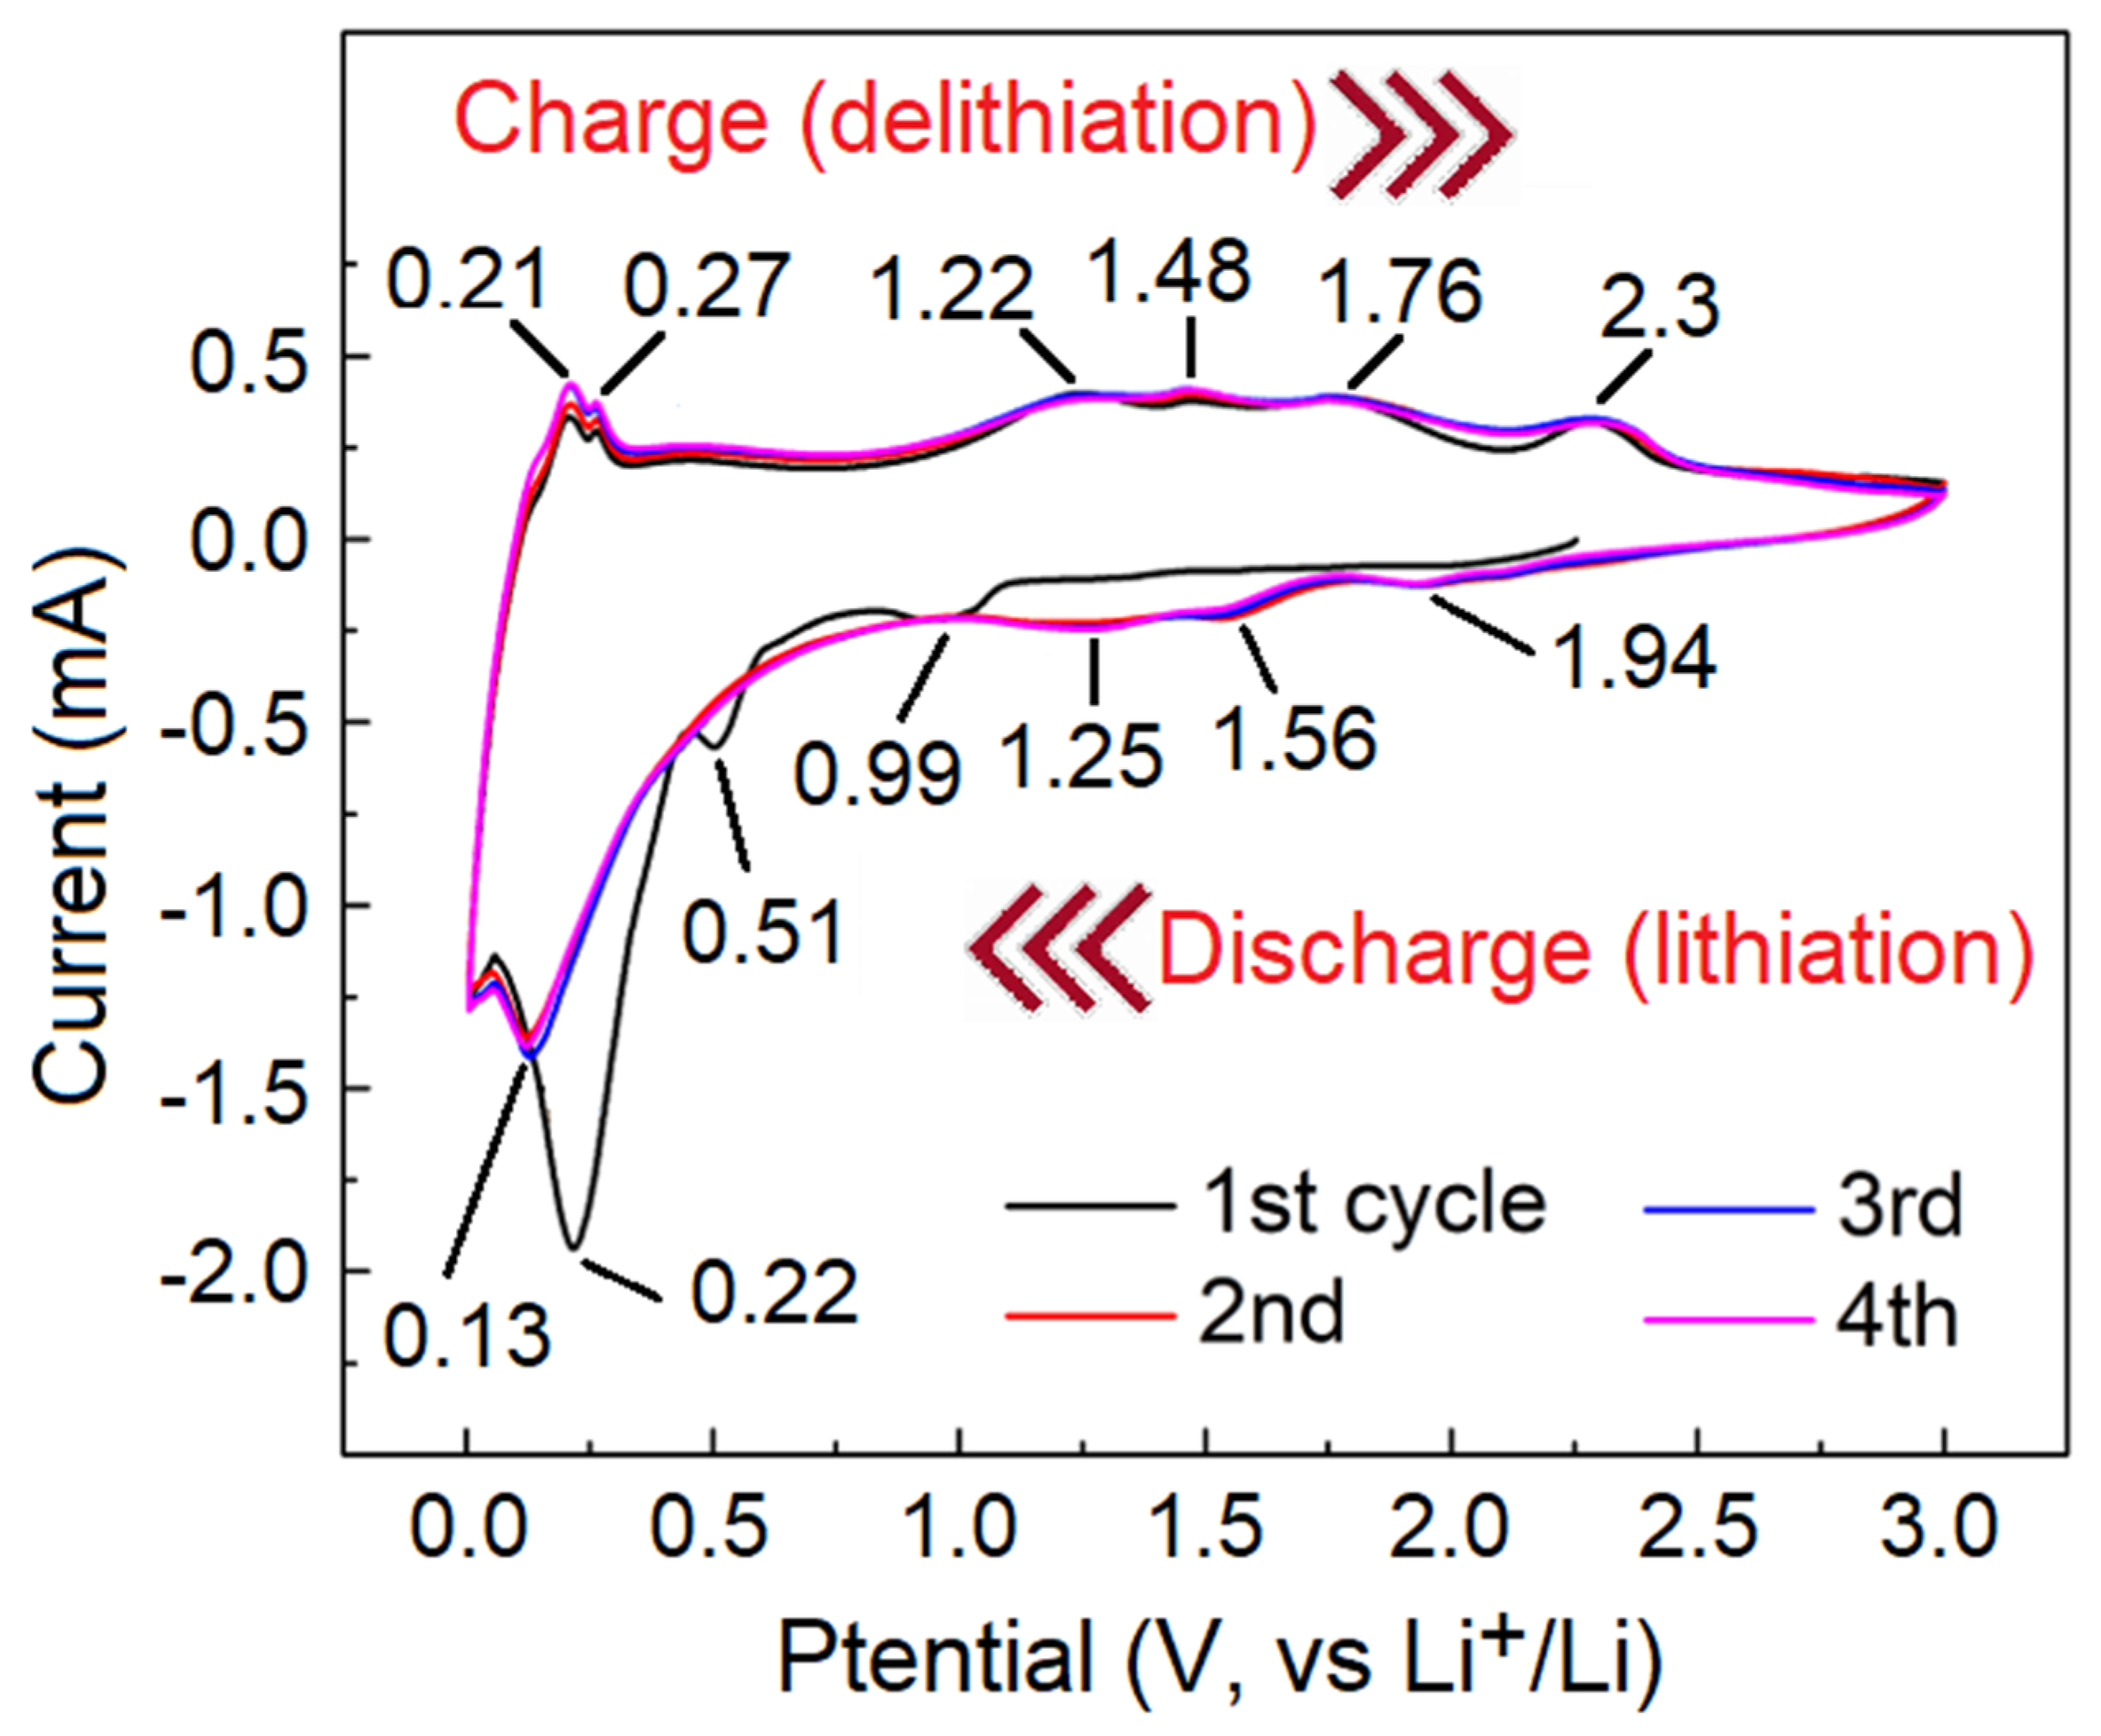
2.8. Electrochemical Characterization of MoO3/MoS2@G Samples

We further investigated the Li-ion storage performances of MoO3/MoS2@G samples prepared at various temperatures, namely MoO3/MoS2@G-900, -1000, -1100 and -1200 in comparison with those of the initial commercial MoS2 flakes, named as C-MoS2. In the half-cell configuration, the driving force for the Li-ion insertion/extraction into/out of the electrode during the discharge/charge processes is provided by the negative/positive polarization applied on the electrode, respectively.
The electrochemical performances of the electrodes are shown in Figure 7. The electrodes were fabricated using the water-based polystyrene acrylic-acrylate as the binder, as explained in the Experimental section. Figure 7a shows the cycle performances of MoO3/MoS2@G electrodes, and selected outcomes are summarized in Table 3. As can be seen, MoO3/MoS2@G-1100 electrode shows a greater initial coulombic efficiency (CE) of 79.58% compared with other electrodes. After 100 cycles, this electrode exhibits a reversible capacity of 616.3 mAh g−1 at 100 mA g−1.
The performance MoO3/MoS2@G-1200 electrode can be evaluated to be greater than those of -900 and -1000 electrodes, but lower than that of −1100. The greater performance of MoO3/MoS2@G-1100 can be attributed to the greater amount of MoO3 in this sample as realized from Figure 2 and Table 2. The other point that deserves attention is that by increasing the temperature to 1200 ℃, the amount of MoO3 in the sample reduces to reach its minimum among all samples, as evidenced from the relative low intensity of MoO3 reflections observed in Figure 3. Despite having the minimum amount of MoO3, the performance of the electrode is greater than samples prepared at 900 and 1000 °C. This observation can be assigned to the formation of β-MoO3 with monoclinic crystalline structure at 1200 ℃. This is known that the metastable β-MoO3 has a highly ionically conductive open-structure [41], enhancing the electrochemical performance of MoO3/MoS2@G-1200, despite the lower MoO3 content of the sample.
As can be seen in Figure 7d, the first discharge/charge specific capacity of MoO3/MoS2@G-1100 is recorded at 1159.6 mAh g−1/953.8 mAh g−1 (coulombic efficiency = 79.58%). This capacity loss can mostly be related to the generation of solid electrolyte interphase (SEI) layers on the electrode. The specific reversible capacity of the electrode could still be recorded at 773.5 mAh g−1 after 180 cycles, as exhibited in Figure 7d. Figure S11 shows the durability of MoS2/MoO3/G-1100 sample in lithium-ion battery. As seen, the specific capacity after 400 cycles is still maintained at 240 mAh g−1 under the current density of 500 mA g−1.
Figure 8 shows the CV curve of the MoO3/MoS2@G-1100 electrode, providing detailed information about the Li-ion insertion and extraction processes. During the first cathodic scan, there is a cathodic peak at 0.56 V. This cathodic event cannot be observed in the subsequent cycles, providing evidence that this peak mainly corresponds to the formation of SEI. Moreover, the presence redox peaks at 1.56/1.76 V and 1.25/1.48 V in the first cycle can be related to the lithiation and delithiation of MoO3, and to the metallization/oxidation of metallic molybdenum:
MoO3+ yLi+ + ye ↔ LiyMoO3
LiyMoO3 + (6−y) Li+ + (6−y) e ↔ 3Li2O + Mo
Moreover, the cathodic peak at 1.94 V might be attributed to the conversion from S8 to Li2S, and the oxidation peak at 2.3 V to the decomposition of Li2S [58,59]. On the other hand, the redox peaks at 0.99/1.22 V corresponded to the following electrochemical reactions [60]:
MoS2 + xLi+ + xe ↔ LixMoS2,
LixMoS2 + (4−x) Li+ + (4 − x) e−1 ↔ 2Li2S + Mo
Furthermore, the reduction/oxidation peaks at 0.21/0.22 V are related to adsorption/desorption of lithium ion on the surfaced of graphene nanosheets [61]. Overall, in agreement with Figure 7d, the CV curve of Figure 8 provides evidence for the electrochemical contribution of all the components of the electrode to the Li-ion storage performance observed.

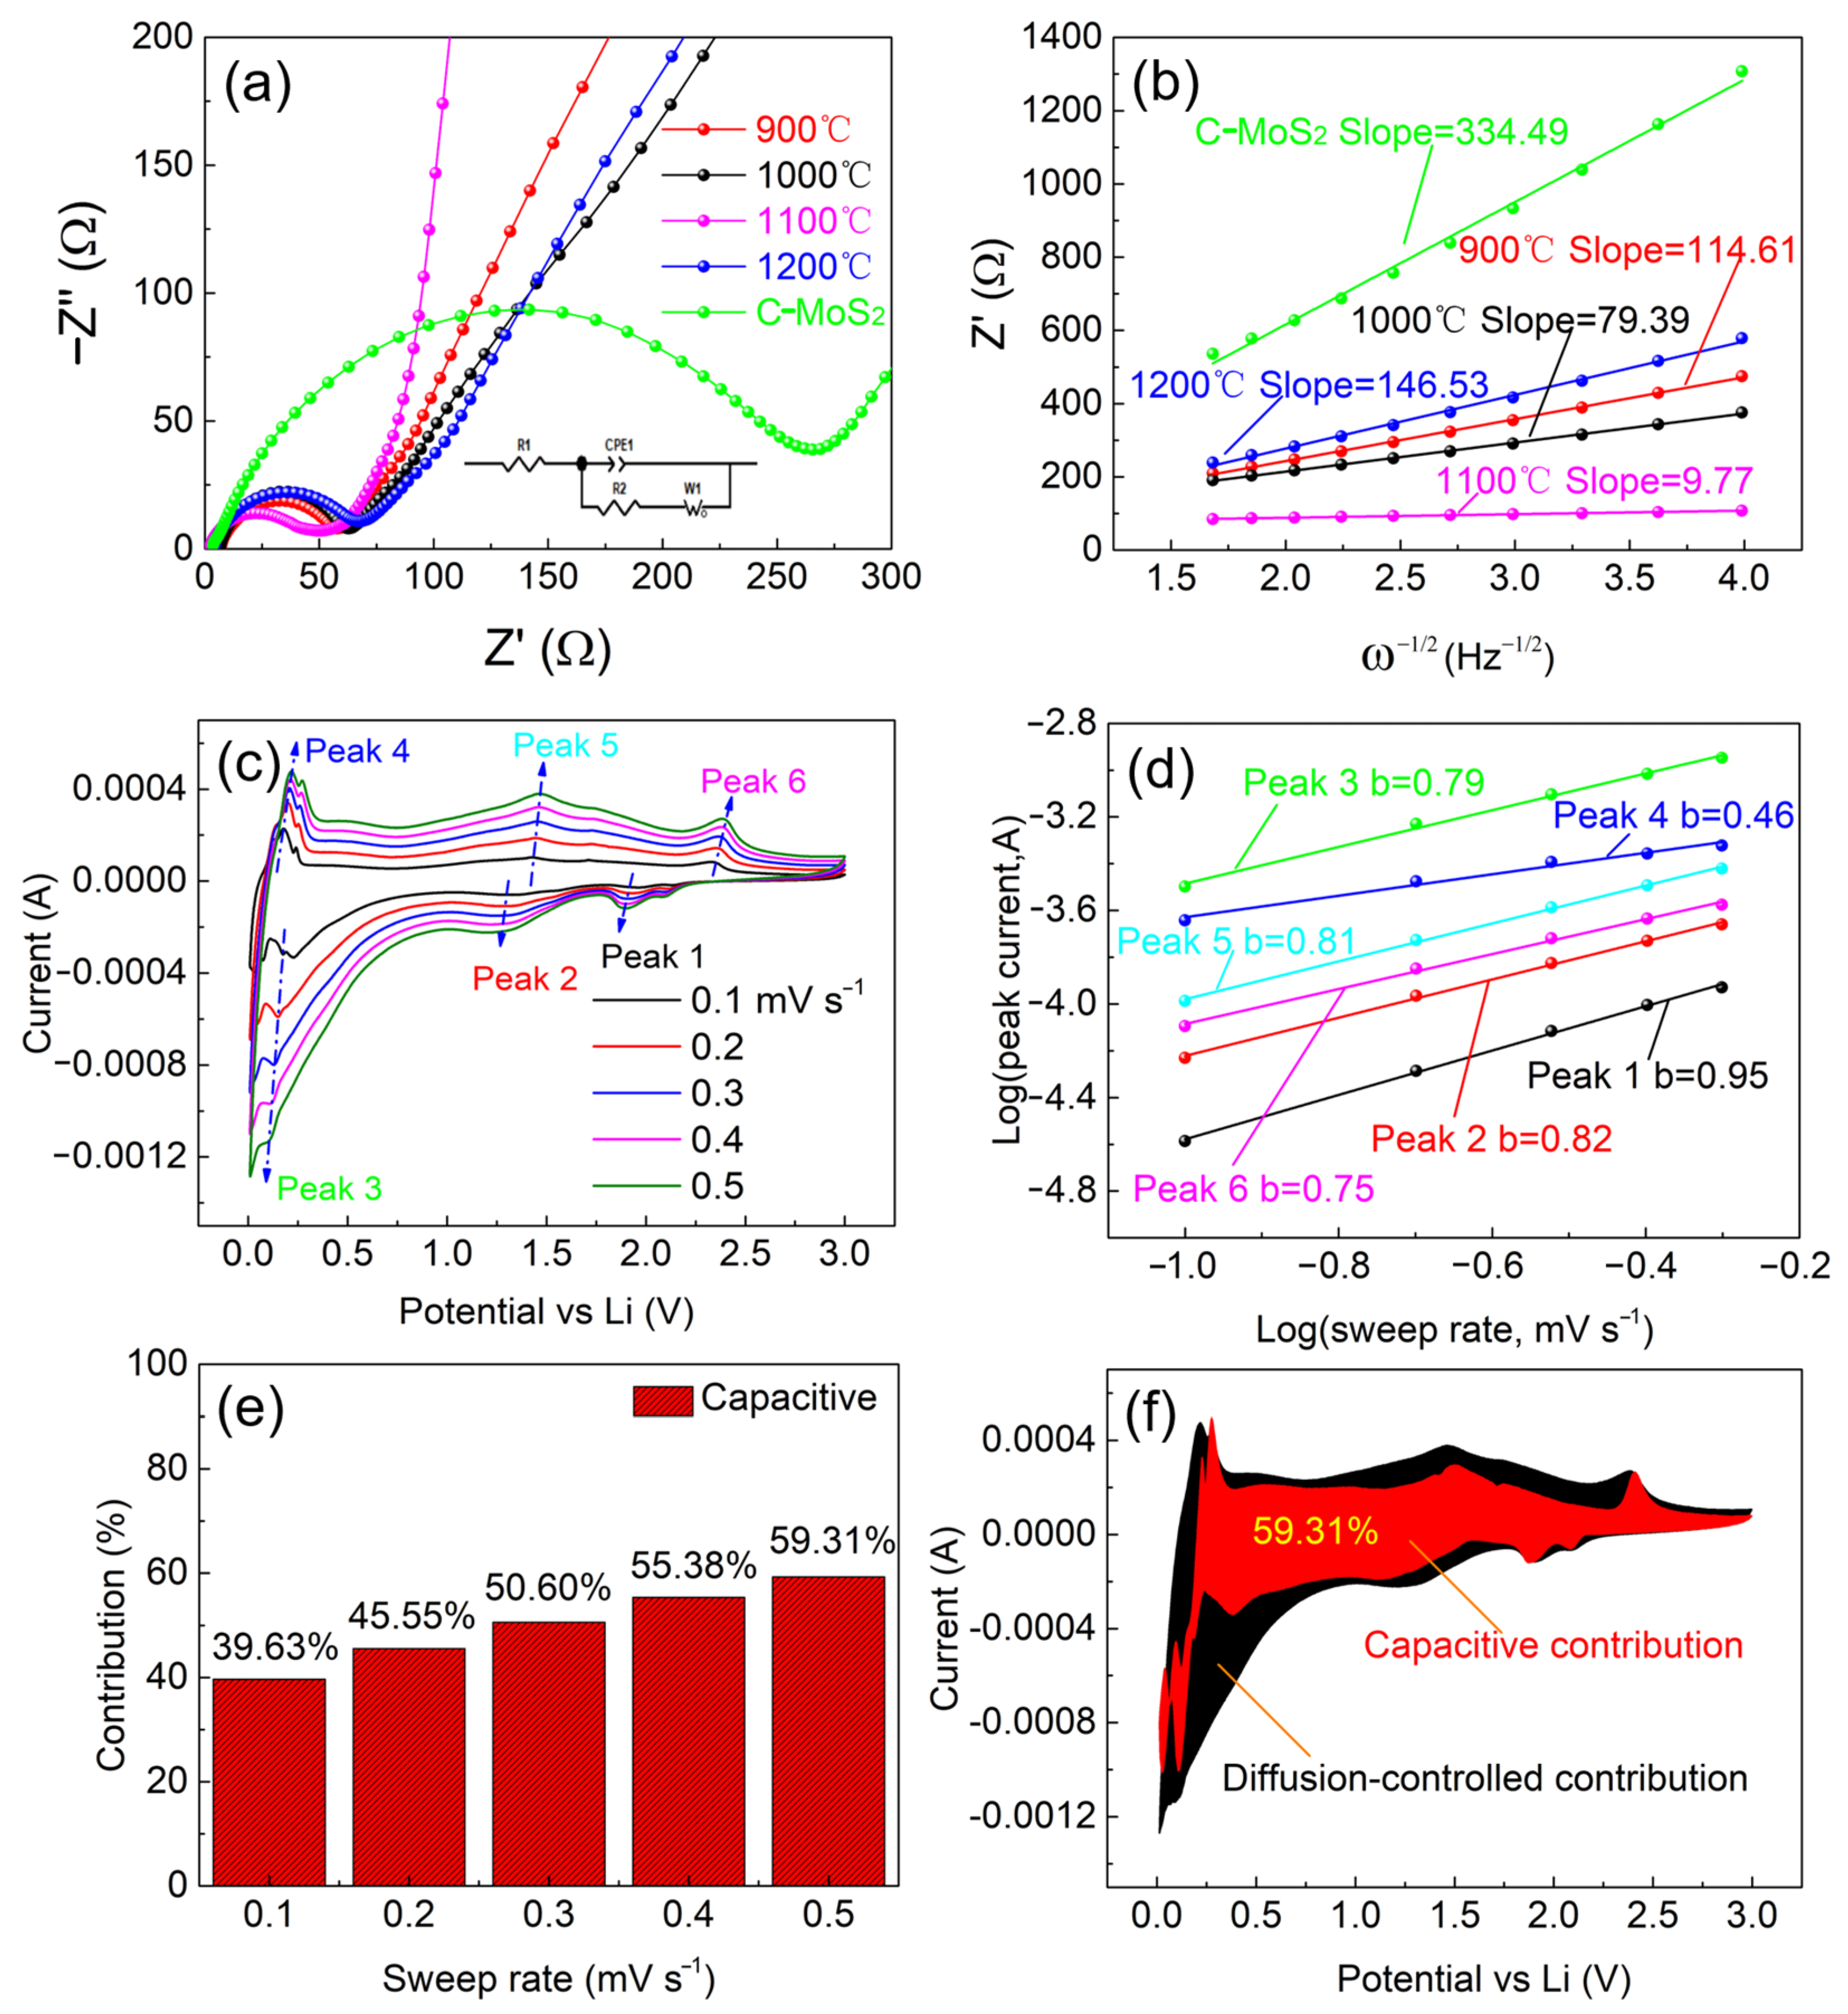
2.9. Impedance Spectroscopy and Electrode Kinetics

Impedance spectroscopy performed on MoO3/MoS2@G and C-MoS2. Figure 9a exhibits the Nyquist plots of the electrode. The plots show a semicircle in the high frequency range. The diameter of this semicircle can be related to the charge-transfer resistance (Rct). In the low frequency range, the plots also show sloping straight lines. This part reflects the diffusion characteristics of lithium ions within the electrode [62]. The electrode made of MoO3/MoS2@G-1100 exhibits a smaller semi-circle diameter (40.71 Ω) than other samples, namely −900, −1000, −1200 and C-MoS2; 63.65, 53.65, 62.9 and 263.8 Ω, respectively. This indicates the higher charge transfer resistance in the latter. The smaller electrochemical resistance observed in the MoO3/MoS2@G-1100 is consistent with the micrographs of Figure 4, indicating to the presence of integrated components with interfacial molybdenum oxycarbide that reduces the interfacial resistance across the sample.
The Li-ion diffusion (DLi) involved in the electrochemical process discussed above can be calculated as follows [63]:
D L i = R 2 T 2 2 A 2 n 4 F 4 C 2 σ 2
Here, R and F represent the gas and Faraday constants, respectively, T is temperature (298 K) and n is the number of participating electrons (n = 1). C represents the concentration of Li+. The electrode surface area of the electrode (A) was calculated based on the diameter of the electrode (1.1 cm2). Moreover, σ represents the Warburg factor which is determined based on the slope of the line Z′ ∼ ω−1/2 shown in Figure 9b, considering that ω = 2Πf (f = frequency, Hz). The kinetic parameters of the electrode were determined from the equivalent circuit fitting of Nyquist plots (Figure 9a), and shown in Table 4. At low values of frequency, the MoO3/MoS2@G-1100 electrode exhibits a high slope (9.77 Ω s−1/2) which demonstrates the relatively high lithium ion diffusion coefficient [64]. The lithium ion diffusion coefficient of MoO3/MoS2@G-900, -1000, -1100, -1200 and C-MoS2 electrodes could be calculated to be 8.7 × 10⁻²¹, 1.8 × 10⁻²⁰, 1.2 × 10⁻¹⁸, 5.3 × 10⁻²¹ and 1.0 × 10⁻²¹, respectively. The larger DLi in the earlier can be related to the shorter diffusion pathways available in the electrode, brought about by the presence of integrated hexagonal MoS2 nanocrystals and graphene nanosheets as shown in Figure 4.

2.10. Contribution of Diffusion- and Surface-Phenomena

We also evaluated the contribution of diffusion- and surface-phenomena to the overall Li-ion storage performance of the MoO3/MoS2@G-1100 electrode. Figure 9c exhibits CV curves recorded on the electrode at various scan rates from 0.1 to 0.5 mV s−1. It should be mentioned that the current intensity (i) and the sweep rate (ʋ) can be related by Equations (10) and (11) [65]:
i = a × ʋb
log i = log a + b × log ʋ
Here, a and b are dimensionless variables. Figure 9d could be established by plotting the logarithmic dependence between the current values related to various peaks shown in Figure 9c and the corresponding values of sweep rates. Based on the results obtained, the relative contributions of pseudocapacitive (vs. the diffusion-controlled events) to the total current could be found to be in the range 39–60% at different sweep rates, as exhibited in Figure 9e.
It can be seen that the contribution of pseudocapacitive processes to the total current is proportional to the scan rate: higher scan rate, the greater contribution. As such, the pseudocapacitive contribution can directly influence the high-rate performance of the electrode, as shown in Figure 7c. Figure 9f exhibits the pseudocapacitive contribution to the total current at 0.5 mV s−1.
Moreover, in Equation (11), the b value depends on the Li-ion storage mechanism. The value of b = 0.5 represents a diffusion-dominated process, while b = 1 represents the pseudocapacitive processes. The be values between 0.5 and 1 represent process involving both pseudocapacitive and diffusion-based process with various contribution ratio depending of the b-value [66,67]. As can be seen from Figure 9d, the value of b for the peaks 1, 2, 3, 4, 5, and 6 are obtained to be 0.95, 0.82, 0.79, 0.46, 0.81and 0.75, respectively. It confirms that all current peaks are mainly dominated by pseudocapacitive processes, unless the anodic peak 4 with the b value of 0.46, representing diffusion based processes. The pseudocapacitive-oriented nature of the peaks mentioned above can be explained based of the integrated nanostructure of the sample (Figure 4) that promotes the Li-ion diffusion and charge transfer the electrode/electrolyte interfaces across the electrode. In contrast, the anodic peak 4 located at 0.20 V, with the b-value of 0.46, corresponds to de-intercalation of Li+ out of the thicker graphitic flakes present in the sample.

3. Discussion

We have successfully developed a green, simple process for the conversion of the abundant and low-cost natural graphite and widely available MoS2 into nanostructured MoO3/MoS2@Graphene. In this process, the oxidation of MoS2 in the presence of graphite leads to the formation of α-MoO3 with orthorhombic crystalline structure, as well as hexagonal MoS2 nanocrystals. At 900 and 1000 °C, the molten salt promotes the catalytic exfoliation of the natural graphite into graphene nanosheets, incorporated with hexagonal MoS2 crystals and α-MoO3, denoted as MoO3/MoS2@G-900, and -1000, respectively. The further development of MoS2 oxidation at 1100 °C, resulted in the formation of MoO3/MoS2@G-1100, containing the maximum amount of MoO3 among all samples. The highest amount of MoO3 in this sample combined with the presence of integrated graphene nanosheets and hexagonal MoS2 provide the sample with the greatest value of Li-ion storage capacity about 773.5 mAh g−1 after 180 cycles at a current density of 100 mA g−1. The formation of molybdenum oxycarbide between MoO3 and graphene nanosheets was suggested as the cause of reduced charge-transfer resistance (53.56 Ω).
At the processing temperature of 1200 °C, the content of MoO3 is the minimum among all samples, but the electrochemical performance of the sample (MoO3/MoS2@G-1200) is second only to that of the sample prepared at 1100 °C, with a Li-ion storage capacity of about 505.9 mAh g−1 after 180 cycles at a current density of 100 mA g−1 (Table 3). Interestingly, the high Li-ion storage capacity of the sample prepared at 1200 °C was corresponded to the formation of thermodynamically metastable monoclinic molybdenum trioxide (β-MoO3), instead of conventional orthorhombic α-MoO3 which appears at 900–1100 °C. β-MoO3 is known to have a highly ionically conductive open structure [41], improving the electrochemical performance of the material. Selected number of methods employed in the literature for the preparation of molybdenum compounds, and their electrochemical performances are compared with those of MoO3/MoS2@G-1100 in Table 5. Methods shown in this table typical use expensive and/or hazardous materials such as (NH4)6Mo7O24∙4H2O [27,28], MoO3 [29], (NH4)2MoO4 [32], and metallic Mo powders [33], in combination with materials such as CH4N2S [27], HNO3 [28], glacial acetic acid [29], HCl [32], and H2O2 [33]. The excessive use of such chemicals limits the large-scale implementation of these methods. In the method reported here, ball milling is applied to incorporate natural graphite and MoS2 in the presence of hexane and NaCl. Both hexane and NaCl can be retrieved from the mixture after ball-milling, and the final washing step, respectively. Nevertheless, the method reported here requires heating at elevated temperatures which might provide some limitations. Utilization of industrial heat waste can be an option to enhance the economic features of the method.
In this research, the structural, morphological and optical properties of raw materials and products obtained at various temperatures were evaluated using a combination of various techniques, based on which the possible mechanism involved in the catalytic formation of hexagonal MoS2 nanocrystals upon the thermal treatment of MoS2 in the presence of natural graphite flakes in the molten salt environment was proposed. The formation of hexagonal MoS2 observed in this work is interesting, in comparison with alternative methods used for the preparation of hexagonally-shaped crystals from the literature, as exhibited in Figure S12 and Table S3. These methods include high-temperature sulfidation [31,32], electrochemical exfoliation [34], and chemical vapor deposition [35,36], using chemicals such as (NH4)2MoS4 [31], pure Mo and S [32], WxOy [26], and Na2SO4 [34]. In contrast, this work proposes a simple and facile method for the preparation of hexagonal MoS2, and ultimately MoO3/MoS2@G samples using highly available and low-cost precursors comprising of MoS2, natural graphite minerals and NaCl, as highlighted in Table 6 and Table S3. The process is rapid and requires only a short-time heating at 1100 °C. Despite the simple and clean preparation method, the electrode made of MoO3/MoS2@G-1100 exhibits a decent Li-ion storage performance. Modification of naturally available materials for energy-storage [68,69,70] and other demanding applications [71,72,73] is a viable strategy to meet the increasing green energy demand. In this research, we explored the effect of heating at various temperatures on the ball-milled natural graphite/MoS2/NaCl mixture for a short period of 20 min to demonstrate that the process of fabricating MoO3/MoS2@G samples is considerably fast. The influence of heating time on characteristics of the products needs to be explored in future studies. It should be mentioned that at 900–1200 °C, the interaction between components occurs in molten NaCl, which can effectively reduce the reaction between carbon and oxygen forming CO/CO2 species. According to Figures S9 and S10, further heating of MoO3/MoS2@G-900 in the absence of NaCl to 1200 °C in air leads to the oxidation of carbon and MoS2 to form CO/CO2 species and MoO3, respectively, highlighting the effect of NaCl. The influence of other salts on the process is worth investigation in future.

4. Materials and Methods

4.1. Synthesis of MoS2/MoO3@Graphene Nanocomposites

A simple and scalable ball-milling–molten salt strategy was used to synthesize MoS2/MoO3@Graphene nanocomposites. In a typical experiment, molybdenum disulfide (MoS2 99.5%, Aladdin CAS-1317-33-5), natural graphite powder (collected from a graphite mine in Hunan province of China) and sodium chloride (NaCl, >99%) (10:5:100 g, respectively) were thoroughly mixed, and the mixture was placed into 500 mL polymeric jars. The ball-milling was performed using zirconia balls with ball: powder weight ratio of 10:1, in the presence of n-hexane. The latter was employed to prevent the occurrence of agglomeration during the ball milling process [74], and partial exfoliation of the non-purified natural graphite and MoS2 [75,76]. The ball milling was performed for 2 h at 230 rpm using a high-energy planetary mill (MITR QM-QX-2L). After ball milling, the samples obtained were dried at 100 °C for 5 h to remove the hexane, and heat-treated at various temperatures of 900–1200 °C for 20 min in air. The heating was performed at 6 °C min−1. The samples obtained were employed for various characterizations as described below. Figure 1 exhibits the process used to fabricate the samples. The amount of raw materials used and products obtained through the process are shown in Table 6.

4.2. Morphological, Structural and Surface Characterizations

A scanning electron microscope (SEM, Zeiss Ultra Plus, Oberkochen, Germany) equipped with energy dispersive X-ray spectrometer (EDS, Oxford Instruments, High Wycombe, UK) and a transmission electron microscope (TEM, JEOL JEM-F200, Tokyo, Japan) were used for morphological studies. X-Ray diffractometry (XRD, Malvern Panalytical, Malvern, UK) and fluorescence spectrometry (XRF, ZSX Primus, Rigaku, Japan) were used for phase and chemical analysis, respectively. N2 adsorption-desorption evaluation was performed using a Micrometrics Tristar Ⅱ 3020 to examine the surface characteristics of the samples, where the pore size distribution was obtained using the desorption branch of the isotherms. X-ray photoelectron spectroscopy (XPS, Thermo Scientific Instrument, East Grinstead, UK) was employed for surface evaluation using Al-Kα rays as the excitation source (1486.6 eV).

4.3. Electrochemical Characterizations

Various electrochemical evaluations were performed on the synthesized MoS2/MoO3@Graphene samples and MoS2. Accordingly, cycling and rate performances as well as cyclic voltammetry were evaluated using two-electrode half-cells. For the fabrication of the working electrode, a mixture of active materials (MoS2/MoO3@Graphene or MoS2), C45 conductive carbon and polystyrene acrylic-acrylate (mass ratio of 7:2:1) were thoroughly ground employing water solvent. Then, the slurry was distributed uniformly onto a copper foil (200 μm). After drying at 80 °C (10 h), the electrodes with the active material mass loading of around 1.1 mg cm−2 were obtained. CR-2025 coin cells were assembled using metallic Li discs as both the reference/counter electrode. For this, the solution containing 1.0 M lithium LiPF6 in EC:DEC:EMC (1:1:1 wt%) was used as the electrolyte. In addition, Celgard 2400 films were employed as the separator. Coin cells were assembled in a glove-box (Mikrouna) under high purity Ar (O2 and H2O < 0.1 ppm). The cells were left for 10 h to equilibrate at room temperature, and subsequently evaluated using various techniques. Galvanostatic discharge/charge tests were performed within on a Land CT2001A battery testing instrument. Electrochemical impedance spectroscopy (EIS) and cyclic voltammetry at various scan rates and were conducted using a CHI 660E electrochemical interface.

5. Conclusions

In summary, we proposed a green and simple catalytic molten salt strategy for the conversion of commercial MoS2, natural graphite and NaCl into MoO3 nanoribbons crystals integrated with hexagonal MoS2 nanocrystals and graphene nanosheets. The formation of interfacial molybdenum oxycarbide between graphene and MoO3 is suggested, contributing to the reduced resistance of the hybrid material. The method is simple, involving the mechanochemical processing of the precursor materials, followed by a heat treatment process at 900–1200 °C in air for the duration of 20 min. The temperature was found to have a significant influence on the composition and morphology of the products. In this process, the thermal oxidation of MoS2 causes the formation of molybdenum oxides, and also the formation of highly crystalline hexagonal MoS2 nanocrystals integrated with graphene nanosheets. The Li-ion storage performances of hybrid nanostructures fabricated at various temperatures 900–1200 °C, namely MoO3/MoS2@G-900, -1000, -1100 and -1200 were evaluated. MoO3/MoS2@G-1100 was found to be capable of delivering a relatively high initial coulombic efficiency of 79.58% with a reversible capacity of 773.5 mAh g−1 (100 mA g−1) after 180 cycles, outperforming other electrodes. This behavior was attributed to the highest content of MoO3 in MoO3/MoS2@G-1100 and its unique microstructure. It was observed that MoO3/MoS2@G-1200 has the lowest amount of MoO3 among all samples, but its Li-ion storage performance was second only to MoO3/MoS2@G-1100, recording at 505.9 mAh g−1 after 150 cycles at 100 mAh g−1. The high performance of this sample was attributed to the presence β-MoO3 with a highly ionically conductive open-structure monoclinic crystalline structure that only formed at 1200 °C. The formation of β-MoO3 was concluded to contribute to the enhanced electrochemical performance of MoO3/MoS2@G-1200, despite its relatively low MoO3 content. Graphene generated from the natural graphite and the hexagonal MoS2 could be well-integrated, promoting both the electron and ion transportation across the electrode. Consequently, the contribution of pseudocapacitive Li-ion storage of the MoO3/MoS2@G-1100 electrode was characterized to be high at 59.31% under the scan rate of 0.5 mV s−1. This resulted in the high rate performance of the electrode, providing a capacity of 216 mAh g−1 after 50 cycles at 2 A g−1, and 106 mAh g−1 after 60 cycles at 5 A g−1. This paper proposes a green and low-cost synthesis route for the conversion of highly available MoS2 and non-purified natural graphite minerals into hexagonal molybdenum disulfide nanocrystals integrated with molybdenum trioxide and graphene nanosheets with enhanced Li-ion storage performance.

Supplementary Materials

The following supporting information can be downloaded at: https://www.mdpi.com/article/10.3390/catal13030499/s1, Figure S1: XRD patterns of MoO3/MoS2@G-900, MoO3/MoS2@G-1000, MoO3/MoS2@G-1100 and MoO3/MoS2@G-1200 around the (2 0 0) reflection of orthorhombic MoO3, and the (0 0 1) reflection of monoclinic MoO3; Figure S2: XRD pattern of MoO3/MoS2@G-900, MoO3/MoS2@G-1000, MoO3/MoS2@G-1100 and MoO3/MoS2@G-1200, around the (4 0 0) reflection of orthorhombic MoO3, and the (0 0 2) reflection of monoclinic MoO3; Figure S3: XRD patterns of MoO3/MoS2@G-900, MoO3/MoS2@G-1000, MoO3/MoS2@G-1100 and MoO3/MoS2@G-1200, around the (6 0 0) reflection of orthorhombic MoO3, and the (0 0 3) reflection of monoclinic MoO3.; Figure S4: Raman spectra of various precursor materials and products obtained at various temperatures.; Figure S5: UV-vis spectra of various precursor materials and products obtained at various temperatures; Figure S6: (αhv)1/2 versus hv plots according to UV–vis spectra of various precursor materials and products obtained at various temperatures; Figure S7: SEM image of (a) commercial MoS2 and the samples prepared at (b) 900, (c) 1000, (d) 1100, and (e–f) 1200 °C. (g) High magnification image taken of the sample prepared at 1200 °C, and (h) the EDS analysis recorded on hexagonal MoS2 shown in (g).; Figure S8: TEM micrographs of rod-like MoO3 observed in MoO3/MoS2@G-900; Figure S6: Summary of methods proposed for the preparation of hexagonally-shaped nanocrystals extracted from the literature; Figure S9: Appearance of MoO3/MoS2@G-1100, the same sample after heating at 1200 ℃ for 5 min.; Figure S10: XRD patterns of MoO3/MoS2@G-1100 and the sample obtained by heating of MoO3/MoS2@G-1100 at 1200 ℃ for 5 min; Figure S11: Cycling performance of MoO3/MoS2@G-1100 at 500 mA g−1; Figure S12: Summary of methods proposed for the preparation of hexagonally-shaped nanocrystals extracted from the literature; Table S1: XRD peak intensity ratio corresponding to various peaks in MoO3/MoS2@G-900, MoO3/MoS2@G-1000, MoO3/MoS2@G-1100 and MoO3/MoS2@G-1200; Table S2: Band gap values of various precursor materials and products obtained at various temperatures. and Table S3: A comparison between precursor materials and the methods used for the preparation of hexagonal crystals extracted from the literature, with those produced in the current study [31,32,33,34,35,36,77,78].

Author Contributions

Conceptualization, A.R.K.; methodology, A.R.K.; software, W.Z. and A.R.K.; validation, W.Z. and A.R.K.; formal analysis, W.Z. and A.R.K.; investigation, W.Z. and A.R.K.; resources, A.R.K.; data curation, W.Z. and A.R.K.; writing—original draft preparation, W.Z. and A.R.K.; writing—review and editing, A.R.K.; visualization, W.Z. and A.R.K.; supervision, A.R.K.; project administration, A.R.K.; funding acquisition, A.R.K. All authors have read and agreed to the published version of the manuscript.

Funding

This research was funded by the National Natural Science Foundation of China, grant number 52250610222. The APC for this invited article was waived by the journal Catalysts.

Data Availability Statement

Data is contained within the article and Supplementary Material.

Conflicts of Interest

The authors declare no conflict of interest.

References

  1. Zubi, G.; Dufo-López, R.; Carvalho, M.; Pasaoglu, G. The lithium-ion battery: State of the art and future perspectives. Renew. Sustain. Energy Rev. 2018, 89, 292. [Google Scholar] [CrossRef]
  2. Chen, W.D.; Liang, J.; Yang, Z.H.; Li, G. A Review of lithium-ion battery for electric vehicle applications and beyond. Energy Procedia 2019, 158, 4363. [Google Scholar] [CrossRef]
  3. Tian, Y.; Zeng, G.; Rutt, A.; Shi, T.; Kim, H.; Wang, J.; Koettgen, J.; Sun, Y.; Ouyang, B.; Chen, T.; et al. Promises and challenges of next-generation “beyond Li-ion” batteries for electric vehicles and grid decarbonization. Chem. Rev. 2021, 121, 1623–1669. [Google Scholar] [CrossRef] [PubMed]
  4. Li, R.; Kamali, A.R. Clean preparation of Fe2SiO4 coated Fe2O3 integrated with graphene for Li-ion storage application. Colloids Surf. A 2023, 656, 130275. [Google Scholar] [CrossRef]
  5. Turcheniuk, K.; Bondarev, D.; Amatucci, G.G.; Yushin, G. Battery materials for low-cost electric transportation. Mater. Today 2021, 42, 57–72. [Google Scholar] [CrossRef]
  6. Fang, S.; Bresser, D.; Passerini, S. Transition metal oxide anodes for electrochemical energy storage in lithium- and sodium-ion batteries. Adv. Energy Mater. 2020, 10, 1902485. [Google Scholar] [CrossRef]
  7. Zhang, H.; Yang, Y.; Ren, D.S.; Wang, L.; He, X.M. Graphite as anode materials: Fundamental mechanism, recent progress and advances. Energy Storage Mater. 2021, 36, 147–170. [Google Scholar] [CrossRef]
  8. Lee, S.; Youn, S.; Yong, C.; Chung, S.; Chui, Y.; Lee, S. High electrical and thermal conductivities of a PAN-based carbon fiber via boron-assisted catalytic graphitization. Carbon 2022, 199, 70–79. [Google Scholar] [CrossRef]
  9. Bonijoly, M.; Oberlin, M.; Oberlin, A. A possible mechanism for natural graphite formation. Int. J. Coal Geol. 1982, 1, 283–312. [Google Scholar] [CrossRef]
  10. Zhao, H.; Rezaei, A.; Kamali, A.R. Electrolytic conversion of natural graphite into carbon nanostructures with enhanced electrical conductivity and Na-ion storage performance. J. Electrochem. Soc. 2022, 169, 054512. [Google Scholar] [CrossRef]
  11. Zhao, L.; Ding, B.C.; Qin, X.Y.; Wang, Z.J.; Lv, W.; He, Y.B.; Yang, Q.H.; Kang, F.Y. Revisiting the roles of natural graphite in ongoing lithium-ion batteries. Adv. Mater. 2022, 32, 2106704. [Google Scholar] [CrossRef] [PubMed]
  12. U.S. Geological Survey. Mineral Commodity Summaries, Graphite (Natural), January 2022. Available online: https://pubs.usgs.gov/periodicals/mcs2022/mcs2022.pdf (accessed on 1 January 2022).
  13. Zaghib, K.; Song, X.; Guerfi, A.; Rioux, R.; Kinoshit, K. Purification process of natural graphite as anode for Li-ion batteries: Chemical versus thermal. J. Power Source 2003, 119–121, 8–15. [Google Scholar] [CrossRef]
  14. Zhao, Y.; Yang, L.; Ma, C.; Han, G. One-step fabrication of fluorine-doped graphite derived from a low-grade microcrystalline graphite ore for potassium-ion batteries. Energy Fuels 2020, 34, 8993–9001. [Google Scholar] [CrossRef]
  15. Ani, T.A.; Leinonen, S.; Ahtola, T.; Salvador, D. High-grade flake graphite deposits in metamorphic schist belt, central Finland—Mineralogy and beneficiation of graphite for lithium-ion nattery applications. Minerals 2020, 10, 680. [Google Scholar] [CrossRef]
  16. Asenbauer, J.; Eisenmann, T.; Kuenzel, M.; Kazzazi, A.; Chen, Z.; Bresser, D. The success story of graphite as a lithium-ion anode material—Fundamentals, remaining challenges, and recent developments including silicon (oxide) composites. Sustain. Energy Fuels 2020, 4, 5387–5416. [Google Scholar] [CrossRef]
  17. Stephenson, T.; Li, Z.; Olsena, B.; Mitlin, D. Lithium ion battery applications of molybdenum disulfide (MoS2) nanocomposites. Energy Environ. Sci. 2014, 7, 209. [Google Scholar] [CrossRef]
  18. Wang, W.; Qin, J.W.; Yin, Z.G.; Cao, M.H. Achieving fully reversible conversion in MoO3 for lithium ion batteries by rational introduction of CoMoO4. ACS Nano 2016, 10, 10106–10116. [Google Scholar] [CrossRef]
  19. Li, F.Y.; Cabrera, C.R.; Chen, Z.F. Theoretical design of MoO3-based high-rate lithium ion battery electrodes: The effect of dimensionality reduction. J. Mater. Chem. A 2014, 2, 19180. [Google Scholar] [CrossRef]
  20. Sahu, S.R.; Rikka, V.R.; Haridoss, P.; Chatterjee, A.; Gopalan, R.; Prakash, R. A novel α-MoO3/single-walled carbon nanohorns composite as high-performance anode material for fast-charging lithium-ion battery. Adv. Energy Mater. 2020, 10, 2001627. [Google Scholar] [CrossRef]
  21. Wang, T.X.; Li, J.; Zhao, G.L. Synthesis of MoS2 and MoO3 hierarchical nanostructures using a single-source molecular precursor. Powder Technol. 2014, 253, 347–351. [Google Scholar] [CrossRef]
  22. Yang, J.; Qu, Y.D.; Lin, X.H.; Wang, L.Y.; Zheng, Z.H.; Zhuang, J.; Duan, L.F. MoO3/MoS2 flexible paper as sulfur cathode with synergistic suppress shuttle effect for lithium-sulfur batteries. Electrochim. Acta 2022, 418, 140378. [Google Scholar] [CrossRef]
  23. Zhao, S.P.; Zha, Z.L.; Liu, X.; Tian, H.X.; Wu, Z.Y.; Li, W.F.; Sun, L.B.; Liu, B.; Chen, Z.G. Core−sheath structured MoO3@MoS2 composite for high performance lithium-ion battery anodes. Energy Fuels 2020, 34, 11498–11507. [Google Scholar] [CrossRef]
  24. Du, J.L.; Wu, H.D.; Wang, X.R.; Qi, C.Y.; Mao, W.; Ren, T.Q.; Qiao, Q.D.; Yang, Z.X. Ternary MoS2/MoO3/C nanosheets as high-performance anode materials for lithium-ion batteries. J. Electron. Mater. 2018, 47, 6767. [Google Scholar] [CrossRef]
  25. Vieira, L.; Neto, J.D.R.M.; Ferreira, O.P.; Torresi, R.M.; Torresi, S.I.C.D.; Alves, O.L. Template conversion of MoO3 to MoS2 nanoribbons: Synthesis and electrochemical properties. RSC Adv. 2018, 8, 30346–30353. [Google Scholar] [CrossRef]
  26. Pareek, A.; Kim, H.G.; Paik, P.; Borse, P.H. Ultrathin MoS2-MoO3 nanosheets functionalized CdS photoanodes for effective charge transfer in photoelectrochemical (PEC) cells. J. Mater. Chem. A 2017, 5, 1541. [Google Scholar] [CrossRef]
  27. Villevieille, C.; Wang, X.J.; Krumeich, F.; Nesper, R.; Novák, P. MoS2 coating on MoO3 nanobelts: A novel approach for a high specific charge electrode for rechargeable Li-ion batteries. J. Power Source 2015, 279, 636–644. [Google Scholar] [CrossRef]
  28. Liu, H.; Chen, X.J.; Deng, L.; Ding, M.; Li, J.Q.; He, X.M. Perpendicular growth of few-layered MoS2 nanosheets on MoO3 nanowires fabricated by direct anion exchange reactions for high performance lithium-ion batteries. J. Mater. Chem. A 2016, 4, 17764. [Google Scholar] [CrossRef]
  29. Li, B.; Yang, S.X.; Huo, N.J.; Li, Y.T.; Yang, J.H.; Li, R.X.; Fan, C.; Lu, F.Y. Growth of large area few-layer or monolayer MoS2 from controllable MoO3 nanowire nuclei. RSC Adv. 2014, 4, 26407. [Google Scholar] [CrossRef]
  30. Zhu, W.; Kamali, A.R. Green preparation of nanostructured β-MoO3/hexagonal-shaped MoS2/graphene with enhanced lithium-ion storage performance. J. Alloys Compd. 2023, 932, 167724. [Google Scholar] [CrossRef]
  31. Carlsson, A.; Brorson, M.; Topsoe, H. Supported metal sulphide nanoclusters studied by HAADF-STEM. J. Microsc. 2006, 223, 179. [Google Scholar] [CrossRef]
  32. Cai, G.M.; Jian, J.K.; Chen, X.L.; Lei, M.; Wang, W.Y. Regular hexagonal MoS2 microflakes grown from MoO3 precursor. Appl. Phys. 2007, 89, 783. [Google Scholar] [CrossRef]
  33. Li, P.G.; Lei, M.; Wang, X.F.; Tang, H.L.; Tang, W.H. Thermal conversion of tungsten oxide nanorods to tungsten disulfide nanoflakes. J. Alloys Compd. 2009, 474, 463. [Google Scholar] [CrossRef]
  34. Leong, S.X.; Mayorga-Martinez, C.C.; Chia, X.Y.; Luxa, J.; Sofer, Z.; Pumera, M. 2H → 1T phase change in direct synthesis of WS2 nanosheets via solution-based electrochemical exfoliation and their catalytic properties. ACS Appl. Mater. Interfaces 2017, 9, 26350. [Google Scholar] [CrossRef] [PubMed]
  35. Ai, R.Q.; Guan, X.; Li, J.; Yao, K.K.; Chen, P.; Zhang, Z.W.; Duan, X.D.; Duan, X.F. Growth of single-crystalline cadmium iodide nanoplates, CdI2/MoS2 (WS2, WSe2) van der waals heterostructures, and patterned arrays. ACS Nano 2017, 11, 3413. [Google Scholar] [CrossRef] [PubMed]
  36. Hu, Y.; Chen, T.; Wang, X.Q.; Ma, L.B.; Chen, R.P.; Zhu, H.F.; Yuan, X.; Yan, C.Z.; Zhu, G.Y.; Lv, H.L.; et al. Controlled growth and photoconductive properties of hexagonal SnS2 nanoflakes with mesa-shaped atomic steps. Nano Res. 2017, 10, 1434. [Google Scholar] [CrossRef]
  37. Qu, Q.; Zhang, W.B.; Huang, K.; Chen, H.M. Electronic structure, optical properties and band edges of layered MoO3: A first-principles investigation. Comput. Mater. Sci. 2017, 130, 242–248. [Google Scholar] [CrossRef]
  38. Kamali, A.R.; Fray, D.J. Solid phase growth of tin oxide nanostructures. Mater. Sci. Eng. B 2012, 177, 819–825. [Google Scholar] [CrossRef]
  39. He, Z.K.; Sun, Q.; Shi, Z.; Xie, K.; Kamali, A.R. Molten salt synthesis of oxygen-deficient SnO2 crystals with enhanced electrical conductivity. Appl. Surf. Sci. 2019, 465, 397–404. [Google Scholar] [CrossRef]
  40. Deng, X.Q.; Zhu, M.H.; Ke, J.; Feng, Y.F.; Li, W.R.; Xiong, D.P.; He, M. Synthesis and electrochemical performances of ternary nanocomposite SnO2@MoO3@graphene as high-performance anode material for lithium-ion batteries. Chem. Phys. Lett. 2021, 770, 138408. [Google Scholar] [CrossRef]
  41. Liu, X.X.; Wu, Y.; Wang, H.W.; Wang, Y.F.; Huang, C.F.; Liu, L.M.; Wang, Z.J. Two-dimensional β-MoO3@C nanosheets as high-performance negative materials for supercapacitors with excellent cycling stability. RSC Adv. 2020, 10, 17497–17505. [Google Scholar] [CrossRef]
  42. Zhu, J.; Uslamin, E.A.; Kosinov, N.; Hensen, E.J.M. Tuning the reactivity of molybdenum (oxy)carbide catalysts by the carburization degree: CO2 reduction and anisole hydrodeoxygenation. Catal. Sci. Technol. 2020, 10, 3635–3645. [Google Scholar] [CrossRef]
  43. Zheng, Y.; Tang, Y.; Gallagher, J.R.; Gao, J.; Miller, J.T.; Wachs, I.E.; Podkolzin, S.G. Molybdenum oxide, oxycarbide, and carbide: Controlling the dynamic composition, size, and catalytic activity of zeolite supported nanostructures. J. Phys. Chem. C 2019, 123, 22281–22292. [Google Scholar] [CrossRef]
  44. Kado, T. Epitaxial molybdenum oxycarbide thin films synthesized by inductively coupled radio-frequency plasma assisted magnetron sputtering. Thin Solid Film. 2006, 515, 2481–2484. [Google Scholar] [CrossRef]
  45. Shahsank, M.; Naik, H.S.B.; Sumedha, H.N.; Nagaraju, G. Implementing an in-situ carbon formation of MoO3 nanoparticles for high performance lithium-ion battery. Ceram. Int. 2021, 47, 10261–10267. [Google Scholar] [CrossRef]
  46. Yoon, A.; Kim, J.H.; Yoon, J.C.; Lee, Y.D.; Lee, Z. Van der Waals Epitaxial Formation of Atomic Layered α-MoO3 on MoS2 by Oxidation. ACS Appl. Mater. Interfaces 2020, 12, 19. [Google Scholar] [CrossRef] [PubMed]
  47. Kamali, A.R.; Fray, D.J. Molten salt corrosion of graphite as a possible way to make carbon nanostructures. Carbon 2013, 56, 121–131. [Google Scholar] [CrossRef]
  48. Kamali, A.R.; Yang, J. Effect of molten salts on the structure, morphology and electrical conductivity of PET-derived carbon nanostructures. Polym. Degrad. Stab. 2020, 177, 109184. [Google Scholar] [CrossRef]
  49. Kamali, A.R.; Schwandt, C.; Fray, D.J. On the oxidation of electrolytic carbon nanomaterials. Corros. Sci. 2012, 54, 307–313. [Google Scholar] [CrossRef]
  50. Kamali, A.R.; Divitini, G.; Schwandt, C.; Fray, D.J. Correlation between microstructure and thermokinetic characteristics of electrolytic carbon nanomaterials. Corros. Sci. 2012, 64, 90–97. [Google Scholar] [CrossRef]
  51. Wu, J.; Li, H.; Yin, Z.; Li, H.; Liu, J.; Cao, X.; Zhang, Q.; Zhang, H. Layer thinning and etching of mechanically exfoliated MoS2 nanosheets by thermal annealing in air. Small 2013, 9, 3314–3319. [Google Scholar]
  52. Zhou, H.; Yu, F.; Liu, Y.; Zou, X.; Cong, C.; Qiu, C.; Yu, T.; Yan, Z.; Shen, X.; Sun, L.; et al. Thickness-dependent patterning of MoS2 sheets with well-oriented triangular pits by heating in air. Nano Res. 2013, 6, 703–711. [Google Scholar] [CrossRef]
  53. Rao, R.; Islam, A.E.; Campbell, P.M.; Vogel, E.M.; Maruyama, B. In situ thermal oxidation kinetics in few layer MoS2. 2D Mater. 2017, 4, 025058. [Google Scholar] [CrossRef]
  54. Afanasiev, P.; Lorentz, C. Oxidation of nanodispersed MoS2 in ambient air: The products and the mechanistic steps. J. Phys. Chem. C 2019, 123, 7486–7494. [Google Scholar] [CrossRef]
  55. Spychalski, W.L.; Pisarek, M.; Szoszkiewicz, R. Microscale insight into oxidation of single MoS2 crystals in air. J. Phys. Chem. C 2017, 121, 26027–26033. [Google Scholar] [CrossRef]
  56. Szoszkiewicz, R.; Rogala, M.; Dąbrowski, P. Surface-bound and volatile Mo oxides produced during oxidation of single MoS2 crystals in air and high relative humidity. Materials 2020, 13, 3067. [Google Scholar] [CrossRef]
  57. Kamali, A.R. Green Production of Carbon Nanomaterials in Molten Salts and Applications; Springer Nature: Berlin/Heidelberg, Germany, 2020. [Google Scholar]
  58. Hu, X.L.; Zhang, W.; Liu, X.X.; Mei, Y.N.; Huang, Y.H. Nanostructured Mo-based electrode materials for electrochemical energy storage. Chem. Soc. Rev. 2015, 44, 2376. [Google Scholar] [CrossRef] [PubMed]
  59. Liu, Y.; Zhu, J.X.; Xu, J.S.; Liu, S.L.; Li, L.; Zhang, C.; Liu, T.X. High-temperature solvent-free sulfidation of MoO3 confined in a polypyrrole shell: MoS2 nanosheets encapsulated in a nitrogen, sulfur dual-doped carbon nanoprism for efficient lithium storage. Nanoscale 2018, 10, 7536–7543. [Google Scholar] [CrossRef]
  60. Li, J.; Hou, S.; Liu, T.Z.; Wang, L.K.; Mei, C.; Guo, Y.Y.; Zhao, L.Z. Hierarchical hollow-nanocube Ni−Co skeleton@MoO3/MoS2 hybrids for improved-performance lithium-ion batteries. Chem. Eur. J. 2020, 26, 2013–2024. [Google Scholar] [CrossRef] [PubMed]
  61. Zhou, H.; Xia, X.; Lv, P.; Zhang, J.; Hou, X.; Zhao, M.; Ao, K.; Wang, D.; Lu, K.; Qiao, H.; et al. C@TiO2/MoO3 composite nanofibers with 1T-phase MoS2 nanograin dopant and stabilized interfaces as anodes for Li- and Na-ion batteries. ChemSusChem 2018, 11, 4060–4070. [Google Scholar] [CrossRef]
  62. Liu, H.W.; Wang, J. One-pot synthesis of ZnCo2O4 nanorod anodes for high power Lithium ions batteries. Electrochim. Acta 2013, 92, 371. [Google Scholar] [CrossRef]
  63. Zhang, J.J.; He, P.; Xia, Y.Y. Electrochemical kinetics study of Li-ion in Cu6Sn5 electrode of lithium batteries by PITT and EIS. J. Electroanal. Chem. 2008, 624, 161. [Google Scholar] [CrossRef]
  64. Lei, D.; Shang, W.Z.; Zhang, X.; Li, Y.P.; Qiao, S.M.; Zhong, Y.P.; Deng, X.Y.; Shi, X.S.; Zhang, Q.; Hao, C.; et al. Facile synthesis of heterostructured MoS2-MoO3 nanosheets with active electrocatalytic sites for high-performance lithium−sulfur batteries. ACS Nano 2021, 15, 20478–20488. [Google Scholar] [CrossRef]
  65. Zhao, B.; Song, D.Y.; Ding, Y.W.; Li, W.R.; Wang, Z.X.; Jiang, Y.; Zhang, J.J. Size-tunable SnS2 nanoparticles assembled on graphene as anodes for high performance lithium/sodium-ion batteries. Electrochim. Acta 2020, 354, 13673. [Google Scholar] [CrossRef]
  66. Zhang, P.C.; Cai, B.; Feng, Y.; Pan, H.; Yao, J.F. Constructing MoO3@MoO2 heterojunction on g-C3N4 nanosheets with advanced Li-ion storage ability. J. Alloys Compd. 2021, 875, 160077. [Google Scholar] [CrossRef]
  67. Kamali, A.R.; Li, S. Molten salt-assisted valorization of waste PET plastics into nanostructured SnO2@terephthalic acid with excellent Li-ion storage performance. Appl. Energy 2023, 334, 120692. [Google Scholar] [CrossRef]
  68. Zhu, W.; Kamali, A.R. Green molten salt synthesis and Li-ion storage performance of sodium dimolybdate. J. Alloys Compd. 2020, 831, 154781. [Google Scholar] [CrossRef]
  69. Kamali, A.R.; Ye, J. Reactive molten salt modification of ilmenite as a green approach for the preparation of inexpensive Li ion battery anode materials. Miner. Eng. 2021, 172, 107175. [Google Scholar] [CrossRef]
  70. Zhuan, Y.; Ma, J.L.; Feng, W.J. Highlighting the implantation of metal particles into hollow cavity yeast-based carbon for improved electrochemical performance of lithium–sulfur batteries. Catalysts 2022, 12, 951. [Google Scholar] [CrossRef]
  71. Zeng, G.; Wang, J.; Dai, M.; Meng, Y.; Luo, H.; Lin, L.; Zang, K.; Meng, Z.; Pan, X. Natural iron minerals in an electrocatalytic oxidation system and in situ pollutant removal in groundwater: Applications, mechanisms, and challenges. Sci. Total Environ. 2023, 871, 161826. [Google Scholar] [CrossRef]
  72. Enneffatia, M.; Rasheed, M.; Louatia, B.; Guidaraa, K.; Shihab, S.; Barillé, R. Investigation of structural, morphology, optical properties and electrical transport conduction of Li0.25Na0.75CdVO4 compound. J. Phys. Conf. Ser. 2021, 1795, 012050. [Google Scholar] [CrossRef]
  73. Rasheed, M.; Shihab, S.; Sabah, O.W. An investigation of the Structural, Electrical and Optical Properties of Graphene-Oxide Thin Films Using Different Solvents. J. Phys. Conf. Ser. 2021, 1795, 012052. [Google Scholar] [CrossRef]
  74. Nazarian-Samani, M.; Kamali, A.R.; Mobarra, R.; Nazarian-Samani, M. Phase transformations of Ni-15 wt. % B powders during mechanical alloying and annealing. Mater. Lett. 2010, 64, 309–312. [Google Scholar] [CrossRef]
  75. Seifi, T.; Kamali, A.R. Enhanced dispersion and antibacterial activity of mechanically exfoliated graphite flakes in the presence of n-hexane and NaCl. Mater. Lett. 2021, 304, 130730. [Google Scholar] [CrossRef]
  76. Seifi, T.; Kamali, A.R. The influence of mechanochemical treatment in hexane on dispersibility and floatability of graphite flakes with enhanced water evaporation performance. Colloids Surf. A 2022, 638, 128326. [Google Scholar] [CrossRef]
  77. Wang, Z.G.; Lia, Q.; Xu, H.X.; Dahl-Petersen, C.; Yang, Q.; Cheng, D.J.; Cao, D.P.; Besenbacher, F.; Lauritsen, J.V.; Helveg, S.; et al. Controllable etching of MoS2 basal planes for enhanced hydrogen evolution through the formation of active edge sites. Nano Energy 2018, 49, 634–643. [Google Scholar] [CrossRef]
  78. Yorulmaz, B.; Özden, A.; Şar, H.; Ay, F.; Sevik, C.; Perkgöz, N.K. CVD growth of monolayer WS2 through controlled seed formation and vapor density. Mater. Sci. Semicond. Process. 2019, 93, 158. [Google Scholar] [CrossRef]
Figure 1. The process employed to convert natural graphite mineral and commercially available MoS2 into nanostructured materials for energy-storage application.
Catalysts 13 00499 g001
Figure 2. (a) SEM micrograph of the non-purified natural graphite material, and (bi) corresponding elemental EDS mapping analysis exhibiting the distribution of various elements.
Catalysts 13 00499 g002
Figure 3. XRD patterns of various precursor materials and products: (a) the non-purified natural graphite material, (b) the commercial MoS2, (c) the mixture after ball milling; and (dg) nanostructured materials obtained at various temperatures.
Catalysts 13 00499 g003
Figure 4. SEM micrographs of (a) commercial MoS2, (b) natural graphite, and (c,d) MoO3/MoS2@G-1100. (eh) TEM micrographs of MoO3/MoS2@G-1100. (i) FFT pattern recorded on the micrograph (h).
Catalysts 13 00499 g004
Figure 5. High resolution XPS spectra of MoO3/MoS2@G-1100, around (a) Mo 3d, (b) O 1s, (c) S 2p, and (d) C 1s peaks.
Catalysts 13 00499 g005
Figure 6. Nitrogen adsorption–desorption isotherms of MoO3/MoS2@G-1100.
Catalysts 13 00499 g006
Figure 7. Li-ion storage performances of various electrodes. (a) Cycle performance of various electrodes. (b) Cycle performance, and (c) rate performance of C-MoS2 in contrast with those of MoO3/MoS2@G-1100. (d) Potential-capacity curve of MoO3/MoS2@G-1100 electrode. All measurements were recorded at 100 mA g−1, unless indicated otherwise.
Catalysts 13 00499 g007
Figure 8. CV curve of MoO3/MoS2@G-1100 electrode recorded at 0.5 mV/s.
Catalysts 13 00499 g008
Figure 9. (a) AC impedance spectra of MoO3/MoS2@G and C-MoS2 electrodes. (b) The values of Z′ vs. ω−1/2 (ω = 2Πf) for MoO3/MoS2@G and C-MoS2. (cf): Contribution of pseudocapacitive Li-ion storage to the total capacity of the MoO3/MoS2@G-1100 electrode: (c) CV curves with scan rates raging 0.1 to 0.5 mV s−1; (d) the logarithmic dependence between the peak current and sweep rate; (e) contribution of pseudocapacitive and diffusion-based processes to the total current at different sweep rates, and (f) the pseudocapacitive contribution at 0.5 mV s−1.
Catalysts 13 00499 g009
Table 1. Quantitative XRF analysis of the natural graphite material (wt%).
CSiO2Al2O3CaOFe2O3K2OS
74.39.276.922.972.292.172.08
Table 2. XRF quantitative analysis of the MoO3/MoS2@G samples prepared at various temperatures.
SampleSMoCSiAlFeCaO
MoO3/MoS2@G-9005.7844.3322.65.151.921.651.6916.88
MoO3/MoS2@G-10005.5945.1823.36.362.421.151.7414.26
MoO3/MoS2@G-11002.7246.0117.86.782.481.561.6521.00
MoO3/MoS2@G-120010.248.4815.65.962.071.821.1814.69
Table 3. The electrochemical performance of commercial MoS2 (C-MoS2) in comparison with those of MoO3/MoS2@G nanostructured materials.
ElectrodeInitial Coulombic Efficiency (%)Specific Capacity
after 100 Cycles
(mAh/g)
Specific Capacity after 150 Cycles (mAh/g)
C-MoS285.1394.873.5
MoO3/MoS2@G-90070.64444.1442.8
MoO3/MoS2@G-100071.13422.2472.7
MoO3/MoS2@G-110079.58616.3721.2
MoO3/MoS2@G-120078.36560.1505.9
Table 4. Electrode kinetic parameters for the MoO3/MoS2@G and C-MoS2 electrodes.
SampleRe (Ω)Rct (Ω)σ (Ω s−1/2)DLi (cm2 s−1)
MoO3/MoS2@G-9006.9063.65114.618.7 × 10−21
MoO3/MoS2@G-10006.5653.5679.391.8 × 10−20
MoO3/MoS2@G-11002.2140.719.771.2 × 10−18
MoO3/MoS2@G-12003.9262.9146.535.3 × 10−21
C-MoS23.56263.8334.491.0 × 10−21
Table 5. A comparison between selected MoO3/MoS2 materials extracted from the literature, and MoO3/MoS2@G-1100 prepared here, in terms of the precursor materials, preparation method, and the electrochemical performance.
Mo-Oxide Based
Material
Precursor MaterialsPreparation ProcessPerformance
Capacity (mAh/g)/Cycle/Current Density (mA/g)
Core−sheath structured MoO3@MoS2 composite [23]Rhododendron petals, (NH4)6Mo7O24·4H2O, CH4N2SIn situ growth at 550 °C (2 h) + 180 °C (24 h)400/30th/200
Ternary MoS2/MoO3/C nanosheets [24]Organic amine, MoO3CVD at 800 °C (3 h) under N2961.4/120th/430
MoO3/MoS2 nanoribbons [25]Molybdic acid, glacial acetic acidHydrothermal treatment at 800 °C (30 min)-
MoS2/MoO3 nanosheets [26]CdCl2, (NH)2CS, (NH4)2MoO4,
NH2OH.HCl
Hydrothermal treatment at 180 °C (30 h)-
MoS2 coated MoO3 nanobelts [27]Mo metal powder
10 mL H2O2
Hydrothermal treatment at 180 °C (12 h)1400/50th/100
MoS2 nanosheets on MoO3 nanowires [28](NH4)6Mo7O24·4H2O, HNO3,thioureaHydrothermal treatment at 180 °C (24 h)800/100th/100
Core-shell MoO3/MoS2 nanowires [29]MoO3 powders, sulfur, N2Thermal treatment at 700 °C
MoS2/MoO3@graphene [This work]MoS2, natural graphite, NaClHeating at 1100 °C (20 min)316/40th/1000
774/180th/100
Table 6. Amounts of raw materials used and the resultant products obtained at various temperatures.
Raw MaterialMoS2 (10 g)-NaCl (100 g)-Graphite (5 g)
Ball-milled sample112.00 g
Heat-treatment Temperature 900 °C 1000 °C 1100 °C 1200 °C
Sample MoO3/MoS2@G-900MoO3/MoS2@G-1000MoO3/MoS2@G-1100MoO3/MoS2@G-1200
Before heat-treatment28.00 g28.00 g28.00 g28.00 g
After washing3.312.602.292.45
Disclaimer/Publisher’s Note: The statements, opinions and data contained in all publications are solely those of the individual author(s) and contributor(s) and not of MDPI and/or the editor(s). MDPI and/or the editor(s) disclaim responsibility for any injury to people or property resulting from any ideas, methods, instructions or products referred to in the content.

