Abstract
SnO2 nanoparticles have frequently been reported as effective electrocatalysts for CO2 electroreduction to formate. However, in the literature, there is little knowledge of SnO2 nanoparticles that guarantee superior electrocatalytic performance. Hence, in this study, several SnO2 nanoparticles are compared with respect to their material properties, and correlations to the electrocatalytic performance are established. For comparison, three custom-made SnO2-electrocatalysts were prepared, reproducing frequently cited procedures in literature. Based on the comparison, it is found that hydrothermal, sol-gel, and solid-state synthesis provide quite different electrocatalysts, particularly in terms of the particle size and crystal lattice defect structure. Desirably small nanoparticles with a comparatively high number of lattice defects are found for the nanoparticles prepared by hydrothermal synthesis, which also provide the best electrocatalytic performance in terms of Faradaic efficiency for the electroreduction of CO2 to formate. However, despite the considerably smaller surface area, the commercial reference also provides significant electrocatalytic performance, e.g., in terms of the overall produced amount of formate, which suggests a surprisingly high surface area-specific activity for this material that is low on defects. Thus, defects do not appear to be the preferred reaction site for the CO2 electroreduction to formate on SnO2 in this case.
1. Introduction
Power-to-X technologies are an effective means of tackling the transition of the global energy system towards a fossil-free energy scenario. With ‘X’ representing a variable for heat, energy carriers, or even metals and base chemicals, power-to-X subsumes all technologies, which are capable of converting excess (renewable) electricity into other resources that are required by other sectors or stored and reconverted easily. Furthermore, by using carbon dioxide (CO2) from exhaust gas streams as an educt, power-to-X technologies may contribute to the reduction of CO2 emissions, closing the inherently open carbon cycle by the production of base chemicals such as formate (X = formate, HCOO−) [1,2,3,4,5,6].
Stannic oxide (tin dioxide, SnO2) is a versatile semiconducting material with various applications in modern devices such as gas sensors [7], batteries [8], and other fields [9]. Moreover, SnO2 is also an effective electrocatalyst for the electrocatalytic reduction reaction of CO2 (CO2ERR) to formate [10,11,12,13,14,15,16,17,18]. Given the vast number of applications, the preparation of SnO2 is subject to many research papers. One line of development is the synthesis of novel material morphologies ranging from thin films [19] and catalytically active nanosheets [20] to nanoparticles [21,22,23,24,25,26,27,28,29]. Among these forms, nanoparticles offer the unique property of a large surface area combined with excellent integrability into the active layer of gas diffusion electrodes (GDEs), making SnO2 nanoparticles well-suited for applications in high-performance CO2 electrolyzers [10]. Recent studies have shown that SnO2 nanoparticles may catalyze the CO2ERR to formate starting at an electrode potential of −0.55 V vs. the reversible hydrogen electrode (RHE) [16,30] and may be operated at current densities of up to 500 mA⋅cm−2, if applied to GDEs, while still yielding high Faradaic efficiencies (FEs) of 90% [10].
The main product for the CO2ERR using SnO2 as an electrocatalyst is formate [10,11,12,13,14,15,16,17,18], while Sn itself is also a suitable element for the CO2ERR to formate [31,32]. Side products for the CO2ERR on SnO2 are CO and H2 [10,11,12,13,14,15,16,17,18], with the latter being the result of the hydrogen evolution reaction (HER). However, the HER and CO evolution on SnO2 may not be significant in comparison to the CO2ERR to formate in case the electrocatalyst and the process conditions were thoroughly chosen. In fact, the FE for the CO2ERR to formate may be as high as 98% using SnO2-ZnO composite electrocatalysts [11] or 92% using SnO2 on porous carbon [30].
Given the prominence of SnO2, plenty of nanoparticle synthesis procedures have been reported in the literature. To provide a rough overview, the synthesis procedures may be classified according to their approach, e.g., hydrothermal, solid-state, or sol-gel methods [21,22,23,24,25,26,27,28,29]. However, although recent literature provides valuable information regarding potential preparation procedures, a systematic correlation with electrocatalytic properties has not been established. Therefore, the purpose of the present investigation is to directly compare different SnO2 nanoparticles and to report on the correlation of their physico-chemical properties and the electrocatalytic activity for the CO2ERR to formate. The study focuses on three custom-made electrocatalysts in comparison to a commercial material, reproducing frequently cited procedures in the literature and extending their scope by an application of the nanoparticles for CO2ERR. The individual materials are prepared by a hydrothermal [21], a solid-state [24], and a sol-gel [27] procedure. Considering these, this study particularly involves the utilization of the rotating-disk electrode (RDE), which is frequently applied to hydrogen and oxygen electrocatalysis research [33,34] but has rarely been applied to CO2ERR. The RDE experiment foremost allowed for a direct view of the electrocatalytic activity of the investigated materials, given the absence of catalyst support structures such as active carbon layers or carbon fibers, which are typical components of GDEs in full-cell setups [18,35]. Furthermore, the RDE experiment provided the best control over the local environment of the electrocatalyst, ensuring optimal comparability of the experimental results. With this, the present study provides an exemplary investigation of important material properties and allows for an objective choice of the SnO2 electrocatalyst used for the CO2ERR to formate.
2. Results
2.1. Physico-Chemical Characterization of the SnO2 Nanoparticles
Figure 1 depicts a photograph of the investigated SnO2 electrocatalysts, which exhibit clear differences in color. While SnO2 nanoparticles typically show a plain white color such as the commercial SnO2 (SnO2 (Commercial)) and the SnO2 prepared by hydrothermal synthesis (SnO2 (Hydrothermal)), the other two materials prepared by solid-state and sol-gel synthesis (SnO2 (Solid-State) and SnO2 (Sol-Gel)) present a gray or light-gray color, respectively, suggesting oxygen deficiency [36].
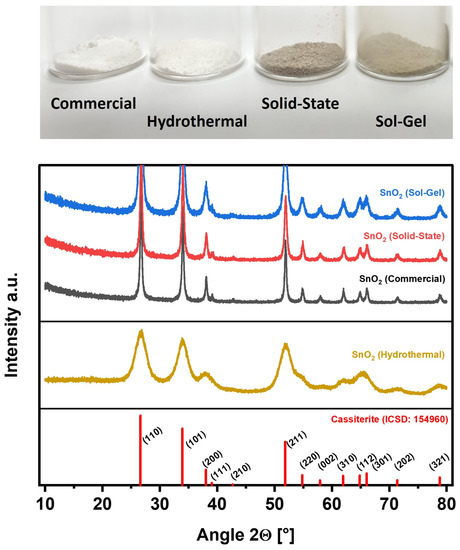
Figure 1.
Investigated SnO2 nanoparticles. Top: Photograph of the individual samples as prepared. Bottom: Corresponding XRD patterns (Reference: Pattern of Cassiterite from the Inorganic Crystal Structure Database (ICSD: 154960) [37].
The XRD patterns in Figure 1 show that the custom syntheses of SnO2 (Hydrothermal), SnO2 (Solid-State), and SnO2 (Sol-Gel) provided phase-pure SnO2 as identified by the Inorganic Crystal Structure Database (Cassiterite, ICSD: 154960). For SnO2 nanoparticles, the XRD reflexes are allocated as follows: 26.62° (110), 33.92° (101), 38.00° (200), 39.04° (111), 42.68° (210), 51.84° (211), 54.82° (220), 57.92° (002), 61.94° (310), 64.84° (112), 66.04° (301), 71.38° (202), and 78.80° (321) [37]. All reflexes of the reference are retrieved in the sample patterns. A major difference between the individual patterns is the peak width. While SnO2 (Hydrothermal) exhibits very broad reflexes, the other patterns show sharper reflexes, indicating a comparatively low crystallite size for SnO2 (Hydrothermal).
Particle Size Analysis
Using the BET method, specific surface areas of the investigated electrocatalysts were determined based on the adsorption branch of N2-sorption isotherms recorded at 77 K (Figure S2). The specific surface areas resulting from the BET analysis are shown in Table 1 together with the corresponding particle sizes determined according to geometrical considerations (Equation (S2)). Furthermore, Table 1 shows the crystallite sizes calculated based on the XRD results in Figure 1 (Equation (S3)) and the particle sizes as determined by HRTEM. From the BET analysis, it can be concluded that the surface area of the electrocatalysts differs significantly. While SnO2 (Hydrothermal) shows a specific surface area as high as 177.4 m2⋅g−1, SnO2 (Solid-State) exhibits only 7.5 m2⋅g−1. Similarly, SnO2 (Sol-Gel) and SnO2 (Commercial) also exhibit low BET surface areas of 11.7 m2⋅g−1 and 24.8 m2⋅g−1, respectively. Consequently, the estimated size of presumably spherical particles is the smallest for SnO2 (Hydrothermal) (d = 4.9 nm) and the largest for SnO2 (Solid-State) (d = 115.1 nm), while SnO2 (Sol-Gel) and SnO2 (Commercial) would feature medium particle sizes of 73.6 nm and 34.8 nm, respectively.

Table 1.
Comparison of the SnO2 nanoparticle sizes estimated by BET, XRD, and TEM using a reverse calculation based on the BET surface area (assuming spherical particles), Scherrer‘s equation based on the XRD data, and TEM image analysis, respectively.
The observation of different crystallite and particle sizes based on the XRD and BET results, respectively, is generally supported by the SEM images shown in Figure 2. Figure 2a depicts SnO2 (Commercial) and shows irregular-shaped nanoparticles in a broad size range from approximately 10 nm to 80 nm. Figure 2b shows SnO2 (Hydrothermal). For this material, individual particles cannot be distinguished, which suggests small-sized particles in the range of a few nanometers, while the bright structure in the middle of the SEM image displays a particle agglomerate. Figure 2c shows that SnO2 (Solid-State) consists of nanoparticles with a similar particle shape to SnO2 (Commercial), but a larger size of the smallest particles and a narrower size distribution in a range from 30 nm to 60 nm. Moreover, Figure 2d depicts SnO2 (Sol-Gel), which consists of quite homogeneous, but also agglomerated, nanoparticles in a comparatively narrow size range from approximately 20 nm to 40 nm.
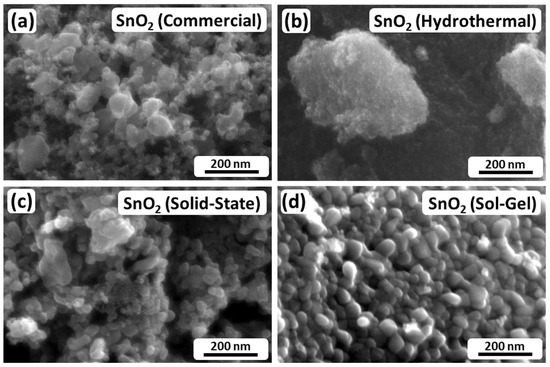
Figure 2.
SEM images of the investigated SnO2 nanoparticles. (a) SnO2 (Commercial); (b) SnO2 (Hydrothermal); (c) SnO2 (Solid-State); (d) SnO2 (Sol-Gel).
Comparing the BET data with the SEM images, the estimated particle sizes partially match the visual impression of the investigated electrocatalysts. As described above, SnO2 (Commercial) and SnO2 (Hydrothermal) consist of nanoparticles in the range of 10 nm to 80 nm and a few nanometers, respectively. However, the visual impression of SnO2 (Solid-State) and SnO2 (Sol-Gel) differs from the BET results. In both cases, it appears that the BET method mostly evaluated compact agglomerates rather than individual particles, since the individual particles appear to be much smaller than the estimated values based on BET. Furthermore, considering the XRD analysis by Scherrer’s equation, it appears that the particles seen in the SEM images are not necessarily single crystalline. In the cases of SnO2 (Commercial) and SnO2 (Hydrothermal), the visual impressions match the crystallite sizes of the XRD analysis. However, particularly in the case of SnO2 (Sol-Gel), the particles in Figure 2d appear to be larger than 11.2 nm.
To resolve the partially undecided particle size relations, TEM analyses were carried out. The corresponding high-resolution images are shown in Figure 3. Furthermore, Figure 4 depicts TEM-EDX maps of SnO2 (Commercial) and SnO2 (Hydrothermal), while Figures S3 and S4 display low-resolution TEM images and the corresponding Selected Area Electron Diffraction (SAED) patterns for the investigated samples. The TEM images in Figure 3 and Figure S3 show that SnO2 (Commercial) consists of small polyhedral nanoparticles with a size of approximately 10 nm (Figure 3a) and large particles of up to 100 nm (Figure S3a). Moreover, the SAED image in Figure S4a confirms the crystalline nature of the SnO2 particles. With this, the observations made by TEM are in very good agreement with the results of the other analysis methods and are also consistent with the particle sizes reported by the manufacturer (≤100 nm). Furthermore, in the TEM-EDX maps in Figure 4(top row), it can be observed that the material distribution of tin and oxygen is largely homogeneous across the particles, suggesting consistent electrocatalytic properties despite the comparatively broad distribution of particle sizes.
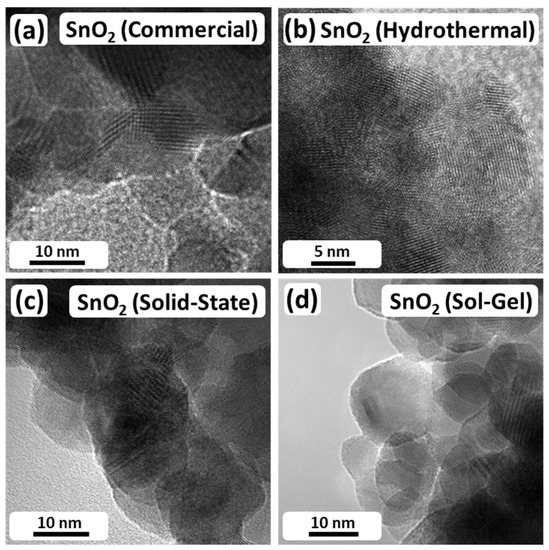
Figure 3.
TEM images of the investigated SnO2 nanoparticles at high magnification. (See Figure S3 for images at lower magnification). (a) SnO2 (Commercial); (b) SnO2 (Hydrothermal); (c) SnO2 (Solid-State); (d) SnO2 (Sol-Gel).
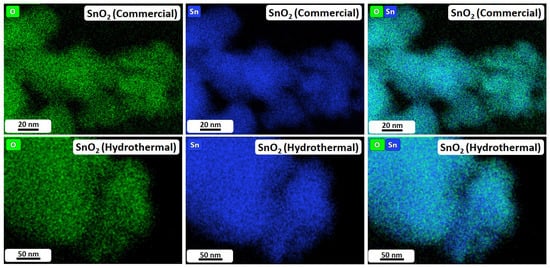
Figure 4.
EDX maps of commercial (top row) and hydrothermal (bottom row) SnO2 nanoparticles.
Figure 3b displays SnO2 (Hydrothermal). For this material, the nanoparticles are considerably smaller than those of SnO2 (Commercial) and exhibit a narrow size distribution in the range of 5 nm (Figure S3b). Furthermore, in the SAED image (Figure S4b), ring-like diffraction patterns can clearly be observed, suggesting a nanocrystalline nature of the particles. Again, this result is in good agreement with the findings of XRD and BET analysis reported in Table 1, which provides an average particle size of 4.9 nm (BET) and a crystallite size of 3.1 nm (XRD). Moreover, the TEM-EDX maps in Figure 4(bottom row) display that tin and oxygen show a uniform distribution across the particles, suggesting extensive homogeneity of the custom-made electrocatalyst.
Considering the TEM images of SnO2 (Solid-State) in Figure 3c and Figure S3c in comparison with the SEM image in Figure 2c, the SEM image shows individual irregular-shaped nanoparticles with a size >10 nm as seen by HRTEM. Furthermore, the distinct SAED pattern (Figure S4c) identifies the crystalline nature of the sample, which agrees with the BET and XRD results. However, in the BET analysis, particle agglomerates have been evaluated, providing a surface area of 7.5 m2⋅g−1 only, while the XRD analysis determines the crystallite size to be 26.6 nm. The latter particularly matches the HRTEM image in Figure 3c, which shows single crystalline particles of a similar size.
Figure 3d and Figure S3d show SnO2 (Sol-Gel) that consists of uniform nanoparticles in a size range from 10 to 20 nm, which is in very good agreement with the XRD analysis. For the latter, a crystallite size of 11.2 nm was determined, while SAED (Figure S4d) confirms the crystallinity of the nanoparticles. The BET analysis provides 73.6 nm for particle agglomerates. However, polycrystalline particles suspected based on the comparison of the XRD analysis and the SEM images could not be retrieved by HRTEM.
To conclude this section, it can be said that the investigated SnO2 nanoparticles, which were prepared according to different preparation methods, are largely comparable in terms of their general crystal structure, allowing for a just comparison of the electrochemical activity. The major difference between the individual electrocatalysts is the particle size and particle size distribution, which range from comparatively small sizes with a narrow distribution (SnO2 (Hydrothermal)) to medium sizes with a comparatively broad distribution (SnO2 (Commercial)).
2.2. Detailed Raman Analysis of the SnO2 Nanoparticles
Raman spectroscopy was performed, focusing on a spectral range from 250 cm−1 to 850 cm−1, which is a fingerprint region for SnO2 [38,39]. The complete and deconvoluted spectra can be found in Figures S5 and S6. The results of the corresponding investigation are shown in Figure 5 and Table 2. Line (a) in Figure 5 displays the spectrum of SnO2 (Commercial) that features two distinct bands at 631 cm−1 and 776 cm−1, as well as a broad response from 400 cm−1 to 750 cm−1 with several minor bands, e.g., at 475 cm−1, 543 cm−1, and 690 cm−1. Following the band allocation in the literature [39], the bands at 475 cm−1, 631 cm−1, and 776 cm−1 can be assigned to the classical Eg, A1g, and B2g-Raman modes of SnO2, with the A1g-band being the most intense response by far. Furthermore, the broad response from 400 cm−1 to 750 cm−1 is typically allocated to disordered SnO2. The broad response has been assigned to two disorder-activated bands, S1 and S2, at 568 cm−1 and 486 cm−1, respectively. In addition, a third band named S3 at approximately 706 cm−1 has been reported by the same authors, which is met by SnO2 (Commercial) with its band at 690 cm−1, while S1 and S2 can be allocated to the broad response from 400 cm−1 to 750 cm−1 and the minor band at 543 cm−1 [39].
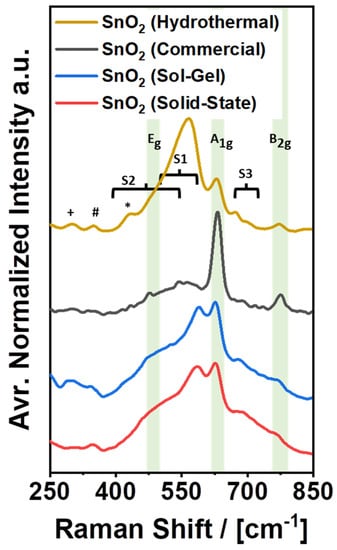
Similar to the Raman spectrum of SnO2 (Commercial), the spectra of the custom-made electrocatalysts can also be resolved and explained (Figure 5, lines (b)–(d)). Table 2 provides an overview of the band allocation in the high-frequency region from 450 cm−1 to 850 cm−1. Summarizing the results, it is clear that the classical Raman modes of SnO2 (Eg, A1g, and B2g) appear in comparatively narrow ranges from 475 cm−1 to 481 cm−1, 628 cm−1 to 631 cm−1, and 767 cm−1 to 776 cm−1, in accordance with the literature (480 cm−1, 634 cm−1, and 776 cm−1) [39]. Furthermore, the custom-made samples also exhibit disorder-activated Raman bands. All of them can be attributed to the previously reported bands S1–S3 but feature different intensities. Comparing the intensity of S1 + S2 with the individual intensity of A1g for each sample, SnO2 (Commercial) features the lowest intensity of S1 + S2, which corresponds well with the broad distribution of the particle size observed by SEM. In fact, it has been proposed that bands S1 and S2 originate from surface-induced crystal lattice disorder and the presence of oxygen vacancies, which are most significant for small nanoparticles (<10 nm) and less significant for larger nanoparticles (>20 nm) [39]. Accordingly, the intensity of S1 + S2 should be the lowest for SnO2 (Commercial) and the highest for SnO2 (Hydrothermal), which is clearly the case. For SnO2 (Hydrothermal), the sum of S1 and S2 is several times higher than the band for A1g. However, despite the potentially high number of defects given the large surface area, the color of SnO2 (Hydrothermal) is still plain white. Thus, it appears that the presence of crystal lattice disorder and oxygen vacancies is not necessarily correlated with the observation of color, or that the origin of color for SnO2 nanopowders is not or not only related to disorder in the outer surface of the nanoparticles.
In contrast to SnO2 (Commercial) and SnO2 (Hydrothermal), SnO2 (Solid-State) and SnO2 (Sol-Gel) do exhibit coloration (Figure 1). At the same time, the Raman spectra for the latter two samples show an S1 + S2 vs. A1g ratio, which is very similar to each other and somewhat in the middle between the corresponding intensity ratios for SnO2 (Commercial) and SnO2 (Hydrothermal). Reversely following the proposed particle size–disorder correlation [39], the similarity of the S1 + S2 vs. A1g ratio for SnO2 (Solid-State) and SnO2 (Sol-Gel) suggests similar particle sizes for both samples, which is true, considering the images in Figure 2 and Figure 3. Thus, a reverse determination of the particle size based on Raman spectra appears feasible, while the occurrence of color is consistent with the overall appearance of the Raman spectra.
Beyond the high-frequency regime, the second half of Table 2 reports distinct Raman bands in a low-frequency region from 250 cm−1 to 450 cm−1. In this region, most of the investigated samples show minor additional bands at 300 cm−1, at approximately 345 cm−1 and at approximately 430 cm−1. SnO2 (Hydrothermal), for example, exhibits all three bands at 300 cm−1, 349 cm−1, and 431 cm−1, which have not been reported by the same reference in the literature as disorder-induced bands S1–S3 due to a difference in the investigated spectral range. According to other literature, the additional bands at 300 cm−1 and 349 cm−1 can potentially be explained by a spectral contribution of the transversal optical (TO) Eu mode (υ2) [40] and the longitudinal optical (LO) Eu mode [41], which are typically Raman inactive, but might still be active due to the small size of the investigated particles [39] and/or the presence of oxygen vacancies in the SnO2 structure [41]. Furthermore, the band at 431 cm−1 has been assigned to the classical Eg-mode of SnO2 [41], which could also be a suitable explanation for the present spectra but contradicts both the previous band assignment and general observations for SnO2 [39,40]. However, given the actual lack of alternative explanations, the band assignment for the peak at 431 cm−1 might still be correct [41], since the spectra in the particular reference do not show any sign of additional bands in the typical Eg-band region at approximately 480 cm−1. This could either be due to a shift of the Eg-band to lower wavenumbers caused by the small particle size or due to the relative weakness of the Eg-band as compared to the disorder-induced bands S1 and S2.
2.3. Electrochemical Characterization of the SnO2 Nanoparticles
SnO2 facilitates the CO2ERR to formate according to Equation (1) [16,30]. The underlying reaction mechanism is currently thought of as a two-step reaction during which adsorbed CO2 is hydrogenated through a proton-coupled electron transfer, which yields OCHO* as an adsorbed intermediate [42]. Afterwards, a single electron transfer occurs, and formate is eventually released from the surface as the reaction product:
CO2 + H2O + 2e− → HCOO− + OH−
2.3.1. Linear Sweep Voltammetry (LSV)
Analyzing this reaction, the investigated SnO2 nanoparticles were dispersed, deposited onto a glassy carbon substrate, and analyzed in a rotating-disc electrode (RDE) setup using CO2 saturated 0.1 M KHCO3 as an electrolyte at ambient conditions. 0.1 M KHCO3 was chosen given the advantageous reaction conditions for the electroreduction of CO2 to formate on tin [43]. As a result, Figure 6 shows cathodic potential sweep scans from −0.15 to −1.40 VRHE before and after three hours of continuous CO2 electroreduction, which were recorded in a three-electrode half-cell setup, which is schematically depicted in Figure S1. For the initial scans, each of the four electrocatalysts exhibits electrocatalytic activity starting at a cathode potential of approximately −0.6 VRHE, which is primarily attributed to the CO2ERR to formate. Possible minor side products are CO and H2, which were released from the cell setup undetected due to technical reasons. Moreover, while the current density monotonously decreases from 0 to −16.1 mA⋅cm−2 for SnO2 (Commercial), the other three electrocatalysts exhibit non-continuous behavior and lower maximum cathodic current densities upon decreasing electrode potential. In fact, SnO2 (Hydrothermal) and SnO2 (Sol-Gel) both exhibit a local cathodic current density maximum at −0.85 VRHE, which was consistently observed in several independent measurements (Figure S7) and ascribed to a reduction of the SnO2 nanoparticles [44,45]. Moreover, SnO2 (Solid-State) also shows a shoulder in the evolution of the potential sweep curves, suggesting a reduction of this electrocatalyst as well. In any case, the cathodic current densities for all four samples are always considerably higher than the current densities in the reference experiments for bare glassy carbon and Nafion-coated glassy carbon, confirming the effect of the electrocatalysts (Figure S7j–k).
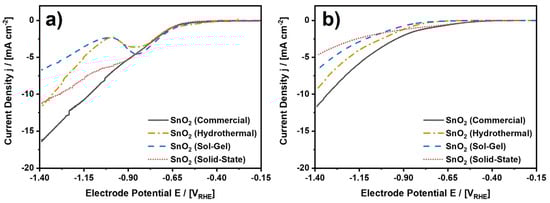
Figure 6.
LSV scans for the investigated SnO2 nanoparticles. (a) LSV scans before and (b) after three hours of CO2 electroreduction at −1.4 VRHE. CO2-saturated and continuously purged 0.1 M KHCO3 at ambient conditions. Connected data points to guide the eye. See Figures S7 and S8 for complete data including scans to other electrode potentials in a range from −0.6 to −1.4 VRHE and reference experiments for bare glassy carbon and Nafion on glassy carbon.
Figure 6b depicts the result for the cathodic potential sweeps from −0.15 to −1.40 VRHE after the CO2 electroreduction experiment. In comparison to Figure 6a, it can easily be observed that the accessible current densities are mostly lower, which will be discussed below. Before that, it shall be reported that none of the samples show the local cathodic current density maximum anymore. Thus, the corresponding reaction is irreversible and was completed either during the initial potential sweep or the subsequent CO2 electroreduction. To emphasize the difference between the initial and concluding scans, Figure S8 shows a direct comparison between the two scans for each of the four electrocatalysts. In the direct comparison, it can be observed that SnO2 (Solid-State) shows the most significant drop in cathodic current density from −11.1 mA⋅cm−2 to −4.7 mA⋅cm−2 at −1.4 VRHE. In contrast to this, the changes in current density for SnO2 (Sol-Gel) and SnO2 (Hydrothermal) are comparatively low, if any. For SnO2 (Sol-Gel), the current density at −1.4 VRHE remains essentially the same, while the current density decreases by 2.2 mA⋅cm−2 for SnO2 (Hydrothermal). Thus, at least for the latter two electrocatalysts, the observed reduction at −0.85 VRHE has no major influence on the electrochemical performance in terms of the maximum cathodic current density at −1.4 VRHE. Furthermore, SnO2 (Commercial) exhibits a medium decrease in the current density of 4.8 mA⋅cm−2. However, regardless of the more intense decrease in current density as compared to SnO2 (Hydrothermal), SnO2 (Commercial) still shows the highest cathodic current density of all four investigated samples, although SnO2 (Hydrothermal) features the largest specific surface area due to the smallest particle size by far.
Discussing the cathodic potential sweeps in greater detail, Table 3 provides a comparison of the onset potentials of the electrochemical reactions taking place on the RDE electrode. In Table 3, it can be seen that the onset potentials before the CO2 electroreduction are very similar for all materials considering a threshold of −1 mA⋅cm−2 [45]. For this threshold, the onset potentials range from −0.634 VRHE for SnO2 (Sol-Gel) to −0.661 VRHE for SnO2 (Solid-State). However, since the custom-made electrocatalysts exhibit signs of irreversible reduction upon the initial potential sweep, the determined onset potentials are not necessarily related to the CO2ERR alone. The latter is supported by the wider spread of the onset potentials considering a threshold of −0.1 mA⋅cm−2 (−0.386 VRHE for SnO2 (Hydrothermal) to −0.500 VRHE for SnO2 (Solid-State)). The wider spread suggests that the reduction reaction(s) result from different starting conditions, e.g., differences in the exact nature of the catalyst material (especially determined by minor species other than SnO2), the concentration of the corresponding species, the surface area, etc.
Table 3.
Onset potential for the electrochemical reactions during the linear potential sweeps before and after 3 h of CO2 electroreduction. Asterisks (*) indicate onset potentials that potentially result from SnO2 reduction rather than CO2 electroreduction.
Furthermore, looking at the onset potentials after the electroreduction, it becomes clear that the conditions for the electrochemical reactions changed. On the one hand, it must be acknowledged that formate accumulated in the electrolyte, which has an influence on the ongoing reactions as discussed in context with Figure 7d. On the other hand, given the missing local cathodic current density maximum, it can be assumed that the individual electrocatalysts reached a steady state in terms of their oxidation state. Thus, it can be assumed that the onset potentials shown in Table 3 result from electrocatalytic reactions on the material. After the CO2 electroreduction, SnO2 (Commercial) shows the lowest onset potential of −0.747 VRHE, while SnO2 (Sol-Gel) shows the highest onset potential of −0.938 VRHE, both at −1 mA⋅cm−2. Considering a threshold of −0.1 mA⋅cm−2, the differences in the onset potentials between the most and the least active electrocatalysts are similar compared to the results for −1.0 mA⋅cm−2 (~220 mV) but do not follow the same trend relative to each other.
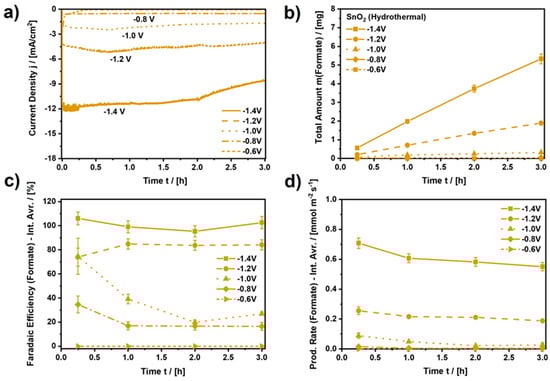
Figure 7.
Performance analysis for SnO2 (Hydrothermal). (a) Applied current density (current normalized by RDE area, A = 0.196 cm2), (b) Total amount of formate produced by CO2 electroreduction, (c) Faradaic efficiency for the CO2ERR to formate (Interval averages: 0–0.25 h, 0.25–1 h, 1–2 h, and 2–3 h), (d) Production rate of formate (Interval averages: 0–0.25 h, 0.25–1 h, 1–2 h, and 2–3 h). CO2-saturated and continuously purged 0.1 M KHCO3 at ambient conditions. Connected data points to guide the eye. See Figures S9–S12 for equivalent analyzes of the other SnO2 samples as well as reference measurements.
2.3.2. Continuous CO2 Electroreduction at Constant Potential
Analyzing the electrocatalytic performance upon continuous CO2 electroreduction, Figure 7 depicts the resulting current density, the amount of formate produced, the average Faradaic efficiency (FE), and the average yield rate of formate for SnO2 (Hydrothermal) for every measurement interval during three hours of continuous CO2 electroreduction at various constant electrode potentials. Moreover, Figures S9–S12 show equivalent results for the other three nanomaterials, as well as the results of reference experiments for bare glassy carbon and Nafion-coated glassy carbon.
Focusing on SnO2 (Hydrothermal), it can be observed in Figure 7a that the resulting current density (normalized by the RDE area, A = 0.196 cm2) is also almost constant and depends on the chosen electrode potential. While the cathodic current density is almost zero for a potential of −0.6 VRHE, it increases to −11.5 mA⋅cm−2 at −1.4 VRHE and remains constant for approximately 2 h with a minor decay down to −8.6 mA⋅cm−2 for the rest of the electroreduction period afterwards. During the electroreduction, the amount of formate retrieved in the electrolyte increases almost linearly, as determined by ion chromatography after 0.25 h, 1 h, 2 h, and 3 h (Figure 7b). As a result of the CO2 electroreduction at −1.4 VRHE, after three hours, a total amount of 5.34 mg of formate accumulated in the electrolyte (0.1 M KHCO3). Compared to the other electrocatalysts, 5.34 mg of formate stands out, as only SnO2 (Commercial) (m = 4.10 mg) comes close to the performance of SnO2 (Hydrothermal) (Figure S9). Furthermore, the FE for the CO2ERR to formate on SnO2 (Hydrothermal) can be as high as approximately 100%, depending on the applied potential and the duration of the electroreduction. In Figure 7c, the interval average FE of formate is zero for a potential of −0.6 VRHE since the resulting current density was close to zero for this potential. Thus, an applied potential of −0.6 VRHE is too low to initiate the electroreduction of CO2 to formate. Moreover, at −0.8 VRHE and −1.0 VRHE, average FEs in a range of 20–30% and 25–70% are observed, respectively, indicating that the CO2ERR is initiated at the corresponding potentials but is mostly inferior to the competing HER or CO evolution reaction. Only at −1.2 VRHE and −1.4 VRHE is a clear majority (FE > 80%) of the applied charge consumed by the CO2ERR to formate, with a clear advantage for the most negative potential. At −1.4 VRHE, approximately 100% of the applied charge is consumed by formate production, which is also reflected by the average yield rates. Figure 7d shows that the average yield rate of formate at −1.4 VRHE is as high as 0.551 mmol⋅m−2⋅s−1 at the beginning of the CO2 electroreduction, which is almost three times higher than the yield rate at −1.2 VRHE.
Furthermore, the average yield rates of formate in Figure 7d show a slight but continuous decline, regardless of the applied potential. This can potentially be explained by the following two processes. Firstly, the continuous decline could be a result of an overall loss of catalyst material during the rotation of the RDE. Figure S13 shows that the CO2ERR to formate clearly depends on the amount of applied electrocatalyst since the applied current density and the yield rate are cut by approximately half due to the decrease in the amount of catalyst by 50%. Hence, any loss of electrode activity could be related to the loss of catalyst material, which might even be visible on the electrode if significant but was not observed in the present study. Microscope images such as the ones in Figure S14 did not show significant hints of catalyst loss due to the RDE experiment.
Secondly, different from the CO2 electroreduction to gaseous products such as CO, the (main) reaction product for the CO2ERR on SnO2 in a static H-cell, formate, accumulates in the electrolyte, which is known to influence the progression of the reaction negatively [45,46]. This was also observed in the present study. Figure S15 shows the result of a reference experiment during which the final concentration of formate was applied to the electrolyte right at the beginning of the experiment. Due to this, the resulting current density at −1.4 VRHE for SnO2 (Hydrothermal), the evolution of the (additional) amount of formate, the average FE, and the average yield rate of formate are diminished as compared to the results in the absence of formate. Regarding the reason for this behavior, we assume that the accumulated amount of formate provides a low but significant amount of formic acid, despite the slight increase in the bulk pH during the electroreduction of CO2. The accumulation of formate results in a steady increase in the concentration of the strongest acid in the system, which is capable of protonating SnO2. The latter creates strongly bound hydrogen atoms, blocking electrocatalytically active sites on the SnO2 surface [47] and potentially acting as a catalyst poison similar to CO for the HER on copper [48].
Figure 8 compares the performance of all four investigated electrocatalysts during the initial and final periods of CO2 electroreduction. In the comparison, more negative electrode potentials are mostly beneficial with respect to the evolution of formate. For all four SnO2 electrocatalysts, both higher average FEs and average yield rates are mostly observed for more negative electrode potentials for both the initial and final periods of the experiment, respectively. Furthermore, it is found that during both periods, SnO2 (Hydrothermal) provides both the highest average FE as well as the highest average yield rate as compared to the other three electrocatalysts, which is also summarized in Table 4. SnO2 (Commercial) comes in second, outperformed by SnO2 (Hydrothermal) by approximately 25% in terms of the average yield rate, although SnO2 (Commercial) shows a higher current density in the LSV scans in Figure 6 than SnO2 (Hydrothermal). The better performance of SnO2 (Hydrothermal) as compared to SnO2 (Commercial) is explained by the stable current density for SnO2 (Hydrothermal) during continuous CO2 electroreduction (Figure 7a), which is almost constant at approximately 12 mA⋅cm−2 for the first two hours, while the current density for SnO2 (Commercial) quickly drops towards 10.5 mA⋅cm−2 within the first minutes of the experiment (Figure S9). Moreover, even after three hours of CO2 electroreduction at −1.4 VRHE, SnO2 (Hydrothermal) shows an excellent average FE for the CO2ERR to formate of approximately 100% and an average yield rate of 0.551 mmol⋅m−2⋅s−1, while SnO2 (Commercial) shows 78.7% and 0.407 mmol⋅m−2⋅s−1. Thus, the extent of side reactions towards CO and H2 is much lower on SnO2 (Hydrothermal) than on SnO2 (Commercial). Furthermore, at −1.4 VRHE, the other two electrocatalysts, i.e., SnO2 (Solid-State) and SnO2 (Sol-Gel), perform worse. During the final period of the CO2 electroreduction, SnO2 (Solid-State) provides an average FE of 73.5% and an average yield rate of 0.125 mmol⋅m−2⋅s−1, while SnO2 (Sol-Gel) delivers 70.7% and 0.218 mmol⋅m−2⋅s−1. However, it should be noted that SnO2 (Solid-State) nanoparticles outperform SnO2 (Commercial) at a potential of −1.0 VRHE, as SnO2 (Solid-State) does not show its best performance at −1.4 VRHE. In terms of the yield rate, SnO2 (Solid-State) shows its best performance at −1.2 VRHE within the first interval and at −1.0 VRHE during the last interval. Thus, a more negative electrode potential does not necessarily result in a higher yield rate for every electrocatalyst even if it is the same substance with a comparable texture. In the case of SnO2 (Solid-State), the observed behavior appears to stem from a time-dependent reduction of the electrocatalyst, which is indicated by a significantly decreasing cathodic current density during the CO2 electroreduction at −1.4 VRHE as shown in Figure S10a.
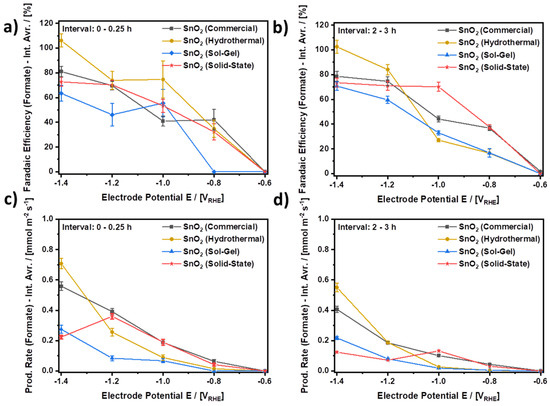
Figure 8.
Comparison of the electrocatalytic performance of the investigated SnO2 nanoparticles. (a,b) Faradaic efficiencies for the CO2ERR to formate (Interval averages: 0–0.25 h and 2–3 h, respectively), (c,d) production rate of formate (Interval averages: 0–0.25 h and 2–3h, respectively) CO2-saturated and continuously purged 0.1 M KHCO3 at ambient conditions. Connected data points to guide the eye.
Table 4.
Comparison of the electrocatalytic performance of the investigated SnO2 nanoparticles as provided by the average Faradaic Efficiency (FE) and average yield rate (Yield Rate) for the CO2ERR to formate at −1.4 VRHE during the initial 0.25 h- and the final 1 h-period of the CO2 electroreduction, respectively.
Combining the results of the electrochemical analysis in Figure 8 with the results of the material characterization, it can be concluded that the hydrothermal synthesis provided the most effective electrocatalyst investigated in this study. An equal amount (w/w) of SnO2 (Hydrothermal) provided the highest Faradaic efficiency and highest yield rate under equivalent conditions as compared to the other three electrocatalysts. At the same time, the nanoparticles of SnO2 (Hydrothermal) were also the smallest particles investigated in this study. However, SnO2 (Commercial) also provided considerable results and outperformed SnO2 (Sol-Gel) and SnO2 (Solid-State), similar to SnO2 (Hydrothermal). The latter is particularly interesting since the surface area of SnO2 (Hydrothermal) is approximately seven times larger and features a higher number of possibly beneficial crystal lattice defects than SnO2 (Commercial). With this, the comparatively good performance of SnO2 (Commercial) suggests a high surface area-specific activity despite a comparatively low number of defects. A possible explanation for this behavior could be related to the material property that accounts for the A1g-band in the Raman spectrum and might be a driver for the electrocatalytic activity of SnO2 for CO2ERR to formate. In fact, in an in-operando Raman study, it was shown that along with the disappearance of the A1g band due to the electrochemical reduction of SnO2 to metallic Sn, the FE to formate decreases significantly [49]. Relating to this, it has been described above that SnO2 (Commercial) shows the A1g band as a predominant peak, while disorder-related bands dominate the spectrum of SnO2 (Hydrothermal) and possibly mask the potentially even higher activity of highly ordered SnO2. Nevertheless, it can be assumed that the presumably lower surface area-specific activity of SnO2 (Hydrothermal) compared to SnO2 (Commercial) is overcompensated by its much higher (7×) surface area, which leads to the overall better performance of SnO2 (Hydrothermal). Accordingly, SnO2 (Hydrothermal) and SnO2 (Commercial) are both interesting candidates for the preparation of GDEs, while SnO2 (Sol-Gel) and SnO2 (Solid-State) fall behind due to both more defects than SnO2 (Commercial) and larger nanoparticles than SnO2 (Hydrothermal).
With this, the present study showed that SnO2 (Hydrothermal) is mostly stable under extended CO2 electroreduction conditions, provides increased amounts of formate, and may live up to even better performance in an alternative reaction environment such as the triple-phase boundary in GDEs. Furthermore, SnO2 (Commercial) proved to be an alternative to custom-made electrocatalysts, which is slightly less stable than SnO2 (Hydrothermal) but potentially more active, potentially due to fewer crystal lattice defects, considering the significantly lower surface area compared to SnO2 (Hydrothermal).
3. Materials and Methods
The experimental procedures and preparation methods are reported in the Supplementary Information together with a detailed comparison between the individual synthesis products and the corresponding results in the literature.
4. Conclusions
In the present study, SnO2 nanoparticles have been investigated as electrocatalysts for the electroreduction of CO2 to formate. The investigated samples were prepared according to three different synthesis methods, namely hydrothermal, sol-gel, and solid-state syntheses, and resulted in markedly different material properties and electrocatalytic performances. Significant differences existed in the particle size and the defect structure as compared to commercial SnO2. SnO2 prepared by the hydrothermal method featured the smallest particle size of approximately 5 nm as determined by HRTEM and showed a significant number of defects as determined by Raman spectroscopy. The commercial SnO2 consisted of larger particles in a broad size range from 10 to 100 nm and showed fewer defects than the custom-made nanomaterials. The SnO2 nanoparticles prepared by sol-gel and solid-state synthesis showed particle sizes in a range from 10 to 20 nm and featured a medium number of defects. All four materials were investigated in CO2-saturated 0.1 M KHCO3 with respect to their electrocatalytic performance using a rotating-disk electrode (RDE) setup. As a result, it was shown that the SnO2 nanoparticles prepared by hydrothermal synthesis provide superior performance in terms of Faradaic efficiency for CO2 to formate as compared to the other three electrocatalysts. The superior performance can be explained by the much larger specific surface area due to the comparatively small particles. However, the commercial reference also performed comparatively well despite the considerably smaller specific surface area. The latter suggests a higher surface-area-specific activity for the commercial nanoparticles as compared to the custom-made electrocatalysts and an adverse effect of crystal lattice defects on the CO2 electroreduction to formate in this case.
Supplementary Materials
The following supporting information can be downloaded at: https://www.mdpi.com/article/10.3390/catal13050903/s1, Material and Methods section, Detailed comparison with corresponding literature regarding the result of the catalyst synthesis, Figure S1: Schematic representation of the experimental setup used for the RDE experiments; Figure S2: N2-sorption isotherms of the investigated SnO2 nanoparticles; Equation (S2): Calculation of BET-particle size; Equation (S3): Debye–Scherrer equation; Figure S3: TEM images of the investigated SnO2 nanoparticles at low magnification; Figure S4: Selected area diffraction pattern for the investigated SnO2 catalyst; Figure S5: Complete Raman spectra of the investigated SnO2 nanoparticles; Figure S6: Result of the peak deconvolution for the Raman spectra shown in Figure 5.; Figure S7: LSV results for the investigated SnO2 catalysts analogous to Figure 6; Figure S8: Direct comparison of LSV scans to −1.4 VRHE before and after three hours of CO2 electrolysis for all investigated SnO2 nanoparticles; Figure S9: Performance analysis of SnO2 (Commercial); Figure S10: Performance analysis of SnO2 (Solid-State); Figure S911 Performance analysis of SnO2 (Sol-Gel); Figure S12 Reference performance of glassy carbon and glassy carbon covered with Nafion; Figure S13: Result of an additional reference experiment using half the amount of SnO2 (Hydrothermal); Figure S14: Exemplary LSM images of the applied electrode bearing hydrothermal SnO2 nanoparticles before and after electrolysis; Figure S15: Reference experiment showing the influence of formate on the performance of SnO2 (Hydrothermal).
Author Contributions
Conceptualization, H.W., H.T. and R.-A.E.; formal analysis, B.R., S.B., O.C. and A.K.; investigation, B.R., S.B., B.S., O.C. and A.K.; writing—original draft preparation, H.W.; writing—review and editing, B.S., H.K., H.T. and R.-A.E.; visualization, H.W., B.R., S.B. and O.C.; supervision, H.K., H.T. and R.-A.E.; project administration, H.T. and R.-A.E.; funding acquisition, H.K., H.T. and R.-A.E. All authors have read and agreed to the published version of the manuscript.
Funding
This research was funded by the German Federal Ministry of Education and Research (BMBF), project number 03SF0627A, and the Marie Skłodowska-Curie action, grant number 892916.
Data Availability Statement
The data presented in this study are available upon request from the corresponding author.
Acknowledgments
The authors kindly acknowledge the financial support from the German Federal Ministry of Education and Research (BMBF) within the project ‘iNEW2.0–Inkubator Nachhaltige Elektrochemische Wertschöpfungsketten’. S. Basak acknowledges the project ‘Electroscopy’ from the Marie Skłodowska-Curie action.
Conflicts of Interest
The authors declare no conflict of interest. The funders had no role in the design of the study; in the collection, analyses, or interpretation of data; in the writing of the manuscript; or in the decision to publish the results.
References
- Foit, S.R.; Vinke, I.C.; de Haart, L.G.J.; Eichel, R.-A. Eichel, Power-to-Syngas: An Enabling Technology for the Transition of the Energy System? Angew. Chem. Int. Ed. 2017, 56, 5402–5411. [Google Scholar] [CrossRef] [PubMed]
- de Vasconcelos, B.R.; Lavoie, J.M. Recent advances in power-to-X technology for the production of fuels and chemicals. Front. Chem. 2019, 7, 392. [Google Scholar] [CrossRef] [PubMed]
- Styring, P.; Quadrelli, E.A.; Armstrong, K. Carbon Dioxide Utilisation; Elsevier: Amsterdam, The Netherlands, 2015. [Google Scholar] [CrossRef]
- Centi, G.; Perathoner, S. Opportunities and prospects in the chemical recycling of carbon dioxide to fuels. Catal. Today 2009, 148, 191–205. [Google Scholar] [CrossRef]
- Fernández-Caso, K.; Díaz-Sainz, G.; Alvarez-Guerra, M.; Irabien, A. Electroreduction of CO2: Advances in the Continuous Production of Formic Acid and Formate. ACS Energy Lett. 2023, 8, 1992–2024. [Google Scholar] [CrossRef]
- Du, D.; Lan, R.; Humphreys, J.; Tao, S. Progress in inorganic cathode catalysts for electrochemical conversion of carbon dioxide into formate or formic acid. J. Appl. Electrochem. 2017, 47, 661–678. [Google Scholar] [CrossRef]
- Barsan, N.; Schweizer-Berberich, M.; Göpel, W. Fundamental and practical aspects in the design of nanoscaled SnO2 gas sensors: A status report, Fresenius. J. Anal. Chem. 1999, 365, 287–304. [Google Scholar] [CrossRef]
- Kim, C.; Noh, M.; Choi, M.; Cho, J.; Park, B. Critical size of a nano SnO2 electrode for Li-secondary battery. Chem. Mater. 2005, 17, 3297–3301. [Google Scholar] [CrossRef]
- Batzill, M.; Diebold, U. The surface and materials science of tin oxide. Prog. Surf. Sci. 2005, 79, 47–154. [Google Scholar] [CrossRef]
- Chen, Y.; Vise, A.; Klein, W.E.; Cetinbas, F.C.; Myers, D.J.; Smith, W.A.; Deutsch, T.G.; Neyerlin, K.C.; Robust, A. Scalable Platform for the Electrochemical Conversion of CO2 to Formate: Identifying Pathways to Higher Energy Efficiencies. ACS Energy Lett. 2020, 5, 1825–1833. [Google Scholar] [CrossRef]
- Tan, D.; Lee, W.; Kim, Y.E.; Ko, Y.N.; Youn, M.H.; Jeon, Y.E.; Hong, J.; Jeong, S.K.; Park, K.T. SnO2/ZnO Composite Hollow Nanofiber Electrocatalyst for Efficient CO2 Reduction to Formate. ACS Sustain. Chem. Eng. 2020, 8, 10639–10645. [Google Scholar] [CrossRef]
- Lee, M.Y.; Han, S.; Lim, H.; Kwon, Y.; Kang, S. Electrocatalytic CO2 Reduction via a Permeable CNT Hollow-Fiber Electrode Incorporated with SnO2 Nanoparticles. ACS Sustain. Chem. Eng. 2020, 8, 2117–2121. [Google Scholar] [CrossRef]
- Li, X.; Dou, S.; Wang, J.; Wang, X. Investigation of Structural Evolution of SnO2 Nanosheets towards Electrocatalytic CO2 Reduction. Chem.-Asian J. 2020, 15, 1558–1561. [Google Scholar] [CrossRef] [PubMed]
- Li, J.; Jiao, J.; Zhang, H.; Zhu, P.; Ma, H.; Chen, C.; Xiao, H.; Lu, Q. Two-Dimensional SnO2 Nanosheets for Efficient Carbon Dioxide Electroreduction to Formate. ACS Sustain. Chem. Eng. 2020, 8, 4975–4982. [Google Scholar] [CrossRef]
- Wu, J.; Bai, X.; Ren, Z.; Du, S.; Song, Z.; Zhao, L.; Liu, B.; Wang, G.; Fu, H. Multivalent Sn species synergistically favours the CO2-into-HCOOH conversion. Nano Res. 2020, 12, 1053–1060. [Google Scholar] [CrossRef]
- Hu, C.; Li, L.; Deng, W.; Zhang, G.; Zhu, W.; Yuan, X.; Zhang, L.; Zhao, Z.J.; Gong, J. Selective Electroreduction of Carbon Dioxide over SnO2-Nanodot Catalysts. ChemSusChem 2020, 13, 6353–6359. [Google Scholar] [CrossRef] [PubMed]
- Fang, M.; Zheng, Z.; Chen, J.; Chen, Q.; Liu, D.; Xu, B.; Wu, J.; Kuang, Q.; Xie, Z. Surface structure-dependent electrocatalytic reduction of CO2 to C1 products on SnO2 catalysts. Sustain. Energy Fuels 2020, 4, 600–606. [Google Scholar] [CrossRef]
- Xiang, H.; Miller, H.A.; Bellini, M.; Christensen, H.; Scott, K.; Rasul, S.; Yu, E.H. Production of formate by CO2 electrochemical reduction and its application in energy storage. Sustain. Energy Fuels 2019, 4, 277–284. [Google Scholar] [CrossRef]
- Tao, H.; Ma, Z.; Yang, G.; Wang, H.; Long, H.; Zhao, H.; Qin, P.; Fang, G. Room-temperature processed tin oxide thin film as effective hole blocking layer for planar perovskite solar cells. Appl. Surf. Sci. 2018, 434, 1336–1343. [Google Scholar] [CrossRef]
- Wen, G.; Lee, D.U.; Ren, B.; Hassan, F.M.; Jiang, G.; Cano, Z.P.; Gostick, J.; Croiset, E.; Bai, Z.; Yang, L.; et al. Orbital Interactions in Bi-Sn Bimetallic Electrocatalysts for Highly Selective Electrochemical CO2 Reduction toward Formate Production. Adv. Energy Mater. 2018, 8, 1802427. [Google Scholar] [CrossRef]
- Liu, Y.; Yang, F.; Yang, X. Size-controlled synthesis and characterization of quantum-size SnO2 nanocrystallites by a solvothermal route. Colloids Surfaces A Physicochem. Eng. Asp. 2008, 312, 219–225. [Google Scholar] [CrossRef]
- Chiu, H.C.; Yeh, C.S. Hydrothermal synthesis of SnO2 nanoparticles and their gas-sensing of alcohol. J. Phys. Chem. C 2007, 111, 7256–7259. [Google Scholar] [CrossRef]
- Li, Z.; Shen, W.; Zhang, X.; Fang, L.; Zu, X. Controllable growth of SnO2 nanoparticles by citric acid assisted hydrothermal process. Colloids Surfaces A Physicochem. Eng. Asp. 2008, 327, 17–20. [Google Scholar] [CrossRef]
- Li, F.; Chen, L.; Chen, Z.; Xu, J.; Zhu, J.; Xin, X. Two-step solid-state synthesis of tin oxide and its gas-sensing property. Mater. Chem. Phys. 2002, 73, 335–338. [Google Scholar] [CrossRef]
- Tan, E.T.H.; Ho, G.W.; Wong, A.S.W.; Kawi, S.; Wee, A.T.S. Gas sensing properties of tin oxide nanostructures synthesized via a solid-state reaction method. Nanotechnology 2008, 19, 255706. [Google Scholar] [CrossRef] [PubMed]
- Harinath Babu, S.; Madhusudhana Rao, N.; Kaleemulla, S.; Amarendra, G.; Krishnamoorthi, C. Room-temperature ferromagnetic and photoluminescence properties of indium-tin-oxide nanoparticles synthesized by solid-state reaction. Bull. Mater. Sci. 2017, 40, 17–23. [Google Scholar] [CrossRef]
- Chen, Y.C.; Chen, J.M.; Huang, Y.H.; Lee, Y.R.; Shih, H.C. Size effect of tin oxide nanoparticles on high capacity lithium battery anode materials. Surf. Coat. Technol. 2007, 202, 1313–1318. [Google Scholar] [CrossRef]
- Aziz, M.; Saber Abbas, S.; Wan Baharom, W.R. Size-controlled synthesis of SnO2 nanoparticles by sol-gel method. Mater. Lett. 2013, 91, 31–34. [Google Scholar] [CrossRef]
- de Monredon, S.; Cellot, A.; Ribot, F.; Sanchez, C.; Armelao, L.; Gueneau, L.; Delattre, L. Synthesis and characterization of crystalline tin oxide nanoparticles. J. Mater. Chem. 2002, 12, 2396–2400. [Google Scholar] [CrossRef]
- He, Y.; Jiang, W.J.; Zhang, Y.; Huang, L.B.; Hu, J.S. Pore-structure-directed CO2 electroreduction to formate on SnO2/C catalysts. J. Mater. Chem. A 2019, 7, 18428–18433. [Google Scholar] [CrossRef]
- König, M.; Vaes, J.; Klemm, E.; Pant, D. Solvents and Supporting Electrolytes in the Electrocatalytic Reduction of CO2. iScience 2019, 19, 135–160. [Google Scholar] [CrossRef]
- Hori, Y.; Wakebe, H.H.I.; Tsukamoto, T.; Koga, O. Electrocatalytic Process of CO Selectivity in Electrochemical Reduction of CO2 at Metal Electrodes in Aqueous Media. Electrochim. Acta 1994, 39, 1833–1839. [Google Scholar] [CrossRef]
- Suntivich, J.; Gasteiger, H.A.; Yabuuchi, N.; Shao-Horn, Y. Electrocatalytic Measurement Methodology of Oxide Catalysts Using a Thin-Film Rotating Disk Electrode. J. Electrochem. Soc. 2010, 157, B1263. [Google Scholar] [CrossRef]
- Garsany, Y.; Singer, I.L.; Swider-Lyons, K.E. Impact of film drying procedures on RDE characterization of Pt/VC electrocatalysts. J. Electroanal. Chem. 2011, 662, 396–406. [Google Scholar] [CrossRef]
- De Mot, B.; Hereijgers, J.; Duarte, M.; Breugelmans, T. Influence of flow and pressure distribution inside a gas diffusion electrode on the performance of a flow-by CO2 electrolyzer. Chem. Eng. J. 2019, 378, 122224. [Google Scholar] [CrossRef]
- Shek, C.H.; Lin, G.M.; Lai, J.K.L. Effect of oxygen deficiency on the Raman spectra and hyperfine interactions of nanometer SnO2. Nanostruct. Mater. 1999, 11, 831–835. [Google Scholar] [CrossRef]
- Gržeta, B.; Tkalčec, E.; Goebbert, C.; Takeda, M.; Takahashi, M.; Nomura, K.; Jakší, M. Structural studies of nanocrystalline SnO2 doped with antimony: XRD and Mössbauer spectroscopy. J. Phys. Chem. Solids 2002, 63, 765–772. [Google Scholar] [CrossRef]
- Zuo, J.; Xu, C.; Liu, X.; Wang, C.; Wang, C.; Hu, Y.; Qian, Y. Study of the Raman spectrum of nanometer SnO2. J. Appl. Phys. 1994, 75, 1835–1836. [Google Scholar] [CrossRef]
- Diéguez, A.; Romano-Rodríguez, A.; Vilà, A.; Morante, J.R. The complete Raman spectrum of nanometric SnO2 particles. J. Appl. Phys. 2001, 90, 1550–1557. [Google Scholar] [CrossRef]
- Katiyar, R.S.; Dawson, P.; Hargreave, M.M.; Wilkinson, G.R. Dynamics of the rutile structure. III. Lattice dynamics, infrared and Raman spectra of SnO2. J. Phys. C Solid State Phys. 1971, 4, 2421–2431. [Google Scholar] [CrossRef]
- Liu, L.Z.; Li, T.H.; Wu, X.L.; Shen, J.C.; Chu, P.K. Identification of oxygen vacancy types from Raman spectra of SnO2 nanocrystals. J. Raman Spectrosc. 2012, 43, 1423–1426. [Google Scholar] [CrossRef]
- Zhang, Y.; Liu, J.; Wei, Z.; Liu, Q.; Wang, C.; Ma, J. Electrochemical CO2 reduction over nitrogen-doped SnO2 crystal surfaces. J. Energy Chem. 2019, 33, 22–30. [Google Scholar] [CrossRef]
- Lv, W.; Zhang, R.; Gao, P.; Lei, L. Studies on the faradaic efficiency for electrochemical reduction of carbon dioxide to formate on tin electrode. J. Power Source 2014, 253, 276–281. [Google Scholar] [CrossRef]
- Zhang, S.; Kang, P.; Meyer, T.J. Nanostructured Tin Catalysts for Selective Electrochemical Reduction of Carbon Dioxide to Formate. J. Am. Chem. Soc. 2014, 136, 1734–1737. [Google Scholar] [CrossRef]
- Yang, K.; Kas, R.; Smith, W.A.; Burdyny, T. Role of the Carbon-Based Gas Diffusion Layer on Flooding in a Gas Diffusion Electrode Cell for Electrochemical CO2 Reduction. ACS Energy Lett. 2021, 6, 33–40. [Google Scholar] [CrossRef]
- Yang, H.; Kaczur, J.J.; Sajjad, S.D.; Masel, R.I. Electrochemical conversion of CO2 to formic acid utilizing SustainionTM membranes. J. CO2 Util. 2017, 20, 208–217. [Google Scholar] [CrossRef]
- Inerbaev, T.M.; Kawazoe, Y.; Seal, S. Theoretical calculations of hydrogen adsorption by (110) surface: Effect of doping and calcination. J. Appl. Phys. 2010, 107, 104504. [Google Scholar] [CrossRef]
- Zhang, Y.-J.; Sethuraman, V.; Michalsky, R.; Peterson, A. Competition between CO2 reduction and H2 evolution on transition-metal electrocatalysts. ACS Catal. 2014, 4, 3742–3748. [Google Scholar] [CrossRef]
- Dutta, A.; Kuzume, A.; Rahaman, M.; Vesztergom, S.; Broekmann, P. Monitoring the Chemical State of Catalysts for CO2 Electroreduction: An in Operando Study. ACS Catal. 2015, 5, 7498–7502. [Google Scholar] [CrossRef]


Disclaimer/Publisher’s Note: The statements, opinions and data contained in all publications are solely those of the individual author(s) and contributor(s) and not of MDPI and/or the editor(s). MDPI and/or the editor(s) disclaim responsibility for any injury to people or property resulting from any ideas, methods, instructions or products referred to in the content. |
© 2023 by the authors. Licensee MDPI, Basel, Switzerland. This article is an open access article distributed under the terms and conditions of the Creative Commons Attribution (CC BY) license (https://creativecommons.org/licenses/by/4.0/).