Abstract
Transparent supercapacitors find a large number of applications as components of many electronic devices and circuits. Mixed Ni–Co oxides (NCOs) are among the most promising supercapacitor electrode materials exhibiting high pseudo-capacitance and good electronic conductivity, while inkjet printing is a low cost and versatile technique for electrode printing. Surprisingly, although there have been many studies of NCO supercapacitor films on ITO glass substrates, these have not been prepared by the inkjet technique, and their optical properties were not fully characterized. Hereby, we report the fabrication and characterization of thin (295 and 477 nm thick; 0.017 and 0.035 mg cm−2 NCO loading) semi-transparent NiCo2O4/ITO supercapacitor electrodes, showing transparency to visible light (60–30%, from the thinner to the thicker electrode layers tested), typical mass specific capacitance for NCO-based supercapacitor electrodes (1294–829 Fg−1 at 1 mA cm−2 discharge current density) and high volumetric capacitance (746–608 F cm−3 at 1 mA cm−2). The NCO nanoparticles were prepared by hydrothermal synthesis followed by thermal treatment and ball milling (ZrO2 balls, 0.5 mm diameter), resulting in a cubic nickel–cobalt oxide structure and particle size in the 30–150 nm range, whereas the electrode layers were printed from water-propylene glycol solutions using a Dimatix DMP-2850 drop-on-demand (DoD) inkjet printer. Constant current charge–discharge experiments of the supercapacitor electrode (at ca 0.5 mA cm−2) for 1000 cycles confirmed stability of performance.
1. Introduction
In the energy storage field, the search for high performance electrochemical devices has drawn significant attention, and supercapacitors, having unique properties such as fast charge–discharge rate, high power density and extended cycle life, are among the most promising of these (see, for example, [1,2,3,4,5,6,7,8,9]). As it is well known, the electrochemical performance of supercapacitors is largely determined by the properties of electrode materials, whether these are of the Electrochemical Double Layer, EDL, type (whereby, low cost carbonaceous materials of high surface area are researched; see, for example, [10]) or of the pseudo-capacitor/battery type (whereby materials of high redox activity, such as conducting polymers and metal oxides, are sought; see, for example, [11]). Mixed Ni–Co oxides (NCOs; usually corresponding to the NiCo2O4 formula) are among the most promising supercapacitor electrode materials exhibiting high pseudo-capacitance/redox activity and good electronic conductivity (see, for example, [12,13]). Ni and Co oxides alone already exhibit high theoretical pseudo-capacitance values (2573 and 3560 Fg−1, respectively) due to the relatively fast Ni(II)/Ni(III) and Co(III)/Co(IV) redox transformations, but suffer from relatively low electronic conductivity; however, the mixed Ni–Co oxides, due to their spinel structure, possess adequate conductivity for supercapacitor applications. Additional advantages of the material result from the fact that it is based on inexpensive, earth-abundant elements which are also relatively environmentally benign.
At the same time, thin film supercapacitors find many applications in portable, flexible and wearable electronics (to be used in clothing and fabrics) as well as in transparent devices (to be used for example in touchpad displays and transparent circuits in general), to mention a few of the many applications that small-size power sources find in the ever-expanding world of portable personal devices [14,15,16]. Printed energy storage devices can be built by printing liquid functional materials such as organic and inorganic nanomaterials (see, for example, [17]). Inkjet printing is an ideal method for the deposition of nanomaterials for device fabrication because it is a non-contact, precisely controlled deposition and additive printing process, particularly applicable to thin film preparation. The method is a fast, inexpensive and environmentally friendly technique that also allows microstructuring (see, for example, [18]).
Although there are many reports of thin (active material loading ≤ 1 mg cm−2) NiCo2O4 supercapacitor electrodes [19,20,21,22,23,24,25,26,27,28,29] (some of which are on ITO substrates [25,26,27,28]) and there are also a few reports of supercapacitor electrodes fabricated on glass substrates by the inkjet printing technique [30,31,32,33], surprisingly, one cannot find any paper reporting semi-transparent supercapacitor NiCo2O4 electrodes prepared on ITO glass by the inkjet technique.
Finally, one should mention that combining mixed transition metal hydroxides and metals with transition metal sulfides has been reported to result in excellent supercapacitor materials (see, for example, [34,35]).
The aim of this work has been the fabrication and testing of semi-transparent inkjet-printed NiCo2O4 nanoparticulate thin film electrodes on ITO glass substrates for electrochemical supercapacitor applications. To that end, the objectives have been: (a) the hydrothermal synthesis of NiCo2O4 nanoparticles and their complete physicochemical characterization (XRD, SEM, AFM), (b) the optimization of the inkjet printing method and of the resulting thin inkjet printed films and their microscopic and optical characterization and (c) the complete electrochemical characterization of the resulting thin films as supercapacitor electrodes (cyclic voltammetry, electrochemical impedance spectroscopy, galvanostatic charge–discharge, stability tests).
2. Results and Discussion
2.1. Structural and Morphological Properties of NCO Nanoparticles
Powder X-ray diffraction (XRD) of NCO nanoparticles as made and after annealing at 350 °C was used to verify the crystal structure and phase of the nickel–cobalt oxide (NiCo2O4; NCO) as shown in Figure 1. The XRD pattern before annealing shows the characteristic peaks at 2θ 18.7°, 29.1°, 34.9°, 43.3°, 47.3°, 48.4° and 58.1°, which are attributable to the (202), (114), (022), (224), (602), (026) and (712) reflections of orthorhombic cobalt oxalate hydrate (C2H4CoO6). In addition, the characteristic peaks at 2θ 18.6°, 30.2°, 35.5°, 43.3°, 47.1°, 48.7° and 57.9° are attributable to the (202), (400), (022), (512), (225), (026) and (332) reflections of orthorhombic nickel oxalate hydrate (C2H4NiO6). The XRD pattern after annealing at 350 °C shows characteristic peaks at 2θ 18.91°, 31.15°, 36.70°, 38.41°, 44.62°, 55.44°, 59.09°, 64.98°, 68.31, and 77.55° which correspond to (111), (220), (311), (222), (400), (422), (511), (440) and (531) reflections of the crystalline structure of cubic nickel–cobalt oxide (NiCo2O4, NCO) with a cubic crystal system and correspond to the F*3 space group (JCPDS file No. 00-020-0781).
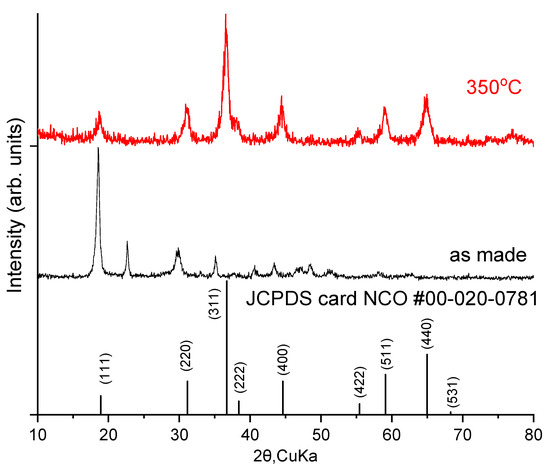
Figure 1.
Powder X-ray diffraction patterns of NCO nanoparticles before and after annealing.
The phase composition of the ITO substrate and inkjet-printed NCO layers was also characterized by XRD, as seen in Figure 2. The XRD pattern of the ITO glass substrate exhibits four peaks which are consistent with the reflections of planes (222), (400), (440) and (622) of indium tin oxide at 30.3°, 35.1°, 50.6° and 59.9°. The main characteristic peak (311 reflection) of cubic nickel–cobalt oxide can be observed at 36.7° for the samples with one and two inkjet-printed layers, and its low intensity can be attributed to the small film thinness.
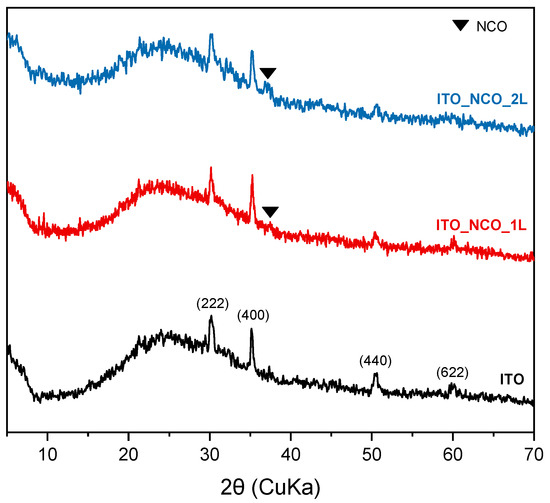
Figure 2.
Powder X-ray diffraction patterns of the ITO substrate and the NCO/ITO inkjet-printed composite.
Figure 3a shows the SEM image of deposited NCO nanoparticles. The powder consists of irregularly shaped particles with a porous morphology. The mean particle size varies significantly with diameters between 200 and 800 nm, as well as the formation of large agglomerates over 1–2 μm. After the ball milling process, the NCO particles have been reduced to a homogenous nanoparticle distribution with diameters less than 200 nm. Specifically, average particle diameter distributions before and after the process are given in Figure 3c,d. Before the milling process, NCO nanoparticle size ranged largely from a few nanometers to micrometers with an average diameter of 450 nm. After the process, nanoparticle diameter narrowed down to 30–150 nm with an average value of 65 nm, demonstrating the effectiveness of the ball milling process.
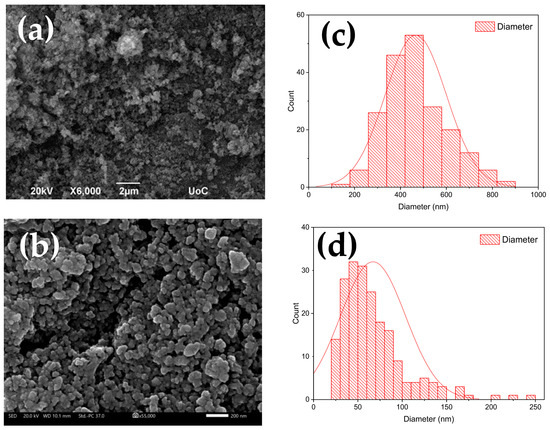
Figure 3.
SEM images of NCO nanoparticles before (a) and after the ball milling process (b). Average particle size distribution graphs before (c) and after the ball milling process (d).
Figure 4 shows transmission electron micrographs (TEM) of individual NCO nanoparticle aggregates. The material displays large clusters of NCO nanoparticles with diameters of about 100–300 nm, which consist of smaller nanoparticles in the range of 5–9 nm.
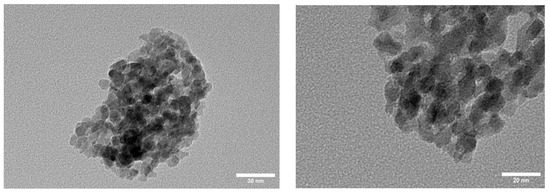
Figure 4.
TEM images of NCO nanoparticle aggregates.
EDX elemental analysis of NCO/ITO electrodes (Figure 5) confirms that Ni and Co elements are present in the mixed NCO at a relative ratio of 1:2, as expected for the NiCo2O4 compound, as well as the presence of In, Sn, Si and O of the ITO glass substrate.
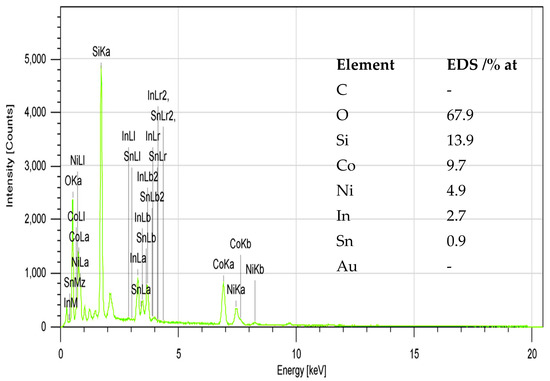
Figure 5.
EDX spectra and elemental analysis results for NCO/ITO electrodes.
Finally, EDS mapping of NCO/ITO substrates, presented in Figure 6 below, confirms a uniform and continuous distribution of the NCO material on the ITO substrate.
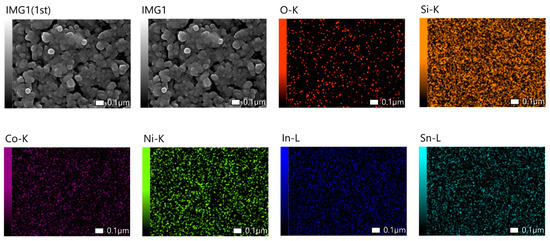
Figure 6.
EDS mapping of NCO/ITO samples showing element distribution of the NCO supercapacitor material and the ITO glass substrate.
2.2. Physicochemical Properties of NCO Nanoparticles Ink
The ability of an ink to be jetted is controlled by several properties such as viscosity and surface tension. Ink jet ability is correlated with a dimensionless number Z, the inverse Ohnesorge number, which is defined in Equation (1) as
where ρ is the density, γ is the surface tension, η is the viscosity of the suspension and α is the characteristic length scale (nozzle diameter). This dimensionless number relates inertia and surface tension to the viscous force of a liquid. For drop formation in DoD inkjet printing systems, the ideal range is 1 < Z < 10 for reliable droplet formation and jetting. An aqueous-based ink needs to have certain physicochemical properties inherent to water modifications. Despite its great many advantages as a solvent, high surface tension (about 70 mN/m) and low viscosity (about 1 mPa s) make water practically not inkjet-printed. In our case, propylene glycol was used as a viscosity modifier and increased viscosity from 1.00 to 1.71 mPa, thus improving jettability. In addition, Triton X-100 (a non-ionic surfactant) was added accordingly as a surface tension modifier. Table 1 shows the various physicochemical properties and calculated Z number for an aqueous NCO nanoparticles ink at different operating temperatures. At room temperature (25 °C), Z is within the desired range with higher temperatures exceeding the Z value of 10. This suggests an optimum operational cartridge temperature of 25 °C for this ink. At higher temperatures, when Z exceeds 10, the ink droplets are prone to splitting and formation of satellite drops which also aligns with the reduction in viscosity.

Table 1.
Physicochemical properties of the aqueous NCO ink and calculation of Z number for different operating temperatures.
Figure 7a shows the black color of the milled nanoparticle dispersion and prepared NCO ink. The average particle diameter within the suspension after formulation is around 150 nm, with most of the distribution well under 400 nm, as shown in Figure 7b. This indicates a low agglomeration rate and is highly important for the stability and printability of the ink. To avoid nozzle blockage problems, it is recommended that the maximum particle size does not exceed 1/50 of the nozzle diameter which corresponds to 430 nm. One other critical parameter is the shelf life of the ink. NCO nanoparticle ink shows very good stability through seven storage days (Figure 7d). After seven storage days, minimal precipitation was observed and was reversible with simply stirring by hand.
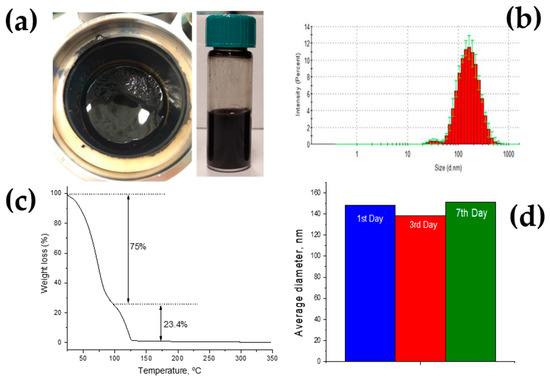
Figure 7.
Optimization of NCO nanoparticle ink formulation. (a) Formulated NCO nanoparticle ink, (b) particle size distribution, (c) thermogravimetric curve (TGA), (d) average particle diameter–storage.
Thermogravimetric analysis was performed to examine mass loss during the annealing process. Two distinct curves can be seen in Figure 7c, corresponding to the different solvents used for the formulation of the NCO ink. For the temperature range of 25–100 °C, a 75% mass loss is attributed to the evaporation of H2O. At 100–125 °C, propylene glycol is evaporated/decomposed with a 23.4% mass loss. These losses are in agreement with the solvent ratios used during formulation. NCO loading was estimated at 350 °C using the remaining 4.2% and was found to be 25.7 mg/mL. From the total volume of drops used to prepare one and two NCO layers samples (1L, 2L), the NCO loading is estimated to be 0.0175 and 0.0035 mg cm−2, respectively.
Figure 8a shows the contact angle behavior of a 2 μL NCO ink drop on an ITO glass substrate at room temperature. The initial angle of 39° indicates good wettability between the ink and the substrate, which is needed during pattern deposition. The angle rapidly decreases during the first 20 s due to the highwater evaporation rate. Using a pendant drop measurement in Figure 8b, the ink’s surface tension was calculated at 27.65 mN/m, a value within the desirable inkjet-printed range.
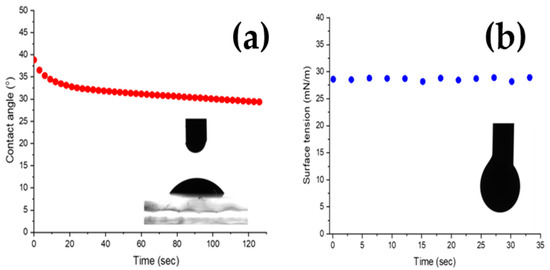
Figure 8.
Ink droplet contact angle (a) and surface tension (b).
2.3. Fabrication of Inkjet Printed NCO Electrodes
Jetting and droplet formation is presented in Figure 9a, where the ink exhibits an ideal behavior with the formation of a 10 pL cherry-like droplet. While exiting the cartridge nozzle, a small tail is produced that later retracts back to the main body. An SEM image of such a droplet deposited on an ITO glass substrate is shown in Figure 9b. The resulting circular pattern has a diameter of 42.6 um and shows excellent coverage without the appearance of irregularities such as the coffee ring effect. It consists of densely packed/agglomerated NCO nanoparticles (Figure 9c).
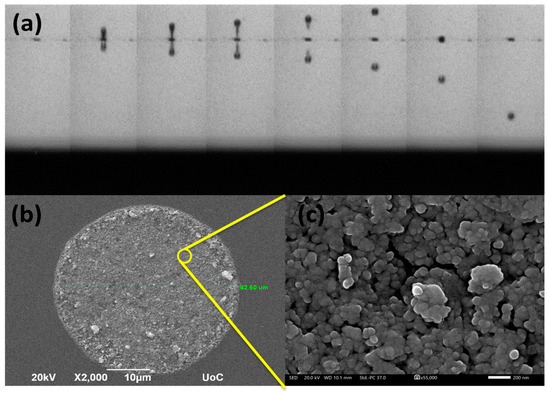
Figure 9.
(a) Optical image of NCO nanoparticles ink droplet formation vs. time as observed from the printer camera, (b) printed single dot on ITO glass substrate and (c) a closer view on the dot surface.
Single drop lines at different drop spacing values were deposited as shown in Figure 10a. Low drop spacing values result in the coagulation and distortion of lines due to heavy overlap between droplets. High drop spacing, on the other hand, results in isolated droplets that do not form a continuous pattern. A similar image is shown for thicker lines in Figure 10b. To create homogenous, evenly shaped patterns without gaps, a combination of specific drop spacing with multiple deposition layers can be used. An example of 50 μm thick lines at 40 μm DS and two layers is presented in Figure 10c,d.
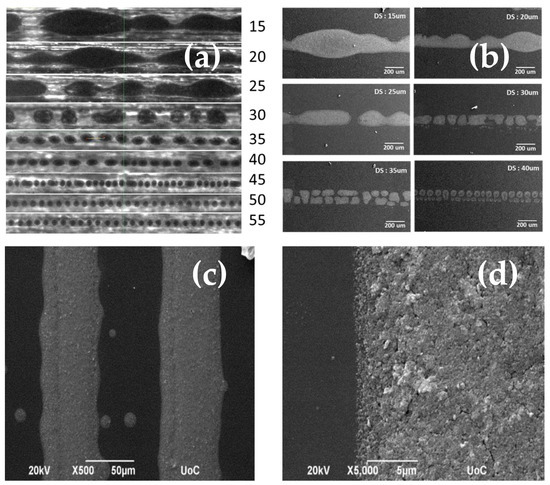
Figure 10.
(a) Optical images of deposited single drop lines at different drop spacing values as seen on the printer camera, (b) SEM images of 100 um thick lines at different drop spacing values, (c,d) SEM images of multilayer lines at different magnifications.
Figure 11a,b depict cross-sectional SEM images of 1L and 2L NCO/ITO electrodes, whereby compact NCO overlayers can be clearly seen. The average NCO thickness of 1L electrodes was found to be 295 nm, whereas that of 2L electrodes was 477 nm (indicating the filling in of gaps present in the first printed layer).
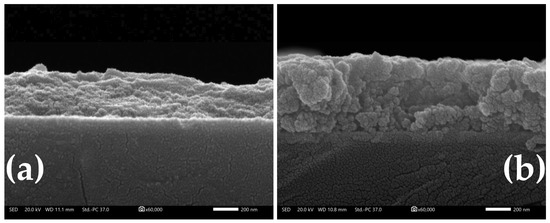
Figure 11.
Cross-sectional SEM micrograph of a 1L (a) and 2L (b) NCO inkjet-printed deposit on an ITO glass substrate.
UV–VIS spectrometry was used to estimate the transparency of the ITO glass substrate and the 1L-, 2L-coated samples. As seen in Figure 12, over the visible light wavelength range, the transmittance is relatively stable at an average of 83.64% for the ITO glass substrate due to the indium tin oxide thin film. The 1L and 2L semi-transparent NCO thin films have a visible (400–800 nm) transmittance of 40–60% and 35–50%, respectively.
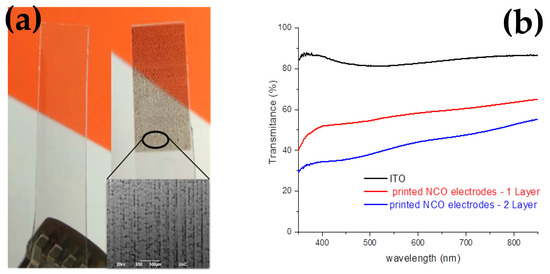
Figure 12.
(a) Photograph of the ITO glass substrate with/without the semi-transparent film and (b) the transmittance plot of the electrodes.
Film morphology and roughness at the nanoscale were studied by AFM (Figure 13). The 1L film appears smoother than the 2L one (average roughness, Sa = 1.35 nm and 37.71 nm, respectively), with the latter showing a higher degree of particle agglomeration.
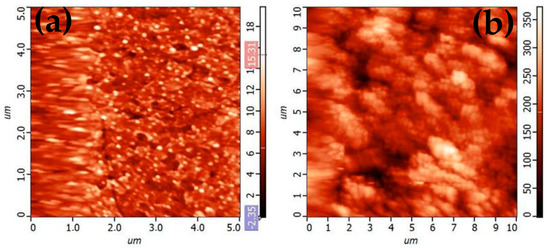
Figure 13.
AFM morphology of NCO semi-transparent thin films for (a) 1 Layer and (b) 2 Layer electrodes.
2.4. Electrochemical Performance/Electrochemical Characterization
Cyclic voltammograms (CVs) have been recorded for the preliminary investigation of capacitive/pseudo-capacitive/battery-type behavior of the electrode material (the latter two requiring the identification of electron transfer/faradaic/redox reactions, surface or diffusion-controlled reactions, respectively) [36], as well as the determination of the useful potential window of the material. Figure 14 shows CVs of 1L and 2L inkjet-printed NCO electrodes in 1 M NaOH, at various scan rates from 5 to 50 mV s−1, in the potential window of −0.2 to +0.7 V vs. SCE.
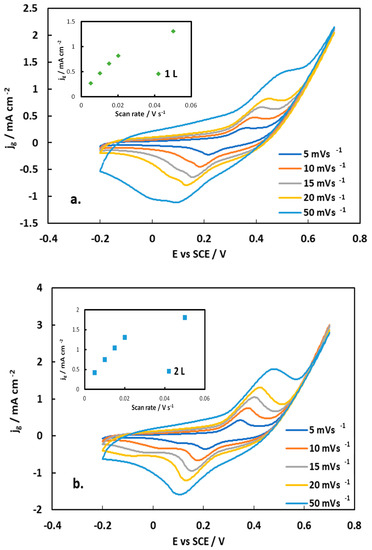
Figure 14.
CV curves of (a) 1L and (b) 2L inkjet-printed NiCo2O4 electrodes in a three-electrode cell at different scan rates in a 1 M NaOH solution. Inset: Plot of anodic peak current density (per substrate geometric area, jg) vs. potential scan rate.
A pair of redox peaks is clearly seen at all scan rates, with their separation increasing with potential scan rate, which indicates that the inkjet-printed NiCo2O4 electrode is undergoing a quasi-reversible faradaic reaction. Also, both the anodic and the cathodic peak are broad (with the anodic one showing a shoulder in the +0.50–+0.20 V range and the cathodic being split in two in the +0.20–0.00 range) as expected for mixed Ni and Co oxide electrochemistry and indeed recorded in all similar studies [19,20,21,22,23,24,25,26,27,28,29,30,31,32,33]. The redox peaks are attributed to the following redox reactions involving Ni and Co oxides and oxo-hydroxides as well OH− ions from the solution:
and
that occurs in two steps:
NiO + OH− ↔ NiOOH + e−
Co2O3 + 2OH− ↔ 2CoO2 + H2O + 2e−
Co2O3 + H2O ↔ 2CoOOH
2CoOOH +2OH− ↔ 2CoO2 + 2H2O + 2e−
Plots of the oxidation–anodic peak current density (current per substrate geometric area) with the potential scan rate is given in the insets of Figure 14. A linear correlation is observed for scan rates up to 20 mV s−1 (with a correlation coefficient higher than that of similar plots of peak currents versus the square root of the scan rate), in line with the findings in [21]. This indicates that the very thin NCO layers behave as hybrid supercapacitors, exhibiting pseudo-capacitive behavior (based on the classification given in [36]); it also means that the redox reactions (2) and (3) presented above are controlled by a surface electron transfer step and not by OH− mass transport limitations through the pores of thick battery-type electrodes. (Deviation from linearity, at the highest scan rate of 50 mV s−1 and associated current densities higher than 1 mA cm−2, may result from the onset of diffusion limitation of OH− through the solution).
Figure 15a,b display chronopotentiometry results of galvanostatic charge–discharge (GCD) experiments of 1L and 2L inkjet-printed NCO electrodes, at constant charge–discharge current densities in the ± 0.2–2.0 mA cm−2 range, between the voltage cut-off limits of +0.45 V and 0.00 V (deduced from the CVs to allow for oxide formation and reduction reactions, but excluding the oxygen evolution reaction, OER). The shape of the curves points again to an intermediate picture between that which is typical for electrical double layer (EDL) supercapacitors (of a triangular shape) and battery-type material (showing an extended voltage plateau), i.e., that of a hybrid supercapacitor exhibiting pseudo-capacitive behavior [36,37]. In fact, the shape of the curves implies that one could approximate the discharge part with a straight line between the potential limits (since the area under such a line can graphically be estimated to be within 10% of the experimental curve) and thus use as an approximation for the specific/areal capacitance C estimation, the simple relation that holds for EDL supercapacitors and a potential-independent C [37]:
where j is the discharge current density, tD is the discharge time and ΔVcorr is the voltage change corrected for ohmic losses. However, the rigorous equation that should be used for the average areal capacitance, Cave, of a hybrid supercapacitor is that of the general expression [5,28,37]:
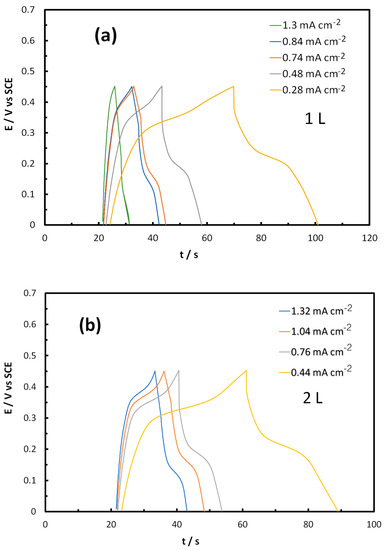
Figure 15.
Galvanostatic charge–discharge (GCD) potentiometry curves at various charge–discharge current densities of (a) 1L and (b) 2L inkjet-printed NCO/ITO electrodes, in a 1 M NaOH solution, using a three-electrode cell.
The origin of the sudden drop in the potential after current reversal is dual: it results from uncompensated ohmic losses, Ru, (due to contact, ITO and NCO particle electrical resistance as well as due to solution resistance between the Luggin tip of the reference electrode and the working electrode) and ionic resistance through the porous electrode film. (For complete, two-electrode devices, the sum of these two resistances is known as equivalent series resistance, RES [37]). To estimate the uncompensated ohmic losses and correct ΔV to ΔVcorr, (and, accordingly, Cave) we carried out Electrochemical Impedance Spectroscopy (EIS) experiments at potential values in the 0.30–0.45 V vs. SCE potential range.
Figure 16 below presents Nyquist plots of EIS data for 1L and 2L NCO/ITO electrodes in a 1 M NaOH solution in the frequency range of 105–0.1 Hz, obtained with an AC amplitude of 10 mV.

Figure 16.
Nyquist plots in the 105–0.1 Hz range at 0.37 and 0.35 V vs. SCE for 1L and 2L inkjet-printed NCO/ITO electrodes in 1 M NaOH.
Asymmetric and depressed semi-circles can be seen whose initial, distorted part at the highest frequencies used is typical of ionic resistance through porous electrodes in general [38,39] and particulate supercapacitor electrodes [23,26,27,37,40]. The rest of the semi-circle can be attributed to the surface electron transfer reactions of the NCO, and the smaller diameter of that corresponding to the 2L electrode indicates that it is characterized by a smaller charge transfer areal resistance, Rct, due to its higher real surface area (being rougher according to the AFM micrographs of Figure 13). The near-linear rise of the curve at lower frequencies could either be assigned to a Warburg impedance (associated to a diffusion process, most likely the transport of OH− ions within the pores of NCO electrodes during the redox reactions) or to a constant phase element CPE with an n value close to 0.5 (associated to a circuit element intermediate between a resistor and a capacitor, in line with the hybrid supercapacitor behavior of the material). Fitting an appropriate electrical circuit to the data ([Ru(RpCPEp)([RctW]CPEdl)]; inset of Figure 16) accounts for the above-mentioned processes and is also similar to those appearing in the literature [41,42]. Estimated values of the circuit components are presented in Table 2, and an interpretation follows.
Table 2.
Electrical circuit component values corresponding to the equivalent circuit shown in the inset of Figure 16.
The difference in uncompensated resistance values, Ru, of the two samples is too large to be attributed to solution resistance variations due to a change in the reference electrode Luggin capillary—working electrode distance (especially since this was fixed)—and it points to better interparticle electrical contact in the case of the more compact thicker (2L) film. This is also in line with the 2L electrode having a lower pore resistance, Rp, pointing to a surface pore network, not extending to the ITO substrate. Converting the Qdl admittance values to electrical double layer capacitance values, Cdl, based on the expression of the Brug equation proposed by Jovic et al. [43], one obtains almost identical values of 0.012 and 0.010 F cm−2 for 1L and 2L electrodes, respectively, that can be explained by the 1L electrode being more porous and only the outer layers of the more compact 2L electrode exhibiting adequate porosity to render them accessible to the electrolyte; hence, they are electroactive (this is also indicated by similar W diffusion resistance values). Finally, the much higher charge transfer resistance of Rct for the 1L electrode, when compared to that of the 2L one (unexpected for the same material and similar electroactive areas—similar double layer capacitance values) can only be rationalized if the higher porosity of the 1L film allows for the NCO redox surface reactions to occur not only at the NCO/electrolyte interface but also at locations of the ITO/NCO/electrolyte triple phase interphase, with ITO having an apparently inhibitory effect.
The values of 41 and 11 Ω cm2 that were estimated for Ru in experiments with 1L and 2L electrodes, respectively, have been used to correct the potential drop during the discharge part of the GCD curves:
ΔVcorrected = ΔV − |j| × Ru
Using Equations (7) and (8), we can calculate the values of Cave from the GCD data of Figure 15. Figure 17 shows the specific average capacitance (per mass of NCO) as a function of the charge–discharge current density. High values were obtained and remained nearly constant up to current densities higher than 1 mA cm−2, indicating good process reversibility. (Also note that an area-normalized current density of 1 mA cm−2 is significantly high for very thin layer supercapacitor electrodes as it translates to 58 and 29 A g−1 (for 1L and 2L electrodes) and lies in (or exceeds) the range studied for most similar NCO electrodes [19,20,21,22,23,24,25,26,27,28,29,30,31,32,33]).
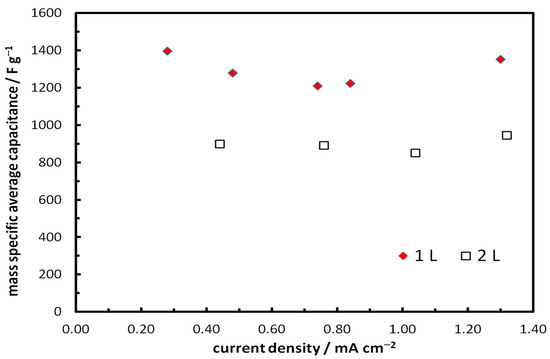
Figure 17.
Mass-specific average capacitance of 1L and 2L inkjet-printed NCO/ITO electrodes as a function of discharge current density, in 1 M NaOH solutions.
Finally, medium-term stability GCD tests were carried out for both 1L and 2L inkjet-printed NCO/ITO electrodes by carrying out 1000 GCD cycles and monitoring the capacitance over time. The results for the areal average capacitance shown in Figure 18 below indicate that no capacitance deterioration was observed during the tests. (In fact, there seems to be an activation of the 1L NCO/ITO electrode during the first 300 cycles.)
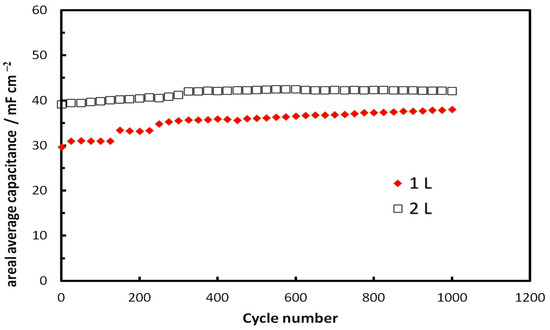
Figure 18.
Capacitance variation of inkjet-printed 1L and 2L NCO/ITO supercapacitor electrodes with number of GCD cycles, carried out at a 0.5 mA cm−2 (29 and 14.5 A g−1, respectively) in 1 M NaOH.
3. Discussion
The proof-of-concept for preparing low cost and high-performance semi-transparent metal oxide supercapacitor electrodes by inkjet-printing has been presented in the case of NiCo2O4 layers on ITO glass substrates. Very low loading (0.017 and 0.035 mg cm−2), thin (295 and 477 nm) and uniform NiCo2O4 films were deposited on ITO from dispersions of hydrothermally produced nanoparticles of the mixed oxide, by an appropriately optimized inkjet printing technique (using a water-propylene glycol-Triton X-100 ink formulation). The films showed a visible light transparency in the 30–60% range, making them ideal candidates for transparent electronics applications.
Preliminary electrochemical testing of the electrodes by cyclic voltammetry (CV), galvanostatic charge–discharge (GCD) and electrochemical impedance spectroscopy (EIS) confirmed that these very thin, redox-active materials (due to Ni and Co centers) behave as hybrid-type supercapacitors, as indicated by the appearance of quasi-reversible redox peaks in CVs, distorted GCD curves bearing narrow plateaus and a combination of semi-circles and straight lines at lower frequencies in Nyquist plots of EIS experiments.
These supercapacitor electrodes, during GCD experiments at 1 mA cm−2, exhibited areal capacitance values in the 22–29 mF cm−2 range and very high mass specific capacitance values that can reach 1294 F g−1 for the thinner samples tested.
Table 3 below presents a comparison of supercapacitor NCO electrode characteristics and performances for the electrodes of this work and similar systems that appear in the literature. (Note that for very thin film supercapacitor electrodes, the areal capacitance is much smaller than state-of-the-art thicker supercapacitor electrodes—see, for example, values as high as ca 3500 F cm−2 that are reported for hierarchically structured composite materials in [44]). One can see that the semi-transparent 1L NCO/ITO inkjet-printed electrode of this work exhibits the highest mass-specific capacitance among all the thin NCO electrodes tabulated and good volumetric capacitance too (comparable to that of one [25] of the two other values [25,28] that could be estimated from results found in the literature).
Table 3.
Preparation and performance parameters of thin (loading ≤1 mg cm−2) NCO supercapacitor electrodes found in the literature and studied in this work. (Parameters were either taken as quoted in the literature or calculated from data therein).
4. Materials and Methods
4.1. Materials
All the reagents were used as received and without further purification. Nickel(II) acetate tetrahydrate ((CH3COO)2Ni·4H2O), cobalt(II) acetate tetrahydrate (CH3COO)2Co·4H2O) and oxalic acid (HO2CCO2H2·H2O) were purchased from Merck (Darmstadt, Germany)).
4.2. NCO Nanoparticles
In a typical synthesis procedure, 5 mmol nickel acetate, 10 mmol of cobalt acetate and 10 mmol of oxalic acid were dissolved in 30 mL of distilled H2O and magnetically stirred for 30 min until a white, homogenous suspension was obtained. This was then transferred to a hydrothermal process bottle for 12 h at 90 °C. The resulting dispersion was centrifuged at 4000 rpm for 20 min. The white precipitate was washed twice with ethanol at 4000 rpm for 10 min and later dried at 80 °C for 4 h in a vacuum oven. The produced white powder was annealed at 350 °C for 2 h with a heating rate of 5 °C/min to obtain the final black nickel–cobalt oxide (NCO) particles.
4.3. Ink Preparation
For the formulation of the ink, the reagents used were distilled water, propylene glycol (C3H8O2) and Triton X-100 (C14H22O(C2H4O)n) from Merck. (Darmstadt, Germany) To reduce the particle size of the NCO powder, a ball milling technique was used where 3 g of NCO powder was dispersed in 25 mL of distilled H2O and placed in a ZrO2 vessel along with 100 g ZrO2 balls (0.5 mm diameter). The NCO dispersion was then centrifuged at 700 rpm for 30 min in a process that was repeated four times. A black dispersion with high NCO nanoparticle loading was thus obtained and subsequently mixed with propylene glycol in a 7:3 volume ratio (NCO/H2O:propylene glycol). Triton X-100 surfactant (0.5 mg/mL) was added in the suspension to improve the dispersion of the NCO nanoparticles. Then, the aqueous dispersion was filtered through a 0.45 μm syringe filter with a nylon membrane to remove large agglomerate particles which can cause blockage-related problems to the inkjet printer nozzles.
4.4. Fabrication of Inkjet Printed NCO Supercapacitor Electrodes
All patterns and devices were inkjet printed by a Dimatix DMP-2850 drop-on-demand (DoD) inkjet printer (Fujifilm Dimatix (Santa Clara, CA, USA)) equipped with a 10 pL piezoelectric cartridge (DMC-11610) and 3 mL of ink capacity. NCO nanoparticle ink was deposited on ITO glass substrates (10 Ohm/square). Before use, the ITO glass substrates were cleaned with a mixture of water and ethanol. The printed pattern dimensions were 5 × 1 cm with a 1- or 2-layer thickness, at a drop spacing of 40 μm and a cartridge temperature of 25–35 °C. Printing was followed by annealing in air at 350 °C for 2 h with a heat rate of 5 °C/min. (A schematic representation of NCO particles, ink and printed film preparation is given in Scheme 1 below).
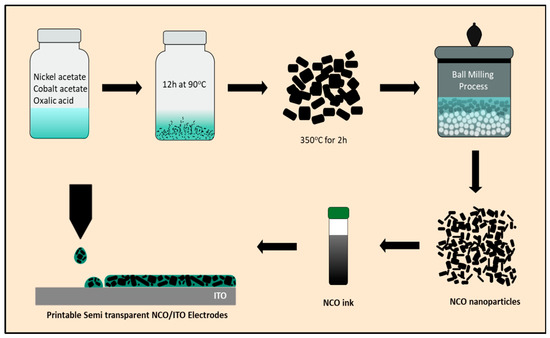
Scheme 1.
Schematic representation of the preparation of inkjet-printed semi-transparent NCO/ITO electrodes from solution-based synthesis of NCO particles to nanoparticles and to ink formulation.
4.5. Characterization
X-ray diffraction (XRD) was conducted on a Rigaku D/MAX-2000H (Tokyo, Japan) rotating anode diffractometer (1.54 Å CuKa radiation) equipped with a secondary pyrolytic graphite monochomator; X-Pert Highscore Plus was used to analyze and identify the diffraction patterns/determine the composition and structure of the NCO nanoparticles. Surface morphologies of the synthesized products were examined by Scanning Electron Microscopy (SEM) that was conducted on a JEOL 7000 electronic microscope JEOL Ltd., Tokyo, Japan), operated at 20 kV. Effective particle diameter was measured using DLS measurements on a Malvern Zetasizer Nano ZS90 (Malvern, UK). Thermogravimetric analysis was performed in a TGA SDT Q600 V8.3 Build 101 equipment (TA Instruments, New Castle, DE, USA) in an Argon gas environment (100.0 mL/min, 5 °C/min heating ramp). The goniometer used for contact angle and sessile drop measurements was an OCA35 by Dataphysics Instruments (Filderstadt, Germany). Viscometry was conducted using a DMA 4100 M density meter from Anton Paar (Albans, UK), with a Lovis 2000 ME micro-viscometer extension and a 0.59 mm stainless steel ball inside the capillary. The surface morphology and the thickness of the 1- and 2-layer thin films electrodes was examined via Atomic Force Microscopy, AFM, by means of a Solver Pro AFM (ΝΤ-ΜDT, Moscow, Russia)).
4.6. Electrochemical Measurements
The electrochemical characterization of inkjet-printed NiCo2O4 thin film electrodes was carried out by Cyclic Voltammetry (CV), Galvanostatic Charge–Discharge curves (GCD) and Electrochemical Impedance Spectroscopy (EIS) using a PGSTAT302N (Autolab, Metrohm, Herisau, Switzerland) electrochemical workstation. All the experiments were performed using fresh aqueous 1 M NaOH electrolyte. CV experiments were carried out in the 2–50 mV s−1 potential sweep rate range; EIS measurements were performed in the frequency range of 105–0.1 Hz with an AC amplitude of 10 mV, while GCD experiments were carried out by chronopotentiometry at constant charge/discharge current densities (in the 0.2–2 mA cm−2 range and with voltage cut-off values as determined by the potential window of interest, based on CV experiments). Stability tests were carried out at ca 0.5 mA cm−2 for 10,000 charge–discharge cycles. A three-electrode system consisting of platinum as a counter electrode, a SCE as a reference and NiCo2O4/ITO samples of different loadings (1 and 2 layers; 1L and 2L; 0.017 and 0.035 mg cm−2) was the working electrode. The area of deposited film in contact with the electrolyte was 0.5 cm2. A Luggin capillary, whose tip has been at a distance of 1 mm from the surface of the working electrode, was used to minimize the IR drop errors in the electrolyte solution.
Author Contributions
Conceptualization, S.S. and V.B.; methodology, A.B.; investigation, M.C., P.P. and C.P.; writing—original draft preparation, A.B.; writing—review and editing, S.S. and V.B. All authors have read and agreed to the published version of the manuscript.
Funding
This research received no external funding.
Data Availability Statement
Raw data available upon request from the corresponding Authors.
Conflicts of Interest
The authors declare no conflict of interest.
References
- Conway, B.E. Electrochemical Supercapacitors Scientific Fundamentals and Technological Applications, 1st ed.; Springer: New York, NY, USA, 1999; pp. 11–31. [Google Scholar] [CrossRef]
- Winter, M.; Brodd, R.J. What are batteries, fuel cells, and supercapacitors? Chem. Rev. 2004, 104, 4245–4269. [Google Scholar] [CrossRef] [PubMed]
- Miller, J.M. Ultracapacitor Applications, 1st ed.; The Institution of Engineering and Technology: Wales, UK, 2011; pp. 1–364. ISBN 978-1849190718. [Google Scholar]
- Béguin, F.; Frackowiak, E. Supercapacitors: Materials, Systems, and Applications, 1st ed.; Wiley-VCH Verlag GmbH & Co. KgaA: Weinheim, Germany, 2013; pp. 207–237. [Google Scholar] [CrossRef]
- Chen, G.Z. Understanding supercapacitors based on nano-hybrid materials with interfacial conjugation. Prog. Nat. Sci. Mater. Int. 2013, 23, 245–255. [Google Scholar] [CrossRef]
- Mulan, C.D. Supercapacitors: Electrochemical Properties, Applications and Technologies (Chemical Engineering Methods and Technology); Nova Science Publishers Inc.: Hauppauge, NY, USA, 2014; pp. 33–56. ISBN 978-1-63321-019-6. [Google Scholar]
- Simon, P.; Gogotsi, Y.; Dunn, B. Where do batteries end and supercapacitors begin? Science 2014, 343, 1210–1211. [Google Scholar] [CrossRef] [PubMed]
- Bagotsky, V.S.; Skundin, A.M.; Volfkovich, Y.M. Electrochemical Power Sources: Batteries, Fuel Cells, and Supercapacitors, 1st ed.; Wiley: Hoboken, NJ, USA, 2015; pp. 1–374. ISBN 978-1118460238. [Google Scholar]
- Yu, A.; Chabot, V.; Zhang, J. Electrochemical Supercapacitors for Energy Storage and Delivery: Fundamentals and Applications, 1st ed.; CRC Press: Boca Raton, FL, USA, 2013; pp. 1–355. ISBN 978-1439869895. [Google Scholar]
- Dubey, R.; Guruviah, V. Review of carbon-based electrode materials for supercapacitor energy storage. Ionics 2019, 25, 1419–1445. [Google Scholar] [CrossRef]
- Yu, L.; Chen, G.Z. Redox electrode materials for supercapatteries. J. Power Sources 2016, 326, 604–612. [Google Scholar] [CrossRef]
- Li, Y.; Han, X.; Yi, T.; He, Y.; Li, X. Review and prospect of NiCo2O4-based composite materials for supercapacitor electrodes. J. Energy Chem. 2018, 31, 54–78. [Google Scholar] [CrossRef]
- Zhang, Y.; Li, L.; Su, H.; Huang, W.; Dong, X. Binary metal oxide: Advanced energy storage materials in supercapacitors. J. Mater. Chem. A 2015, 3, 43–59. [Google Scholar] [CrossRef]
- An, T.; Cheng, W. Recent progress in stretchable supercapacitors. J. Mater. Chem. A 2018, 6, 15478–15494. [Google Scholar] [CrossRef]
- Chen, J.; Wang, Y.; Liu, W.; Ma, Y. Nano-Engineered Materials for Transparent Supercapacitors. ChemNanoMat 2019, 6, 42–52. [Google Scholar] [CrossRef]
- Zhao, W.; Jiang, M.; Wang, W.; Liu, S.; Huang, W.; Zhao, Q. Flexible Transparent Supercapacitors: Materials and Devices. Adv. Funct. Mater. 2020, 31, 2009136. [Google Scholar] [CrossRef]
- Zhang, Y.-Z.; Wang, Y.; Cheng, T.; Yao, L.-Q.; Li, X.; Lai, W.-Y.; Huang, W. Printed supercapacitors: Materials, printing and applications. Chem. Soc. Rev. 2019, 48, 3229–3264. [Google Scholar] [CrossRef]
- Sajedi-Moghaddam, A.; Rahmanian, E.; Naseri, N. Inkjet-printing technology for supercapacitor application: Current state and perspectives. ACS Appl. Mater. Interfaces 2020, 12, 34487–34504. [Google Scholar] [CrossRef]
- Hu, C.-C.; Cheng, C.-Y. Ideally pseudocapacitive behavior of amorphous hydrous cobalt-nickel oxide prepared by anodic deposition. Electrochem. Solid-State Lett. 2002, 5, A43–A46. [Google Scholar] [CrossRef]
- Fan, Z.; Chen, J.; Cui, K.; Sun, F.; Xu, Y.; Kuang, Y. Preparation and capacitive properties of cobalt-nickel oxides/carbon nanotube composites. Electrochim. Acta 2007, 52, 2959–2965. [Google Scholar] [CrossRef]
- Umeshbabu, E.; Rajeshkhanna, G.; Ranga Rao, G. Urchin and sheaf-like NiCo2O4 nanostructures: Synthesis and electrochemical energy storage application. Int. J. Hydrogen Energy 2014, 39, 15627–15638. [Google Scholar] [CrossRef]
- Zhang, D.; Yan, H.; Lu, Y.; Qiu, K.; Wang, C.; Tang, C.; Zhang, Y.; Cheng, C.; Luo, Y. Hierarchical mesoporous nickel cobaltite nanoneedle/carbon cloth arrays as superior flexible electrodes for supercapacitors. Nanoscale Res. Lett. 2014, 9, 139. [Google Scholar] [CrossRef]
- Jokar, E.; Zad, A.I.; Shahrokhian, S. Synthesis and characterization of NiCo2O4 nanorods for preparation of supercapacitor electrodes. J. Solid State Electrochem. 2015, 19, 269–274. [Google Scholar] [CrossRef]
- Shi, P.; Chen, R.; Hua, L.; Li, L.; Chen, R.; Gong, Y.; Yu, C.; Zhou, J.; Liu, B.; Sun, G.; et al. Highly Concentrated, Ultrathin Nickel Hydroxide Nanosheet Ink for Wearable Energy Storage Devices. Adv. Mater. 2017, 29, 1703455. [Google Scholar] [CrossRef]
- Salunkhe, R.R.; Jang, K.; Yu, H.; Yu, S.; Ganesh, T.; Han, S.-H.; Ahn, H. Chemical synthesis and electrochemical analysis of nickel cobaltite nanostructures for supercapacitor applications. J. Alloys Compd. 2011, 509, 6677–6682. [Google Scholar] [CrossRef]
- Gao, Y.; Zhang, W.; Yang, X.; Ma, Y.; Shao, J.; Li, Y. Ni-Co nanosheets supported on conductive “core” for integrated supercapacitor with high performance. Electrochim. Acta 2016, 201, 260–267. [Google Scholar] [CrossRef]
- Tang, Y.; Cheng, B. 3D self-supported hierarchical Ni-Co architectures with integrated capacitive performance and enhanced electronic conductivity for supercapacitors. Energy 2016, 112, 755–761. [Google Scholar] [CrossRef]
- Liu, Y.; Wang, N.; Yang, C.; Hu, W. Sol-gel synthesis of nanoporous NiCo2O4 thin films on ITO glass as high-performance supercapacitor electrodes. Ceram. Int. 2016, 42, 11411–11416. [Google Scholar] [CrossRef]
- Zhang, G.; Hu, J.; Nie, Y.; Zhao, Y.; Wang, L.; Li, Y.; Liu, H.; Tang, L.; Zhang, X.; Li, D.; et al. Integrating Flexible Ultralight 3D Ni Micromesh Current Collector with NiCo Bimetallic Hydroxide for Smart Hybrid Supercapacitors. Adv. Funct. Mater. 2021, 31, 2100290. [Google Scholar] [CrossRef]
- Ujjain, S.K.; Bhatia, R.; Ahuja, P.; Attri, P. Highly Conductive Aromatic Functionalized Multi-Walled Carbon Nanotube for Inkjet Printable High Performance Supercapacitor Electrodes. PLoS ONE 2015, 10, e0131475. [Google Scholar] [CrossRef]
- Li, L.; Secor, E.B.; Chen, K.-S.; Zhu, J.; Liu, X.; Gao, T.Z.; Seo, J.-W.T.; Zhao, Y.; Hersam, M.C. High-Performance Solid-State Supercapacitors and Microsupercapacitors Derived from Printable Graphene Inks. Adv. Energy Mater. 2016, 6, 1600909. [Google Scholar] [CrossRef]
- Zhang, C.J.; McKeon, L.; Kremer, M.P.; Park, S.-H.; Ronan, O.; Seral-Ascaso, A.; Barwich, S.; Coileáin, C.Ó.; McEvoy, N.; Nerl, H.C.; et al. Additive-Free MXene Inks and Direct Printing of Micro-Supercapacitors. Nat. Commun. 2019, 10, 1795. [Google Scholar] [CrossRef] [PubMed]
- Wang, Y.; Zhang, Y.-Z.; Dubbink, D.; Ten Elshof, J.E. Inkjet Printing of δ-MnO2 Nanosheets for Flexible Solid-State Micro-Supercapacitor. Nano Energy 2018, 49, 481–488. [Google Scholar] [CrossRef]
- Poudel, M.B.; Kim, A.A.; Lohani, P.C.; Yoo, D.J.; Kim, H.J. Assembling zinc cobalt hydroxide/ternary sulfides heterostructure and iron oxide nanorods on three-dimensional hollow porous carbon nanofiber as high energy density hybrid supercapacitor. J. Energy Storage 2023, 60, 106713–106725. [Google Scholar] [CrossRef]
- Poudel, M.B.; Kim, A.R.; Ramakrishan, S.; Logeshwaran, N.; Ramasamy, S.K.; Kim, H.J.; Yoo, D.J. Integrating the essence of metal organic framework-derived ZnCoTe–N–C/MoS2 cathode and ZnCo-NPS-N-CNT as anode for high-energy density hybrid supercapacitors. Compos. B Eng. 2022, 247, 110339. [Google Scholar] [CrossRef]
- Gogotsi, Y.; Penner, R.M. Energy Storage in Nanomaterials–Capacitive, Pseudocapacitive, or Battery-like? ACS Nano 2018, 12, 2081–2083. [Google Scholar] [CrossRef]
- Zhang, S.; Pan, N. Supercapacitors performance evaluation. Adv. Energy Mater. 2015, 5, 1401401. [Google Scholar] [CrossRef]
- Lefebvre, M.C.; Martin, R.B.; Pickup, P.G. Characterization of ionic conductivity profiles within proton exchange membrane fuel cell gas diffusion electrodes by impedance spectroscopy. Electrochem. Solid-State Lett. 1999, 2, 259–261. [Google Scholar] [CrossRef]
- Papaderakis, A.; Tsiplakides, D.; Balomenou, S.; Sotiropoulos, S. Electrochemical impedance studies of IrO2 catalysts for oxygen evolution. J. Electroanal. Chem. 2015, 757, 216–224. [Google Scholar] [CrossRef]
- Mei, B.-A.; Munteshari, O.; Lau, J.; Dunn, B.; Pilon, L. Physical Interpretations of Nyquist Plots for EDLC Electrodes and Devices. J. Phys. Chem. C 2017, 122, 194–206. [Google Scholar] [CrossRef]
- Wang, W.; Guo, S.; Lee, I.; Ahmed, K.; Zhong, J.; Favors, Z.; Zaera, F.; Ozkan, M.; Ozkan, C.S. Hydrous Ruthenium Oxide Nanoparticles Anchored to Graphene and Carbon Nanotube Hybrid Foam for Supercapacitors. Sci. Rep. 2014, 4, 4452. [Google Scholar] [CrossRef] [PubMed]
- Gobal, F.; Faraji, M. Preparation and electrochemical performances of nanoporous/cracked cobalt oxide layer for supercapacitors. Appl. Phys. A 2014, 117, 2087–2094. [Google Scholar] [CrossRef]
- Jović, B.M.; Lačnjevac, U.Č.; Jović, V.D.; Gajić-Krstajić, L.; Kovač, J.; Poleti, D.; Krstajić, N.V. Ni-(Ebonex-supported Ir) composite coatings as electrocatalysts for alkaline water electrolysis. Part II: Oxygen evolution. Int. J. Hydrog. 2016, 41, 20502–20514. [Google Scholar] [CrossRef]
- Poudel, M.B.; Kim, H.J. Confinement of Zn-Mg-Al-layered double hydroxide and α-Fe2O3 nanorods on hollow porous carbon nanofibers: A free-standing electrode for solid-state symmetric supercapacitors. J. Chem. Eng. 2022, 429, 132345–132359. [Google Scholar] [CrossRef]
Disclaimer/Publisher’s Note: The statements, opinions and data contained in all publications are solely those of the individual author(s) and contributor(s) and not of MDPI and/or the editor(s). MDPI and/or the editor(s) disclaim responsibility for any injury to people or property resulting from any ideas, methods, instructions or products referred to in the content. |
© 2023 by the authors. Licensee MDPI, Basel, Switzerland. This article is an open access article distributed under the terms and conditions of the Creative Commons Attribution (CC BY) license (https://creativecommons.org/licenses/by/4.0/).