Article

Neodymium-Doped Zinc Oxide Nanoparticles Catalytic Cathode for Enhanced Efficiency of Microbial Desalination Cells

1
Center for Solar Cells & Renewable Energy, Department of Physics, Sharda School of Basic Sciences and Research, Sharda University, Greater Noida 201310, India
2
Department of Life Sciences, School of Basic Science and Research, Sharda University, Greater Noida 201306, India
3
Department of Biotechnology, Graphic Era Deemed to be University, Dehradun 248002, India
4
Department of Biotechnology, Sharda School of Engineering & Technology, Sharda University, Greater Noida 201310, India
5
Department of Physics, Faculty of Sciences, University 20 Août 1955, Skikda 21000, Algeria
6
Department of Optometry, College of Applied Medical Sciences, King Saud University, Riyadh 11433, Saudi Arabia
7
Faculty of Science and Technology, Madhyanchal Professional University, Ratibad, Bhopal 462044, India
8
Environmental and Atmospheric Sciences Research Group, Scientific Research Center, Al-Ayen University, Thi-Qar, Nasiriyah 64001, Iraq
9
Department of Environmental Energy and Engineering, Kyonggi University, Suwon-si 16227, Republic of Korea
10
Department of Medical Biotechnology and Integrative Physiology, Institute of Biotechnology, Saveetha Institute of Medical and Technical Sciences, Saveetha School of Engineering, Thandalam, Chennai 602105, India
11
Department of Earth Resources & Environmental Engineering, Hanyang University, 222-Wangsimni-ro, Seoul 04763, Republic of Korea
*
Authors to whom correspondence should be addressed.
Catalysts 2023, 13(8), 1164; https://doi.org/10.3390/catal13081164
Submission received: 4 July 2023 / Revised: 15 July 2023 / Accepted: 18 July 2023 / Published: 28 July 2023

Abstract

:
The Microbial Desalination Cell is a novel method for desalinating water that also generates energy via substrate oxidation. The MDC comprises three chambers: the anode chamber, the desalination chamber, and the cathode chamber. The fundamental problem with the technology is that it generates very little power during the oxygen reduction reaction (ORR). One solution to this issue is to use a highly active cathode catalyst, which effectively increases the ORR rate. Neodymium-doped ZnO nanoparticles were produced and employed as a cathode catalyst in the three-chambered MDC1 to improve performance. Zn1−xNdxO nanocrystalline samples containing x = 0.0, 0.03, 0.6, and 0.10 were synthesized efficiently through the cost-efficient sol-gel method. Transmission electron microscopy (TEM) and X-ray diffraction techniques revealed the nanocrystalline nature and the phase purity of the Zn1−xNdxO samples. The structural properties of ZnO nanostructured materials were elucidated by Rietveld refinement of the XRD patterns, which showed displacement of Zn and O ions and revealed changes in the electron density around the Zn-O bond with Nd substitution. The local features of light emission from Zn1−xNdxO samples have been studied with photoluminescence. The UV and green-yellow emissions originate from the exciton transition and the transition between the Nd3+ deep level, oxygen vacancy and interstitial oxygen. The results were compared to MDC-2, which did not have a catalyst on the cathode. Both MDCs were tested using a saline water solution containing 15 g/L of NaCl to measure their desalination performance. The better reduction kinetics was confirmed by cyclic voltammetry of the MDC-1 cathode. MDC-1 had a higher desalination efficiency (77.02% ± 2.0%) due to the presence of an Nd-doped ZnO catalyst than MDC-2 (59.3% ± 8.3%). MDC-1’s maximum power density of 3.65 W/m3 was 2.78 times greater than MDC-2’s (0.78 W/m3). Furthermore, the coulombic efficiency of MDC-1 was found to be (8.8 ± 0.3%), which was much higher than that of MDC-2 (4.56 ± 0.2%). As a result, the Nd-doped ZnO-based catalyst developed in this study can potentially improve ORR in MDC cathodes, enabling them to generate more power.

1. Introduction

The fast expansion of the human population has had a significant negative impact on the quality and quantity of the world’s freshwater supply, posing a serious threat to the continued existence of the human race. Another major issue is that freshwater supplies are not distributed evenly globally [1]. One long-term solution to this growing water need is desalinating saltwater or brackish water. However, the rising cost of fresh water puts pressure on researchers to develop a combination of a desalination reactor for brackish or seawater treatment [2]. One variant of MFCs is the microbial desalination cell (MDC), which can desalinate saline water and recover energy simultaneously [3]. To extend the useful life of reverse osmosis (RO) membranes, MDC is being developed as a pre-treatment device that can be used in conjunction with RO or as a standalone method for treating saltwater [4]. A conventional MDC uses the energy released during microbial respiration in an anodic chamber to directly transform the biochemical energy inherent in the chemical bonds of organic matter in wastewater into electricity [3,5].
Microbial desalination cells (MDCs) are a promising new technology with the potential to reduce the salt content in brackish water and generate renewable electricity without adding to environmental damage [6]. The slow rate at which MDC produces power and desalinates water is the primary barrier to its widespread use [7]. Catholyte reduction kinetics is a major bottleneck in the efficiency of microbial desalination cells. Because of its high oxidation potential, low toxicity, and abundant availability in nature, oxygen is the preferred terminal electron acceptor in MDCs [8]. The cathodic overpotential loss during the ORR and the high cost of noble cathode catalysts (like pt) used to increase ORR kinetics are two of the most significant barriers to the widespread, long-term use of MDCs [9]. Thus, it is crucial to create a cheap cathode catalyst to boost ORR on the cathode to increase the power output from MDCs [7]. Researchers are increasingly looking to transition metal oxides for cathode catalyst use in MDCs because of their high ORR rate demonstration and low fabrication cost [10].
Jacobson et al. built an up-flow microbial desalination cell (UMDC) through an air cathode to achieve continuous mode operation for desalinating salt water. This UMDC successfully demonstrated salt removal of 90% using brine water with a starting salt concentration of 30 g/L [11]. Pt-catalyzed stacked MDCs achieved a maximal total desalination rate of 0.025 g/h, 1.4 times more than a single chamber MDC with a Pt catalyst on the cathode [12]. The high cost and instability of pt from sulfide intoxication make it unsuitable for bigger MDCs. As a result, scientists have spent the last few decades conducting extensive research into developing novel, long-lasting, highly active, and cost-effective replacements for platinum-based materials [13]. Zinc oxide nanoparticles are the second most prevalent type of metal oxide because they are abundant, inexpensive, and safe to work with [14].
The high performance and novel functionalities, such as flexibility and mobility, of ZnO nanostructured materials make them ideal for use in next-generation optoelectronic (ultraviolet (UV) nano-LASER, UV photodetector, light emitting diode), energy conversion (solar cells, piezoelectric nanogenerators), and spintronic (spin-based) devices. ZnO is a promising II-VI compound semiconductor material due to its direct band gap of 3.37 eV, strong excitation binding energy of 60 meV, and high electron mobility of roughly 100 cm2 V−1 s−1 at room temperature [14]. The electrical, optical, and magnetic characteristics of ZnO nanostructure (nanoparticles, nanorods, nanocubes, nanoflowers, and nanotubes) materials have been intensively doped for potential device applications, most notably as dilute magnetic semiconductors (DMS) [14,15].
ZnO nanostructured materials emitting blue, orange, green, yellow, and ultraviolet (UV) light have received enormous attention due to their promising future uses. Energy band engineering via transition metal, rare earth element doping, and processing conditions has been widely used to improve the luminescence efficiency and the tunability of ZnO nanostructured materials across a broad optical range (orange to blue) [15]. Abdullah et al. [14] intended to tune diverse colored luminescence of the ZnO nanoparticles in the visible region via Eu doping, and they reported red luminescence at 616 nm [16]. Fujihara et al. [17] reported visible photoluminescence (blue, green, and orange) in Mg-doped ZnO materials sintered in different oxidizing atmospheres, and they also explained the shallow, deep intrinsic, acceptor, and donor defect levels [17]. Panigrahy et al. [18] explained that the green luminescence and the yellow luminescence of the pristine ZnO nanorods fabricated at different annealing oxygen atmospheres are due to the different charge states of oxygen vacancies. Oxygen vacancies are the most prevalent type of defect in ZnO and are also the source of the material’s visible luminescence [18].
Nd3+ doped ZnO nanostructured materials have not been studied in depth with regard to their structure, electron density, or photoluminescence capabilities, as far as we are aware. The XRD results of Nd3+ doped nanostructured materials confirm only the difference in ionic radius-induced lattice distortion but no further insight into the crystal structure. Photoluminescence measurements provided information about the defect levels, but no further insight into the defect energy levels of Nd3+ doped ZnO nanostructured materials [19]. Our objective in this study was to investigate the material’s structure, its electron density, and its optical and luminescent capabilities. To achieve this goal, Nd-doped ZnO nanostructured materials were synthesized using a sol-gel technique based on 2-methoxy ethanol, and their crystallographic structural characteristics, microstructure, and luminous properties were carefully studied. XRD and TEM confirmed the pure phase formation and lattice distortion in Nd3+ doped ZnO nanostructured materials. The luminescent properties of the pure and Nd-doped ZnO nanostructured materials were also investigated, and the violet, blue, green, and orange luminescence were also tuned with the Nd doping.
This combination can extract the most energy from wastewater while treating it and desalinating the saline solution in the desalination chamber. MDC1 with an Nd-doped ZnO air cathode catalyst and MDC2 without a catalyst were tested for power recovery, coulombic efficiency (CE), and wastewater treatment performance. This catalyst’s cathodic reduction kinetics were studied utilizing a range of electrochemical techniques, including cyclic voltammetry (CV) and polarization [20]. After the MFC attained a constant maximum in their OCP, polarization investigations were carried out using a variable resistance box by changing the external resistance from 30 Ω to 90 kΩ, which are the corresponding polarization curves of the MFC [21].

2. Results & Discussion

2.1. Characterization of Nd-Doped ZnO Catalyst for MDC

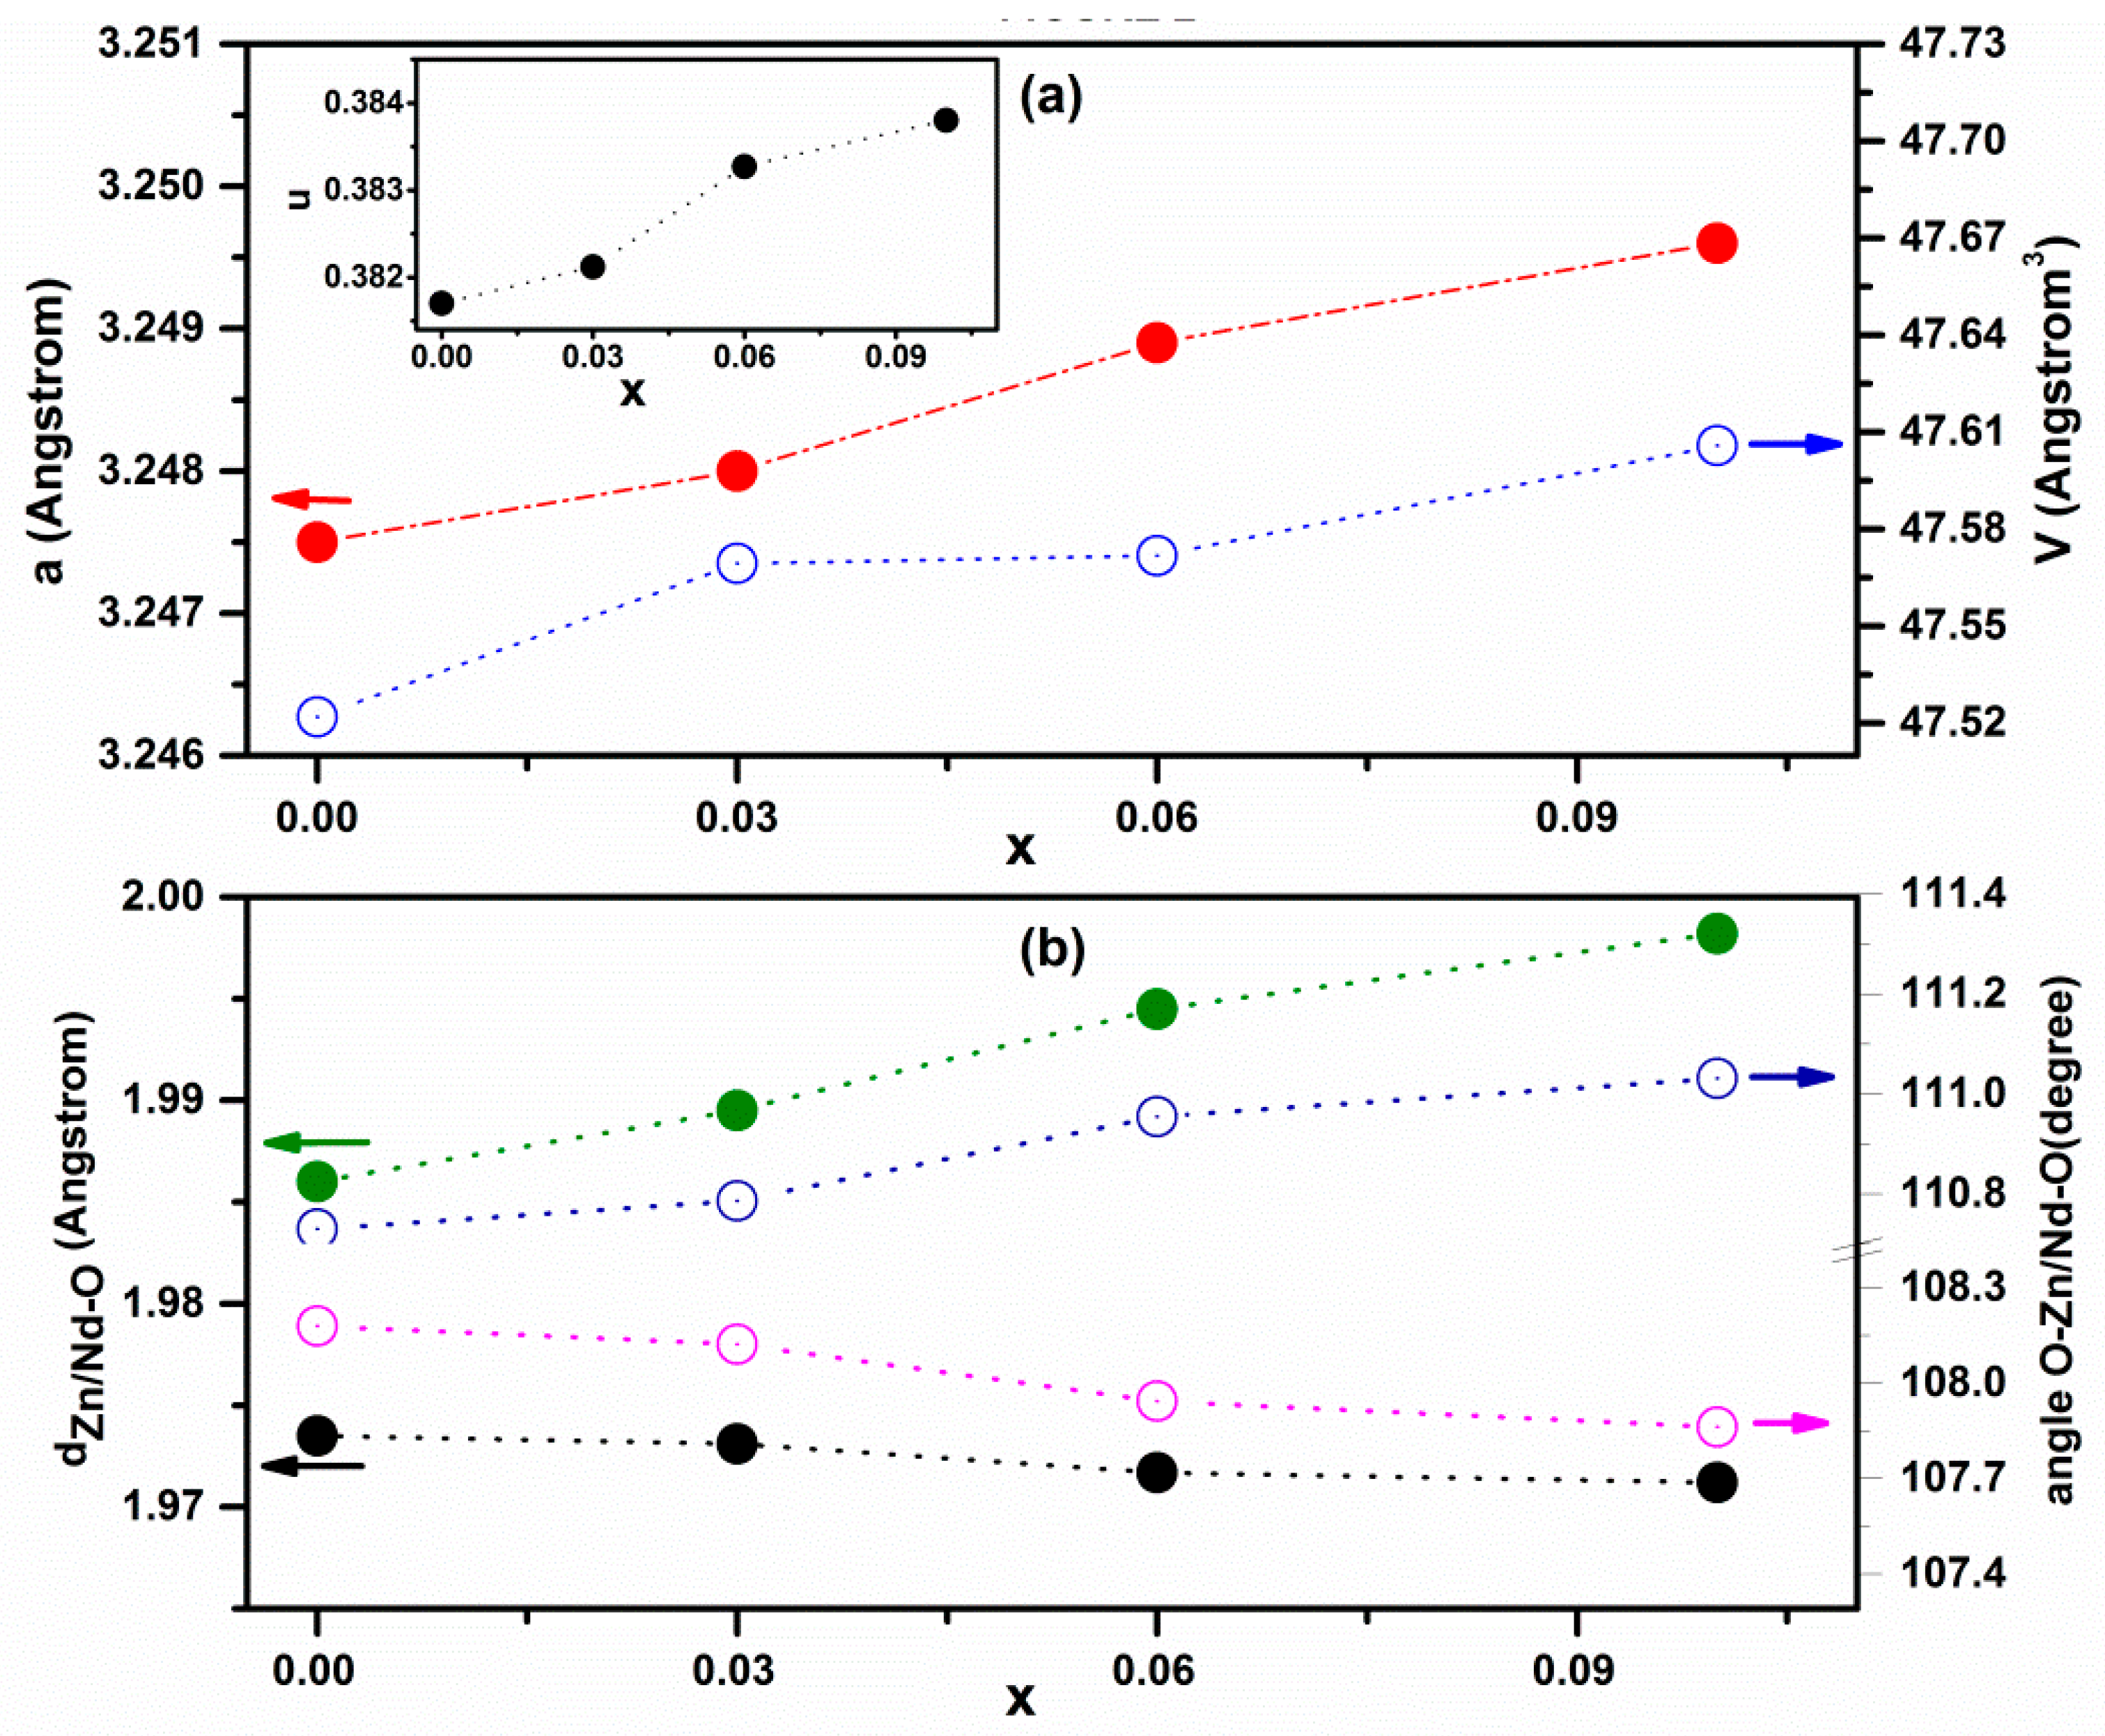
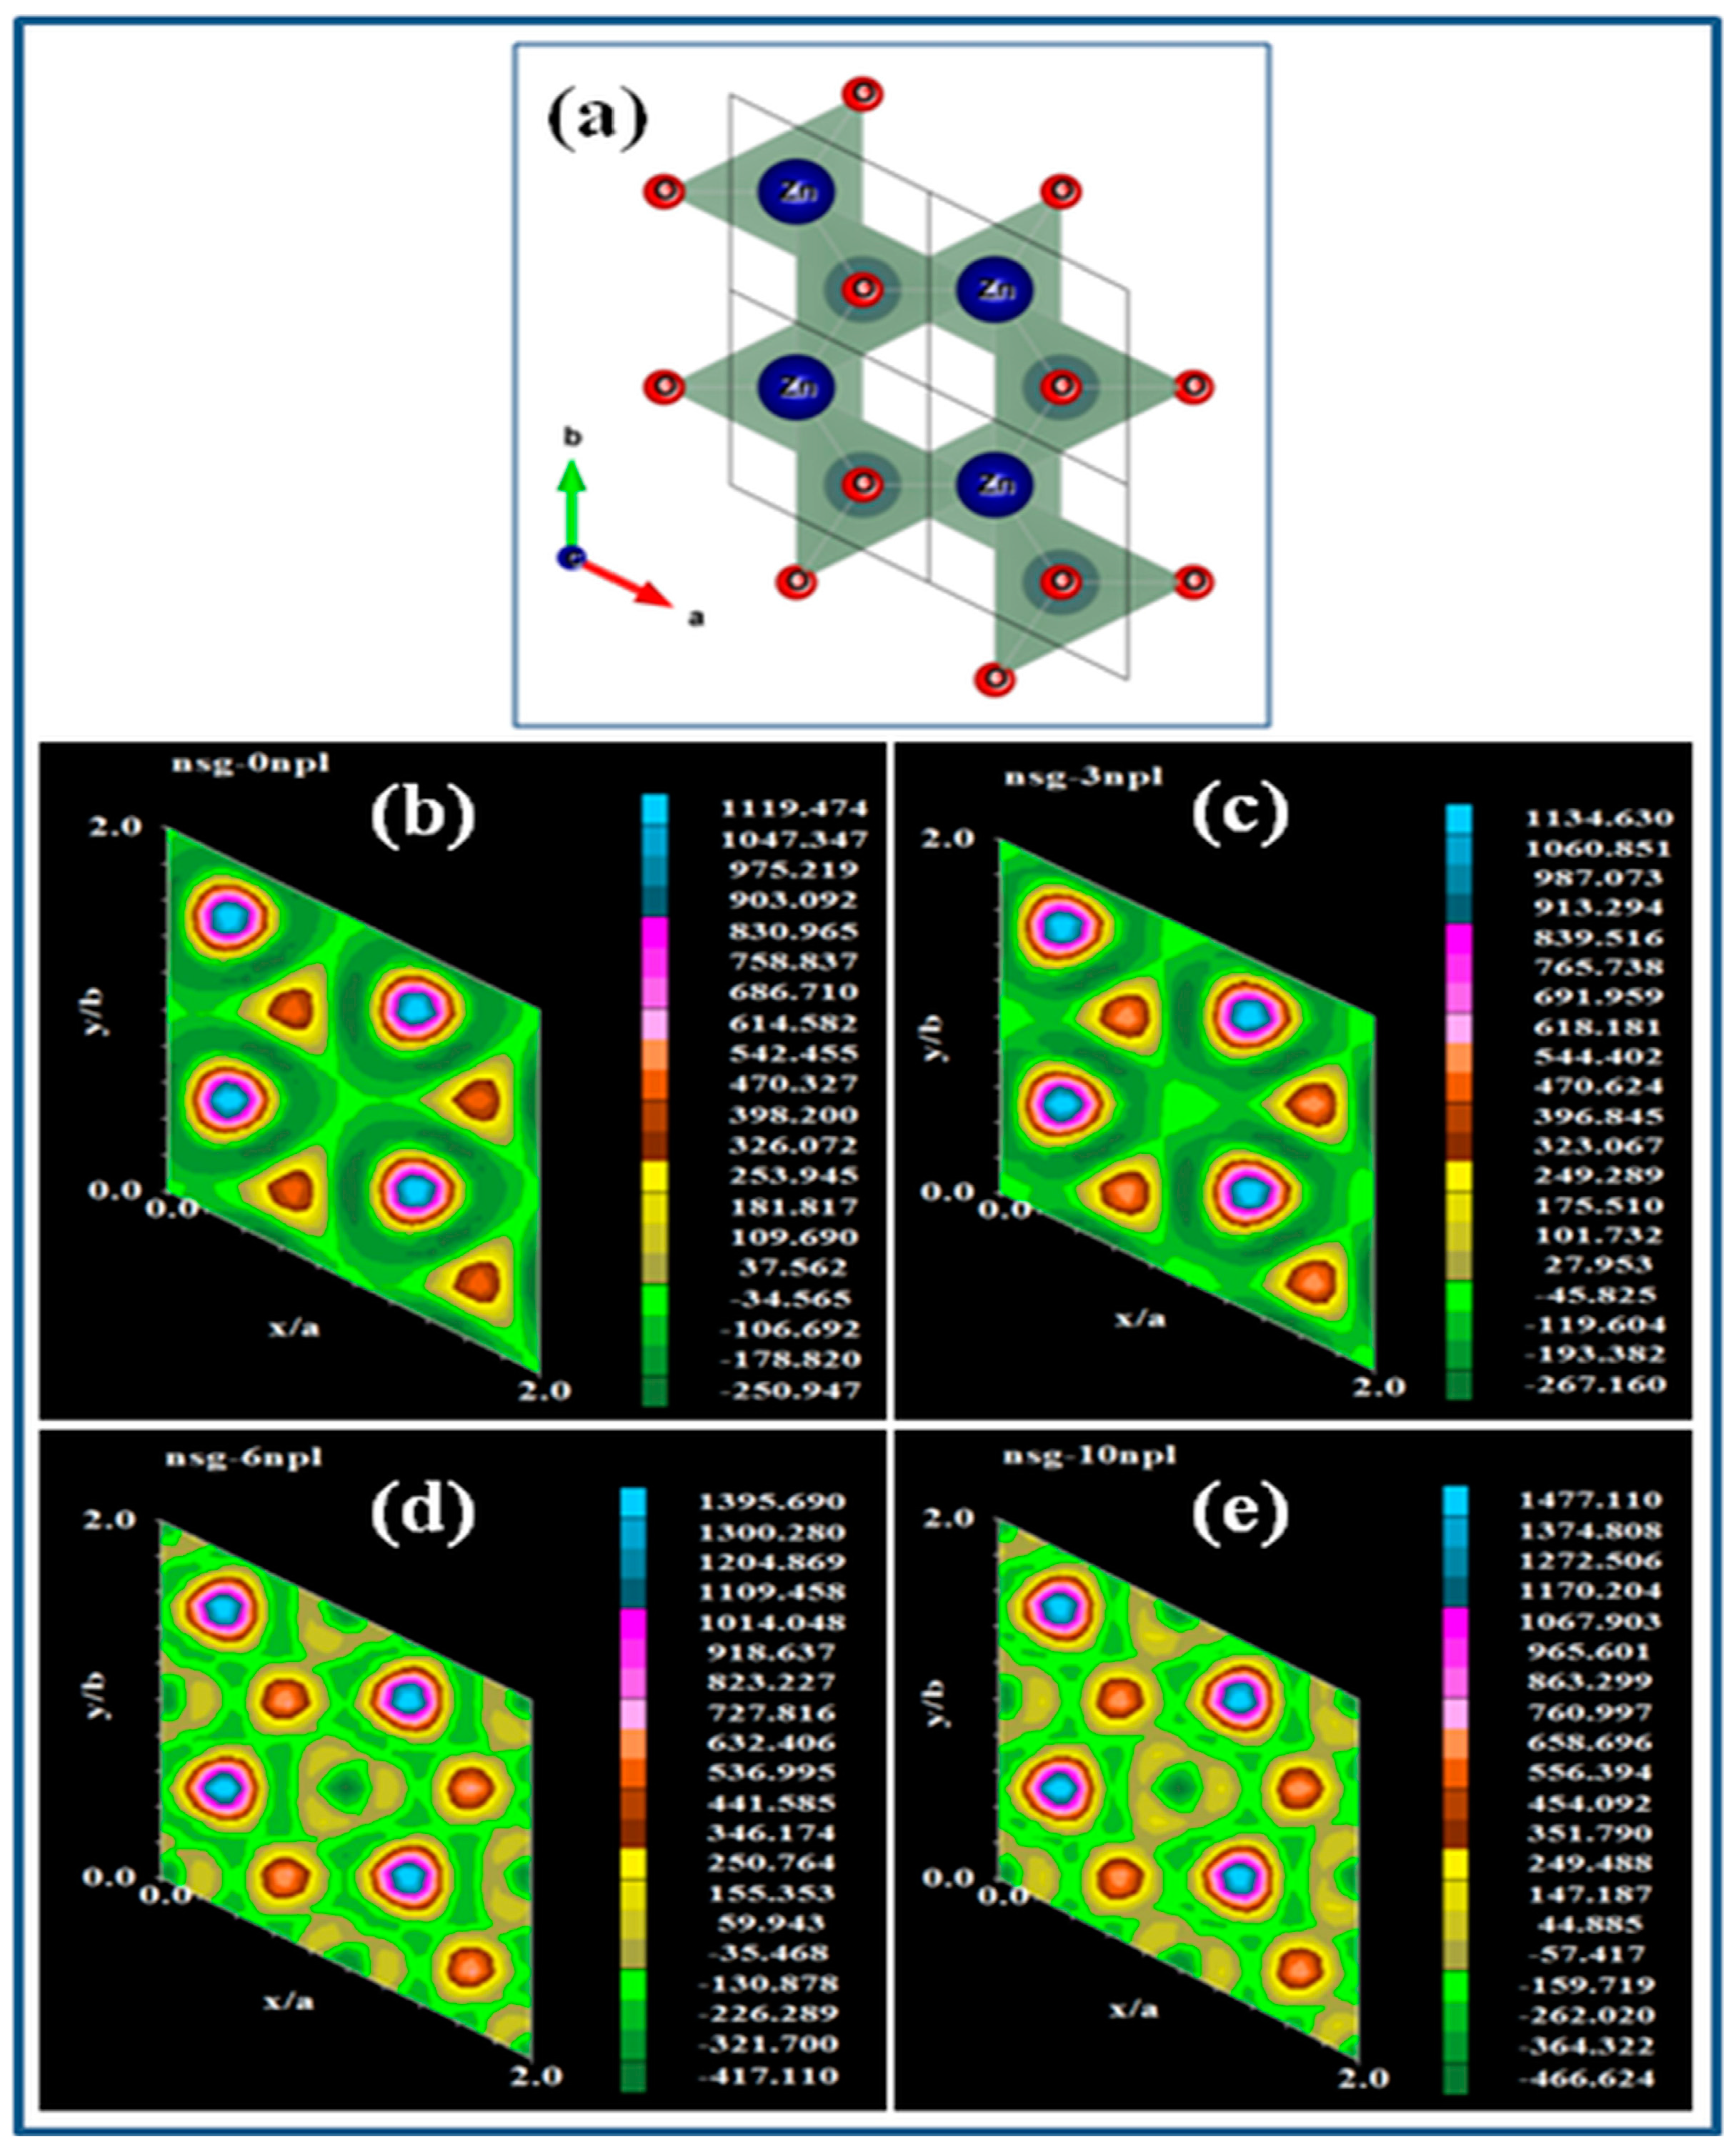
2.1.1. X-ray Diffraction Technique
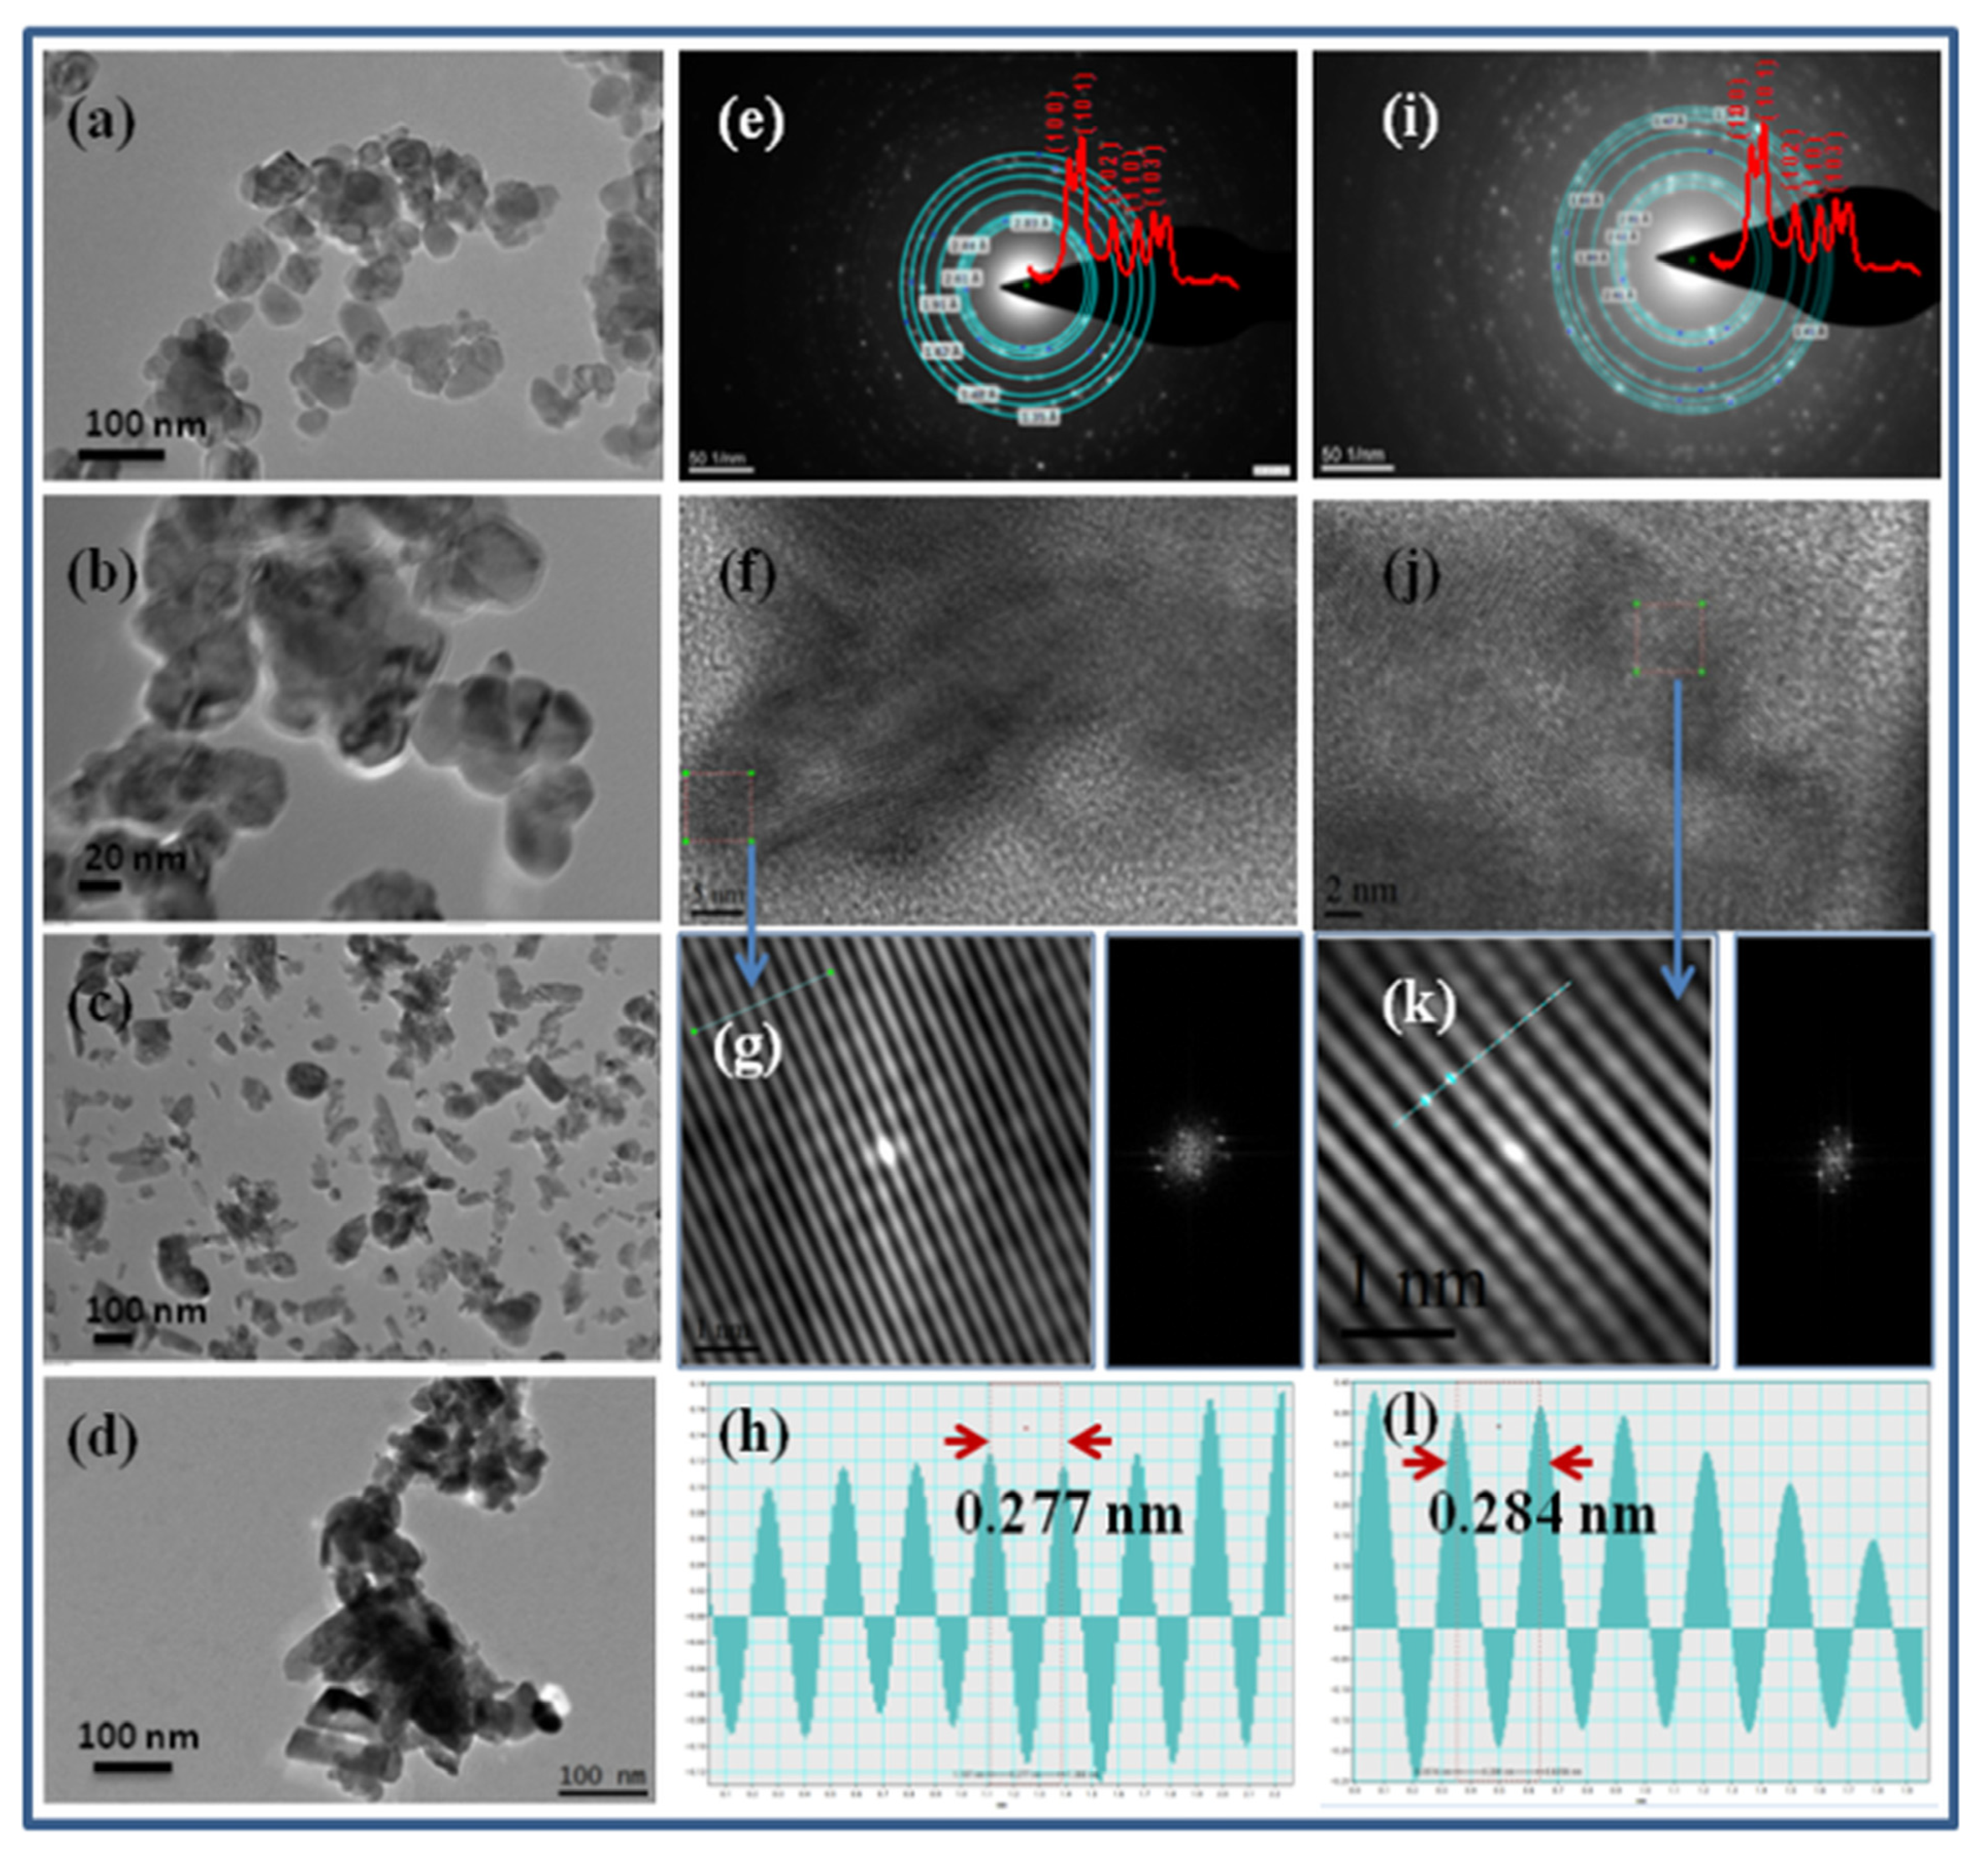
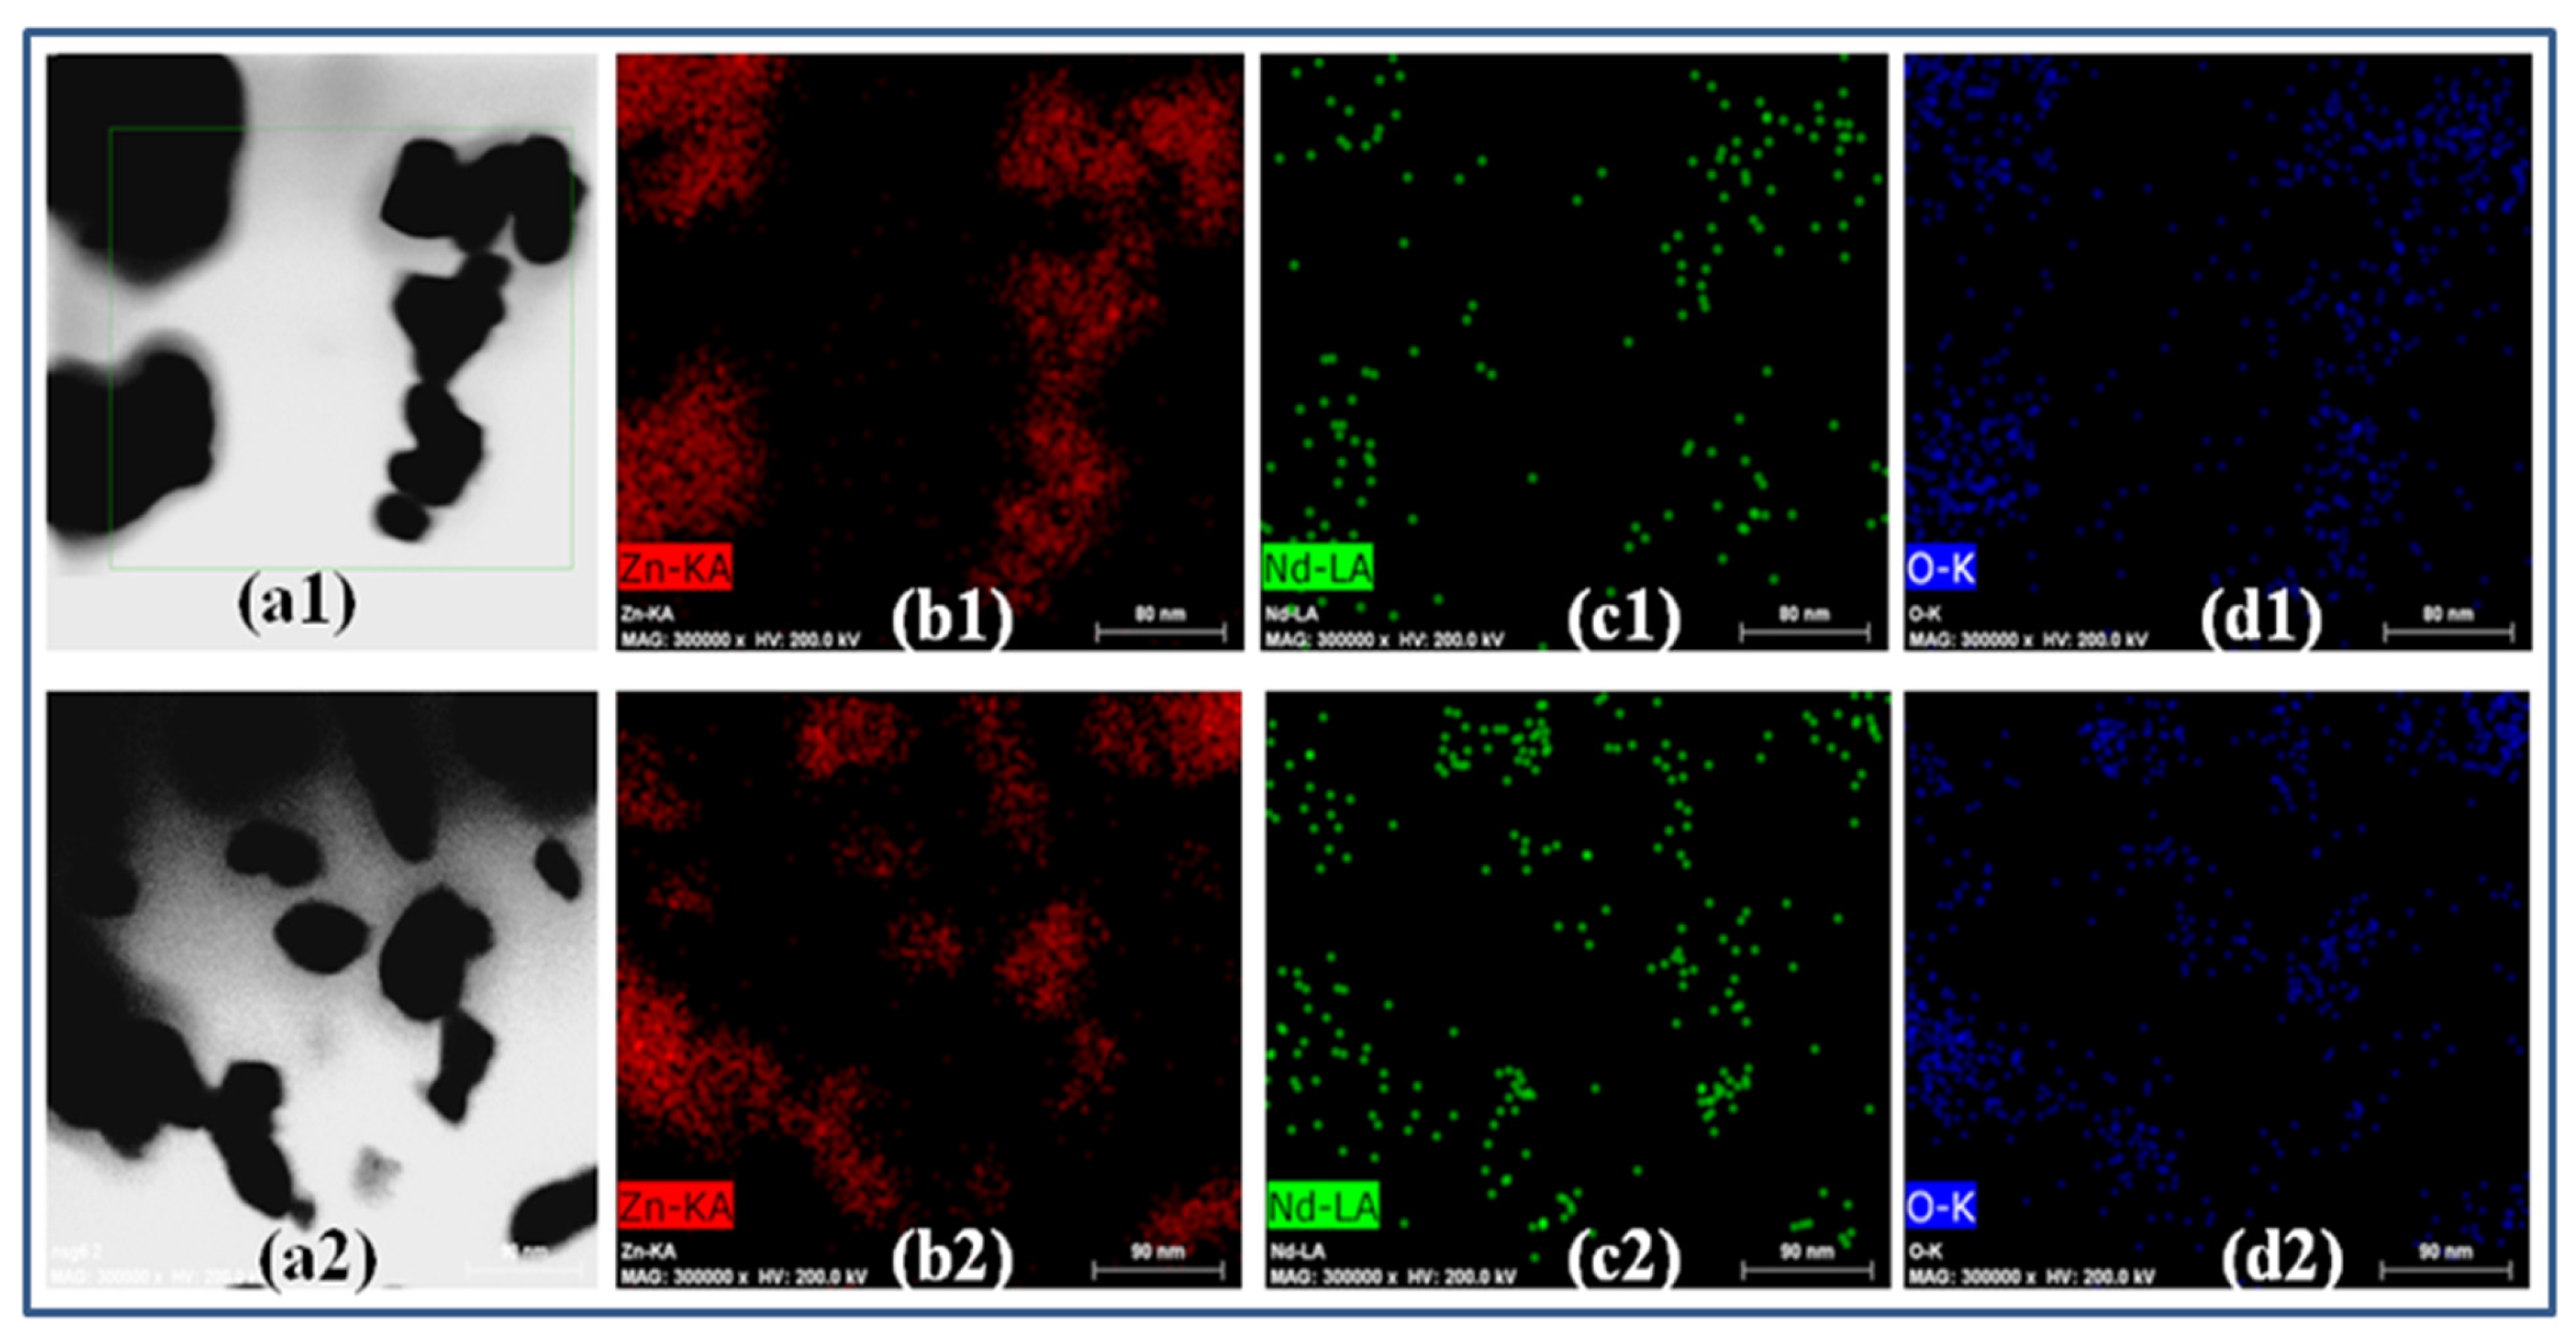
X-ray diffraction patterns of Zn1−xNdxO: x = 0.0, 0.03, 0.06, and 0.10 nanocrystalline samples calcined at 500 °C are shown in Figure 1a. The XRD pattern exhibits the regular peaks associated with the hexagonal wurtzite structure in the P63mc space group, which is consistent with the typical diffraction patterns of highly crystalline ZnO ceramics (JCPDS cards no. 036-1451 and 071-3830) [22]. It has been observed that the doping of Nd3+ causes the expansion of crystal lattices, which subsequently results in the shifting of the peaks of the XRD pattern towards the lower 2θ values. This can be comprehended by the value of the ionic radius of Nd3+ is 0.995 Å, which is larger than the ionic radius of Zn+2 (0.74 Å). Figure 1b illustrates the X-ray diffraction patterns of the Zn0.90Nd0.10O samples calcined at 400 °C, 500 °C, 600 °C, and 700 °C, respectively. Diffraction peak intensities improve as calcination temperature rises (from 400 °C to 700 °C), indicating a more controlled crystallization operation. The full width at half maximum drops as the temperature rises from 400 °C to 700 °C, indicating an increase in particle size. Small impurity phase of Nd2O3 (mark *) seen in the Zn0.90Nd0.10O sample calcined at 700 °C displayed in Figure 1b. All the Zn1−xNdxO nanocrystalline samples were calcined at 500 °C to avoid the impurity phase.
The results of a detailed analysis of the crystal structure of Zn1−xNdxO nanocrystalline samples using the Rietveld refinement tool ‘FullProf’ are shown in Figure 1c–f. The Rietveld refinement of the nanocrystalline material is carried out by taking into consideration the P63mc symmetry structure, in which the ionic sites of Zn/Nd are 2b (1/3, 2/3, 0) and those of O are 2b (1/3, 2/3, u). The crystal structure of ZnO nanostructured samples is distorted when Nd3+ concentration increases, as observed in the Rietveld refinement of XRD patterns, based on a monotonic rise in lattice parameter ‘a’ (Å) and unit cell volume V (Å3). The anion positional parameter u = 1 3 ( a c ) 2 + 1 4 differs from the ideal value of 0.375, which can be explained by the observed cation displacement down the z-axis [15]. As shown in Figure 2, as the Nd3+ concentration increases, the oxygen ion location u parameter in samples in ZnO nanostructures correspondingly increases. The bond angle and the bond length were explained in this manner. Due to the ionic radius difference and the Nd ion’s trivalent state diverging from the divalent Zn ions, Nd doping in the ZnO nanostructured crystals caused the wurtzite structure to deform.
The electron density plots of Zn(1−x)NdxO: x = 0.0, 0.03, 0.06, and 0.10 nanostructured materials are also acquired from the Rietveld refined XRD patterns, and electron density in the suitable intercepts of planes are displayed in Figure 3. The electron density plots take part in recreating a significant role in understanding the interactions at the atomic level [23]. The electron density plots ρ (x, y, z) are acquired from the reverse Fourier transform of the structure factors obtained from the Rietveld refinement of XRD information, with a detailed demonstration provided by Chaturvedi et al. [20]:
ρ x , y , z = h k l F h k l e 2 π i h x + k y + l z V
where Fhkl represents the structure factor; h, k, and l express the Miller indices; V stands for the volume of the unit cell; and ρ(x, y, z) represents the electron scattering density. Figure 3a for the ZnO system shows a slice of the structure along the corresponding xy plane, with a z intercept equal to 0.999 for the concerted connection for anion and cations. At room temperature (300 K), the electron density plots for Zn(1−x)NdxO: x = 0.0, 0.03, 0.06, and 0.10 nanostructured materials along the xy plane and z intercept = 0.999, and they are displayed in Figure 3b–e. When Nd is substituted into ZnO nanostructures, the electron density in close proximity to Zn atoms can change significantly. It is easily observable from the electron density maps that the Zn/Nd-O exhibits more covalence than the Zn-O. The extra electron density may have influenced the development of the ZnO lattice in addition to potentially altering the optical, dielectric, and ferroelectric properties of ZnO nanostructured materials.
The average crystallite size and strain of the Zn(1−x)NdxO nanostructured materials can be calculated by the different approaches [23,24].
(i) The Williamson-Hall equations:
β h k l = K λ D Cos Θ h k l + 4 ε t a n ( Θ h k l )
where K = shape factor (0.9), D = crystalline size, and λ = 1.5406 Å wavelength of Cu kα XRD radiation.
Rewriting the equation gives us:
β h k l Cos Θ h k l = K λ D + 4 ε sin ( Θ h k l )
when the strain is uniform in all crystallographic directions (isotropic nature). This equation is also known as the uniform deformation model (UDM) equation.
(ii) The anisotropic aspect of Young’s modulus is more appropriate for the crystal. Hook’s law, which states that stress correlates to strain with a constant of proportionality known as the Young’s modulus Y, only refers to the strain when the stress and strain are linearly correlated, or when ε = σ / Y h k l . When the value is substituted, the Williamson–Hall equation is:
β h k l Cos Θ h k l = K λ D + 4 σ sin ( Θ h k l ) / Y h k l
where Yhkl is the Young’s modulus in the direction perpendicular to (hkl), and from the slope line plotted between 4sinθhkl/Yhkl and βhkl cosθhkl, the stress can be calculated as the size of the crystal D from the intercept, too.
If Yhkl is known for the hexagonal ZnO nanoparticles, the stress can be calculated. For the hexagonal crystal phase samples, the Young’s modulus Yhkl is related to the elastic compliances Sij by:
Y h k l = h 2 + h + 2 k 2 3 + a l c 2 2 S 11 h 2 + h + 2 k 2 3 2 + S 33 a l c 4 + 2 S 13 + S 44 ( h 2 + h + 2 k 2 3 ) a l c 2
where the elastic compliances of ZnO are given by S11 = 7.858 × 10⁻¹² m2N−1, S13 = −2.206 × 10⁻¹² m2N−1, S33 = 6.940 × 10⁻¹² m2N−1, and S44 = 23.57 × 10⁻¹² m2N−1.
From the slope of the line and the lattice strain, the deformation stress can be calculated when we write βhklcosθhkl as a function of 4sinθhkl/Yhkl. The Young’s modulus Y for the ZnO nanoparticles from calculations is around 130 GPa. In the equation, homogeneity is considered, but according to many assumptions, the requirement of homogeneity and isotropy is not fulfilled. Hence, the proportionality constants are no longer independent in allstress-strain relations.
When the strain energy density is assumed according to Hook’s law, the energy density per unit volume u as a function of strain can be written as u = ε2Yhkl/2.
Hence, the equation can be rewritten in terms of energy density, and it is:
β h k l Cos Θ h k l = K λ D + 4 sin ( Θ h k l ) ( 2 u Y h k l ) 1 / 2
Now, from the plot of the line between βhklcosθ and 4sinθ (2/Yhkl)1/2, the UDEDM (uniform deformation energy density) can be calculated. From the values of Yhkl, the lattice strain can be calculated and, hence, by comparison of the UDSM and UDEDM equations, the energy density and the stress can be analyzed. Both approaches are different; according to Equation (3), the assumptions for the uniform deformation stress are taken. Even though both models are anisotropic for crystals, the assumptions for the deformation energy are according to Equation (5). From both the equations, the deformation energy density and the deformation stress are related as u = σ2/Yhkl. The plots of the Williamson–Hall plot are shown in Figure 4. Geometric parameters of Zn1−xNdxO nanostructured samples by the Williamson–Hall analysis with different approaches are given in Table 1. The crystallite sizes intended for many models are nearly the same, which, in turn, points to the fact that the insertion of strain in various (UDM, USDM, UDEDM) W–H models have a very slight effect on the average crystallite size of Nd-doped ZnO nanocrystalline samples.

2.1.2. TEM

The low-resolution TEM images of Zn(1−x)NdxO: x = 0.0, 0.03, 0.06, and 0.10 nanostructured materials are shown in Figure 5a–d, respectively. Hexagonal-spherical nanoparticles of size about 20–40 nm are noted for pristine ZnO with an increase in Nd concentration, nanoparticles of spherical morphology of ZnO nanostructured materials transform into a rod shape. The TEM images also show that when the Nd concentration in ZnO rises, so do the sizes of the nanostructured materials. This occurs because of the ionic size mismatch that causes lattice strain [15]. The system’s lattice strain decreases with increasing the Nd content in ZnO, shown in Table 1. which decreases the rate of nucleation, and also causes an increase in particle size. The poly-crystalline nature of pristine and Nd doped ZnO nanostructured samples are also studied by the selected area electron diffraction (SAED) displayed in Figure 5e,i. The SAED demonstrates the discrete ring pattern, which is the characteristic nature of the polycrystalline sample. The simulated rings pattern of SAED of ZnO and Zn0.9Nd0.1O nanostructured samples with the diffraction intensity of peaks are also displayed in Figure 5e,i. The SAED pattern is in great concurrence with the XRD pattern. The high-resolution HRTEM images of the ZnO and the Zn0.9Nd0.1O nanostructured samples are shown in Figure 5f,j. The HRTEM images show that the fine nanostructured samples are very much crystallized into single crystals with specific interplanar spacing. The interplanar spacing of the samples is ascertained from the HRTEM image by applying the Fast Fourier Transform (FFT) of Gatan Microscopy Suite software 3.0, and the FFT images appear in Figure 5g,k. Figure 5h, l exhibits the lattice plane intensity profile pattern corresponding to the Figure 5g,k, and this confirms an interplanar spacing of about 0.277 nm and 0.284 nm corresponding to the (100) plane of the ZnO and the Zn0.9Nd0.1O nanostructured samples. In addition to the imaging mode of (HRTEM) transmission electron microscopy, elemental mapping (EDX mapping) was also conducted to examine the elements present, shown in Figure 6. The elemental mapping of the 3% and 6% Nd3+ doped ZnO nanostructured materials demonstrated that Zn, O, and Nd ions are dispersed uniformly all through the structure and that they can be seen in both of the Nd3+ doped ZnO nanostructured samples.

2.1.3. Photoluminescence Spectrum

ZnO nanostructured samples with rare earth ions substituted showed exceptional optical characteristics. Their electronic configuration (4 fN 5s2 5p6) gives rise to their optical features for both divalent and trivalent ions. The optically active 4f shell electrons of rare earth ions are protected from external fields by two atomic shells with greater radial extensions (5s2, 5p6), which accounts for their spectra atomic-like behavior. Nanostructured materials are depicted in the photoluminescence spectrum of Zn(1−x)NdxO in Figure 7. The direct recombination of the free exciton causes UV emission at 385 nm, with a significantly higher intensity than visible luminescence [23,24]. As the peaks somewhat shifted to the higher wavelength side, the UV emission exhibited a red shift as the Nd concentration in the ZnO nanostructured samples increased. This shifting demonstrates how the bandgap narrows as the Nd content rises. Thorough examinations of the photoluminescence spectrum’s visible luminescence reveal weakly visible luminescence in the 450–725 nm wavelength range. Due to the various defect states in the Nd-doped ZnO nanostructured samples, the broad luminescence pattern in the visible region showed weak blue emission (450 nm), strong green (550 nm), and yellow luminescence (585) before moderately high orange-red emission (590–750 nm). The visible light emission showed impurities and defects in the negatively-charged interstitial oxygen ion state. In Figure 7b, the peak corresponding to 520 to 540 nm should be aroused by the intrinsic defect of andesite oxygen OZn (2.38 eV) and interstitial oxygen Oi (2.29 eV). As we increase dopant concentration by Ndx (x = 3%, 6%, and 10%), we see different asymmetries in the figure, illustrating the emission. Nd fascinates oxygen atoms, and the Nd3+ and Zn1+ state is needed for more Oi and OZn nearby, doping Nd in the ZnO lattice, which induces emission spectra at 520–540 nm. The lattice distortions and the other defects would induce the defect levels in the band gap to make emission spread in a broad wavelength. At 520–540 nm, Zn1−xNdxO shows broad, intense luminescence emission and a relatively weak UV emission. The emission is at its maximum at the dopant concentration of 3% due to interstitial and antistites oxygen defects.

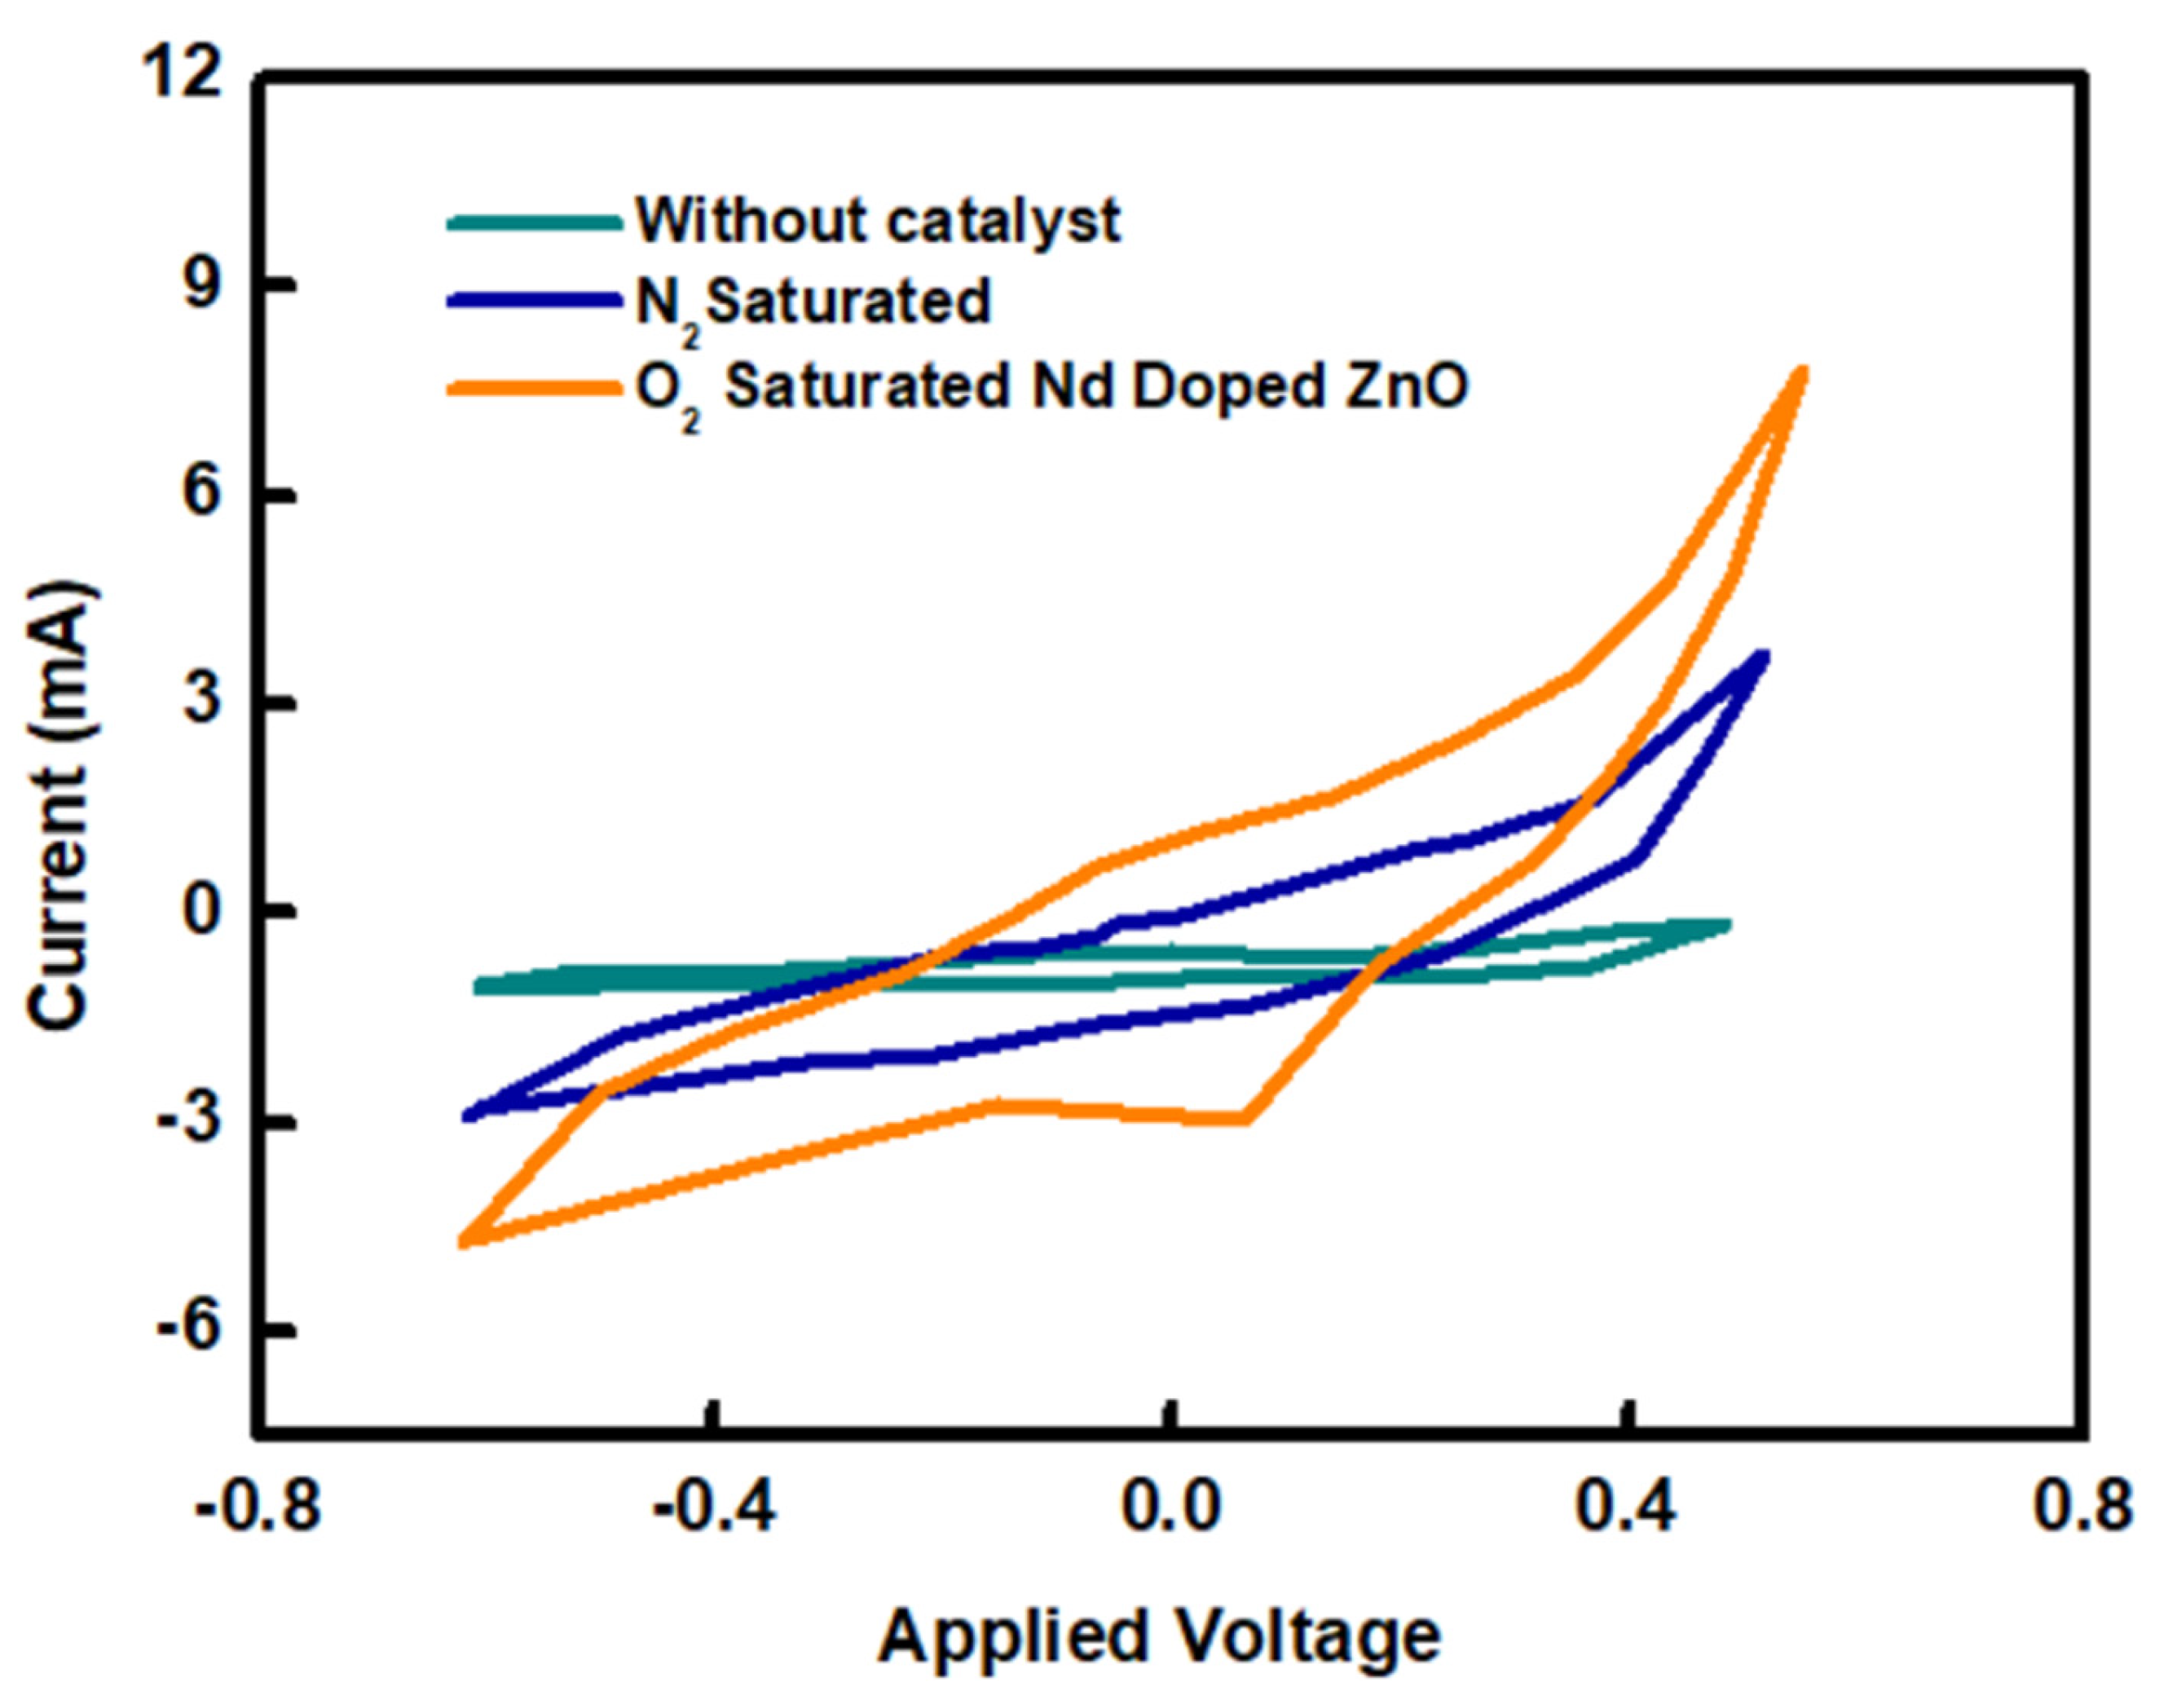
2.2. Cyclic Voltammetry

CV was utilized to measure the cathode’s catalytic potential for oxygen reduction reaction (ORR) in order to test the electrochemical behaviour in a 1 M KCl electrolytic solution under O2/N2 saturation. During a CV analysis in an O2-saturated atmosphere, the cathode using an Nd-doped ZnO catalyst produced strong and sharp reduction current peaks at 0.14 V, with a reduction current response of around 8.0 mA. Because the reduction peak was not found to be substantial during CV testing in an N2-saturated atmosphere (Figure 8), oxygen reduction is most likely responsible for this current peak. Because the peak reduction current diminishes under oxygen stress, there is little assurance of an oxygen reduction reaction (ORR) at 0.14 V. The presence of bulk oxygen vacancies on the surface of the crystalline catalyst alters cathode electrical conductivity due to an increase in electron affinity. Because of this feature, the cathode absorbs more oxygen molecules, which are reduced there [13,25]. As a result, the catalyst base experienced a significant reduction in the ORR activation overpotential, which may have caused the ORR peak to shift from −0.4 V. Additionally, the Nd-doped ZnO catalyzed cathode demonstrated improved reduction kinetics on the cathode, with a greater redox current response spanning the applied potential range between −0.6 V and +0.6 V as well as a much bigger current hysteresis loop than the control cathode [26]. A positive onset potential of 0.14 V for the ORR-assisted Nd-doped ZnO catalyst further validated the noticeably lower overpotential for ORR at the cathode. This is because the Nd-doped ZnO catalyst has both a larger surface area and better electrical conductivity. On the other hand, it is clear that the control cathode did not exhibit any catalyst-driven current response to ORR [27].

2.3. Desalination Efficiency with and without the Presence of Nd-Doped ZnO as the Catalyst

Desalination efficiency is studied with 1.5 g/cm2 Nd-doped ZnO as a catalyst in the cathode and without a catalyst with the initial TDS concentration of 15 g/L. TDS removal rates of 77.02% and 59.3% were observed with 1.5 g/cm2 Nd-doped ZnO and without a catalyst in the desalination chamber, respectively (Figure 9). The 1.5 g/cm2 Nd-doped ZnO as a catalyst in the cathode showed superior power generation, consequently, the desalination performance than that without a catalyst in all of the fed-batch cycles. Desalination efficiency increased more with the Nd-doped ZnO as a catalyst than without a catalyst.

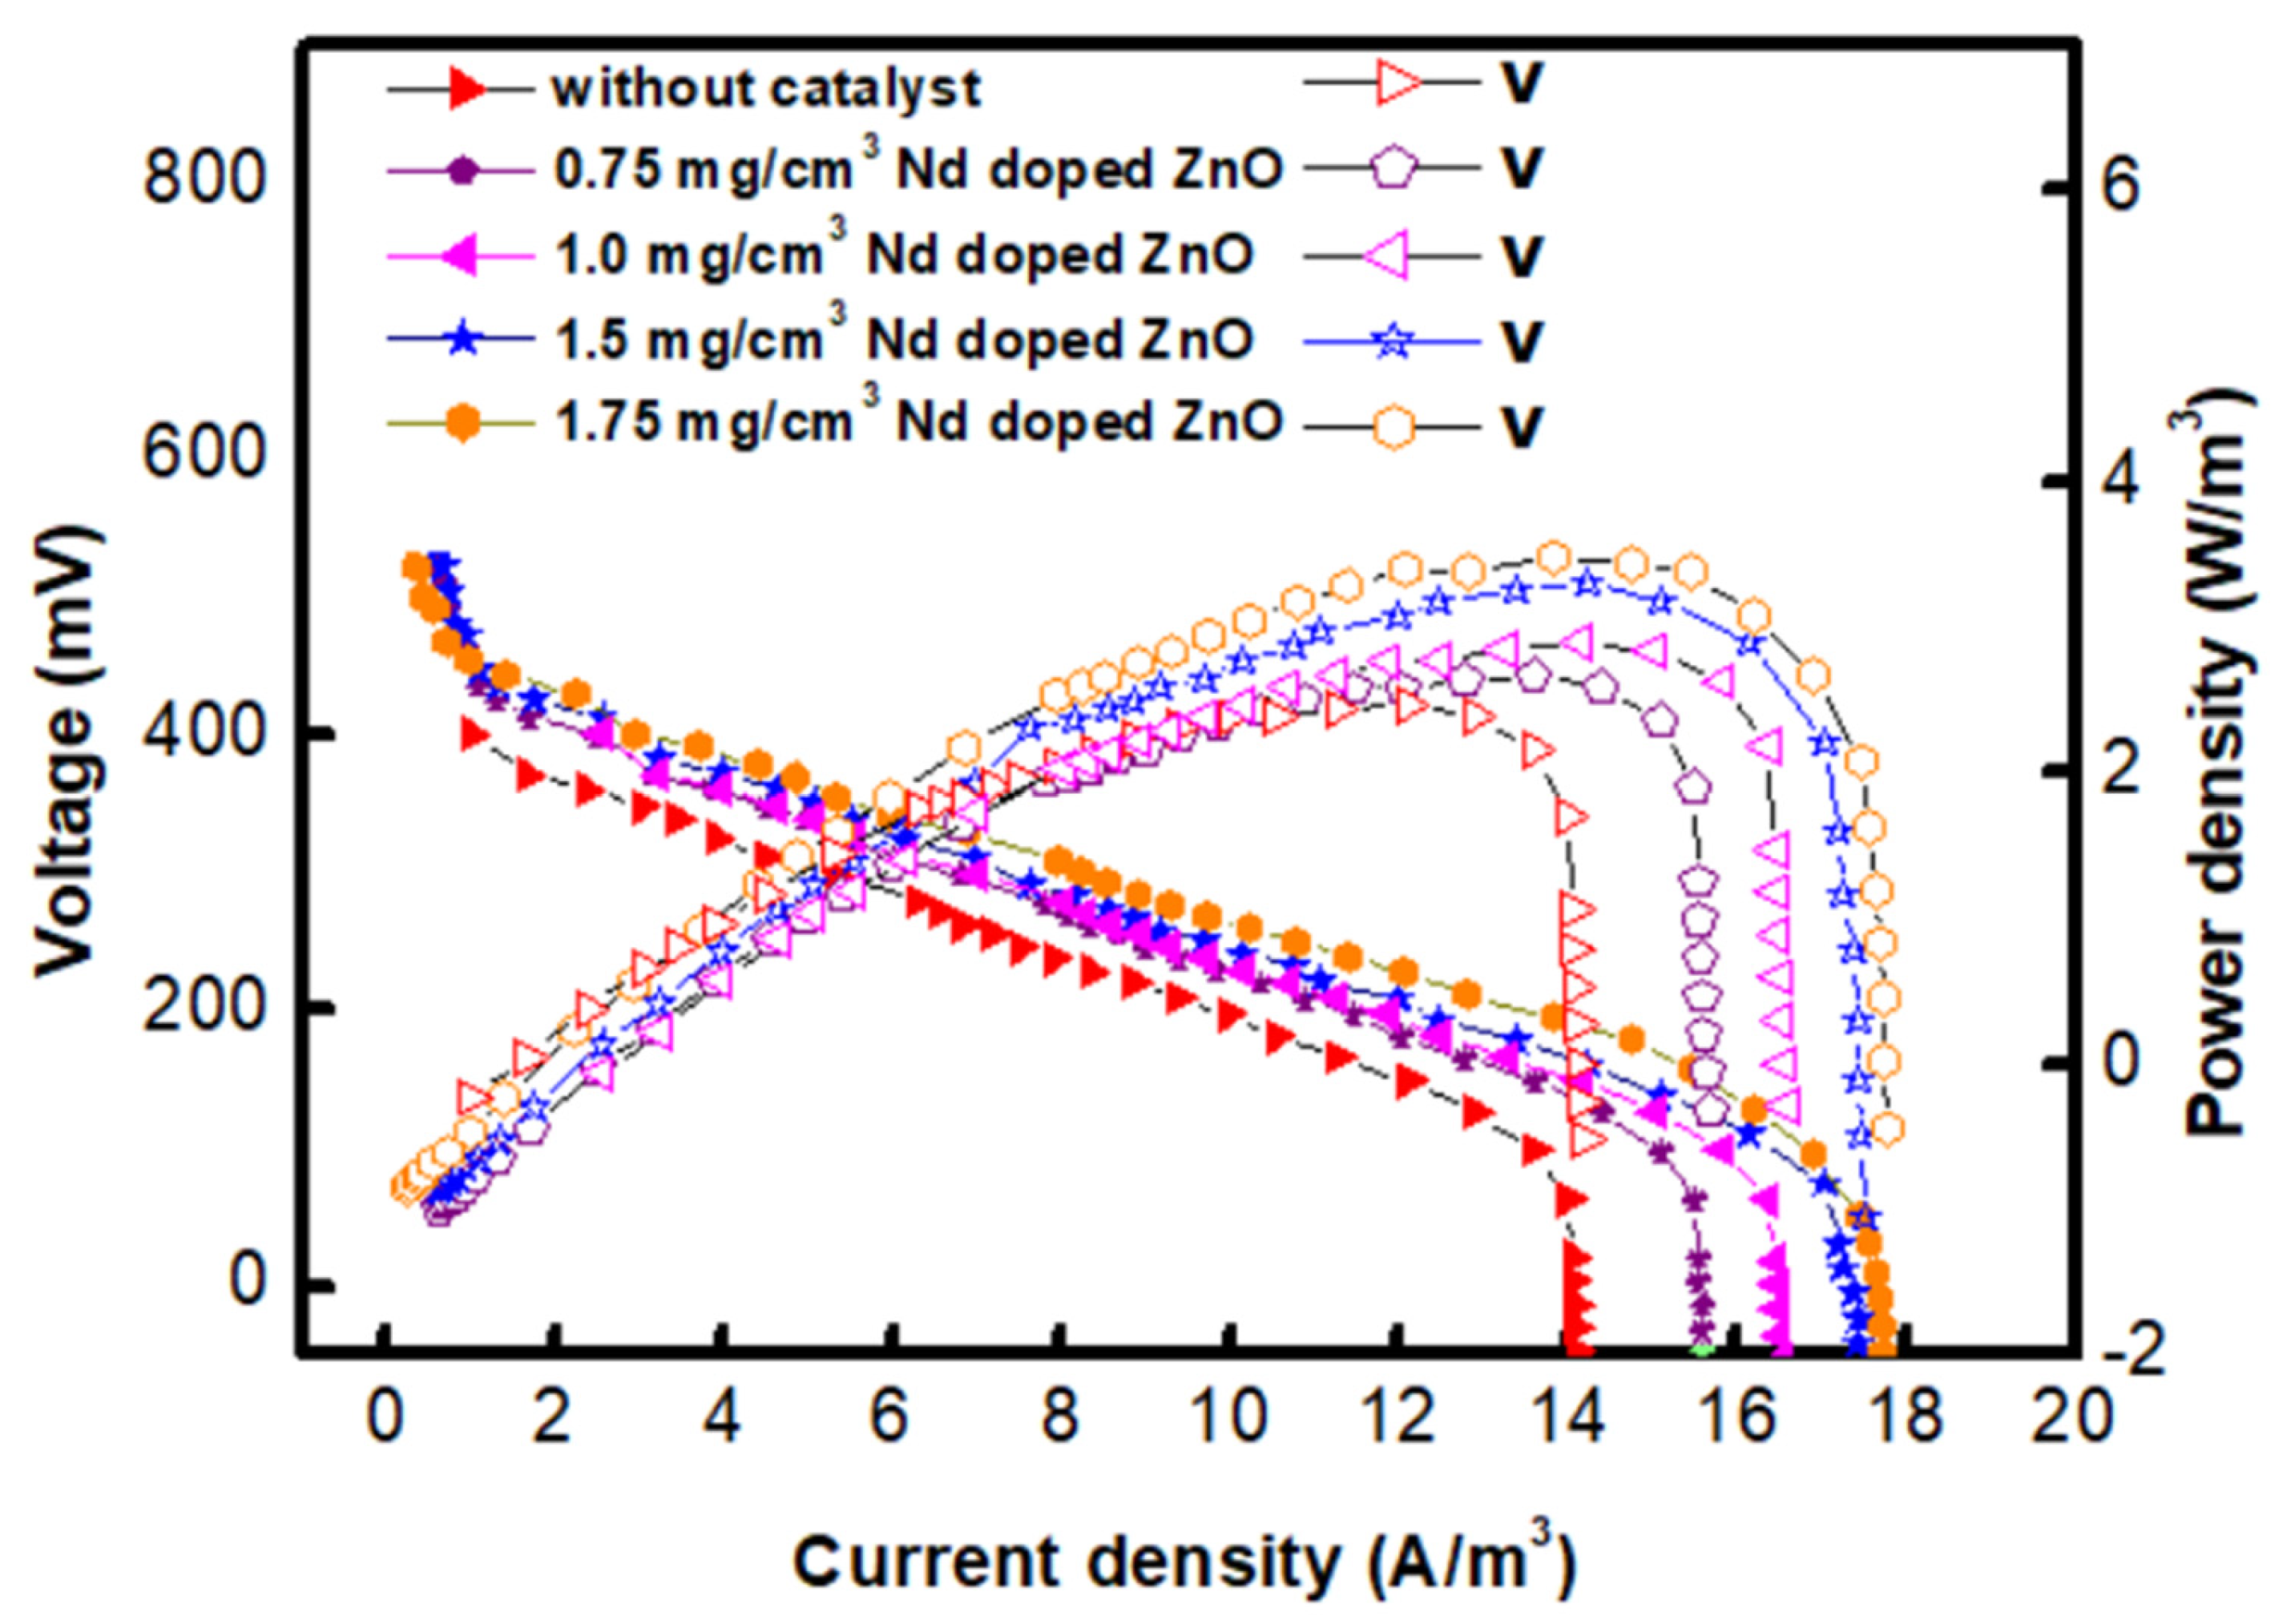
2.4. Polarization Studies

The polarization curve aids our understanding of MDC production in terms of power generation and internal resistance. It depicts the connection between cell voltage, power, and current density (Figure 10). Nd-doped ZnO nanoparticles exhibit good ORR catalytic activity, enhancing the MDC’s power density. Furthermore, due to the two main factors, namely, cost-effectiveness for construction and high efficiency of the catalyst Nd-doped ZnO, it effectively produces a high power output while handling the removal of dissolved solids from saline solution and wastewater. The ORR potential of Nd-doped ZnO is well known to have a significant role in the MDC by increasing the concentration of the catalyst. During polarization, the highest power density was observed for 1.75 g/cm2 (3.65 W/m3), followed by 1.5 g/cm2, 1.0 g/cm2, and 0.5 g/cm2, and without Nd-doped ZnO as a catalyst in the MDC, with power densities of 3.28 W/m3, 1.98 W/m3, 1.28 W/m3, and 0.78 W/m3, respectively. Table 2 shows the efficacy of three-chamber MDCs in terms of chemical oxygen demand removal, columbic efficiency, and power densities in batch cycles of 0.75 mg/cm2, 1.0 mg/cm2, 1.5 mg/cm2, and 1.75 mg/cm2 with and without Nd-doped ZnO as a catalyst in MDC.

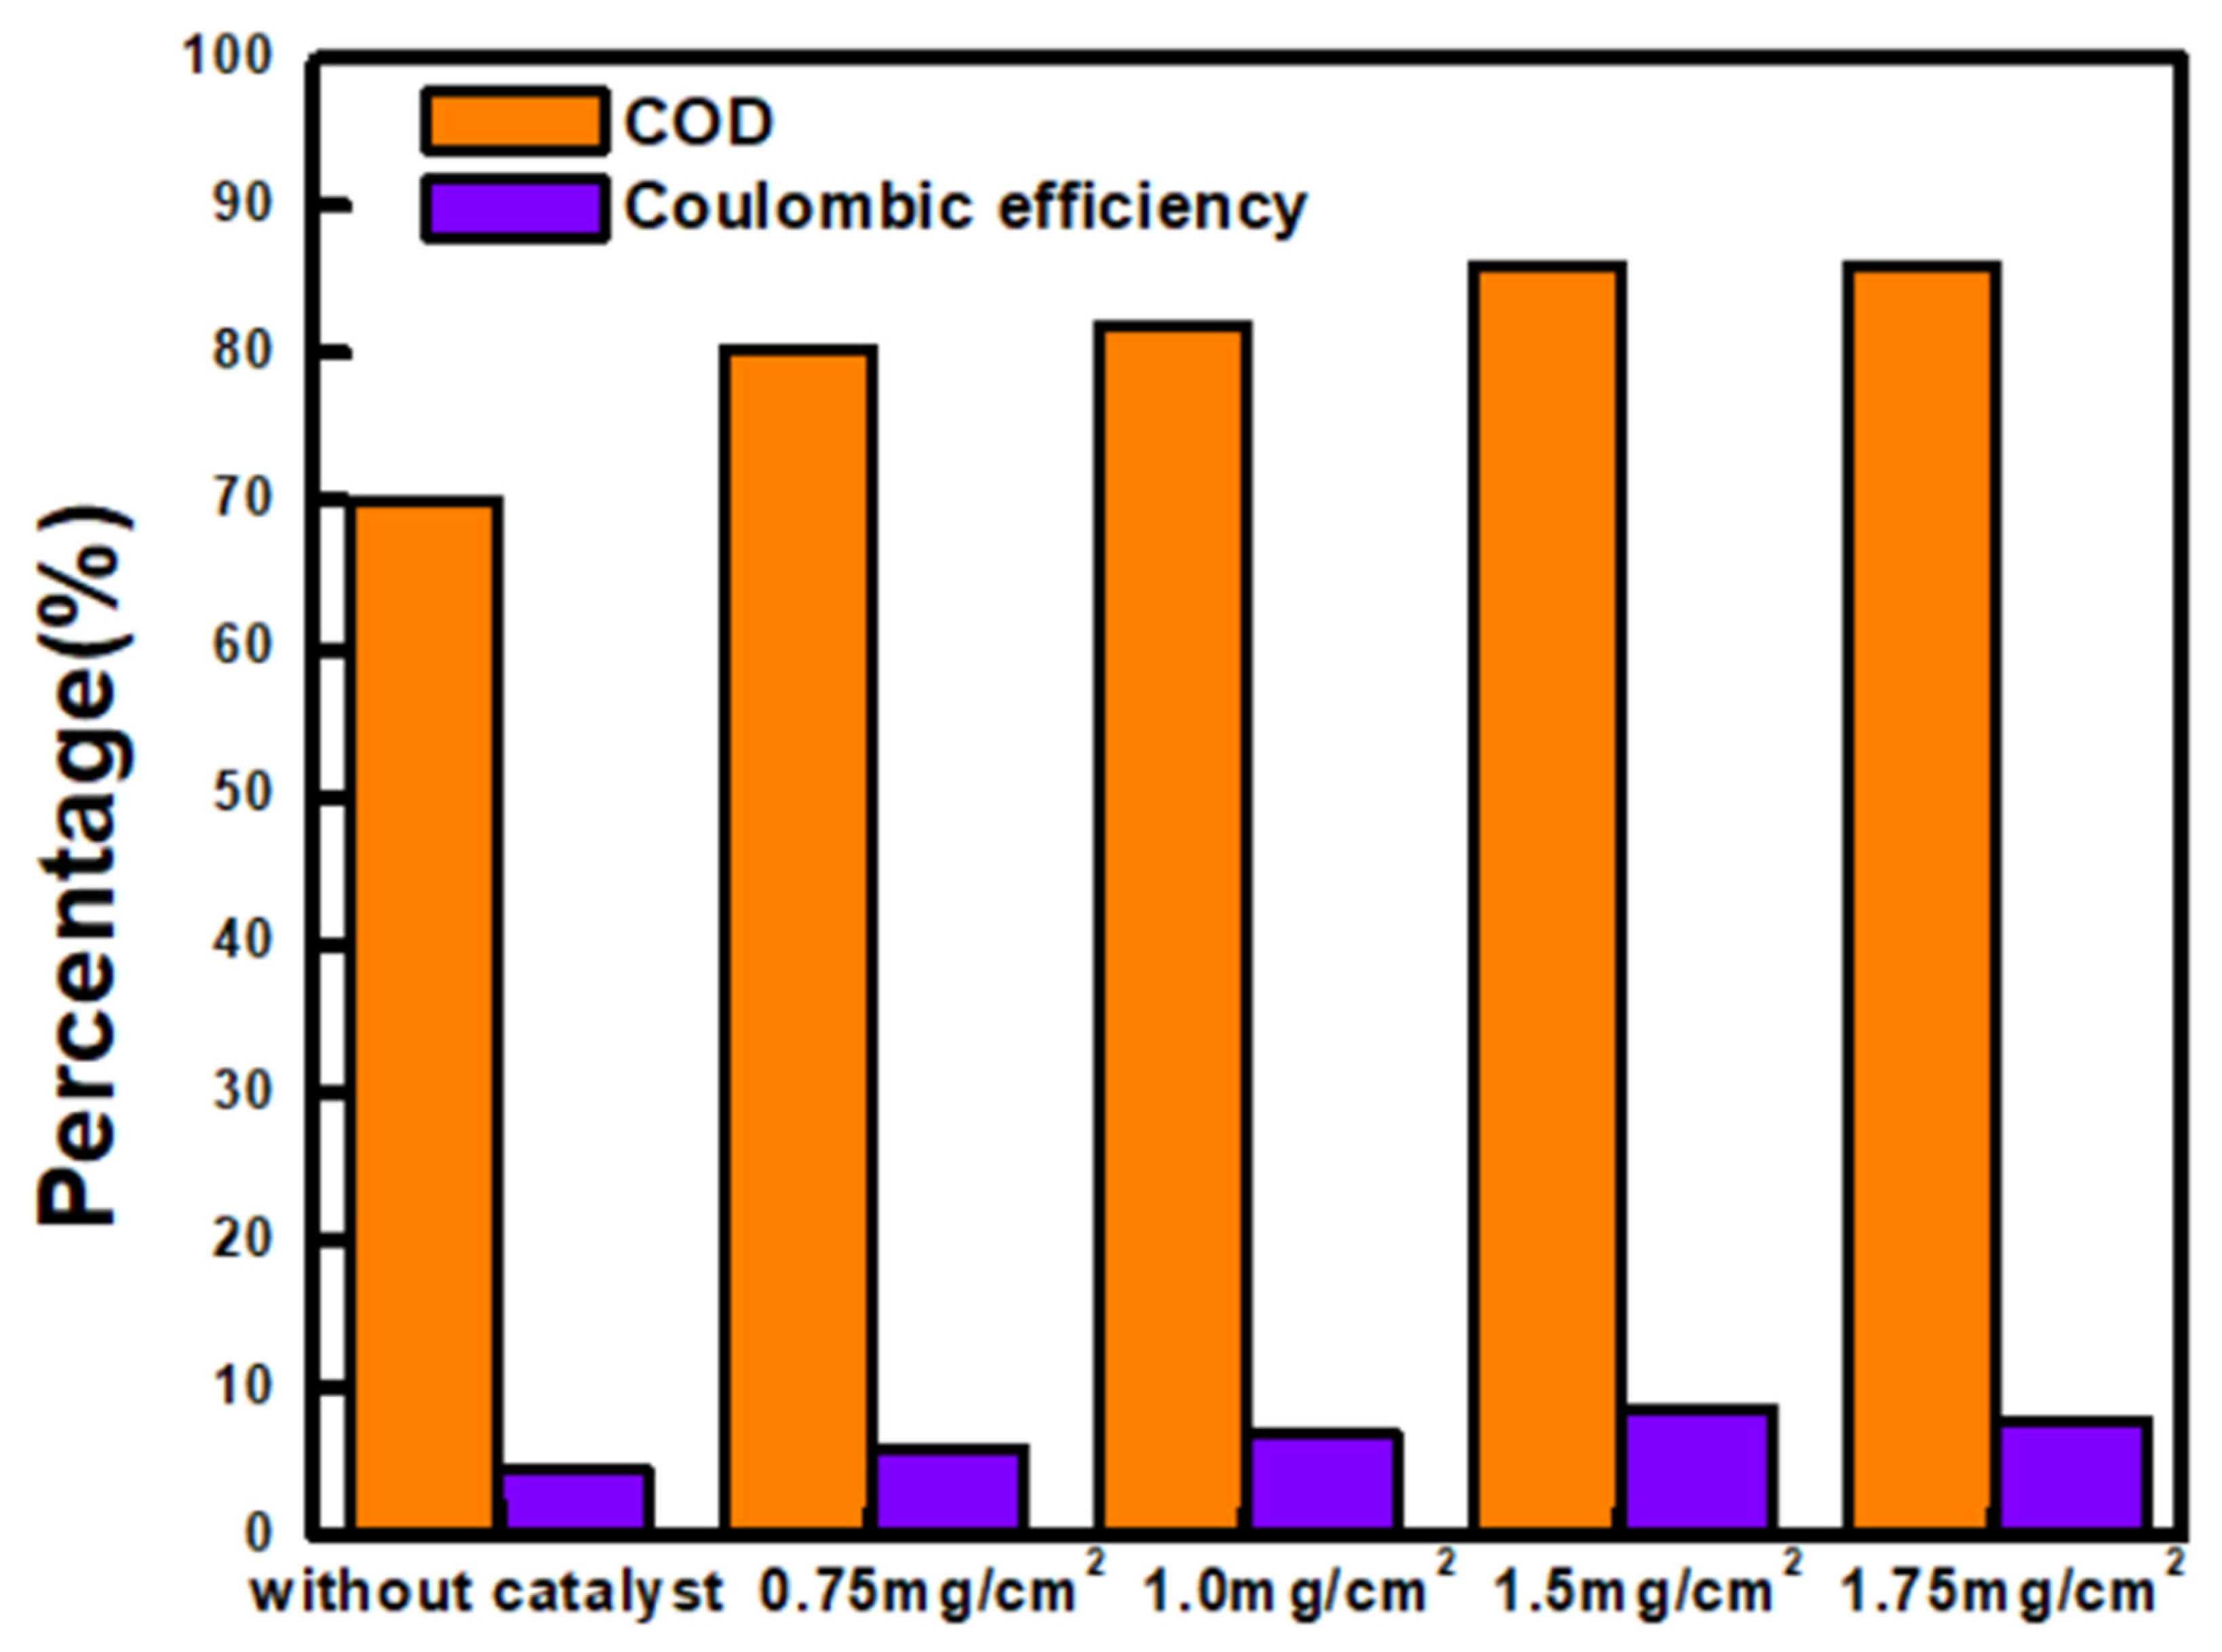
2.5. COD Removal and Coulombic Efficiency

The removal of dissolved solids from brackish effluent is one of the most significant industrial applications of MDCs; for both the MDCs, fed-batch was performed for 36 h. After 60 days of use, the MDCs with an Nd-doped ZnO content of 1.5 mg/cm2 exhibited up to (86.08% ± 0.2%) COD withdrawal (Table 2). However, the MDC without a catalyst had the lowest eradication rate (70.7% ± 0.3%) (Figure 11). The Coulombic efficacy of the MDC in close circuit mode at a given external resistance indicates the proportion of the initial current in the biodegradable anolyte that has been recovered. Figure 11 depicts the coulombic efficiency of both of the MDCs. The highest Coulombic efficiency was achieved with an Nd-doped ZnO concentration of 1.5 mg/cm2 (8.8%, followed by 8.02% at 1.75 mg/cm2), 7.3% at 1.0 mg/cm2), 6.02% at 0.75 mg/cm2), and 4.56% without a catalyst.

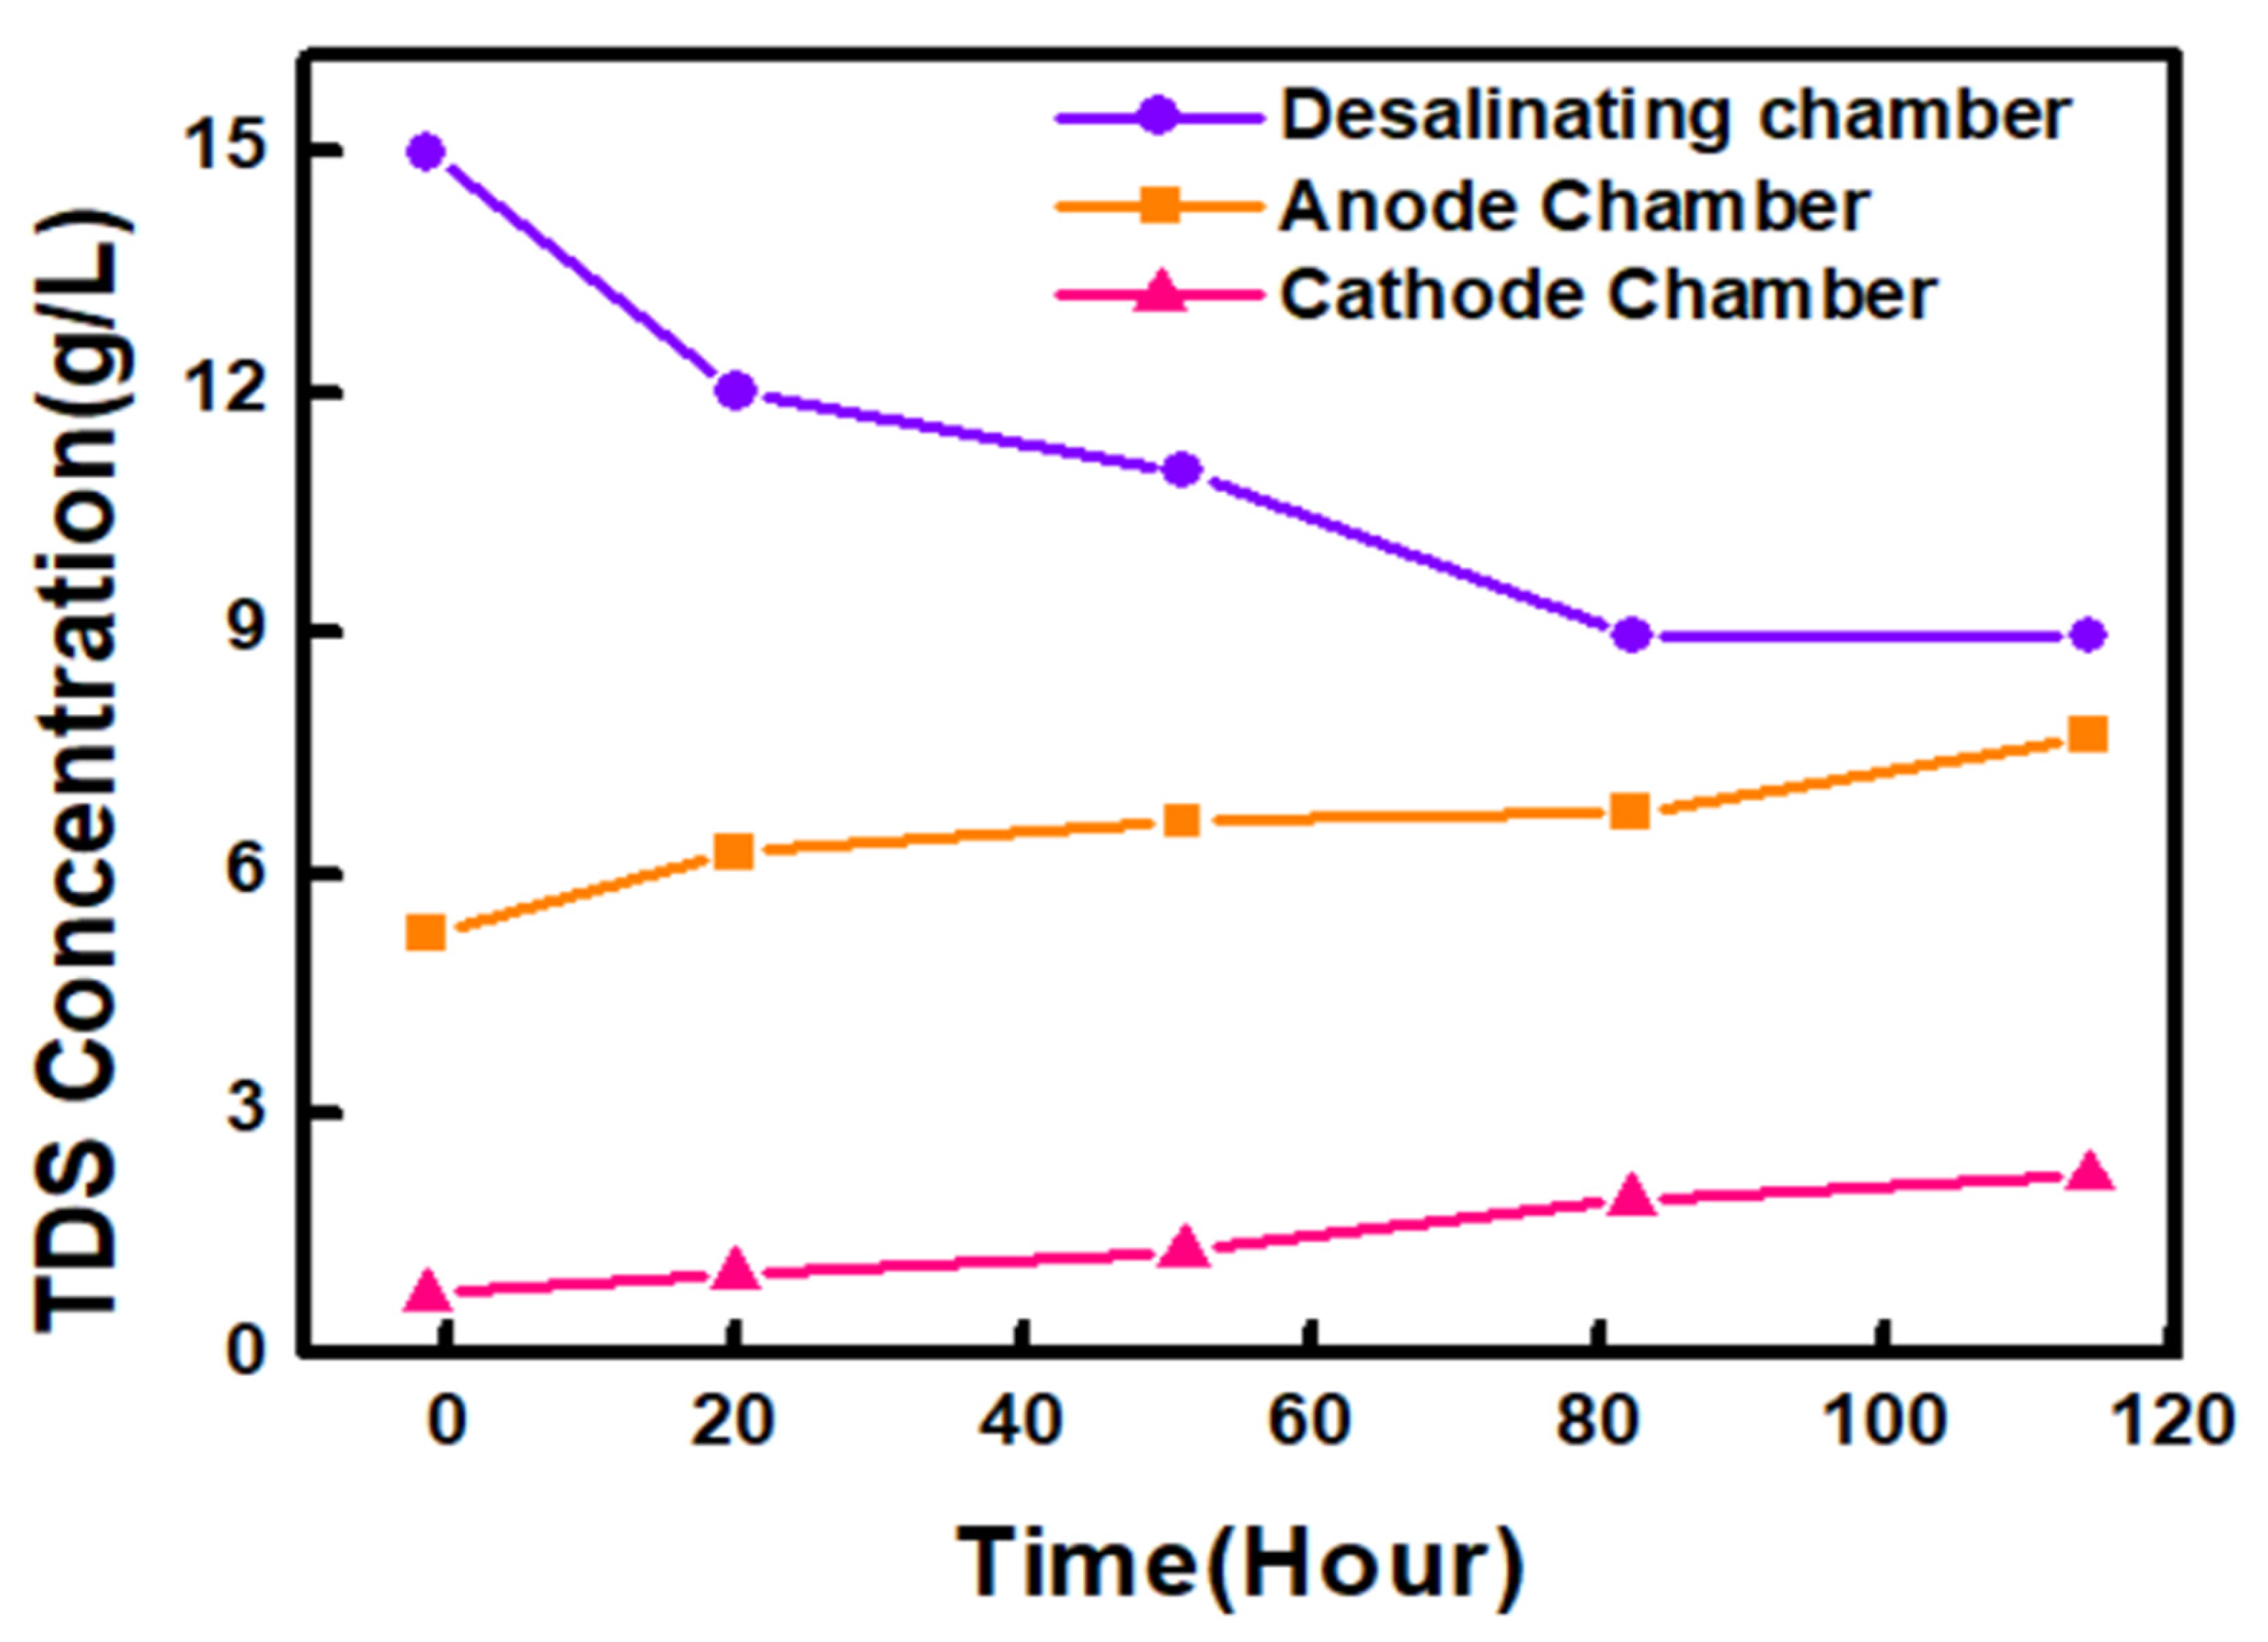
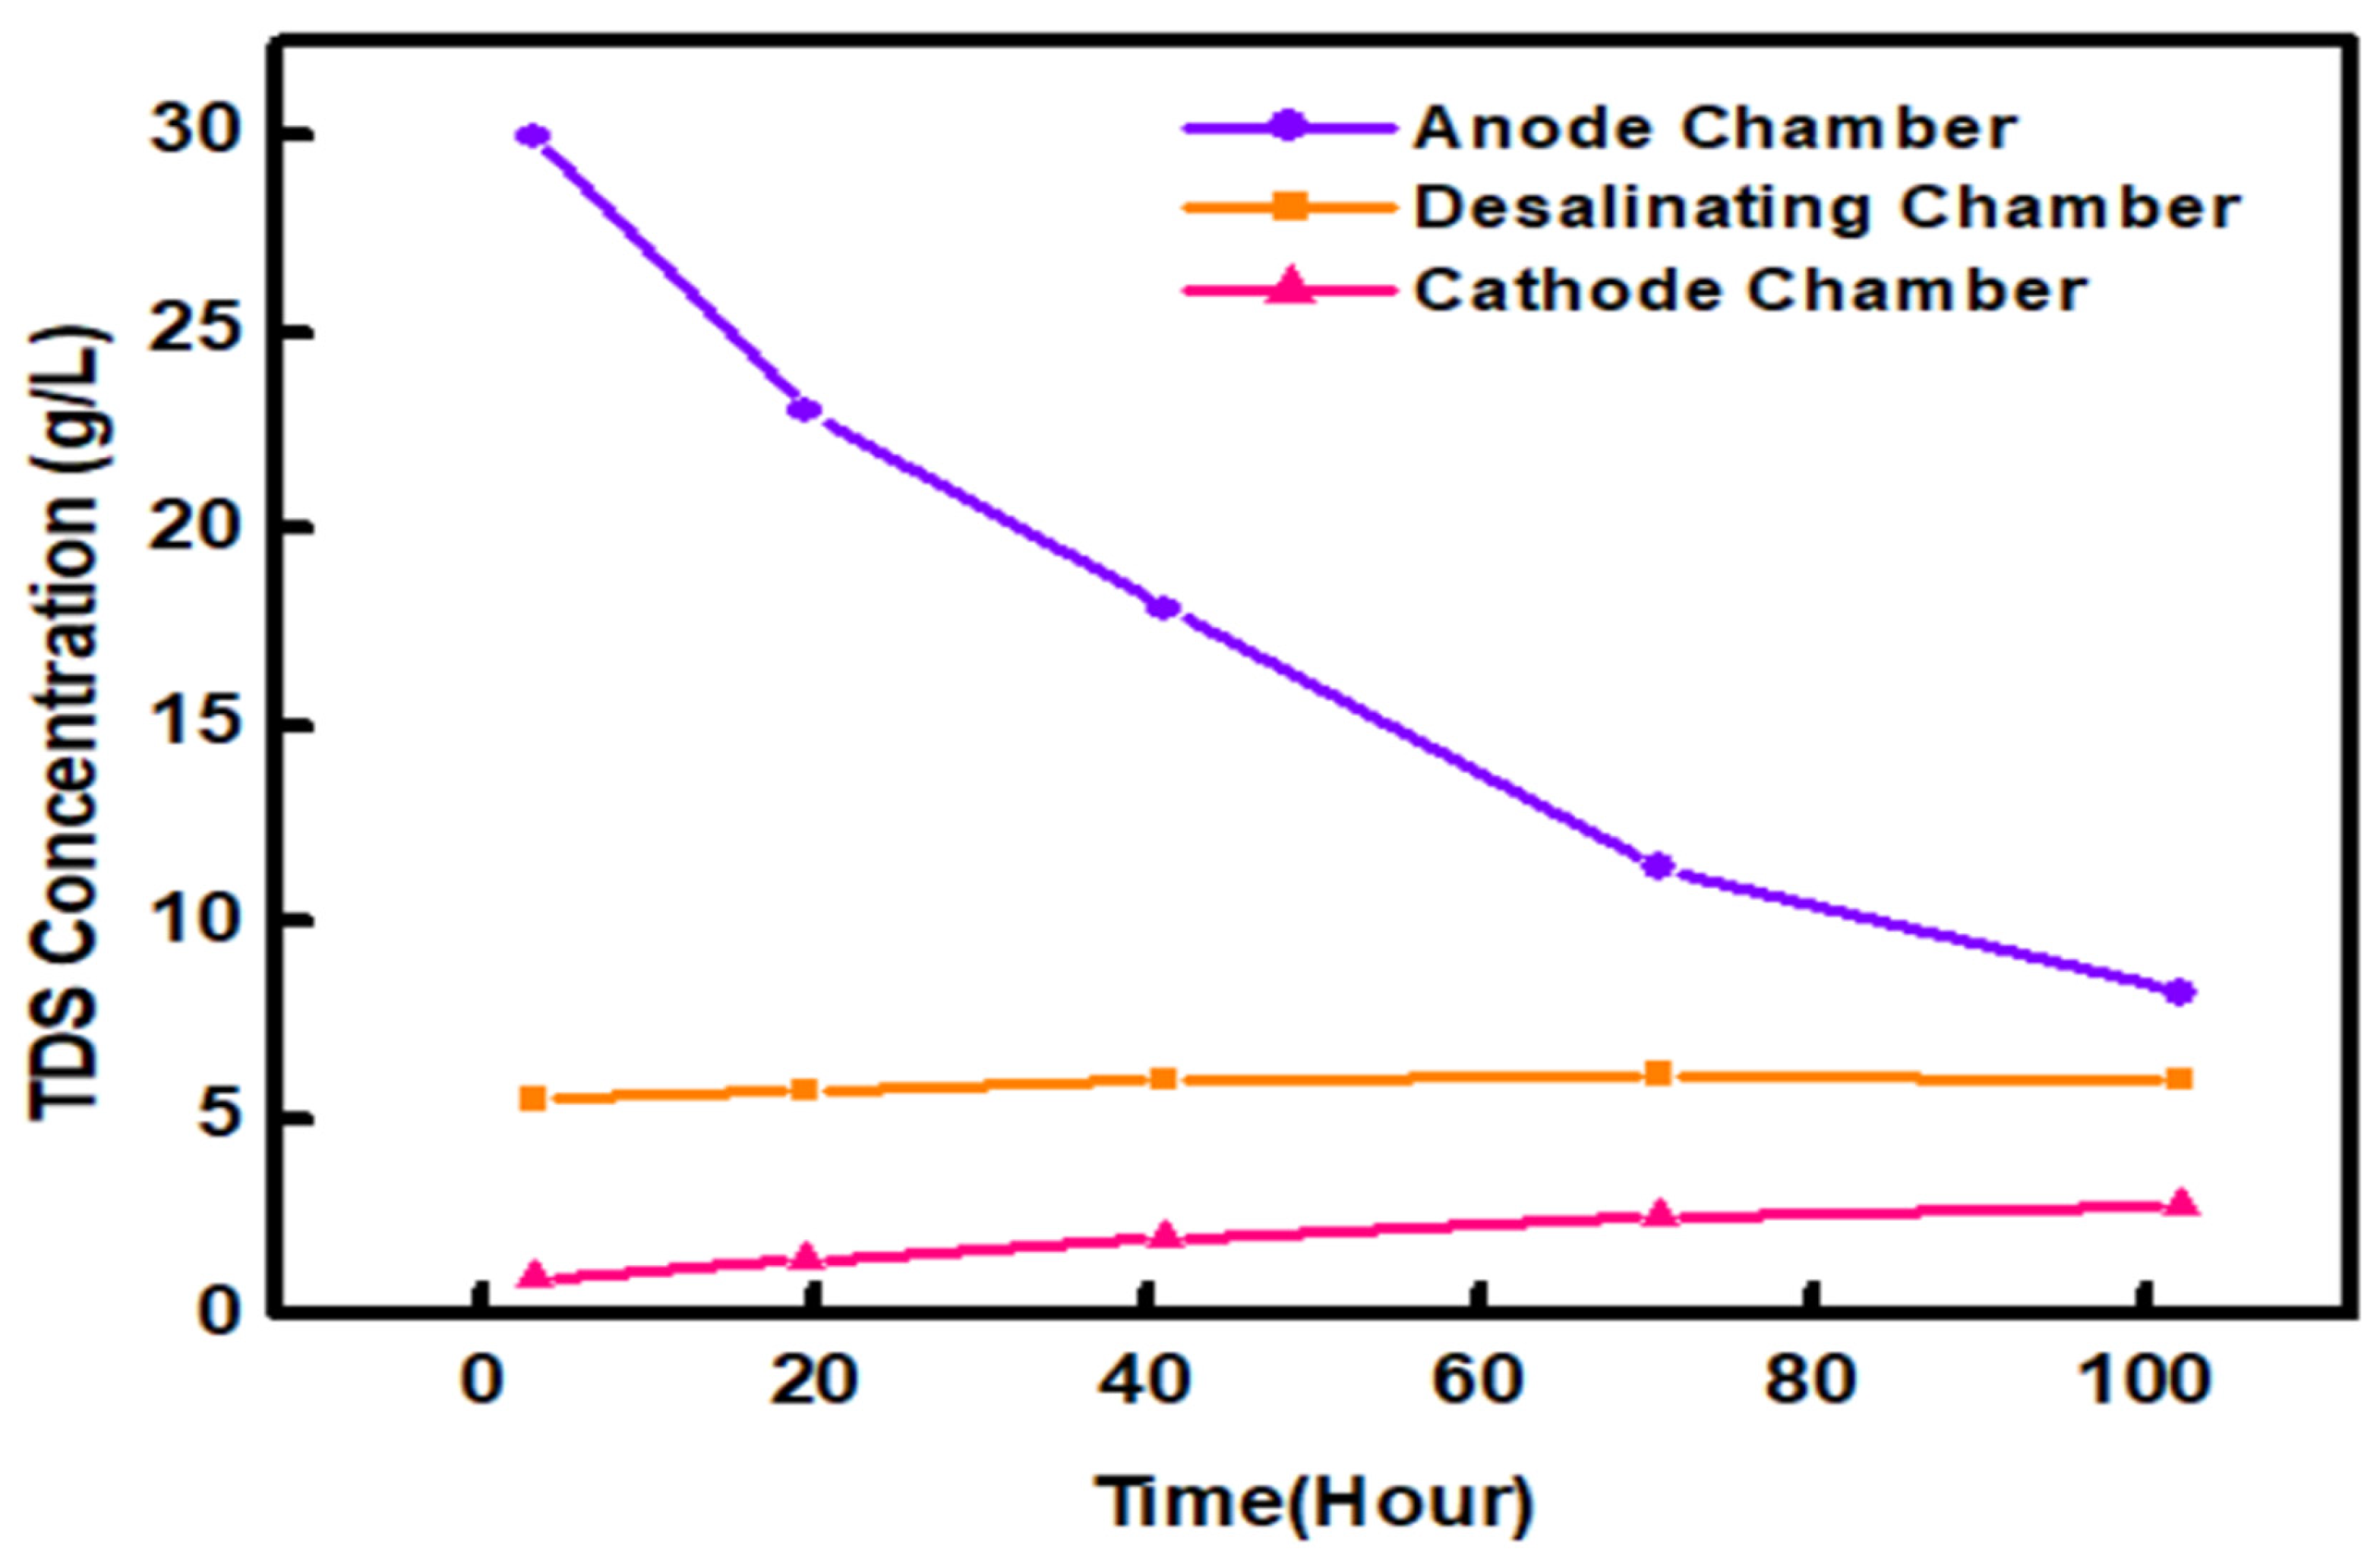
2.6. Effect of the TDS Concentration on the System Performance

TDS removal was found to be larger in the middle chamber at low TDS concentrations (15 g/L) than in the system at high TDS concentrations (30 g/L), (Figure 12 and Figure 13). The TDS content in the middle chamber steadily decreased after the experiment, with whole salt concentrations in the desalination chamber finished. At the end of each fed-batch cycle, the TDS concentration in the anodic and the cathodic chambers increased slightly (Table 3). The potential gradient created by electrodes transferred the mixed ions present in the desalination chamber into subsequent anode and cathode chambers via IEMs. With an initial TDS concentration of 30 g/L in the desalination chamber and 0.2 g/L in the cathode chamber, the cathode chamber had a higher-end TDS concentration, as shown in Table 4 and Figure 13. This could be due to the CEM’s less-than-ideal placement near the cathode, which could also have allowed cations to move.
Even though MDCs are a less expensive and more environmentally friendly alternative to traditional wastewater and desalination treatment systems, they should be used exclusively with actual seawater. MDC’s constraints, such as biofouling and scalability, must be overcome, and the technology must be tested at a pilot scale in real-world settings. It is possible to produce a decentralized power system in the form of microbial electricity in addition to desalinated water. Continuous chemical and mechanical cleaning and antifouling membranes are feasible solutions to membrane biofouling, and they are cost-effective and do not cause major harm to the membranes.

3. Materials and Methods

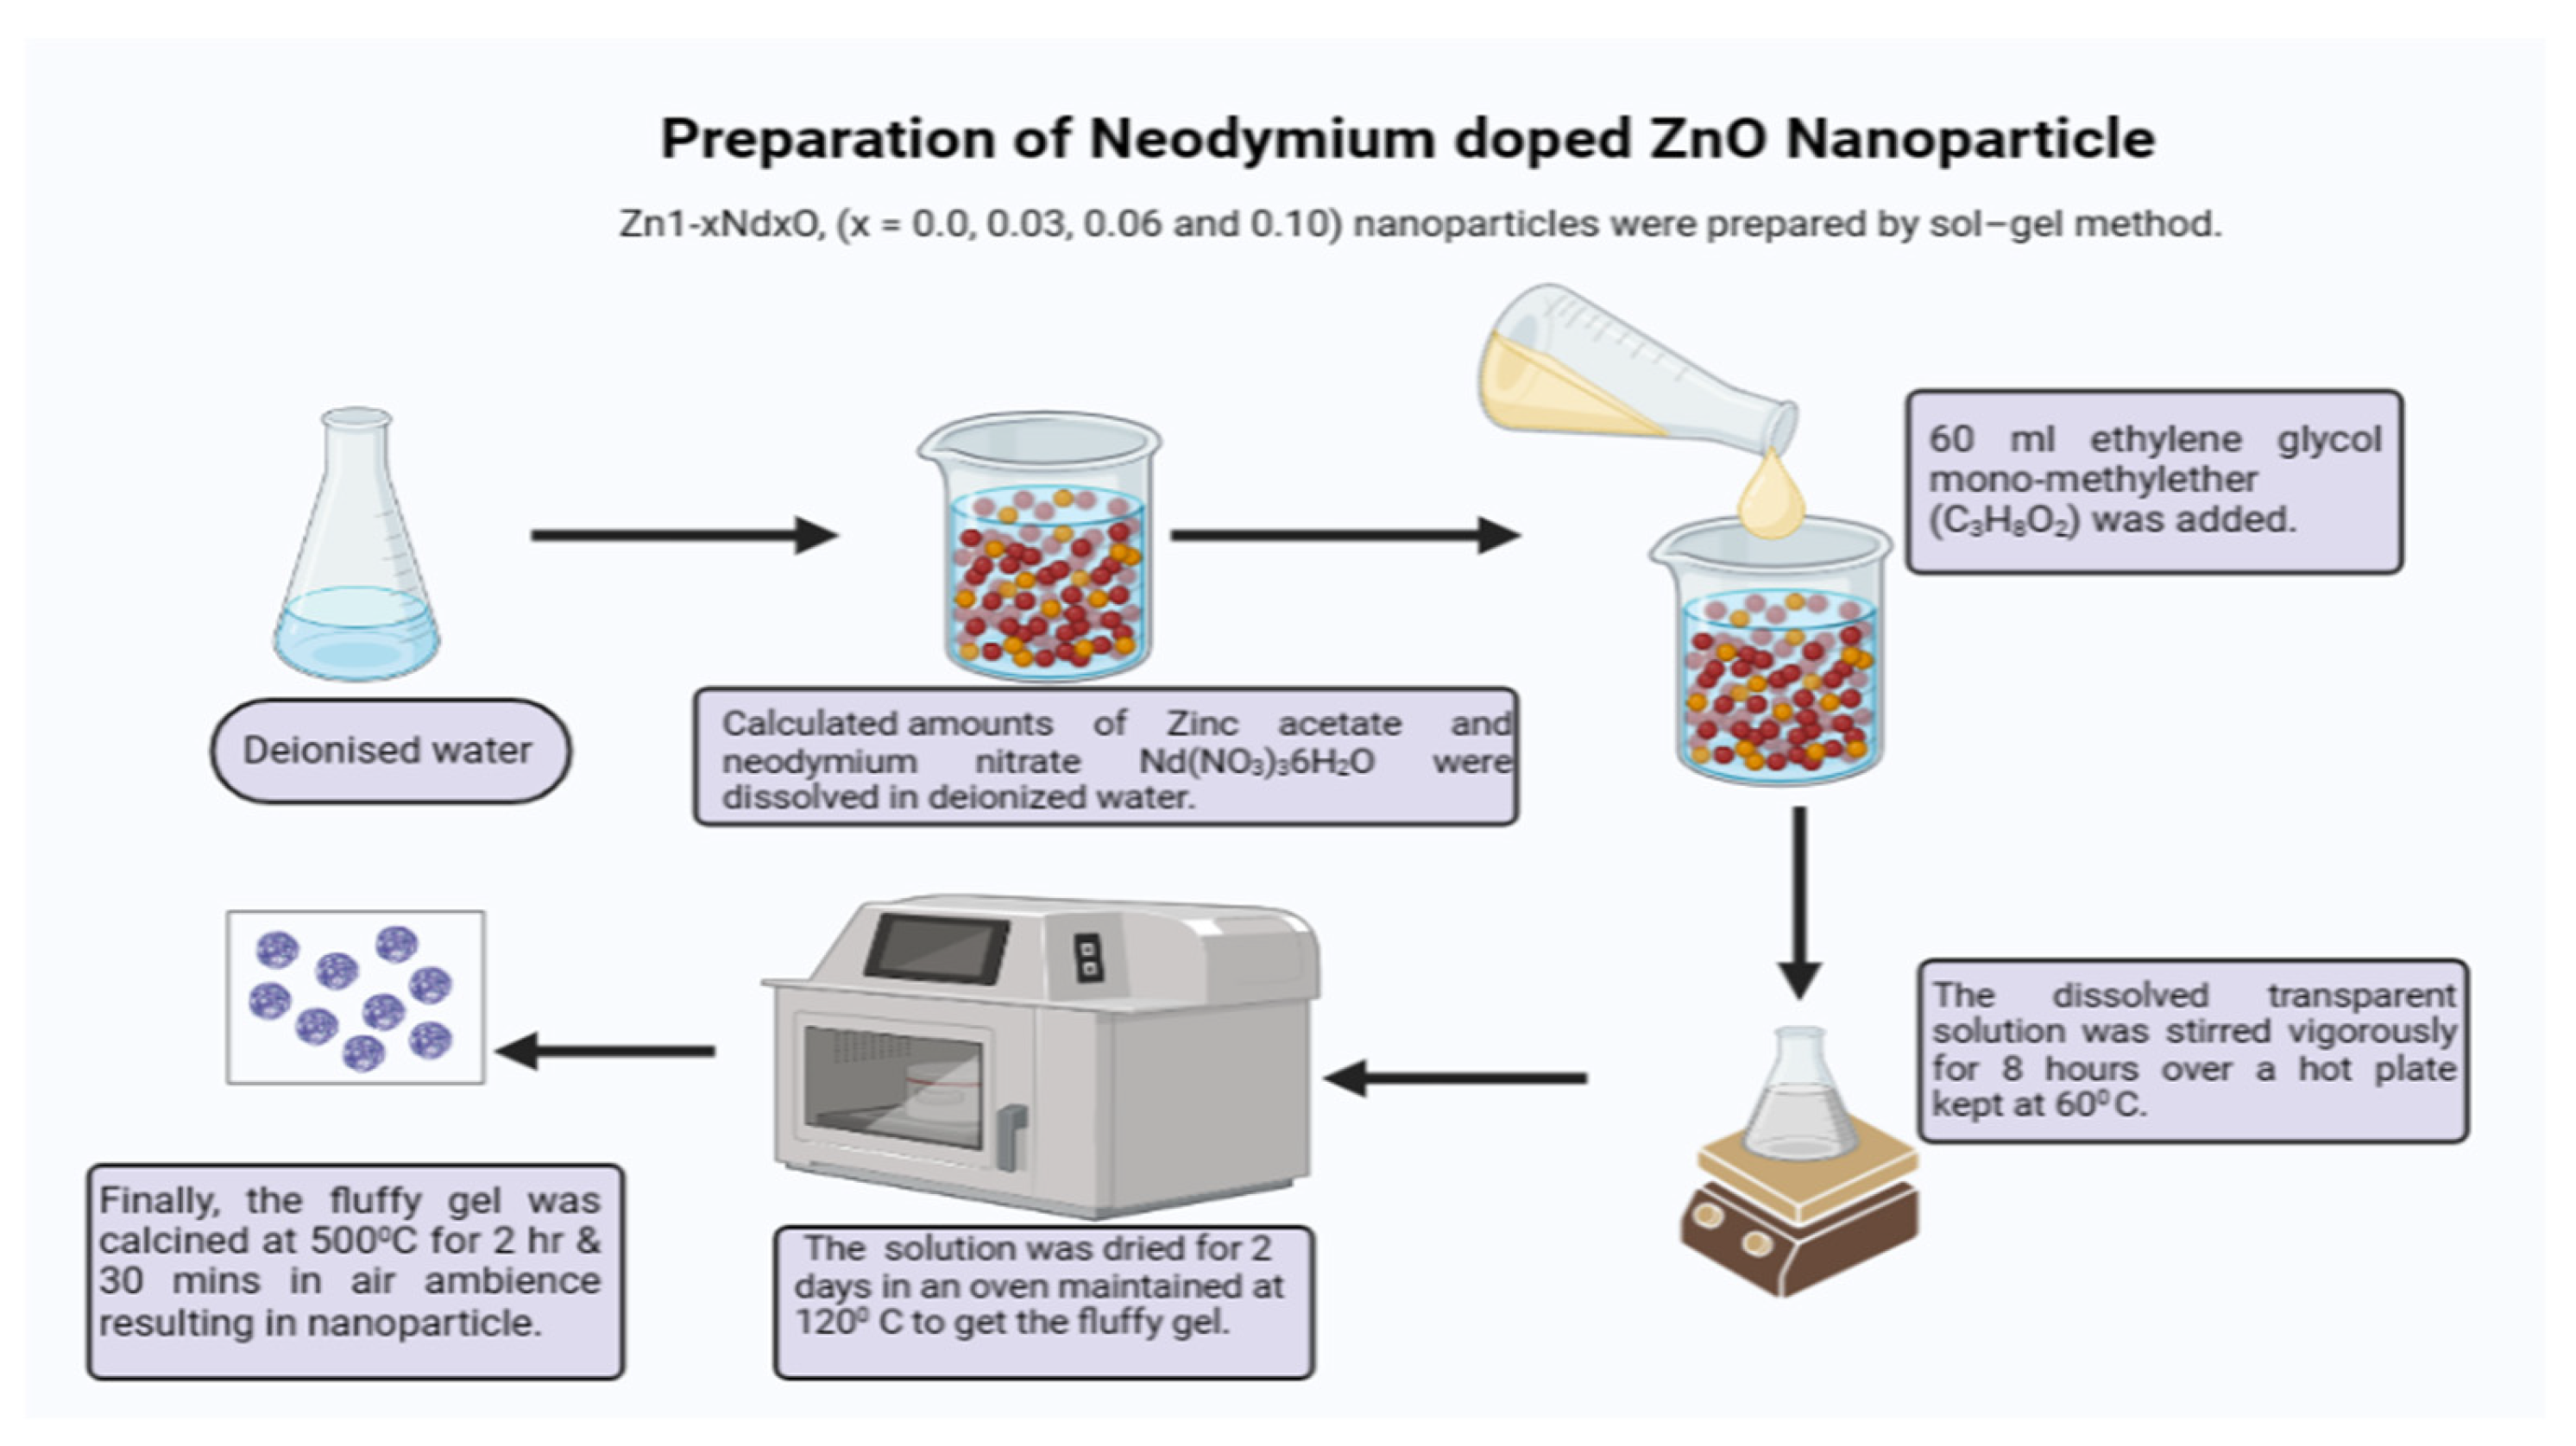
3.1. Process of Synthesis of Neodymium Metal Doped Zinc Oxide

The standard sol-gel process was used to prepare pure, and Nd3+ doped ZnO nanostructured materials, and the systematic synthesis method of synthesis is shown in Figure 14. Calculated zinc acetate and neodymium nitrate Nd(NO3)3.6H2O quantities were employed as the starting ingredients in the synthesizing process, and they were dissolved in de-ionized water after a calculated amount of ethylene glycol monomethylether (C3H8O2) was added to the transparent solution [15]. The dissolved transparent solution was rapidly agitated for 8 h over a hot plate set at 60 °C. The transparent solution was dried for two days in a 120 °C oven to obtain the fluffy gel. Finally, the fluffy gel was calcined at 500 °C for 2.5 h in an air ambiance, yielding Zn(1−x)NdxO nanostructured materials. Zn0.90Nd0.10O fluffy gel was calcined at various temperatures (400–700 °C) to investigate crystallinity.

3.2. Preparation of Cathode

Carbon felt was utilized to develop the catalyzed cathode [28]. The composite solution for the ink-based electrocatalyst was created by combining 1.5 mg/cm2 of as-synthesized Nd-doped ZnO. As a binder for the composite material, we used 34 µL/cm2. Polyvinylidene fluoride (PVDF) was used, and after that, it was dissolved in 20 mL of ethanol, which served as a solvent. The quantity of catalyst materials was standardized based on the geometric surface area of the cathode. For 20–30 min, a high-frequency sound wave sonicator (Labman, Chennai, India) set at 100 kHz was used to sonicate the catalyst mixture, resulting in a homogeneous composite catalyst solution. Using highly purified pressurized N2 gas, the conductive ink was sprayed onto a piece of carbon felt with an anticipated surface area of 35 cm2. The carbon felt was cleaned by immersion in 1 N HCl for one hour. The manufactured cathode was dried in a 100 °C hot air furnace and placed in an airtight container for future use. However, a control cathode was produced similarly without a catalyst in the solution. Prior to being fabricated, the carbon felt was rinsed with ethanol and distilled water to eliminate impurities, and it was then dried in an oven at 55–75 °C [29].

3.3. Fabrication of MDC

Two three-chamber MDCs were constructed in this research utilizing cubic poly-acrylic sheets (12 mm thick) with inner cylindrical chambers (cross-sectional area, 58 cm2). The MDCs had three chambers: anode (120 mL), cathode (120 mL), and middle desalination compartment. (120 mL) as shown in Figure 15 [13]. Each chamber was separated by two sets of ion exchange membranes (IEMs), and a watertight seal was formed with polyfix glue and elastosteal adhesive. To isolate the desalination chamber from the anode and cathode, an anion exchange membrane (RALEX AMH) and cation exchange membrane (RALEX CMH) was used [3]. Before inserting the ion exchange membranes (IEMs) into the MDCs, they were soaked in deionized water for 48 h. To decrease the internal resistance of the MDCs, a 5 mm inter-membrane distance was specified [28]. The anode and cathode of (4.0 × 8.0 cm) electrodes were made from carbon felt for both MDCs, one with and one without catalyst use. Concealed stainless steel wires were attached to the electrodes to form a closed circuit with a fixed resistance of 100 Ω.

3.4. MDCs Operation

For over 60 days, the three-chamber MDCs were operated at a 25–28 °C temperature range. The MDCs were inoculated with a slurry of mixed anaerobic sludge taken from the bottom of a sewage tank bioaugmented with locally isolated electroactive microbes Pseudomonas aeruginosa [30]. After appropriate conditioning, the sludge inoculum was introduced to the anode chamber. In batch mode, the anodic chambers of both MDCs (MDC1 and MDC2) were supplied with acetate-containing synthetic effluent. The anolyte was prepared (per 1 L tap water) with sodium acetate (3.8 g), sodium bicarbonate (4.5 g), ammonium chloride (0.954 g), calcium chloride (0.75), magnesium sulfate (0.192 g), potassium phosphate (0.081 g), and sodium sulfate (0.027 g). The middle desalination chamber was loaded with 25 g/L of NaCl solution [7]. Both MDCs utilized oxygen-saturated 100 mM phosphate saline buffer solution as their catholyte.

3.5. Analysis and Calculations

The voltage and the current across the 100 Ω external resistor were measured with a digital multi-meter (HAOYUE® DT830D). We were able to determine the current using the formula I = E/R. The formula P = I * E, where P denotes power, I denotes current, and E denotes voltage, was used to determine the total power. External resistances in the range of 40,000-1 Ω were used for polarization studies. The MDC’s internal resistance was calculated by determining the slope of the line depicting the relationship between voltage and current. The anode and cathode potentials were measured using an Ag/AgCl reference electrode (+197 mV vs. standard hydrogen electrode, Ossila Ltd., Solpro Business Park Windsor Street, Sheffield, UK).
On a daily basis, the TDS and the pH of the fluid inside the anodic, desalination, and cathodic chambers were monitored. A pH electrode (Labman, LMPH-10, India) was used to test pH, and a conductivity probe (Labtronics LT16, Panchkula, India) was used to measure TDS. The effectiveness of the desalination process was determined by tracking the change in TDS% over the 96-h batch period.
The Coulombic efficiency (CE,%) Is the percentage of electrons transferred to the anode compared to the overall number of electrons released by substrate oxidation. The CE was estimated according to the following equation:
CE   =   M 0 t I d t b F V a n Δ C O D
where ‘M’ denotes the molecular weight of O2, ‘I’ denote electric current (A), and ‘b’ denotes the number of electrons transferred from the anode to the cathode. Faraday’s constant is F = 96,485 C/mol. Van denotes the volume of the anolyte (the working capacity of the anode chamber), and Δ COD denotes the variation in COD of the influent and effluent in g/L. The soluble COD concentration was determined using the standard closed reflux procedure.

3.6. Characterization of Catalyst

The X-ray diffractometer (Shimadzu 6000) was utilized to analyze the prepared samples’ structural characteristics. The measurements were performed at room temperature via Cu Kα radiation source (λ = 1.5406 Å, operated at 40 KV and 30 mA), and the data were assembled in the range 2θ = 10° to 95°, taking the step size of 0.02° and a count time of 1.2 s at every step. The XRD patterns were subjected to Rietveld refinement analysis using Program Full-Prof. 2 k (Version 4.30-April 2008-ILL JRC), with the instrumental parameters calibrated using a typical Si measurement. Si was taken as an external standard to deconvolute the involvement of instrumental broadening. The instrumental parameters were retained constant while the fittings were finished. With the help of the space group P63mc, program refining for the entire sample began. The initial phase involved refining the global settings. The structural parameters, including the lattice parameter, atomic coordinates, and site occupancy, underwent revision throughout the next one. The following parameter was used to examine the experimental data’s ability to suit various fitting criteria: the accuracy of the fit was χ2.
The JEOL-2100F Tokyo, Japan, with LaB6 electron source, was used for the High-Resolution Transmission Electron Microscope (HRTEM) operated at 200 KV to image pure and Nd doped ZnO nanostructured materials. A drop of the dilute suspension was kept over the carbon-coated copper grid to prepare the samples for the TEM analysis. Photoluminescence (PL) spectroscopy (PerkinElmer, LS-55) measurements of the pure and Nd3+ doped ZnO nanostructured materials were executed with the excitation wavelength of 325 nm at room temperature.

4. Conclusions

Nd-doped ZnO was synthesized using the sol-gel method and tested in the MDC as ORR catalysts on the cathode in order to enhance both desalination efficiency and current recovery, and the electrochemical studies performed under neutral media suggested its superior catalytic activity towards ORR. The MDC using Nd doped ZnO coated cathode was able to achieve a desalination efficiency of 77.02% with 2.87 times higher power recovery (3.65 W/m3) compared to the MDC-2 with no catalyst (0.78 W/m3). Compared to the MDC-2 with no catalyst (0.78 W/m3), the MDC with Nd-doped ZnO-coated cathode achieved 77.02% desalination efficiency with 2.87 times higher power recovery (3.65 W/m3). After a batch cycle of 60 days, the Coulombic efficacy of the Nd-doped ZnO was 9.09%, and the COD elimination was 88.22%. Carbon-supported Nd-doped ZnO demonstrated high catalytic activity and can thus be seen as a possible alternative to the usual expensive catalysts employed in MDC.

Author Contributions

S.C. and S.R. experimental work, S.P. and A.R. conceptualized and designed the manuscript; S.C., S.R., S.P. and A.R. wrote the initial manuscript draft; A.G., G.A.E.-H., K.K.Y., B.R., J.-K.C. and B.-H.J. prepared the figures and the tables and also edited and revised the manuscript critically. All have approved the final manuscript of the authors. All authors have read and agreed to the published version of the manuscript.

Funding

G.A.El-Hiti acknowledges the support from the Researchers Supporting Project (number RSP2023R404), King Saud University, Riyadh, Saudi Arabia. This work was funded by the Korea Institute of Energy Technology Evaluation and Planning (KETEP) of the Republic of Korea (No. 20210310100020).

Data Availability Statement

The datasets generated during and/or analyzed during the current study are available from the corresponding author upon reasonable request.

Acknowledgments

G.A.El-Hiti s thankful to King Saud University, Riyadh, Saudi Arabia for supporting this work S.C. is thankful to Science and Engineering Research Board (SERB), File Number TAR/2019/000210, Govt. of India, for this research work. S.P. is thankful for a student seed grant from Sharda University.

Conflicts of Interest

The authors declare no conflict of interests.

References

  1. Van Bavel, J. The World Population Explosion: Causes, Backgrounds and Projections for the Future. Facts Views Vis. Obgyn. 2013, 5, 281–291. [Google Scholar] [PubMed]
  2. Saeed, H.M.; Husseini, G.A.; Yousef, S.; Saif, J.; Al-Asheh, S.; Abu Fara, A.; Azzam, S.; Khawaga, R.; Aidan, A. Microbial Desalination Cell Technology: A Review and a Case Study. Desalination 2015, 359, 1–13. [Google Scholar] [CrossRef]
  3. Kunwar, S.; Roy, A.; Bhusal, U.; Gacem, A.; Abdullah, M.M.; Sharma, P.; Yadav, K.K.; Rustagi, S.; Chatterjee, N.; Deshwal, V.K.; et al. Bio-Fabrication of Cu/Ag/Zn Nanoparticles and Their Antioxidant and Dye Degradation Activities. Catalysts 2023, 13, 891. [Google Scholar] [CrossRef]
  4. Tawalbeh, M.; Al-Othman, A.; Singh, K.; Douba, I.; Kabakebji, D.; Alkasrawi, M. Microbial Desalination Cells for Water Purification and Power Generation: A Critical Review. Energy 2020, 209, 118493. [Google Scholar] [CrossRef]
  5. Imoro, A.Z.; Mensah, M.; Buamah, R. Developments in the Microbial Desalination Cell Technology: A Review. Water-Energy Nexus 2021, 4, 76–87. [Google Scholar] [CrossRef]
  6. Sharma, M.; Salama, E.-S.; Thakur, N.; Alghamdi, H.; Jeon, B.-H.; Li, X. Advances in the Biomass Valorization in Bioelectrochemical Systems: A Sustainable Approach for Microbial-Aided Electricity and Hydrogen Production. Chem. Eng. J. 2023, 465, 142546. [Google Scholar] [CrossRef]
  7. Kim, Y.; Logan, B.E. Microbial Desalination Cells for Energy Production and Desalination. Desalination 2013, 308, 122–130. [Google Scholar] [CrossRef]
  8. Jingyu, H.; Ewusi-Mensah, D.; Norgbey, E. Desalination and Water Treatment Microbial Desalination Cells Technology: A Review of the Factors Affecting the Process, Performance and Efficiency. Desalination Water Treat. 2017, 87, 140–159. [Google Scholar] [CrossRef]
  9. Ma, R.; Lin, G.; Zhou, Y.; Liu, Q.; Zhang, T.; Shan, G.; Yang, M.; Wang, J. A Review of Oxygen Reduction Mechanisms for Metal-Free Carbon-Based Electrocatalysts. Npj Comput Mater 2019, 5, 1–15. [Google Scholar] [CrossRef] [Green Version]
  10. Goswami, C.; Hazarika, K.K.; Bharali, P. Transition Metal Oxide Nanocatalysts for Oxygen Reduction Reaction. Mater. Sci. Energy Technol. 2018, 1, 117–128. [Google Scholar] [CrossRef]
  11. Kim, H.H.; Saha, S.; Hwang, J.-H.; Hosen, M.A.; Ahn, Y.-T.; Park, Y.-K.; Khan, M.A.; Jeon, B.-H. Integrative Biohydrogen- and Biomethane-Producing Bioprocesses for Comprehensive Production of Biohythane. Bioresour. Technol. 2022, 365, 128145. [Google Scholar] [CrossRef] [PubMed]
  12. Al-Mamun, A.; Ahmad, W.; Baawain, M.S.; Khadem, M.; Dhar, B.R. A Review of Microbial Desalination Cell Technology: Configurations, Optimization and Applications. J. Clean. Prod. 2018, 183, 458–480. [Google Scholar] [CrossRef]
  13. Anusha, G.; Noori, M.T.; Ghangrekar, M.M. Application of Silver-Tin Dioxide Composite Cathode Catalyst for Enhancing Performance of Microbial Desalination Cell. Mater. Sci. Energy Technol. 2018, 1, 188–195. [Google Scholar] [CrossRef]
  14. Wang, J.; Chen, R.; Xiang, L.; Komarneni, S. Synthesis, Properties and Applications of ZnO Nanomaterials with Oxygen Vacancies: A Review. Ceram. Int. 2018, 44, 7357–7377. [Google Scholar] [CrossRef]
  15. Chauhan, S.; Kumar, M.; Chhoker, S.; Katyal, S.C.; Awana, V.P.S. Structural, Vibrational, Optical and Magnetic Properties of Sol–Gel Derived Nd Doped ZnO Nanoparticles. J. Mater. Sci. Mater. Electron. 2013, 24, 5102–5110. [Google Scholar] [CrossRef]
  16. Sharma, D.K.; Shukla, S.; Sharma, K.K.; Kumar, V. A Review on ZnO: Fundamental Properties and Applications. Mater. Today Proc. 2022, 49, 3028–3035. [Google Scholar] [CrossRef]
  17. Fujihara, S.; Ogawa, Y.; Kasai, A. Tunable Visible Photoluminescence from ZnO Thin Films through Mg-Doping and Annealing. Chem. Mater. 2004, 16, 2965–2968. [Google Scholar] [CrossRef]
  18. Panigrahy, B.; Aslam, M.; Bahadur, D. Effect of Fe Doping Concentration on Optical and Magnetic Properties of ZnO Nanorods. Nanotechnology 2012, 23, 115601. [Google Scholar] [CrossRef]
  19. Sharma, P.; Singh, P.; Kamni. Study of Synthesis Mechanism, Structural, Optical and Luminescent Properties of Bluish-Violet Rare Earth Doped KSrVO4: Nd3+ Nano Powders. Mater. Sci. Eng. B 2022, 276, 115564. [Google Scholar] [CrossRef]
  20. Vempaty, A.; Kumar, A.; Pandit, S.; Gupta, M.; Mathuriya, A.S.; Lahiri, D.; Nag, M.; Kumar, Y.; Joshi, S.; Kumar, N. Evaluation of the Datura Peels Derived Biochar-Based Anode for Enhancing Power Output in Microbial Fuel Cell Application. Biocatal. Agric. Biotechnol. 2023, 47, 102560. [Google Scholar] [CrossRef]
  21. Pandit, S.; Khanna, S.; Mathuriya, A.S. Analysis of Pyridine-2-Carbaldehyde Thiosemicarbazone as an Anti-Biofouling Cathodic Agent in Microbial Fuel Cell. Appl. Microbiol. Biotechnol. 2023, 107, 459–472. [Google Scholar] [CrossRef] [PubMed]
  22. Shatnawi, M.; Alsmadi, A.M.; Bsoul, I.; Salameh, B.; Alna’washi, G.A.; Al-Dweri, F.; El Akkad, F. Magnetic and Optical Properties of Co-Doped ZnO Nanocrystalline Particles. J. Alloys Compd. 2016, 655, 244–252. [Google Scholar] [CrossRef]
  23. Sahai, A.; Goswami, N. Structural and Vibrational Properties of ZnO Nanoparticles Synthesized by the Chemical Precipitation Method. Phys. E Low-Dimens. Syst. Nanostructures 2014, 58, 130–137. [Google Scholar] [CrossRef]
  24. Sahai, A.; Goswami, N. Probing the Dominance of Interstitial Oxygen Defects in ZnO Nanoparticles through Structural and Optical Characterizations. Ceram. Int. 2014, 40, 14569–14578. [Google Scholar] [CrossRef]
  25. Tiwari, B.; Noori, M. Carbon Supported Nickel-Phthalocyanine/MnO x as Novel Cathode Catalyst for Microbial Fuel Cell Application. Int. J. Hydrogen Energy 2017, 42, 23085–23094. [Google Scholar] [CrossRef]
  26. Kumar, A.; Siddiqui, T.; Pandit, S.; Roy, A.; Gacem, A.; Souwaileh, A.A.; Mathuriya, A.S.; Fatma, T.; Sharma, P.; Rustagi, S.; et al. Application of Biogenic TiO2 Nanoparticles as ORR Catalysts on Cathode for Enhanced Performance of Microbial Fuel Cell. Catalysts 2023, 13, 937. [Google Scholar] [CrossRef]
  27. Pema, T.; Kumar, A.; Tripathi, B.; Pandit, S.; Chauhan, S.; Singh, S.; Dikshit, P.K.; Mathuriya, A.S.; Gupta, P.K.; Lahiri, D.; et al. Investigating the Performance of Lithium-Doped Bismuth Ferrite [BiFe1−xLixO3]-Graphene Nanocomposites as Cathode Catalyst for the Improved Power Output in Microbial Fuel Cells. Catalysts 2023, 13, 618. [Google Scholar] [CrossRef]
  28. Pradhan, H.; Ghangrekar, M.M. Multi-Chamber Microbial Desalination Cell for Improved Organic Matter and Dissolved Solids Removal from Wastewater. Water Sci. Technol. 2014, 70, 1948–1954. [Google Scholar] [CrossRef] [Green Version]
  29. Jafary, T.; Al-Mamun, A.; Alhimali, H.; Baawain, M.S.; Rahman, S.; Tarpeh, W.A.; Dhar, B.R.; Kim, B.H. Novel Two-Chamber Tubular Microbial Desalination Cell for Bioelectricity Production, Wastewater Treatment and Desalination with a Focus on Self-Generated PH Control. Desalination 2020, 481, 114358. [Google Scholar] [CrossRef]
  30. Sharma, K.; Pandit, S.; Thapa, B.S.; Pant, M. Biodegradation of Congo Red Using Co-Culture Anode Inoculum in a Microbial Fuel Cell. Catalysts 2022, 12, 1219. [Google Scholar] [CrossRef]
Figure 1. (a) XRD patterns of Zn1−xNdxO nanostructured materials calcined at 500 °C. (b) XRD patterns of Zn0.90Nd0.10O nanostructured samples calcined at different temperatures. The symbol * Shows the impurity phase of Nd2O3. (ce) Rietveld refined XRD patterns of (c) x = 0.00, (d) x = 0.03, (e) x = 0.06, and (f) x = 0.10.
Catalysts 13 01164 g001
Figure 2. Structural parameters depending on x in Zn(1−x)NdxO; (a) lattice constant ‘a’ and unit cell volume V, and inset shows the variation of u with x and (b) bond lengths and angles.
Catalysts 13 01164 g002
Figure 3. (a) The structure’s slice for the matching xy plane with a z intercept value of 1.0 for the anion and cation ratios in the ZnO system. The electron density plots for Zn(1−x)NdxO nanostructured samples (b) x = 0.00 (c) x = 0.03, (d) x = 0.06 and (e) x = 0.10.
Catalysts 13 01164 g003
Figure 4. (ac) Williamson–Hall plots of the Zn(1−x)NdxO nanostructured samples with different approaches: (a) UDM, (b) USDM, (c) UDEDM, and (d) crystallite size and energy density vs. x of Zn(1−x)NdxO samples using UDEDM.
Catalysts 13 01164 g004
Figure 5. (ad) TEM images of Zn1−xNdxO nanostructured samples: (a) x = 0.00, (b) x = 0.03, (c) x = 0.07, and (d) x = 0.10. (e,i) SAED Pattern Zn1−xNdxO nanostructured samples, (e) x = 0.00, and (i) 0.06 sample. HRTEM image of Zn1−xNdxO nanostructured samples: (f) x = 0.00, and (j) x = 0.06 samples. (g,k) The FFT of the images corresponding to the selected portion of figure (f,j). (h,l) FFT obtained interplanar spacing with plane (100) for x = 0.00 and x = 0.06 samples.
Catalysts 13 01164 g005
Figure 6. The EDX elemental mapping of the Zn(1−x)NdxO nanostructured materials. (a1d1) x = 0.02 and (a2d2) x = 0.04.
Catalysts 13 01164 g006
Figure 7. Photoluminescence Spectra of Zn1−xNdxO nanostructured samples. (a) Photoluminescence Spectra of Zn1−xNdxO nanostructured samples. (bd) Peak fitted photoluminescence spectra of Zn1−xNdxO nanostructured samples. (b) x = 0.00, (c) x = 0.03 and (d) x = 0.10.
Catalysts 13 01164 g007
Figure 8. CV curve obtained for Nd-doped ZnO catalyst and without catalyst.
Catalysts 13 01164 g008
Figure 9. Desalination efficiency with 1.5 g/cm2 Nd-doped ZnO as the catalyst and without catalyst with the initial TDS concentration of 15 g/L.
Catalysts 13 01164 g009
Figure 10. Polarization curve obtained for different concentrations of Nd-doped ZnO.
Catalysts 13 01164 g010
Figure 11. Columbic efficiency and COD removal of different concentrations of Nd-doped ZnO.
Catalysts 13 01164 g011
Figure 12. TDS concentration with an initial TDS concentration of 15 g/L in the middle desalination chamber in the anodic, desalination, and cathodic chambers.
Catalysts 13 01164 g012
Figure 13. At an initial TDS concentration of 30 g/L in the middle desalination chamber, the TDS concentration in the anodic, desalination, and cathodic chambers.
Catalysts 13 01164 g013
Figure 14. Schematic representation of nanoparticle preparation by sol-gel method.
Catalysts 13 01164 g014
Figure 15. Schematic representation of a three-chambered air cathode MDC.
Catalysts 13 01164 g015
Table 1. Geometric parameters of Zn1−xNdxO nanostructured samples by Williamson-Hall analysis.
SampleWilliamson Hall Method
UDMUDSMUDEDM
D (nm)ε × 10−3D (nm)ε × 10−3σ (MPa)D (nm)ε × 10−3σ (MPa)u (KJm−3)
x = 0.00301.82271.74215.28261.80222.26196.15
x = 0.03281.77241.646210.78241.74220.45192.41
x = 0.06340.6131300.568171.64300.59675.1622.425
x = 0.10480.3419540.317240.002550.332741.966.982
Table 2. Performance of three-chamber microbial desalination cell in terms of chemical oxygen demand removal, Columbic efficiency, and power densities in a batch cycle 0.75 mg/cm2, 1.0 mg/cm2, 1.5 mg/cm2, and 1.75 mg/cm2, and without Nd-doped ZnO as a catalyst in MDC.
Nd-Doped ZnO Concentration (mg/cm2)COD Removal (%)CE (%)PD (W/m3)DC
Voltage (V)
0.7580.46.021.28515
1.082.017.041.98545
1.586.088.82.28585
1.7586.018.023.65603
Without catalyst70.94.560.78475
Table 3. The efficiency of the three-chamber MDC’s batch cycles of desalination with an initial TDS concentration of 15 g/L.
TDS Concentration 15 (g/L)
Time (t)AnodeDesalinationCathode
06150.2
206.25121
406.6510.41.25
806.758.21.75
1007.036.142.23
Table 4. The efficiency of desalination during batch cycles in a three-chamber MDC (with 1 mg/cm2 and initial TDS concentration of 30 g/L in the middle desalination chamber).
TDS Concentration 30 (g/L)
Time (t)AnodeDesalinationCathode
05.5300.24
205.75231.38
406182.03
806.1211.42.5
1006.028.22.65
Disclaimer/Publisher’s Note: The statements, opinions and data contained in all publications are solely those of the individual author(s) and contributor(s) and not of MDPI and/or the editor(s). MDPI and/or the editor(s) disclaim responsibility for any injury to people or property resulting from any ideas, methods, instructions or products referred to in the content.

