Article

High-Performance Methanol Oxidation via Ni12-Metal8/CNF Catalyst for Fuel Cell Applications

by
Mahmoud. M. Gomaa
1,
Mohamed. O. Abdel-Hamed
1,
Mohamed Ibrahim
2,
Esam. E. Abdel-Hady
1,* and
Yehya S. Elsharkawy
1
1
Physics Department, Faculty of Science, Minia University, Minia P.O. Box 61519, Egypt
2
Basic Science Department, Modern Academy for Engineering and Technology, Maadi 4410242, Egypt
*
Author to whom correspondence should be addressed.
Catalysts 2024, 14(10), 680; https://doi.org/10.3390/catal14100680
Submission received: 1 September 2024 / Revised: 20 September 2024 / Accepted: 28 September 2024 / Published: 1 October 2024
(This article belongs to the Special Issue Advances in Catalyst Design and Application for Fuel Cells)

Abstract

:
In this work, non-precious electrocatalysts were synthesized using the electrospinning technique. Ni12M8/CNF (M = Cd, Co, and Cu) catalysts were successfully prepared in a fixed ratio to withstand the optimum transition metal co-catalyst in addition to the role of CNFs as support in ion-charge movement through the catalyst surface. The prepared catalysts were physically studied by XRD, SEM, and TEM. The electrochemical activity was verified using different fuel concentrations, different sweeping scan rates, and electrochemical impedance. Ni12Cu8/CNFs showed the highest electrochemical activity reaching 152 mA/cm2 through different methanol concentrations. The outstanding performance is attributed to the large active surface area provided by carbon nanofibrous that eases the charge carrier transfer through the untrapped surface of the catalyst. The electrochemical tests suggest that Ni12Cu8/CNFs have the lowest ohmic impedance resistance ensuring the highest efficiency of the designed catalyst. The obtained results serve as an efficient catalyst for direct methanol electrooxidation reactions and suggest a possible application of a low-cost, easily accessible, and large surface area established via the preparing method.

1. Introduction

The world’s increasing energy needs have prompted a reconsideration of conventional energy sources due to worries about resource scarcity, environmental concerns, and price volatility. The historical dominance of fossil fuels in global energy consumption is increasingly raising concerns about their environmental impact and long-term sustainability [1]. Fuel cells are gaining great research potential as effective energy conversion technology that can replace traditional power sources [2]. Direct methanol fuel cells (DMFCs) are also an excellent alternative to fossil fuels due to their high efficiency, low emissions, and ability to operate at low operating temperatures. DMFCs operate through electrochemical processes in alkaline electrolytes and their effectiveness has surpassed other fuel cell types. [3]. Methanol’s high energy density is a result of its hydrogen-rich composition, efficient oxidation in DMFCs, and convenient liquid state. For the power industry, DMFCs offer high efficiency, low noise, simple maintenance, and ease of transporting and storing liquid fuel [4]. While advantageous in several aspects, there are notable drawbacks that must be addressed, including the high cost of the anode catalyst and limitations in its electrocatalytic performance. The electrochemical processes at the catalyst layers control the performance of fuel cells and have a major impact on their durability, power density, and efficiency [5,6]. Catalyst materials are essential to promote these reactions and enhance fuel cell performance.
Platinum (Pt) is a well-liked catalyst for fuel cells due to its exceptional electrocatalytic qualities. Platinum and other noble metals are suitable for high power densities and efficient oxidation and reduction reactions due to their high activity, efficiency, durability, and impurity tolerance [7]. The large-scale deployment of these noble electrodes is hindered by several disadvantages, including their high cost and limited availability [8]. Furthermore, Pt exhibits sensitivity to electrochemical surface modifications, making it susceptible to performance degradation due to CO poisoning [9]. These and other issues caused the commercial use of fuel cells to slow down, and these noble metal-based electrodes became rare and expensive.
Recently, concerns have been raised worldwide about the need to produce a well-substitutional catalyst that is readily available, abundant, and has many active sites on its surface to quickly adsorb the reactants [10]. Strong electron–ion and mass-transfer capabilities should be present in addition to its high mechanical strength and long-term stability (i.e., anti-poisoning) qualities [11]. Recently, numerous research works have proposed diverse techniques to decrease or substitute platinum as nano Pt/M with metal loading (M=Co, Fe, Sn, or Ni) [12,13,14,15]. This is because the oxidation of adsorbed CO can be dramatically enhanced by the addition of a second metal, producing the active sites and greatly improving reaction kinetics. During methanol electrooxidation on platinum (Pt) electrodes, adsorbed carbon monoxide (CO) significantly affects catalytic performance by causing “poisoning,” which blocks active sites and reduces reaction efficiency. This occurs as methanol is oxidized, producing CO as an intermediate. To restore efficiency, it is important to oxidize adsorbed CO back to carbon dioxide (CO2), although this requires higher potentials and can slow the reaction rate. Strategies to enhance CO oxidation include alloying Pt with metals such as ruthenium (Ru) or palladium (Pd) and optimizing conditions to promote methanol adsorption over CO. Understanding CO dynamics is vital for improving the efficiency of Pt-based catalysts in fuel cells.
An alternative strategy is a Pt core–shell, where the outside active surface is Pt and the inside is a relatively less expensive metal as Ni core [16]. Ni is primarily used for hydrogenating and reforming hydrocarbons because it is a far less costly option than Pt. Additionally, it has the same capacity to divide absorbed hydrogen, producing active species, also because of its notable electrocatalytic efficiency and selectivity [17]. However, over time, carbon deposition and sintering can render Ni electrocatalysts inactive, leading to reduced cell performance [18,19,20]. Because of their great activity and high carbon solubility, supported Ni nanoparticles (NPS) are typically employed as growth catalysts [21,22,23]. However, the major drawback of these catalysts is their quick deactivation rate [24]. Bimetallic catalysts have been thoroughly studied as a possible remedy for this problem. In addition, the poisoning resistance and catalytic stability of the DMFC anodes can be increased by raising the electrocatalytic activity of different metal alloy electrocatalysts, such as nickel–copper alloys [25]. Face-centered cubic metals Ni and Cu have very similar lattice constants (a = 0.3523 and 0.3616 nm, respectively). Thus, different compositions can be achieved when creating Ni–Cu alloys using different preparation techniques. Plamen et al. accomplished tests on a single membrane electrode assembly fuel cell that showed a power density of 350 mW/cm2 at 80 °C using nickel-rich Ni95Cu5 alloy nanoparticles supported on Ketjenblack (KB) family carbon blacks. Surface analysis revealed that the passive hydroxide layer present on the Ni surface of the Ni/KB catalysts sample acts as a superimposition, making the surface undesirable for initial hydrogen adsorption [26]. Cu, Ni, and bimetallic Cu-Ni nanoparticles supported on graphitic carbon nitride (g-C3N4) were used by Pieta et al. as replacements for noble metal catalysts for methanol electrooxidation [27]. The authors noted the onset potential was reduced compared to (Pt-C3N4); in addition, the generated hybrid catalysts have acceptable current density with relative stability, for which authors recommend adjusting the stoichiometry of the transition metals along with the surface morphology and chemical composition of the nanocomposite to control the current density and photocurrent, which offers a great deal of flexibility in modifying their performance and attributes. A new tensile lattice strained Ni@NiCu catalyst, consisting of a Ni crystallite core and a NiCu alloy shell, was successfully fabricated by Zhou et al. Its catalytic activity, stability, and selectivity towards the electrooxidation of borohydrides are exceptional [28]. As optimum catalyst activity reaches 40 mA/cm2, it achieves a power density of 433 mW/cm2 and voltage of the open circuit 194 mV, outperforming other anode catalysts documented in the literature. However, a detailed investigation of the catalysts provided strong support for the work, but it ignored other fuels like methanol [28].
This study’s strength lies in its utilization of a straightforward and economical approach to novel catalyst preparation. To the best of our knowledge, there are limited data for the use of additive metal concentrations and experimental techniques for the same prepared catalysts, and the effect of carbon-based materials like carbon nanofibers (CNFs) is a goal of our study. Table S1 lists related studies with varying metal composites, preparation techniques, fuel types, onset potentials, and current densities.
This work aims to establish a novel class of highly efficient and reasonably priced electrocatalysts by replacing Pt with less expensive metals, such as Ni, Cd, Co, and Cu, all supported on carbon nanofibers. Consequently, different bimetallic composites employing non-noble metals (M = Cd, Co, and Cu) with the same concentration ratio were mixed similarly with Ni to obtain Ni12M8/CNFs using the electrospinning technique. Through comprehensive analysis and characterization of the electrospun catalysts, the most effective metal mixture for the electrooxidation process of methanol fuel in alkaline environments was determined. While scanning electron microscopy (SEM) and transmission electron microscopy (TEM) provided detailed morphological analysis, methods such as X-ray diffraction (XRD) determined the phase and crystal structures of the metal/CNFs. To evaluate the performances of the catalysts, the effects of various concentrations of electrolyte, different scan rates, and linear sweep voltammetry were measured. Chronoamperometry, cyclic voltammetry, and electrochemical impedance spectroscopy were used to assess the electrode’s dependability and effectiveness.

2. Result and Discussion
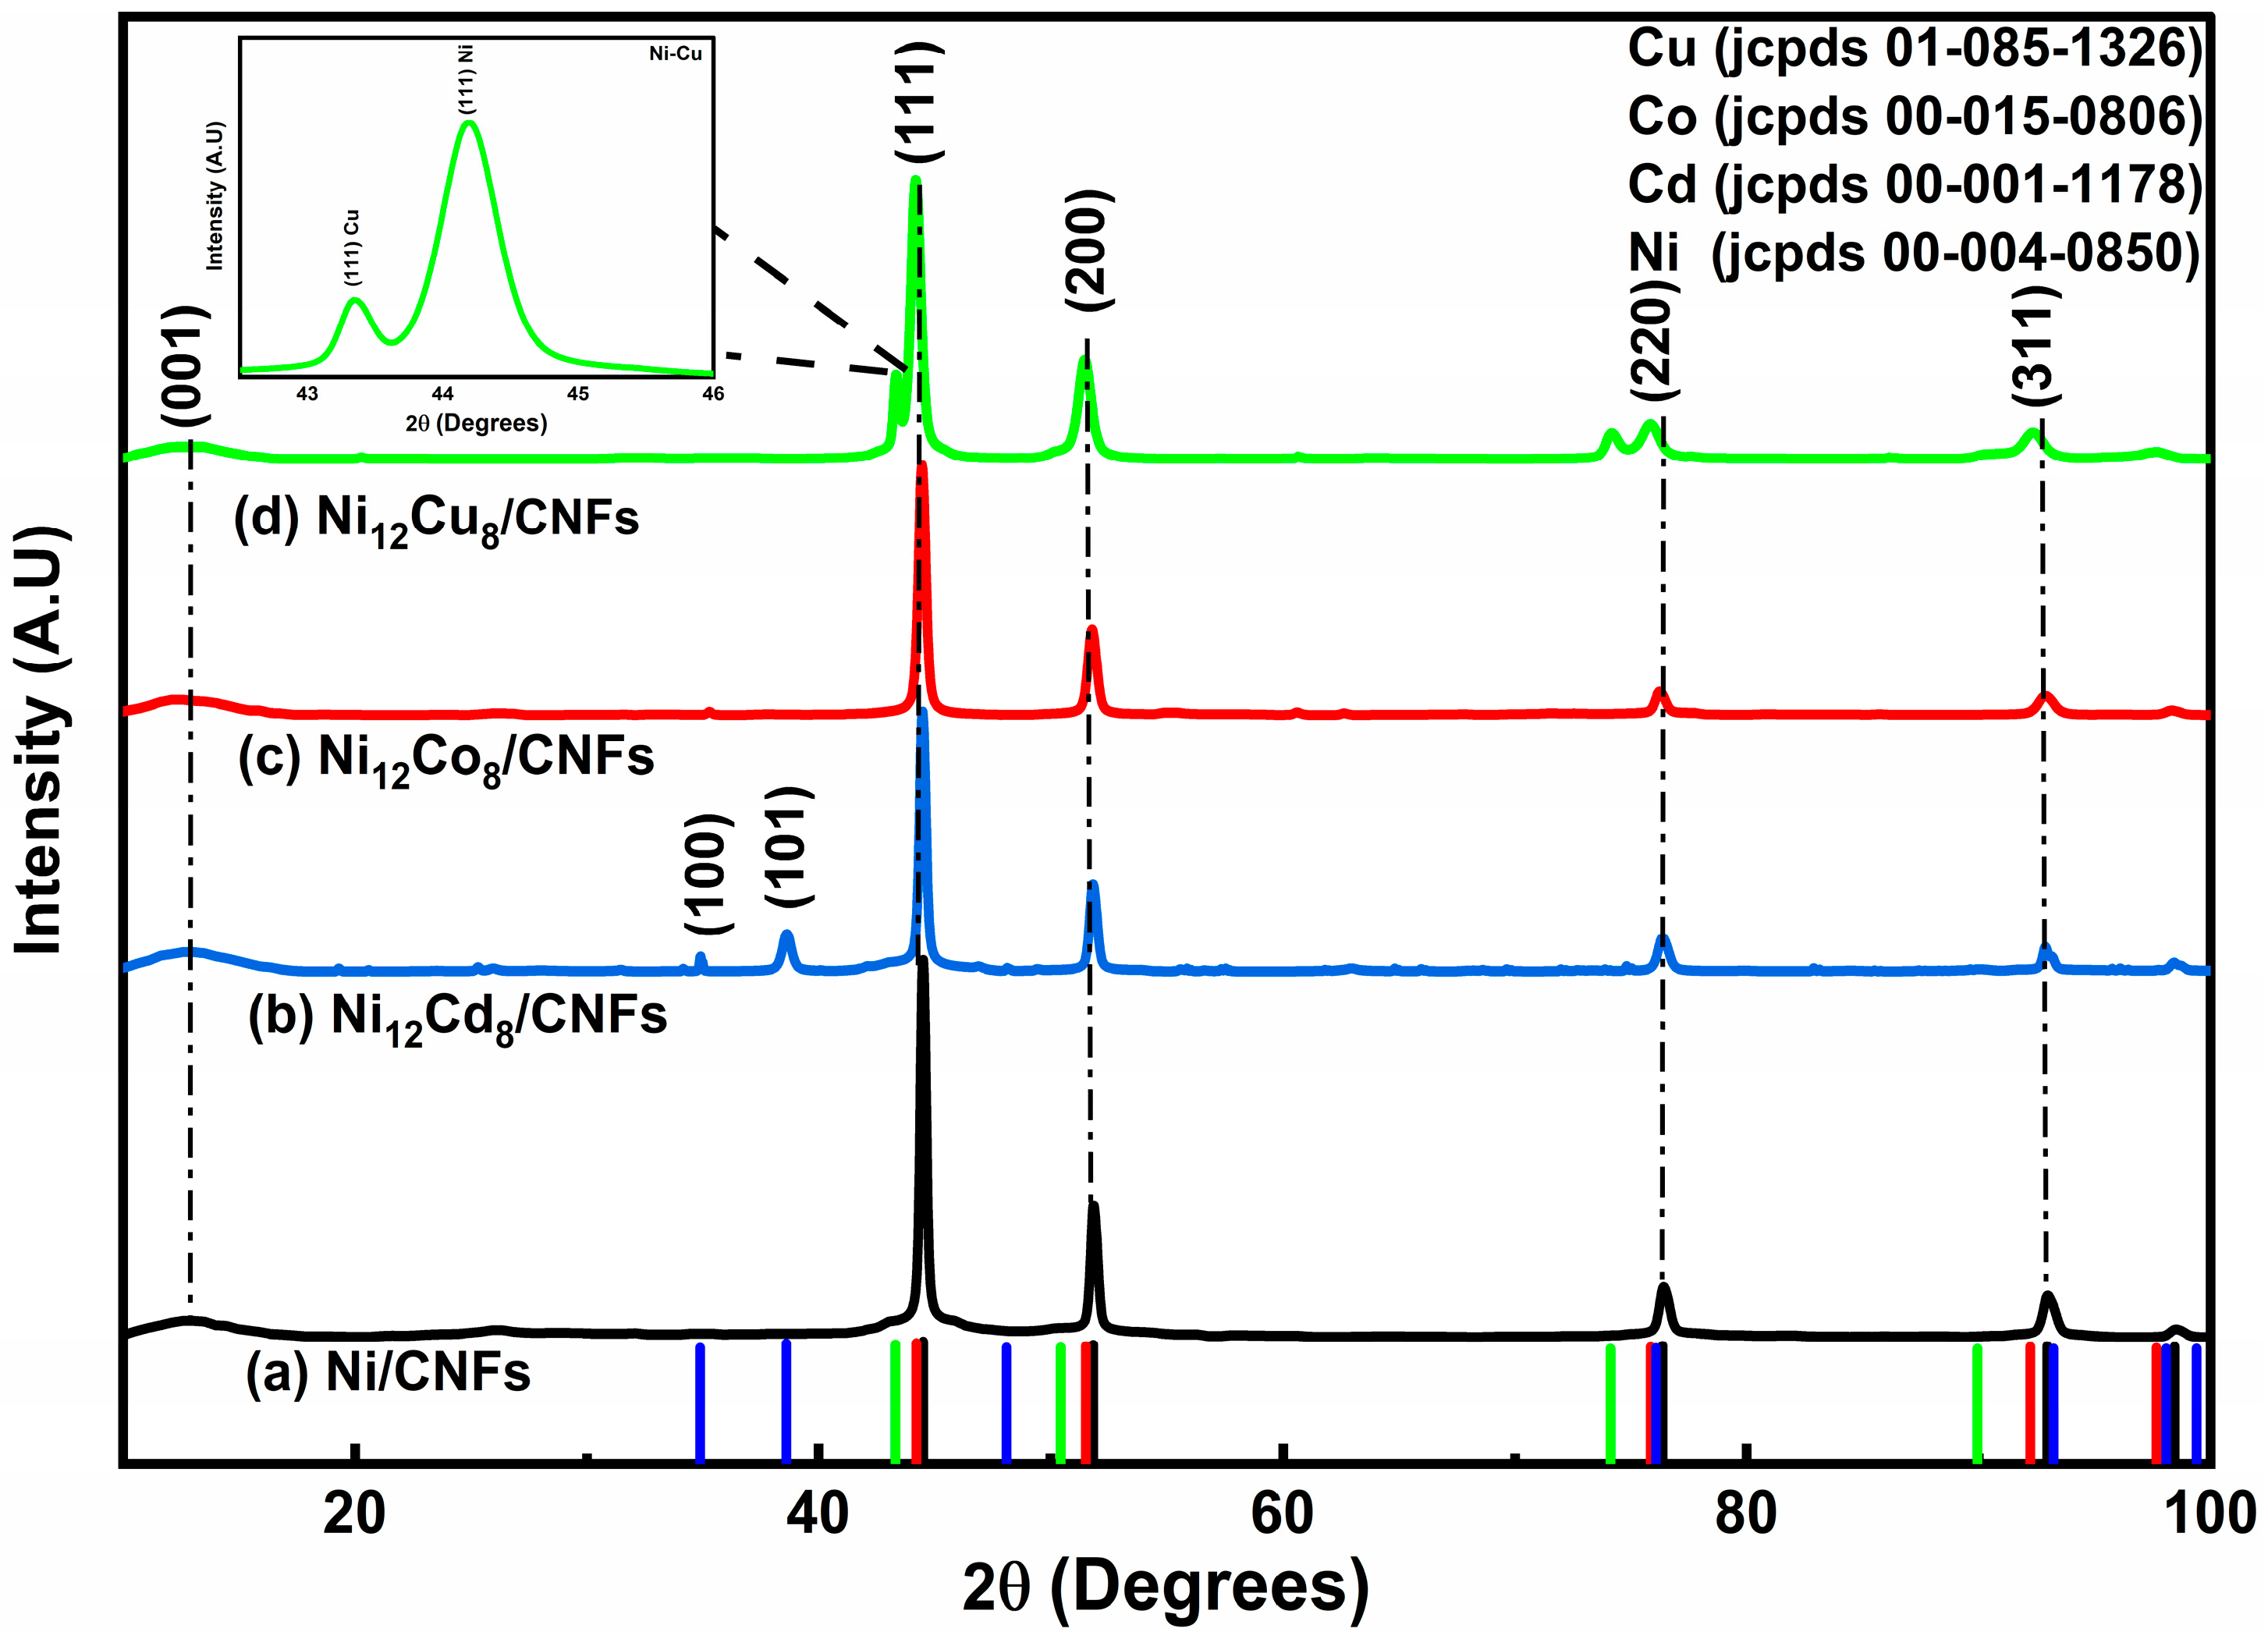
2.1. XRD Analysis

XRD is a powerful analytical technique that gives detailed information about the crystal structure, diffraction planes, and crystallite size of the composite Ni12M8/CNFs. Figure 1 shows various diffraction patterns of prepared electrospun fibers with the corresponding standard pattern with JSPD card numbers for metal additives. The observed peak at 12.5° corresponds to the (001) diffraction peak of reduced graphene oxide (rGO), whereas the standard peak in the literature for the graphite plane of the CNF characteristic peak (002) of graphite around 26° nearly vanished due to oxidation after carbonization [29]. The existence of the rGO layer comes from the oxidation of the graphite plane of some functional groups such as carboxyl and hydroxyl [30,31].
Figure 1a shows a typical standard diffraction pattern with dotted lines of Ni with (111), (200), (220), and (311) planes at 2θ values of 44.47°, 51.83°, 76.3°, and 98.4° (JCPDS No. 04–0850). Furthermore, the peaks’ sharpness and intensity reveal details about the metal alloy phases’, crystallinity, and particle sizes. Ni is displayed as an FCC with a lattice constant of 3.5 Å. The presence of amorphous Ni oxide and hydroxide phases is totally absent, and this is also evident in the formation of pure Ni/CNFs with desired ratios (20% wt.) of metal.
In addition, cadmium-specific peaks at 34.8° and 38.6°, as shown in Figure 1b, are attributed to the (100) and (101) planes, respectively, with characteristic peaks of hexagonal Cd [32]. The Ni12Cd8/CNFs sample shows lower intensities for the Ni planes as the Ni concentration is relatively lower than that of Ni/CNFs.
In Figure 1c, indicates that the presence of Co altered the crystal structure of the Ni12Co8/CNF bimetal particles by showing a slight shift in peak positions and a decrease in peak intensity. There are three distinct diffraction peaks at 2θ values of 44.4°, 51.7°, and 76.2°, which represent the crystallite planes of the FCC phase (111), (200), and (220), respectively, (JCPDS No. 015–0806). Furthermore, nickel atoms can replace some cobalt atoms in the alloy because of its slightly larger lattice parameter, which results in a minor increase in the unit cell size. Cobalt and nickel have quite comparable lattice constants, measuring 3.54 Å and 3.52 Å, respectively [32,33]. Thus, their X-ray diffraction patterns are almost identical.
For Ni12Cu8/CNFs, typically, the pattern of Ni is observed as mentioned above with a characteristic peak of (JCPDS No. 04–0850); additionally, Cu is cleared and appears in characteristic peaks at 2θ values of 43.3° and 74.1° that correspond to the (111) and (220) planes (JCPDS No. 01-085-1326), which could be seen neighboring Ni-characteristic peaks that ensure a bimetallic Ni12Cu8 face center cubic composite. For all samples, sharp intensity peaks appear that demonstrate the crystallite structure of the prepared catalyst [34]. These findings suggest that the elemental metals entirely transformed from metal salt precursors.
The crystallite size (D) was calculated by the Scherer equation without strain as mentioned in Equation (S1). To determine the particle size, the characteristics of diffraction peaks were selected.
The surface area (SA) of a solid material is its total surface area divided by its mass, as calculated by Equation (S2). Adsorption, heterogeneous catalysis, and surface reactions all benefit from SA. It is impacted by the porosity, structure, and particle size of the material. Table 1 lists the crystallite size and surface area values.
As shown in Table 1, all samples exhibit crystallite sizes ranging from 23:30 nm, which could describe the large surface area of the catalyst that is used for electrooxidation reactions, as the smaller the crystallite size, the more the active surface area allows for interactions to occur. Ni12Cu8/CNFs shows a minimum crystallite size of ~23 nm, which is accepted with relative TEM images with a small difference as an agglomeration of particle size that appears in TEM images, while XRD measures the crystallite size.

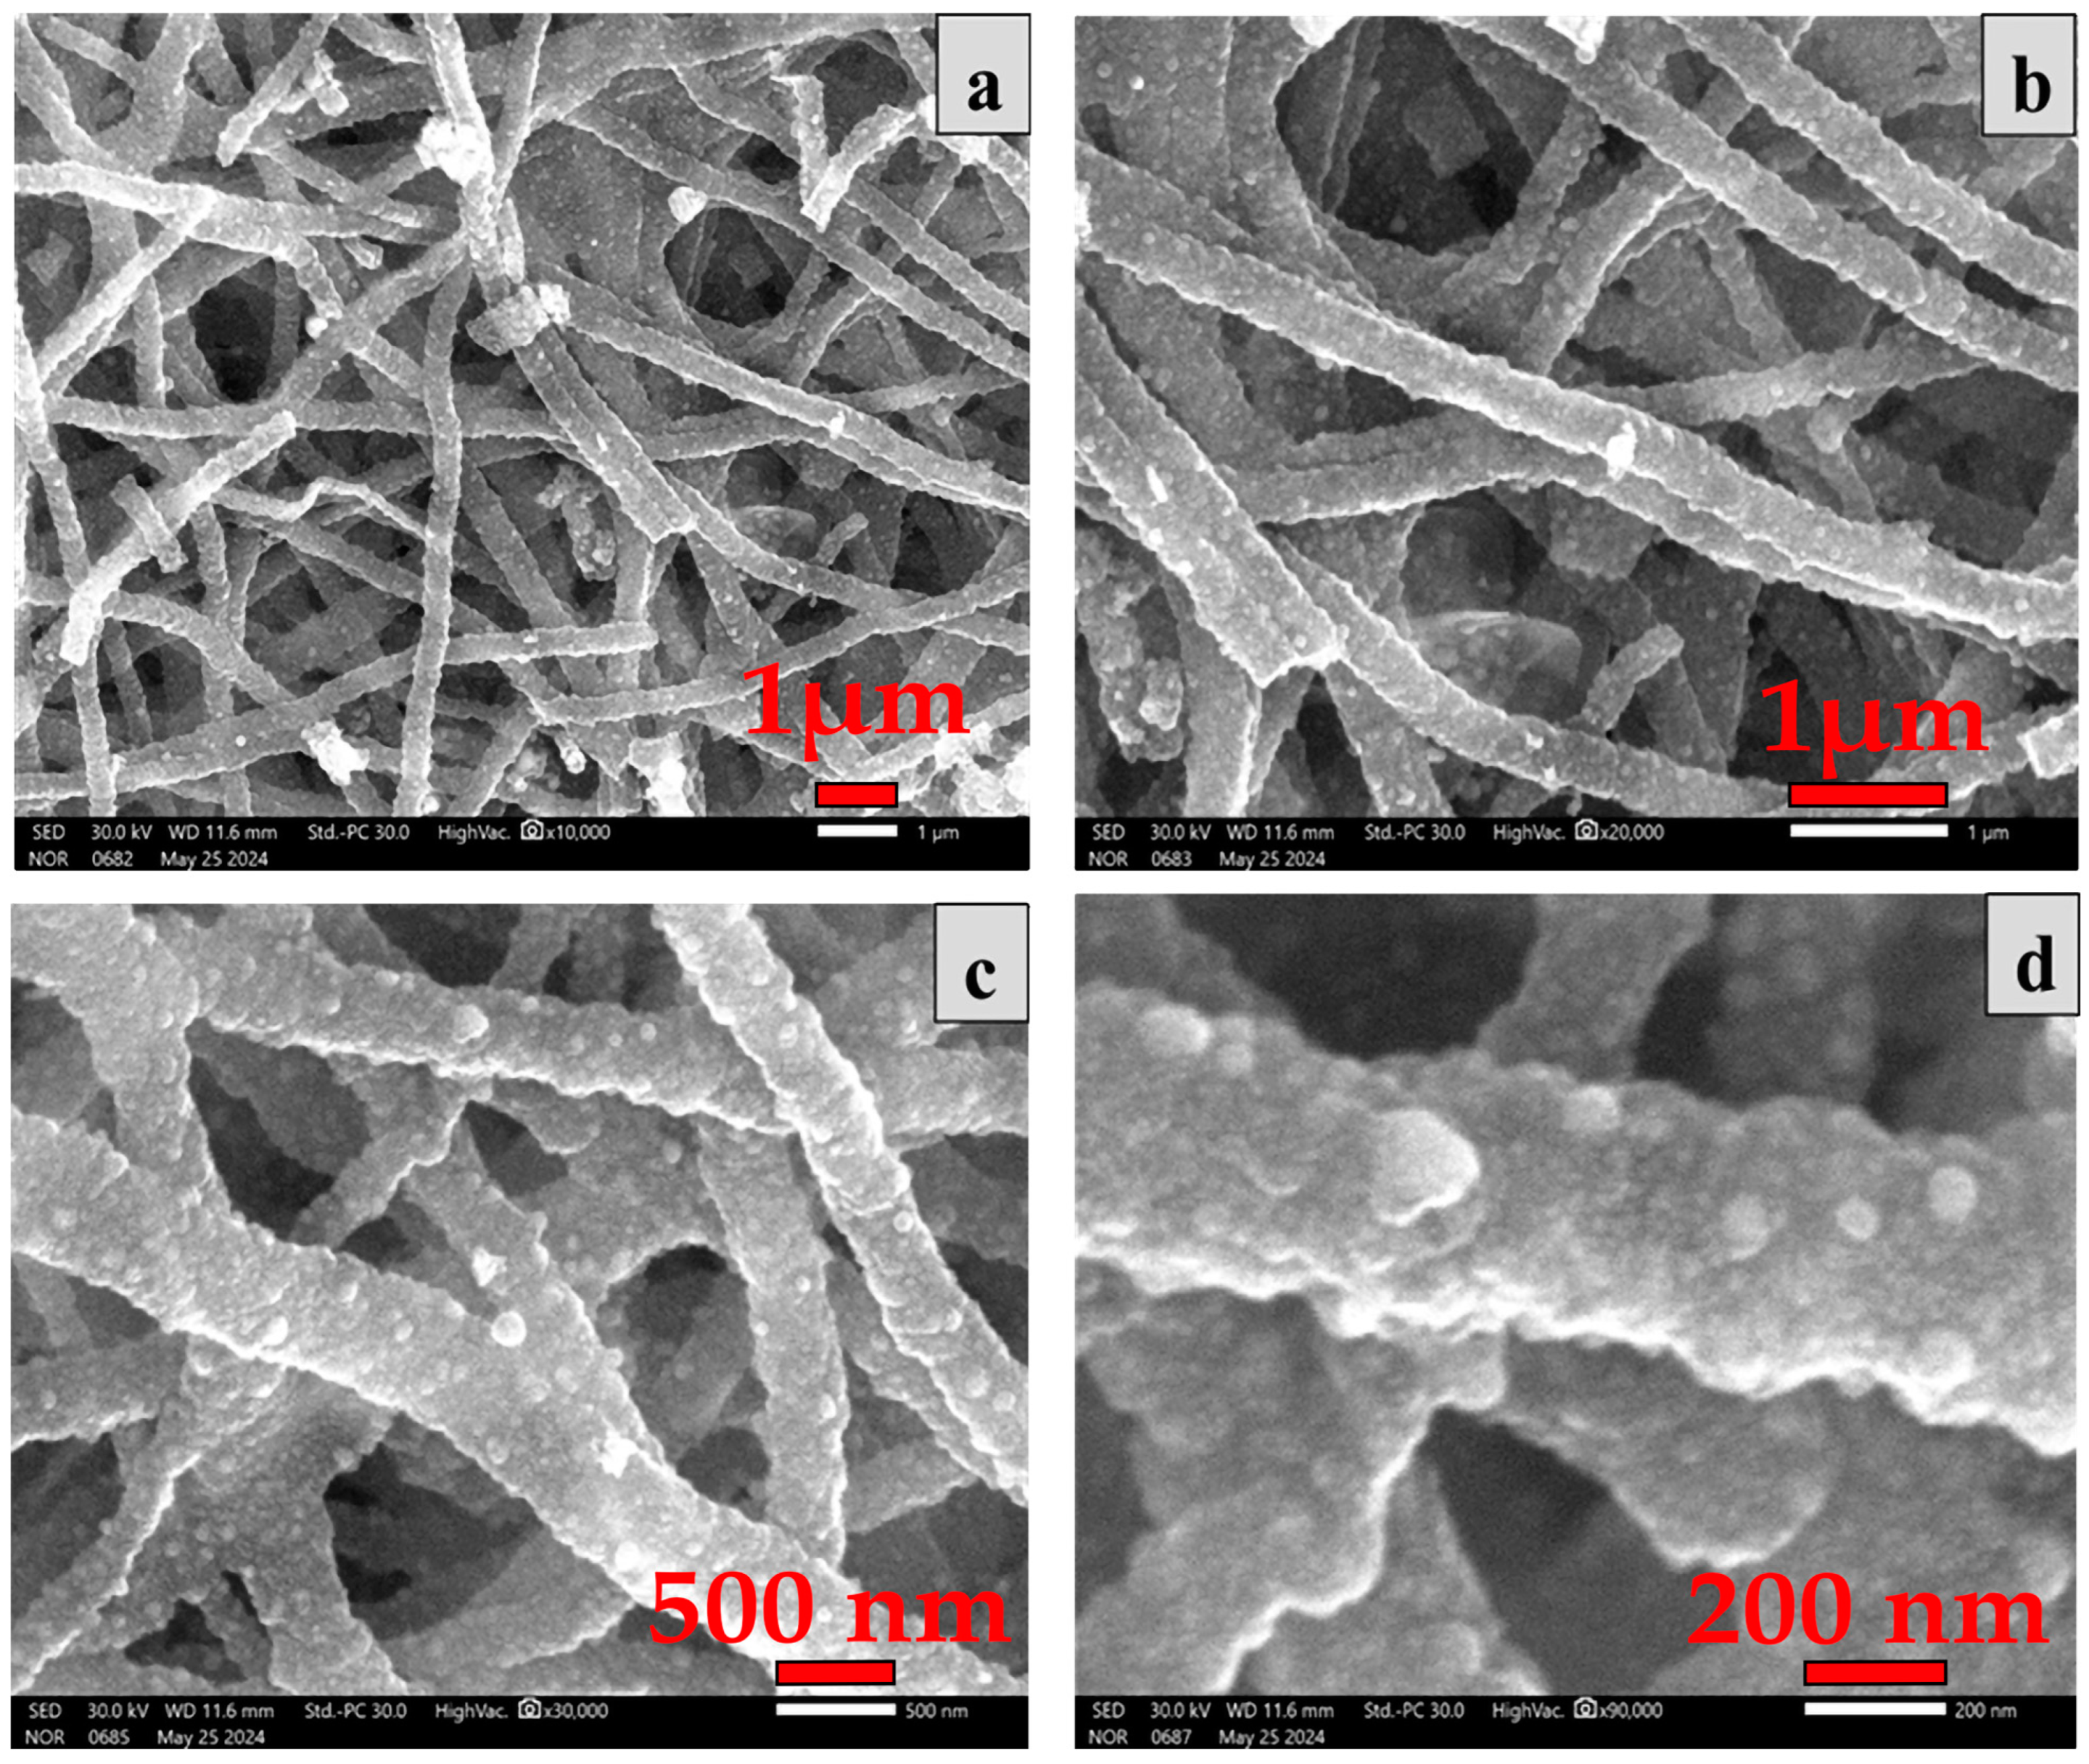
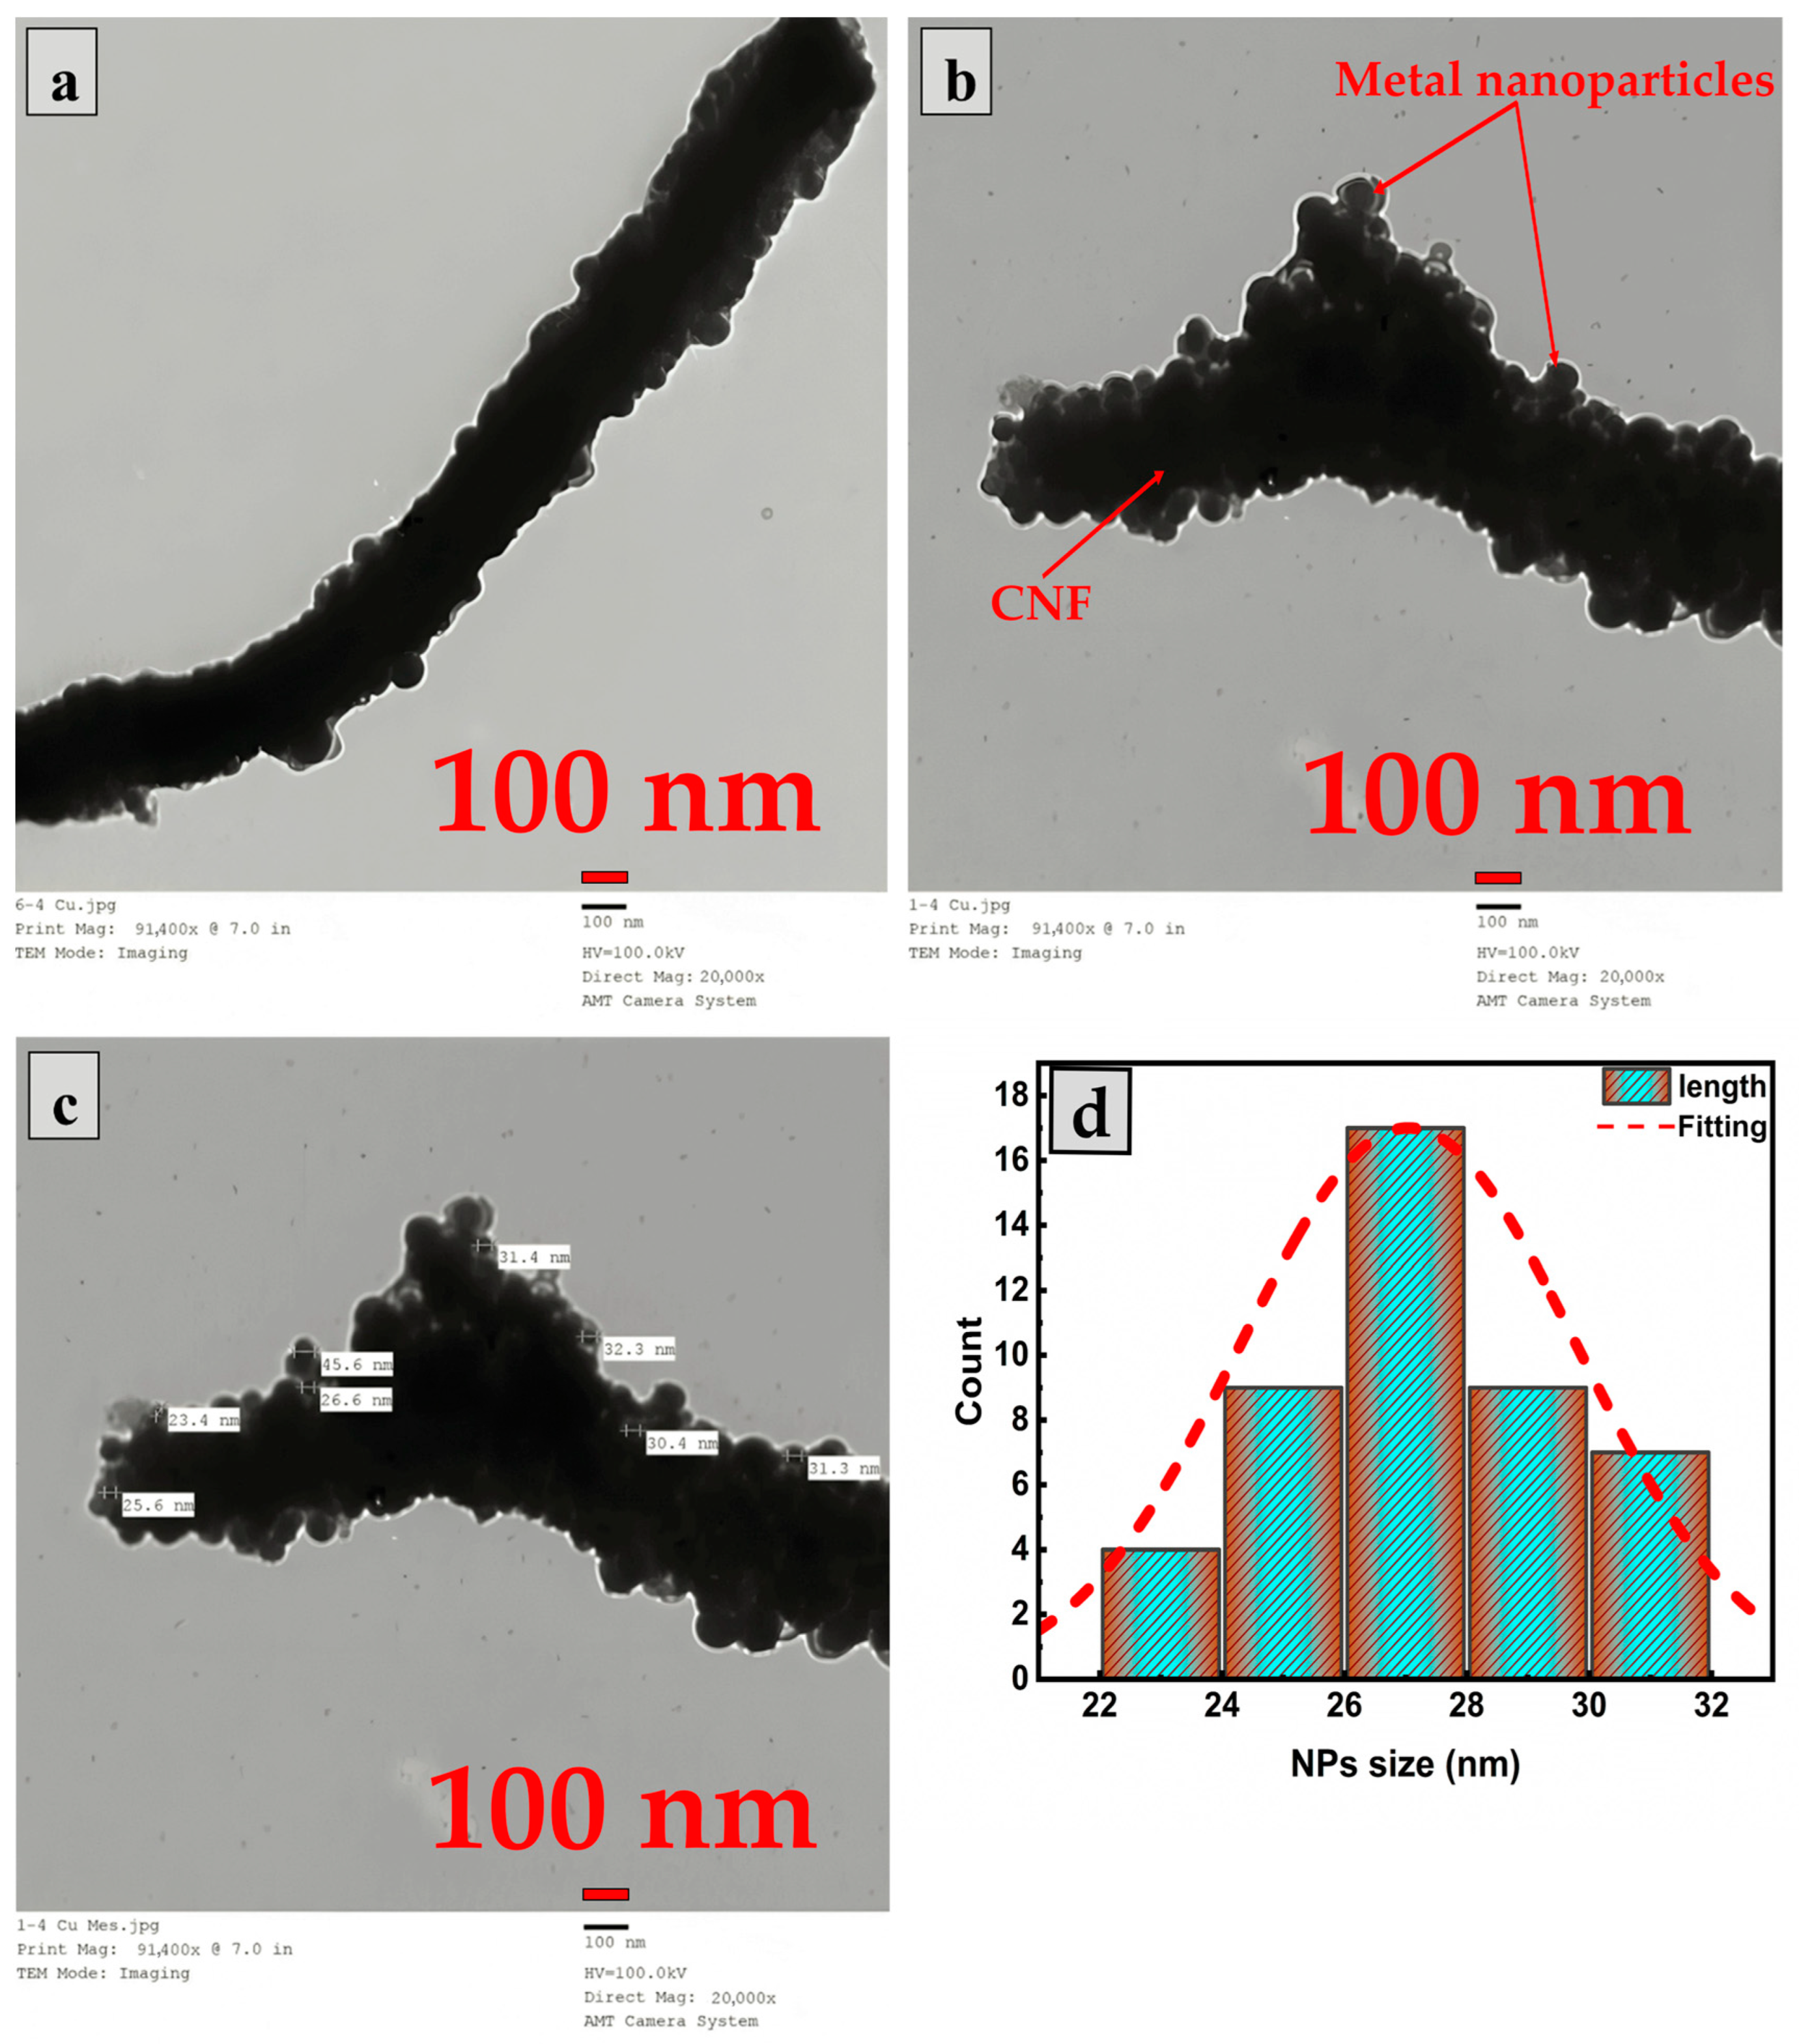
2.2. Morphological Study

Scanning electron microscopy was employed to examine the surface morphology of carbon nanofibers decorated with Ni12Cu8/CNF nanoparticles after carbonization (Figure 2a–d). The sample exhibiting the best electrochemical performance (discussed below) was imaged at various magnifications (10,000×, 30,000×, and 90,000×) with corresponding scales of 1 μm, 500 nm, and 200 nm, respectively. The SEM images reveal a cloudy, web-like structure characteristic of metal–carbon nanofibers, indicating the successful implementation of metal additives on the carbon support. This intricate morphology, evident in Figure 2a,b, is known for its high surface area and interconnected porous network, desirable properties for electrochemical applications. The images confirm the synthesis of electrospun nanofibers with a fine diameter and prove that the high calcination temperature does not significantly affect the fiber morphology.
Figure 2c,d reveal the distinctive morphology of Ni12Cu8/CNFs, showcasing smooth nanofibers with a uniform distribution and a clear, porous surface structure devoid of bead formation. The image highlights a complex, irregular structure attributed to metal additives’ random and homogeneous distribution within the carbon support. This distribution is expected to create numerous active sites for enhanced adsorption and interaction with reactant molecules, such as methanol. The observed variations in darkness and lightness within the image suggest differences in material composition, likely indicating the distribution of Ni and Cu nanoparticles throughout the carbon matrix. Analysis using ImageJ software version 1.54g determined the diameter of these metal-decorated carbon nanofibers to range from 250 to 400 nm, confirming their well-defined nanoscale structure. In contrast, the length of the nanofibers ranges from 2 µ to several microns (after calcination and blending) suggesting a greater surface area for reactions or interactions. This size range can significantly influence the material’s properties, including catalytic activity, energy storage capacity, and adsorption capabilities, depending on its intended application.
The resulting carbon nanofiber’s TEM images are shown in Figure 3a–c. The TEM technique allows for high-resolution imaging of the internal structure and composition of materials at the nanoscale. The images show the presence of elongated, one-dimensional carbon nanofibers. The dimensions of these nanoparticles can be estimated from the scale bar, which indicates a size range of approximately 20–35 nm, which is fully consistent with XRD. As revealed in the figure, Ni and Cu metallic nanoparticles have been deposited or anchored on the surface of the carbon nanofibers. The nanoparticles are relatively well distributed along the length of the carbon nanofibers, suggesting a good level of integration between the metal and the carbon support. The structure shown in the images can provide more room and active sites for redox reactions. The distribution of nanoparticle diameters is displayed in the inset of Figure 3d, which is approximately 27 nm.

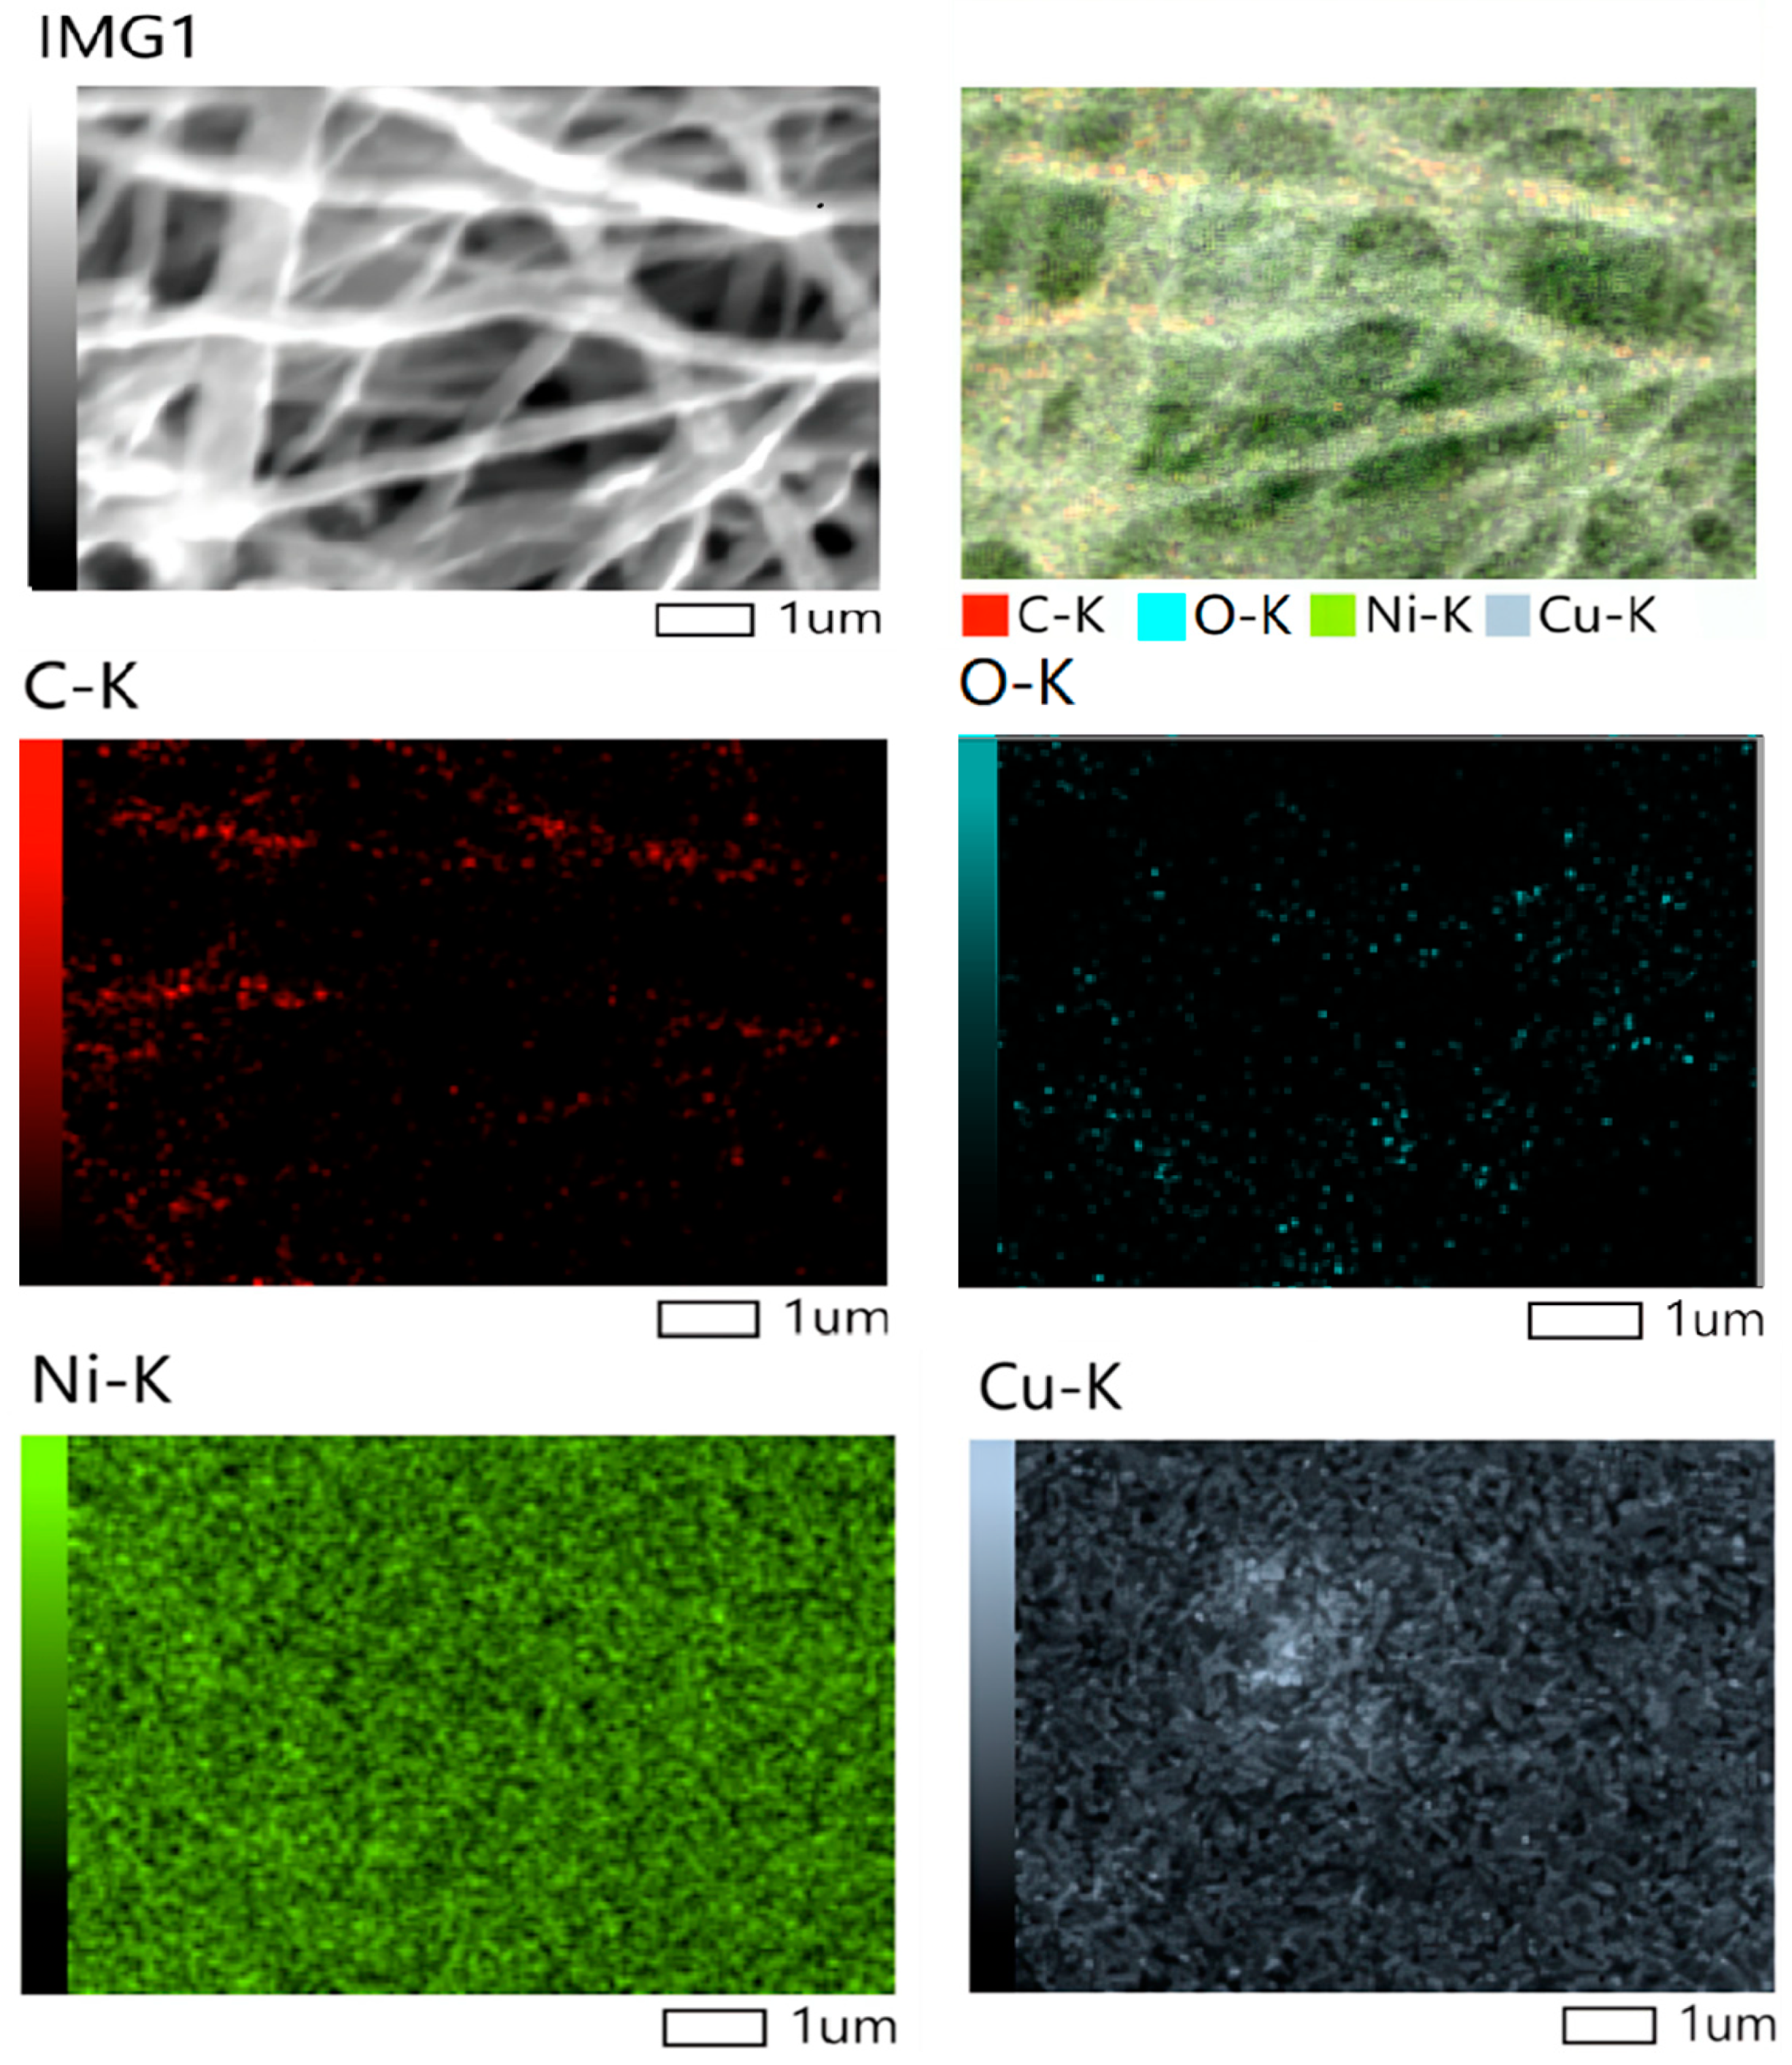
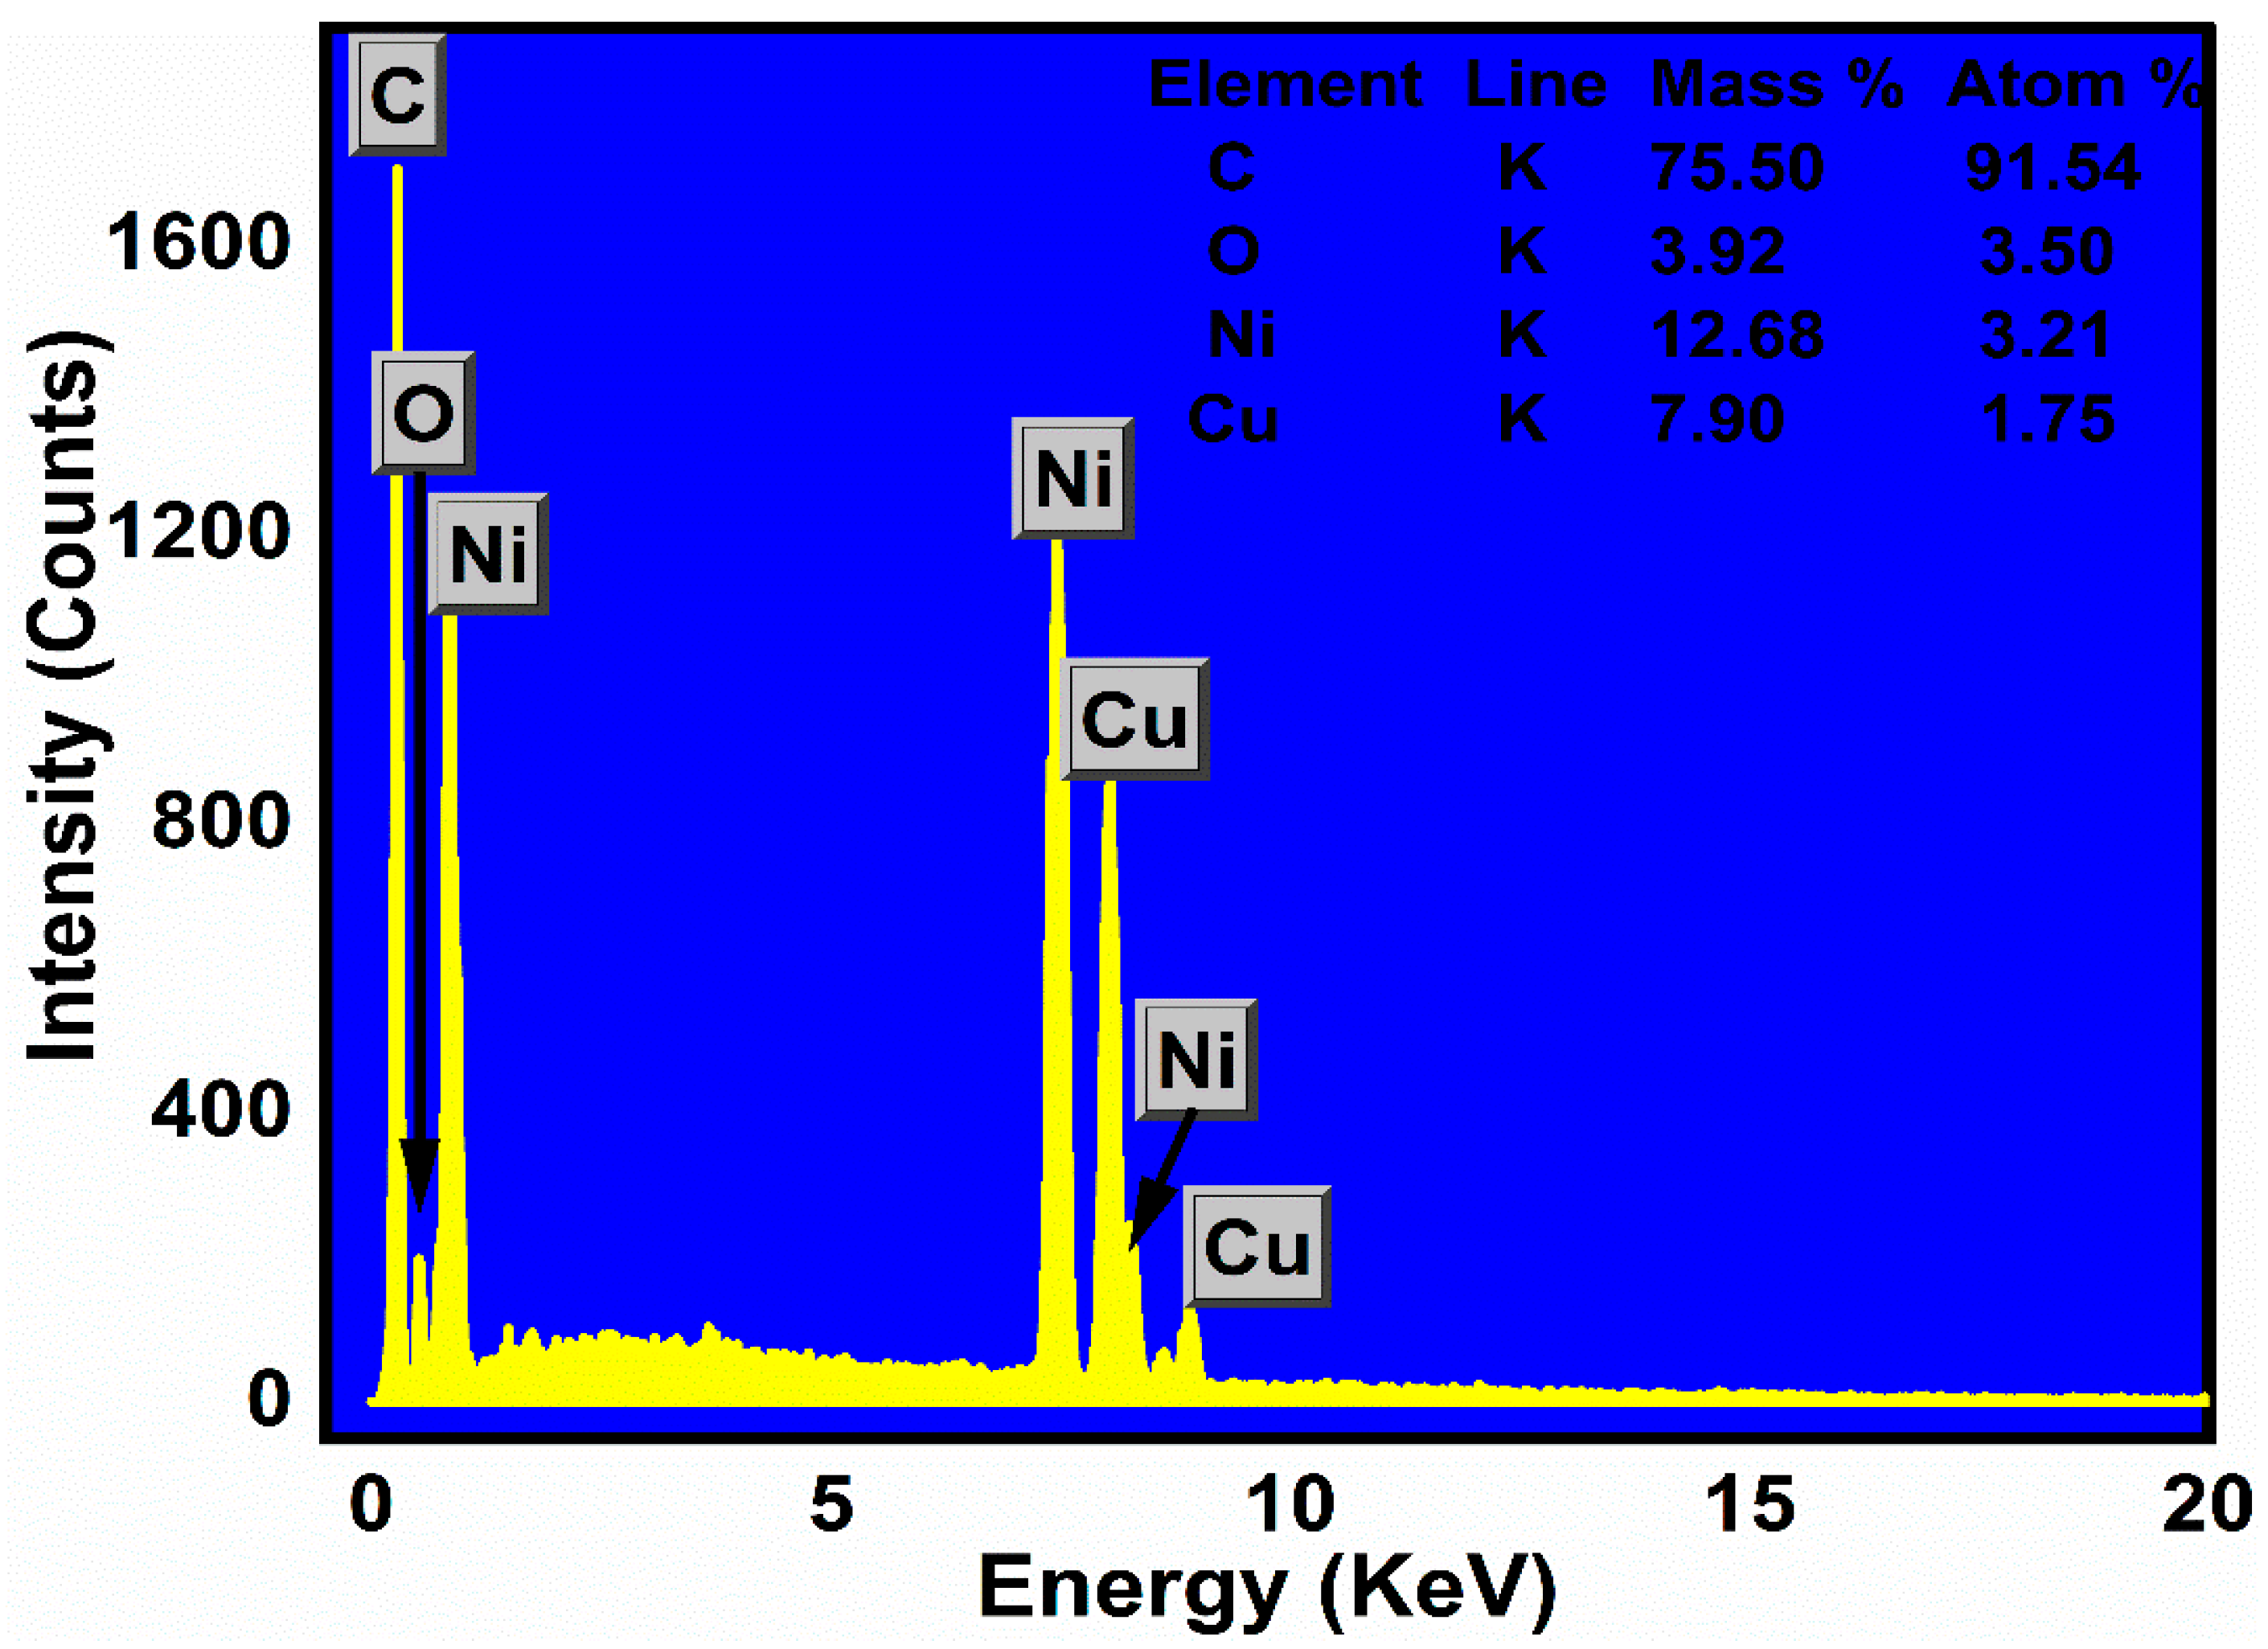
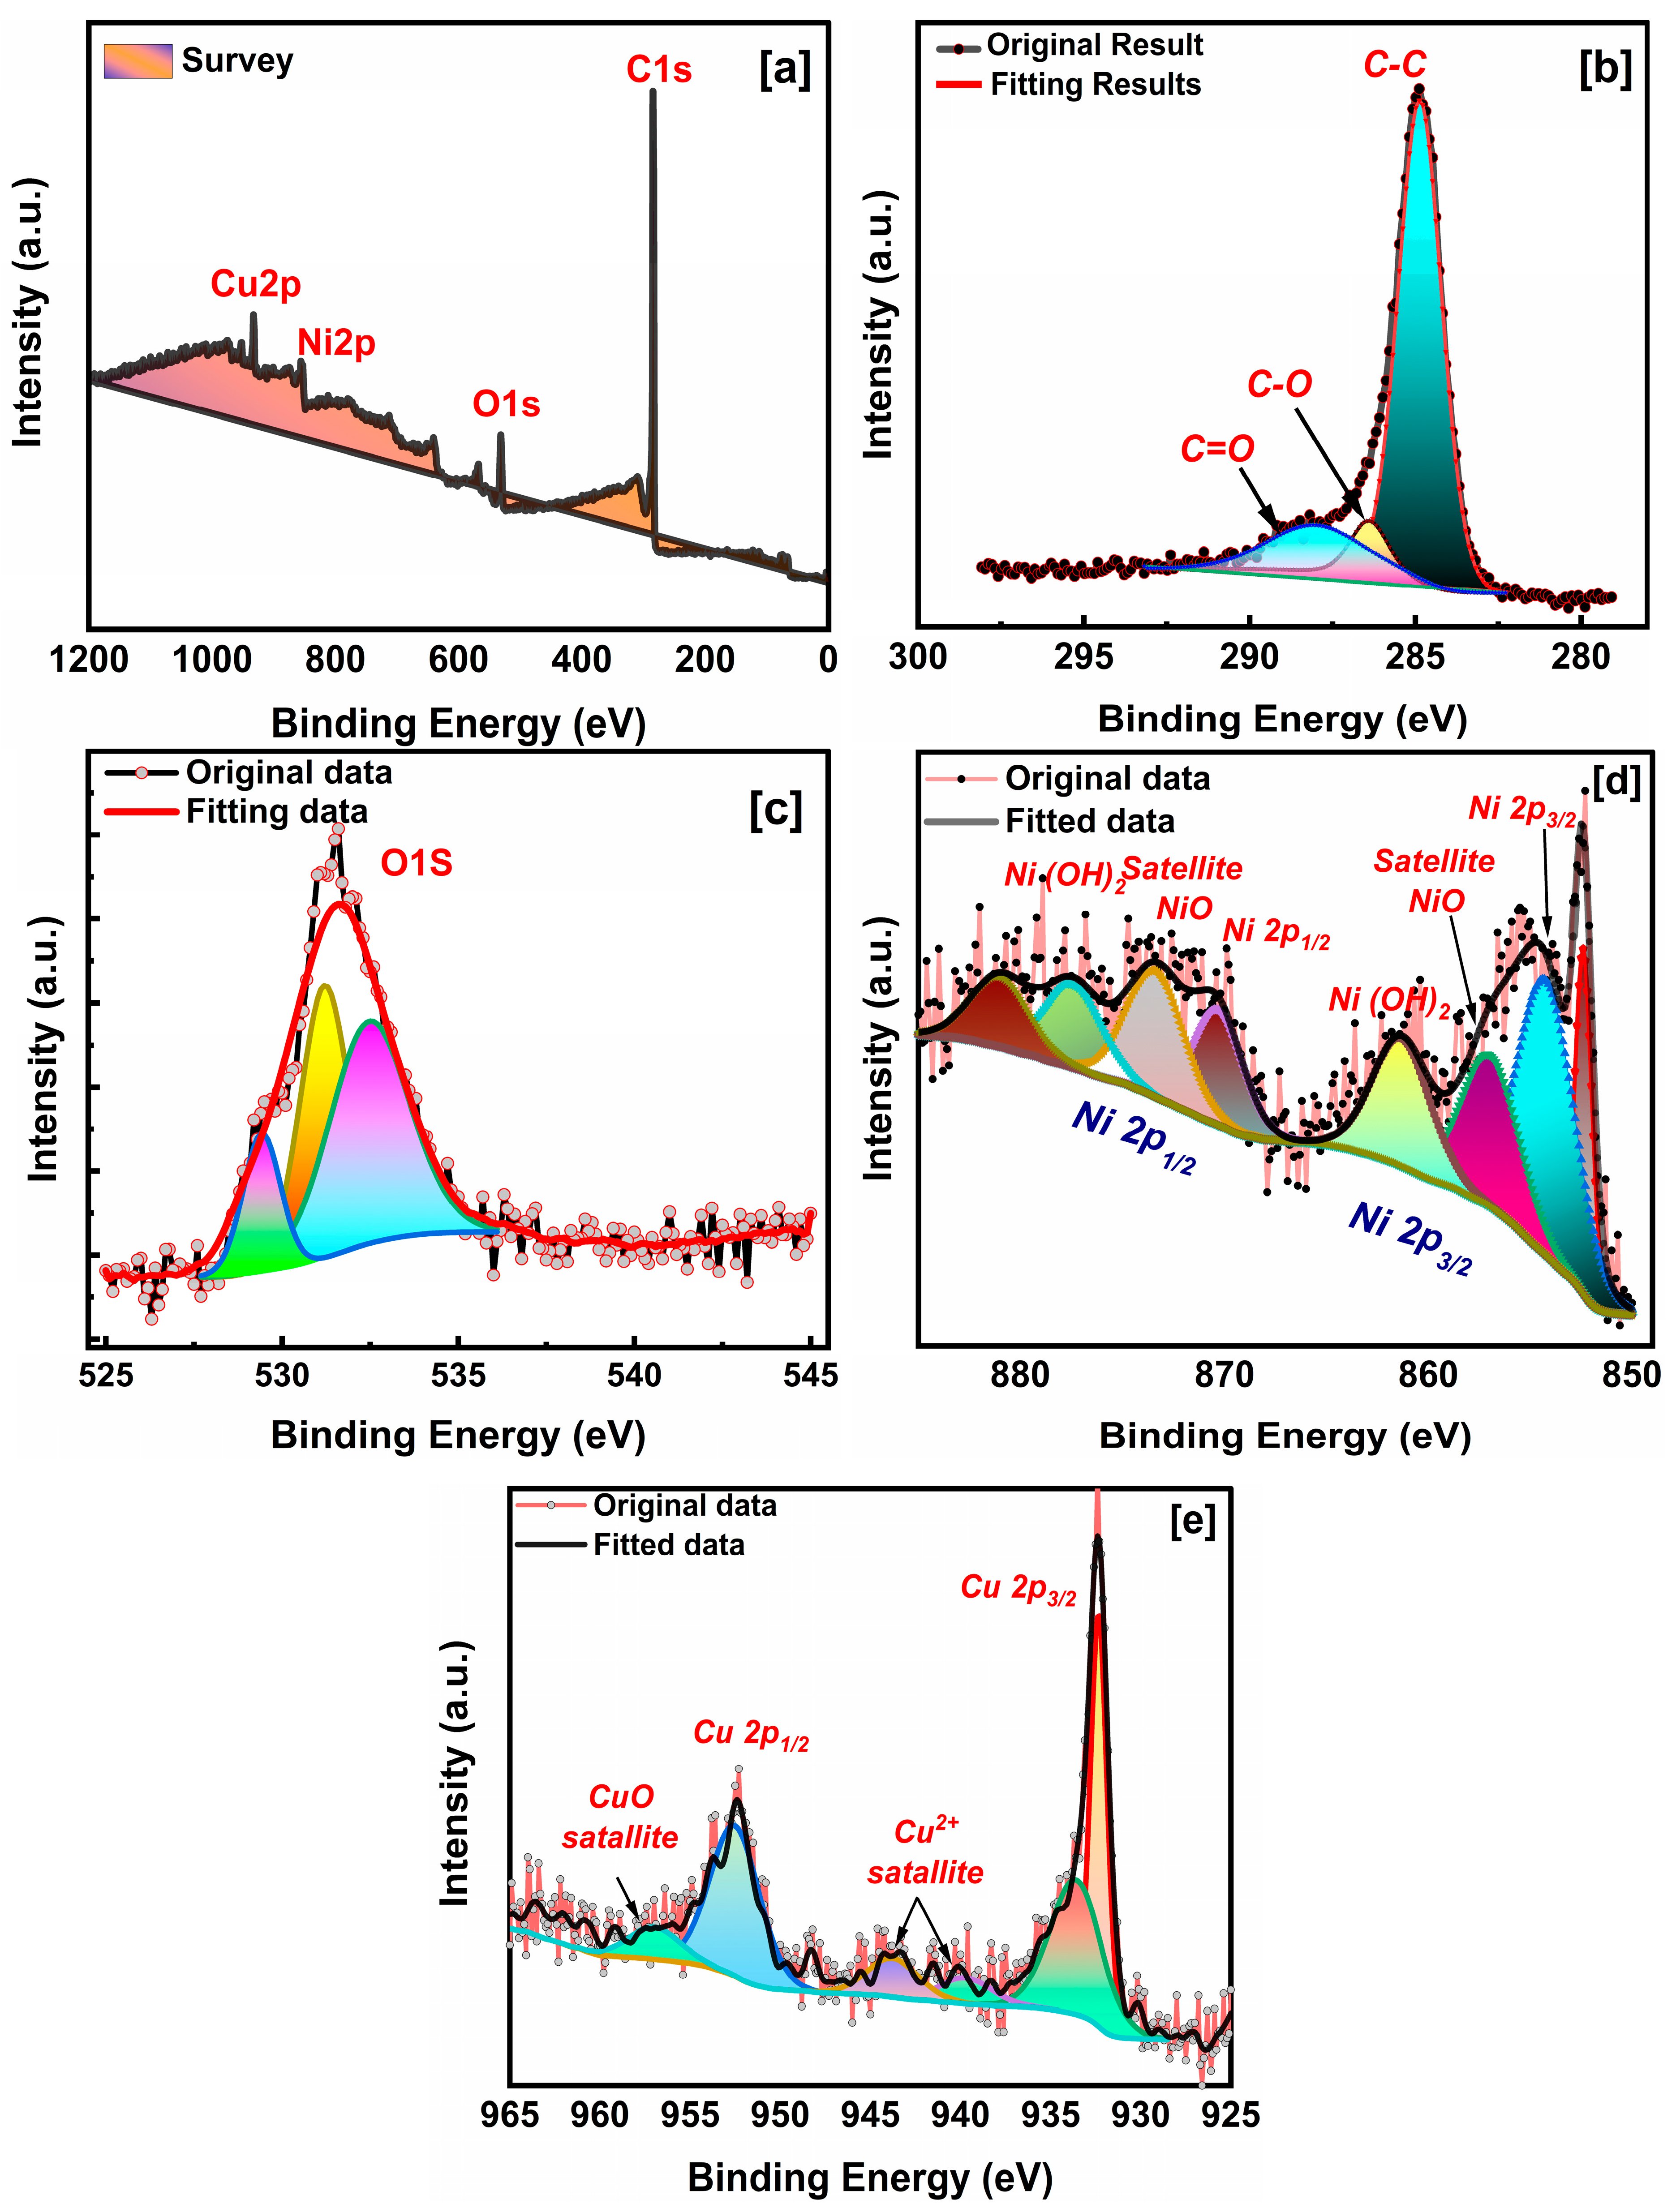
2.3. Elemental Analysis

This technique shows how particular elements are distributed spatially within a material. Figure 4 presents the SEM image and associated mapping analysis of the Ni12Cu8/CNFs, offering a thorough examination of the catalyst material. (IMG1) represents the area that was scanned to identify the components of the fibers. The optimal sample exhibited a dense and uniform distribution of carbon support. It was evenly and completely dispersed over the surface of the carbon nanofibers, as depicted in Figure 4.
A low percentage of O is observed, resulting from GO formation during calcination, that is acceptable with the XRD result. The figure illustrates how Ni, Cu, and rGO nanoparticles are fully and uniformly distributed across the surface of carbon nanofibers. Furthermore, the elemental mapping images and the X-ray results confirmed that the shining NPs were Ni, Cu, and C and that no additional foreign impurities were discovered.
The elemental maps show that the Ni12Cu8/CNF catalyst has a complex and heterogeneous composition, with the different elements distributed throughout the microstructure in a more complex manner. These data can provide significant new insights into the characteristics of the catalyst and the potential relationship between its morphology, composition, and catalytic activity, in addition to the structural details visible in the SEM and TEM images. The recommended preparation technique is believed to be a successful way to create carbon nanofibers decorated with metal nanoparticles after carbonization.
Energy dispersive X-ray spectroscopy (EDX) was conducted to analyze the metal content and distribution in the prepared catalyst after calcination. Figure 5 represents the EDX spectrum for a Ni-Cu sample and provides valuable information about the elemental composition of the material. The carbon support is the domain of the prepared sample with an actual mass percentage of 75.5% with a slight shift in theoretical ratio due to the calcination process. The metals ratios show that the Ni and Cu exist in the desired percentage of 128% wt., as the mass weight is 12.68 and 7.90% for Ni and Cu, respectively. A smaller peak around 0.53 keV suggests some oxygen presence (3.92 mass% and 3.5 atom%). This may come from rGO formation, which is confirmed by the XRD results.
X-ray photoelectron spectroscopy (XPS) is a quantitative spectroscopy technique that can assess the elemental composition, chemical states, and electronic states of the constituents within a material. The Ni12Cu8/NFs’ surface composition was further confirmed by XPS, as shown in Figure 6. A fast scan of XPS spectra presents the existence of C1s, Ni2p, and Cu2p at binding energies of 286.5, 854.2, and 930.4 eV, respectively, as shown in Figure 6a. The C (1s) XPS spectra of Ni12Cu8/CNFs exhibit a prominent peak at 285.6 eV, indicative of graphitic carbon as the dominant element as presented in Figure 6b. Additional subpeaks observed at 284.89 eV, 286.36 eV, and 288.24 eV correspond to C-C (sp3), C-O, and C=O bonding, respectively [35]. These subpeaks highlight carbon atoms’ diverse chemical bonding environments within the Ni12Cu8/CNFs catalyst.
A non-negotiable peak was observed at 533.8 eV for O1s. It could be deconvoluted in Figure 6c into three peaks, confirming metal carbonate species appearing at 532.4 eV [36]. In comparison, 531.1 and 529 eV are associated with metal hydroxide and metal oxide, respectively, proving the abundance of oxygen working group at the carbon surface forming the rGO layer with the agreement of XRD and EDX data.
The Ni 2p XPS spectrum in Figure 6d exhibits characteristic peaks at binding energies of 852.6 and 873.2 eV, which are attributed to the characteristic binding energies of Ni 2p3/2 and Ni 2p1/2 [37,38]. By deconvolution, more peaks appeared as metallic Ni (852.7 eV), NiO (854.9 eV), and Ni (OH)2 (857.3 eV) respectively. While peaks appearing at 870.2, 873.5, and 877.6 eV are suggested for Ni 2p1/2, NiO, and Ni (OH)2 satellites [39].
In Figure 6e, the main peaks of Cu are observed at around 932.4 eV (Cu 2p3/2) and 952 eV (Cu 2p1/2). The presence of satellite peaks at approximately 933 and 940 eV suggests the existence of Cu2+ species and from a shaking process brought on by Cu (II) open 3d9 shell [40,41]. Overall, the XPS analysis reveals a complex interplay of carbon, oxygen, nickel, and copper species, with specific binding energies that highlight the chemical states and the absence of any containments or residuals from synthesis, especially after calcination.

2.4. Electrochemistry Analysis

2.4.1. Effect of Electrolyte Concentration

The electrochemical behavior of the materials was investigated using cyclic voltammetry (CV). The potential was initially scanned from 0 to 0.80 V (anodic direction) and then reversed back to 0 V (cathodic direction). This process was repeated until no further changes were observed in the CV curves. Before the electrochemical measurements, all samples were activated in 1M KOH by cycling the potential for 50 cycles at a scan rate of 100 mV/s. This activation process ensured the optimal performance of the materials for methanol oxidation.
Methanol is typically oxidized with a prepared catalyst, as shown in Figure 7. CH3OH molecules first adsorb on the catalyst’s surface like nickel, cadmium, cobalt, and copper. The dehydrogenation of methanol, which produces formaldehyde (HCHO) and hydrogen gas (H2), comes next [42]. Depending on the conditions of the reaction, the formaldehyde can subsequently go through further oxidation to create either carbon dioxide (CO2) or formic acid (HCOOH). During this process, copper improves the oxidation of intermediates and stabilizes reaction products, while nickel mainly helps to activate and dehydrogenate methanol. Ultimately, the resultant products, which include water (H2O) and CO2, are absorbed from the catalyst surface, reactivating the active sites for more catalytic cycles [43,44].
The anodic current density values and the activity of the electrocatalyst are significantly impacted by changes in methanol concentrations. As a result, at optimum methanol content, the fuel cell can function effectively. Figure 8 shows the impact of varying methanol concentrations (1–3 M) on the corresponding current densities for every electrocatalyst, with a scan rate of 100 mV/s.
In Figure 8a, well-defined oxidation peaks are visible on the CV curves for the Ni/CNFs catalyst, indicating the catalytic activity for the oxidation of methanol. Higher methanol concentrations appear to improve the oxidation kinetics on the Ni/CNFs catalyst surface, as evidenced by the oxidation peak currents that increase steadily up to a limit concentration. It is possible that higher methanol concentrations aid in the activation and oxidation of methanol at the Ni/CNFs catalyst interface because of the positive shift in the onset potential of the oxidation peaks from 0.33 mV to 0.38 mV with increasing methanol concentration. It is also clear that the maximum current density increased from 19.7 mA/cm2 to more than double, 39.2 mA/cm2, for 1M and started to decrease slowly, using higher concentrations of methanol that was assigned for the limiting active surface area provided by mono metal alloy supported on CNFs. Using bimetallic alloy would increase the surface area consequently increasing the probability of active surface area existence, especially if the dopant metal is electrochemical active for methanol electrooxidation.
The oxidation peak currents of the Ni12Cd8/CNFs catalyst are substantially higher on the CV curves than those of the Ni/CNFs catalyst, particularly at the optimum concentration of 1M methanol. This suggests that increasing the catalytic activity and efficiency for methanol oxidation involves incorporating Cd into the Ni catalyst to form the Ni12Cd8 alloy. Moreover, the Ni12Cd8/CNF catalyst exhibits a positive shift in the oxidation peaks’ onset potential from 0.31 to 0.33 mV as methanol concentration rises, indicating enhanced methanol activation as maximum current density reaches 52 mA/cm2. The Ni12Cd8/CNF catalyst performs better than the Ni/CNFs; however, the negative effect of using higher concentration still exists using Cd additive metal.
Using Ni12Co8/CNFs not only enhanced the electrocatalytic activity compared with the two other composites but also offered a large surface area in agreement with XRD data for the fuel to be oxidized, especially when using higher concentrations of methanol and the saturation occurs at 3M of methanol. The unique oxidation peaks visible on the Ni12Co8/CNF catalyst’s CV curves indicate the catalyst’s activity in oxidizing methanol. Higher methanol concentrations improve the oxidation kinetics on the Ni12Co8/CNF catalyst surface, as evidenced by the oxidation peak currents that increase steadily from 34 to 101 mA/cm2 ranging from 0 M to 3 M of methanol. Ni and Co work synergistically to improve the adsorption and diffusion of reaction intermediates, improve charge transfer kinetics, and increase active site density, which is why Ni12Co8/CNFs exhibit better than the previous bimetallic alloy [29,45].
In Ni12Cu8/CNFs, a distinct and highest peak in the methanol oxide process was observed. The current density increased dramatically to 153 mA/cm2 by using 1M of methanol attributed to the largest surface area among all prepared binary catalysts according to our calculations. The superior catalytic activity could also be explained by the uniform distribution of bimetallic nanoparticles at CNFs as seen in TEM images providing active surface area for the complicated multistep of adsorption and dehydrogenation of methanol to produce carbon dioxide (CO2), water, and extra electrons [46]. In the presence of various methanol concentrations, Ni12Cu8/CNFs generated a strong current that was like the onset potential of NiOOH formation. During methanol catalysis, CuOOH was preferentially formed on the surface of nanoparticles, which promoted the production of NiOOH to catalyze the oxidation of methanol [47]. In terms of the electrooxidation of methanol, when the concentration of methanol increases above 1 M, the oxidation peak current density shows a decreasing trend. By increasing the methanol concentration higher than 1 M, many of the active sites on the electrocatalyst surface are occupied by the oxidation products of methanol. This increases the electrocatalyst’s poising extent and inhibits reactant diffusion into the electrocatalyst surface, which may cause a decrease in current density [29]. All the prepared bimetallic catalysts showed an intrinsic oxidation behavior to methanol oxidation using different methanol concentrations, especially Ni12Cu8/CNFs exhibiting awesome catalytic behavior through raising mass transport, supplying more active sites, strengthening electron transfer, elevating stability, and producing an additive impact.
Figure 9a compares the four prepared samples using different concentrations of methanol ranging from 1 to 3 M with the output performance current density. The oxidation behavior increases as the methanol concentration increases to 1 M and starts to decrease as the active surface area decreases; except for Ni12Co8/CNFs, the oxidation increases as the concentration rises, as Co provides an acceptable surface area for electrooxidation but with limited catalytic activity. Significantly, the electrospinning technique improves the catalytic performance for all samples via several important routes. Initially, the polymer (PVA) with 10% wt. concentration provided fine carbon nanofiber with uniform size and low or no beads. After calcination, the polymer transformed into a substantial carbon support enriched with the desired metal nanoparticles, which improved the activity of methanol electrooxidation. The optimized polymer concentration, flow rate, and high voltage as operating parameters support a high surface area-to-volume ratio for nanofibers increasing the number of active sites available for catalytic processes. Figure 9b explains the electrocatalytic activity for the different prepared samples using 1 M methanol + 1 M KOH as medium and 100 mV/s. Ni12Cu8/CNFs have the lowest onset potential, which is preferable for catalyst activation, making it the more promising candidate for efficient direct methanol fuel cell applications.

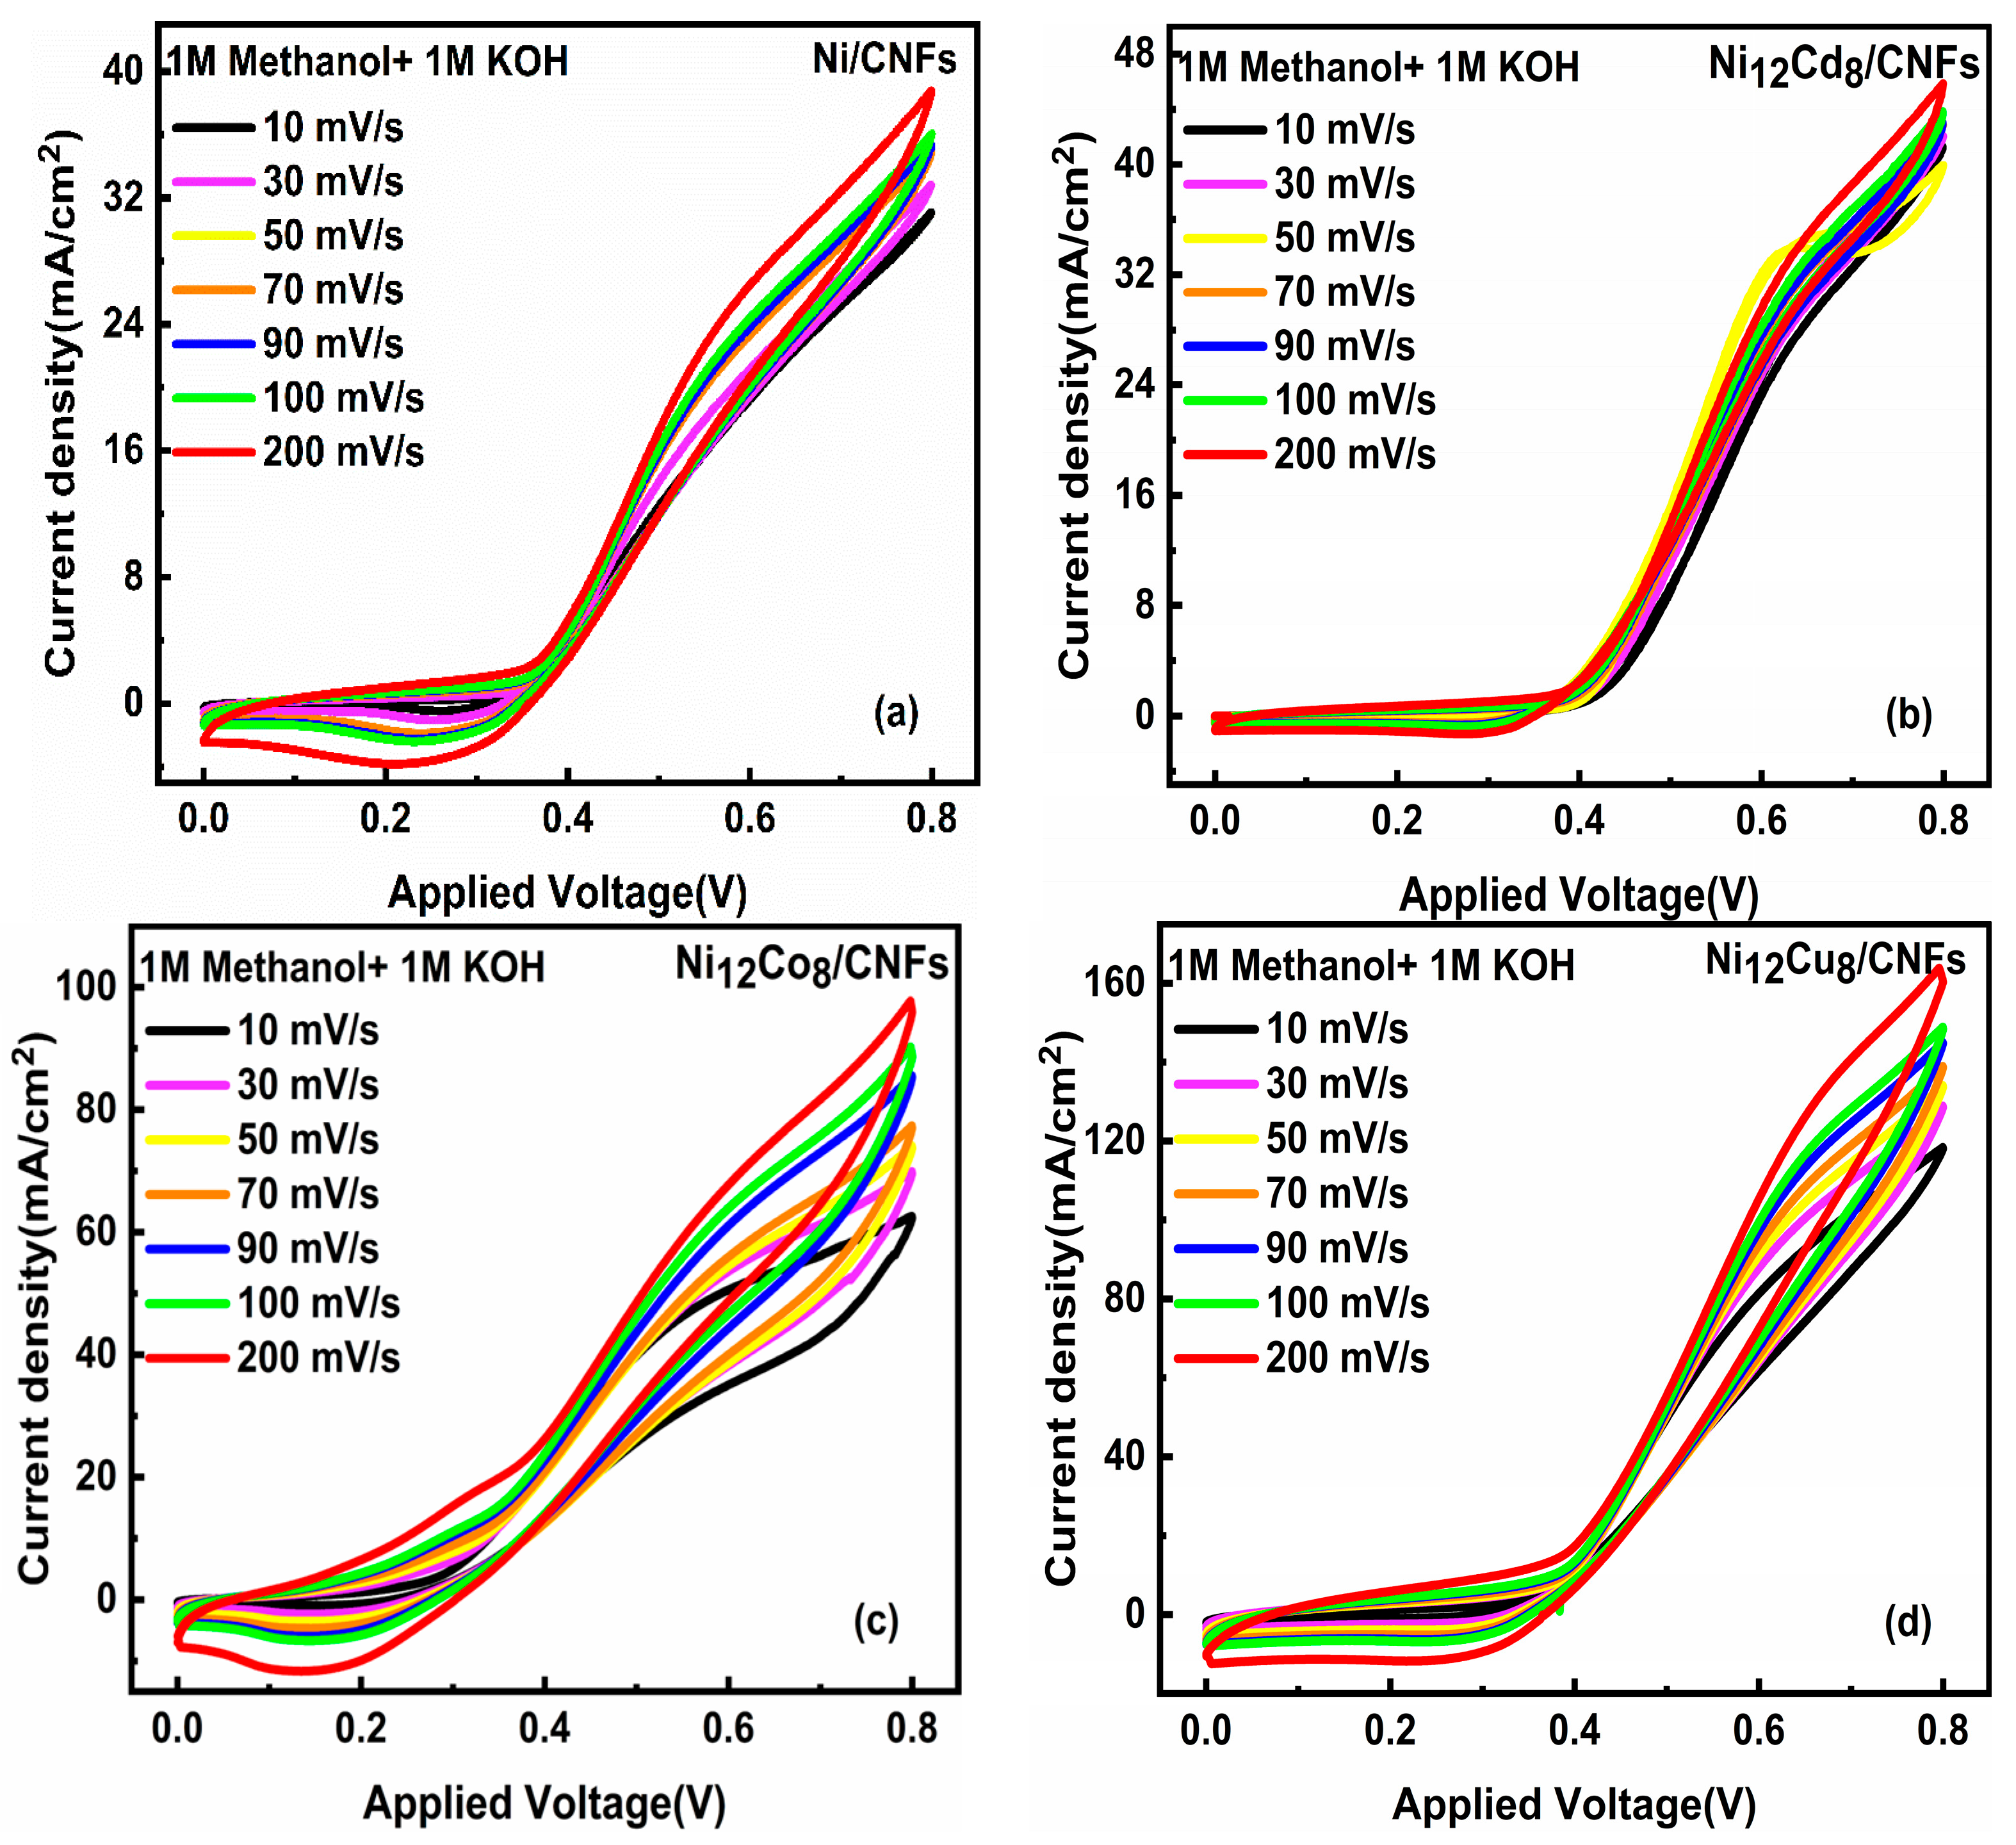
2.4.2. Effect of Scan Rate

The speed at which the applied potential changes during cyclic voltammetry, referred to scan rate, plays an essential role. A higher scan rate results in a thinner diffusion layer around the electrode, often causing an uptick in the observed current. To examine the oxidation of methanol using the four samples, different scan rates ranging from 10 to 200 mV/s were utilized. This variety of scan rates aids in determining whether the system’s redox behavior is influenced more by diffusion or adsorption processes. The process is primarily diffusion-controlled if the current response is exactly proportional to the square root of the scan rate. On the other hand, if the current changes in proportion to the scan rate, adsorption is probably in charge of the process. Furthermore, it is shown how potential affects the capacity to distinguish between reversible and irreversible processes (fast and slow electron transfer). Different scan rates for the four prepared samples using 1 M methanol + 1 M KOH are displayed in Figure 10. The current densities increased for all samples in 1 M methanol as the scanning rate increased to 200 mV. This trend can be explained by the fact that as the scan rate increased, more ions reached the electrode surface because of an increase in reaction kinetics, which led to high current density. The rate of diffusion exceeds the response rate at higher scan rates. As a result, fewer ions participate in the charge transfer process, but more electrolytic ions reach the electrode–electrolyte interfaces; subsequently, 100 mV/s is the ideal scanning rate.
The rate of reaction can be shown to be diffusion-controlled by the square root of the scan rate when it has a linear relationship with the anodic peak current density, as demonstrated in Figure 11a. The peak current is linearly proportional to the square root of the scan rate, as stated by the Randles–Sevcik relation [48]. An understanding of a system’s electrochemical kinetics can be gained from examining the relationship between anodic peak potential and log scan rate. Figure 11b describes reversible electrochemical systems: the anodic peak potential rises roughly in a linear pathway with the logarithm of the scan rate (log V), as the electron transfer kinetics are fast compared to the mass transfer processes. These indicate that a combination of diffusion and kinetic constraints governs the electrooxidation of methanol on our catalysts.

2.4.3. Linear Sweep Voltammetry

Linear sweep voltammetry (LSV) offers a more direct and sometimes less complicated method for examining the kinetics and mechanisms of electrochemical reactions, while still permitting quantitative examination and redox process identification. Ni12Cu8/CNFs exhibit excellent behavior in methanol electrooxidation, as shown in Figure 12a, where the maximum current density reaches 152 mA/cm2. The variations in the LSV curves reflect the different catalytic activities of the nickel-based materials, which are caused by the catalysts’ surface characteristics, composition, and structure. Based on the data presented, it seems that the Ni12Cu8/CNFs have favorable catalytic properties and serve as an attractive and effective electrocatalyst for methanol oxidation compared with the reported result in Table S1.
The relationship between a system’s overpotential and current density is characterized by a measurement called the Tafel slope. It can be calculated by using the linear sweep voltammetry (LSV) data to fit a straight line to the Tafel portion of the polarization curve. The Tafel plot can be used to determine the overpotential required to drive the methanol oxidation reaction to a desired current density.
The overpotential, or the difference between the applied potential and the equilibrium potential, represents the additional potential needed to cross the activation barrier of the reaction. Reducing the overpotential is necessary to increase the efficiency of the methanol oxidation process. The Tafel plots for all prepared samples at the ideal methanol concentration are shown in Figure 12b. According to Tafel plots, Table 2 displays the slopes of the samples that indicate that Ni12Cu8/CNFs have higher catalytic activity and a lower potential required for the electrooxidation of methanol.

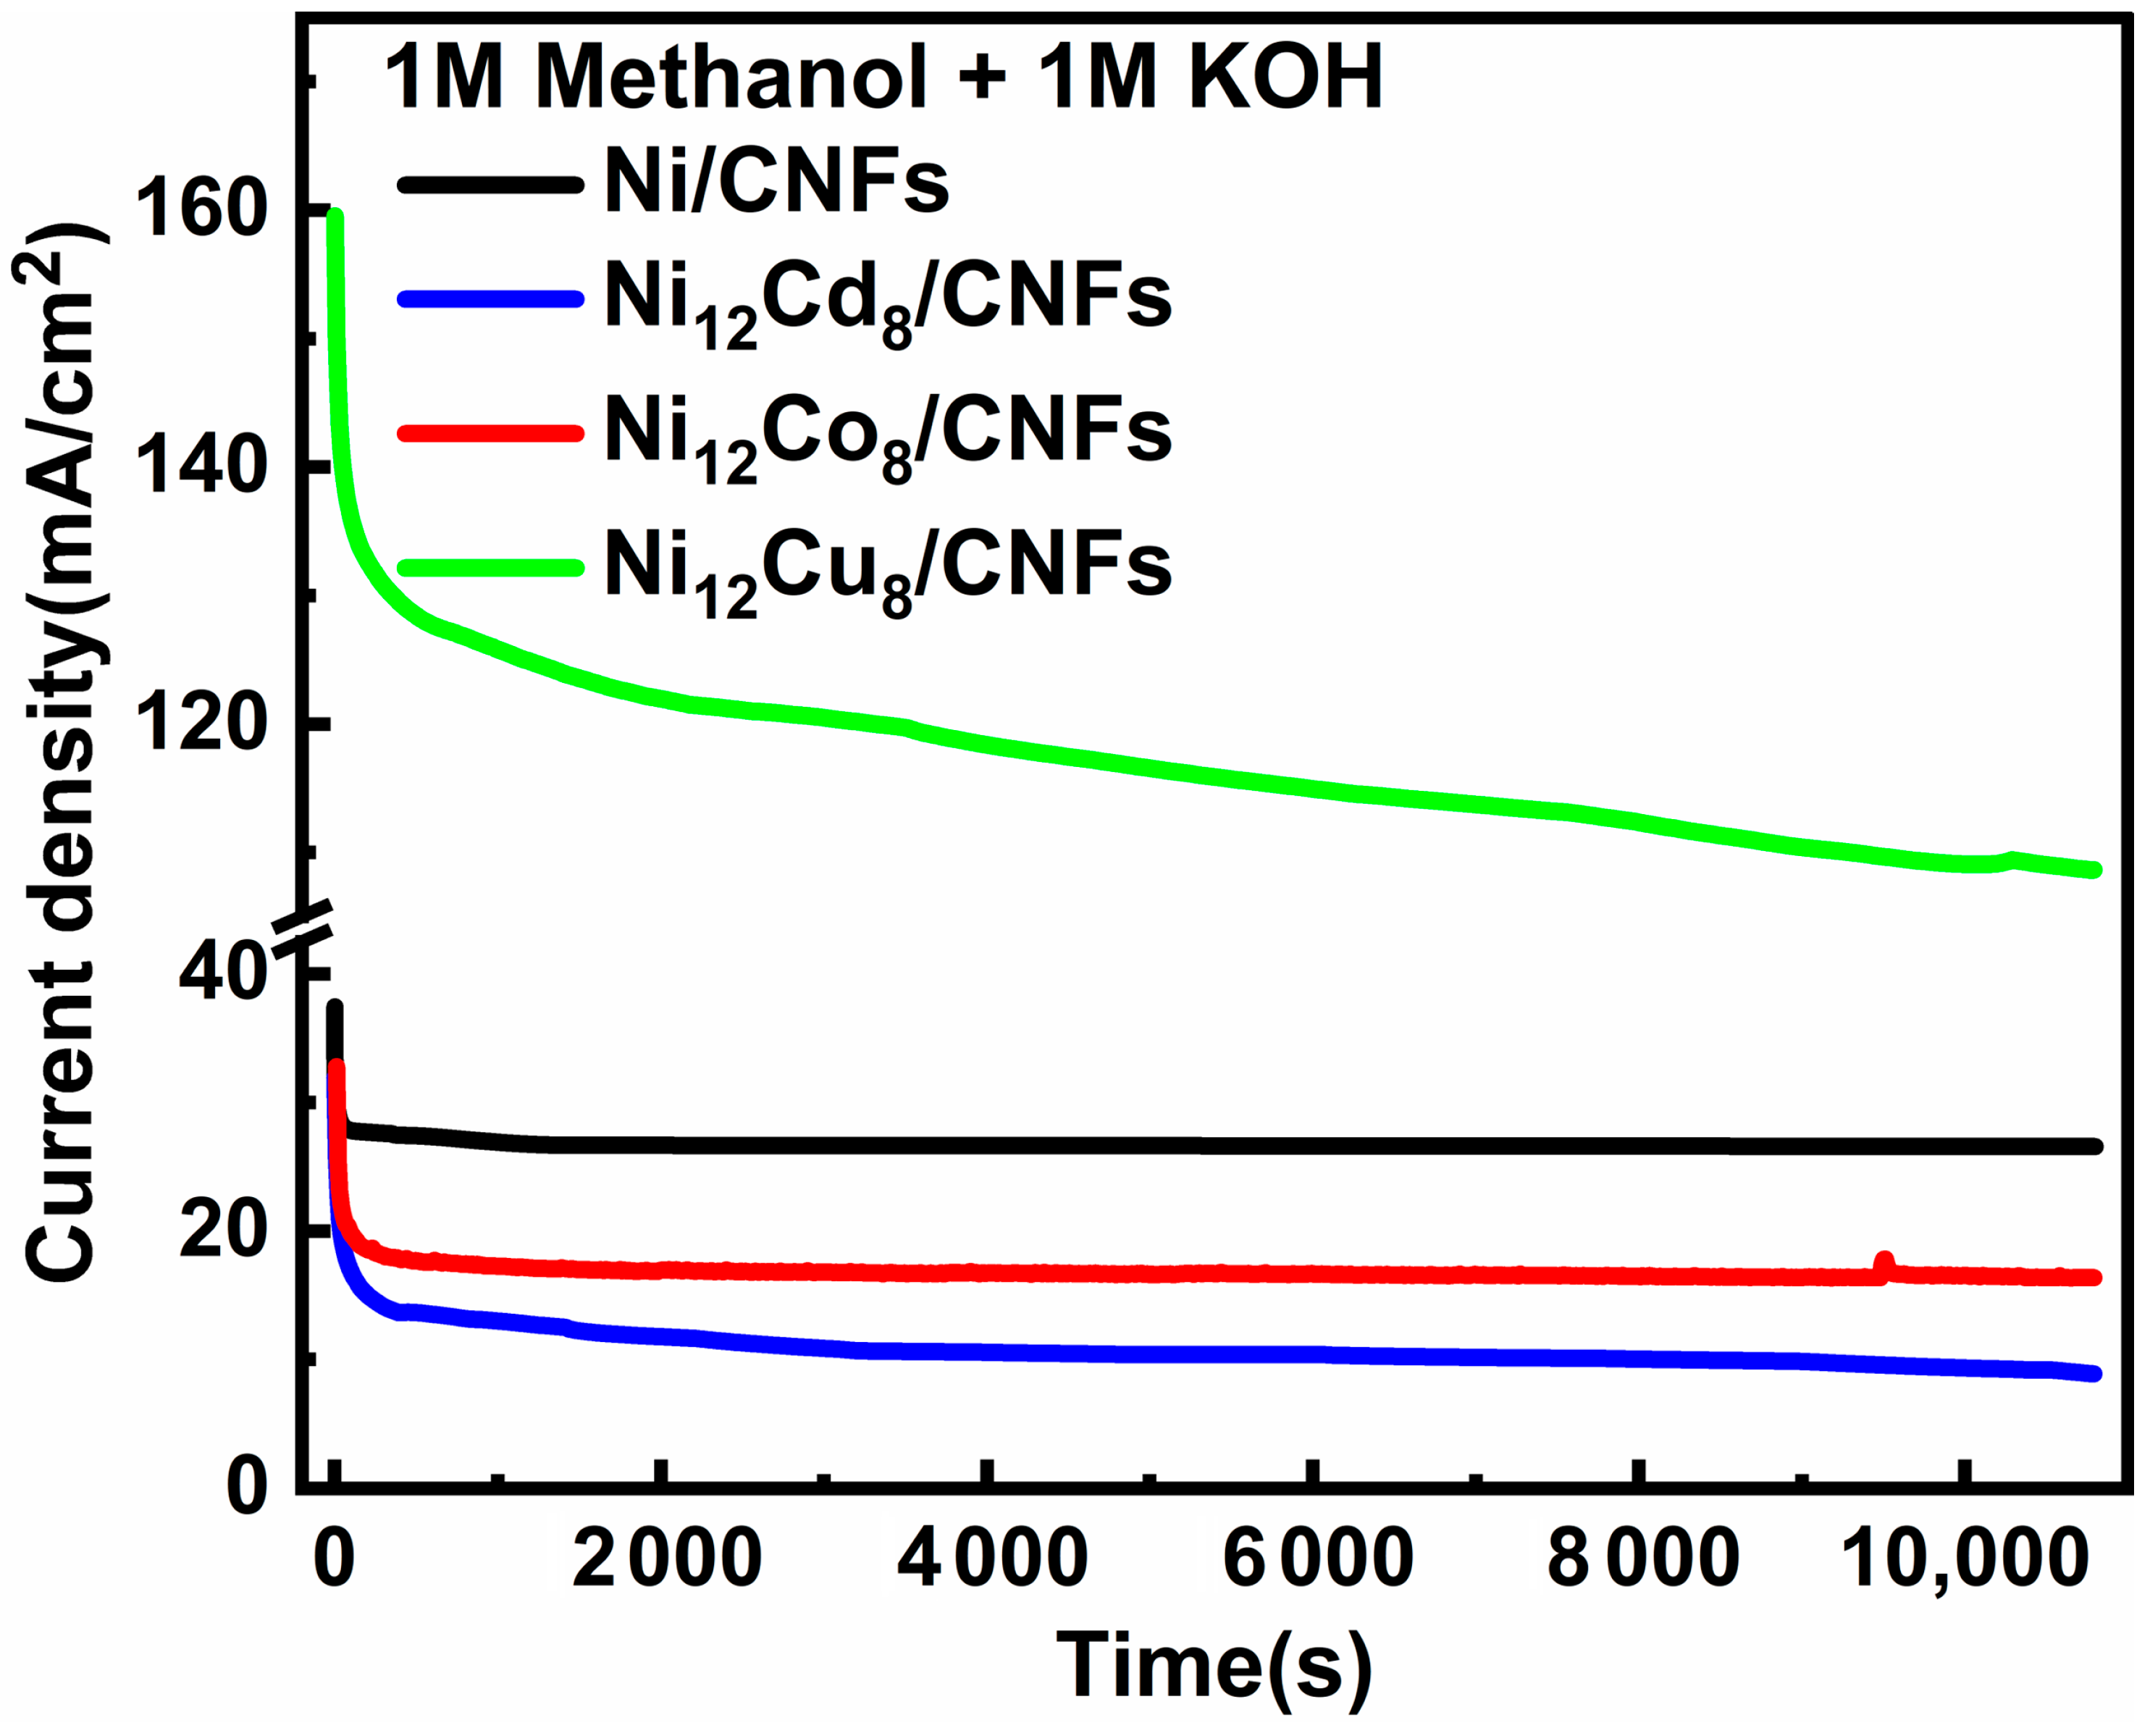
2.4.4. Chronoamperometry

The chronoamperometric current density measurements over time for the oxidation of methanol at the ideal concentration are displayed in Figure 13. The current density for the oxidation of methanol starts high and decreases considerably more slowly. The longer-term decline in current density suggests that the Ni12Co8/CNF catalyst has more stability and sustained catalytic activity towards methanol oxidation. The longer-lasting current density during the experiment implies that the methanol oxidation process of this material has more favorable kinetics or is less susceptible to catalyst deactivation.
On the other hand, the methanol oxidation using Ni12Cu8/CNFs starts with a relatively high initial current density and progressively drops. This indicates that although the Ni12Cu8/CNF catalyst has a high initial activity for oxidizing methanol, its efficiency quickly deteriorates. One possible explanation for the abrupt drop-in output rate that occurs at the beginning before it stabilizes is a trace amount of corrosion activity across the electrode–redox electrolyte interface, as reported in [49]. These data can provide valuable insights into promising Ni12Cu8/CNF catalyst performance and potential applications, such as in direct methanol fuel cells or other electrochemical energy conversion technologies.

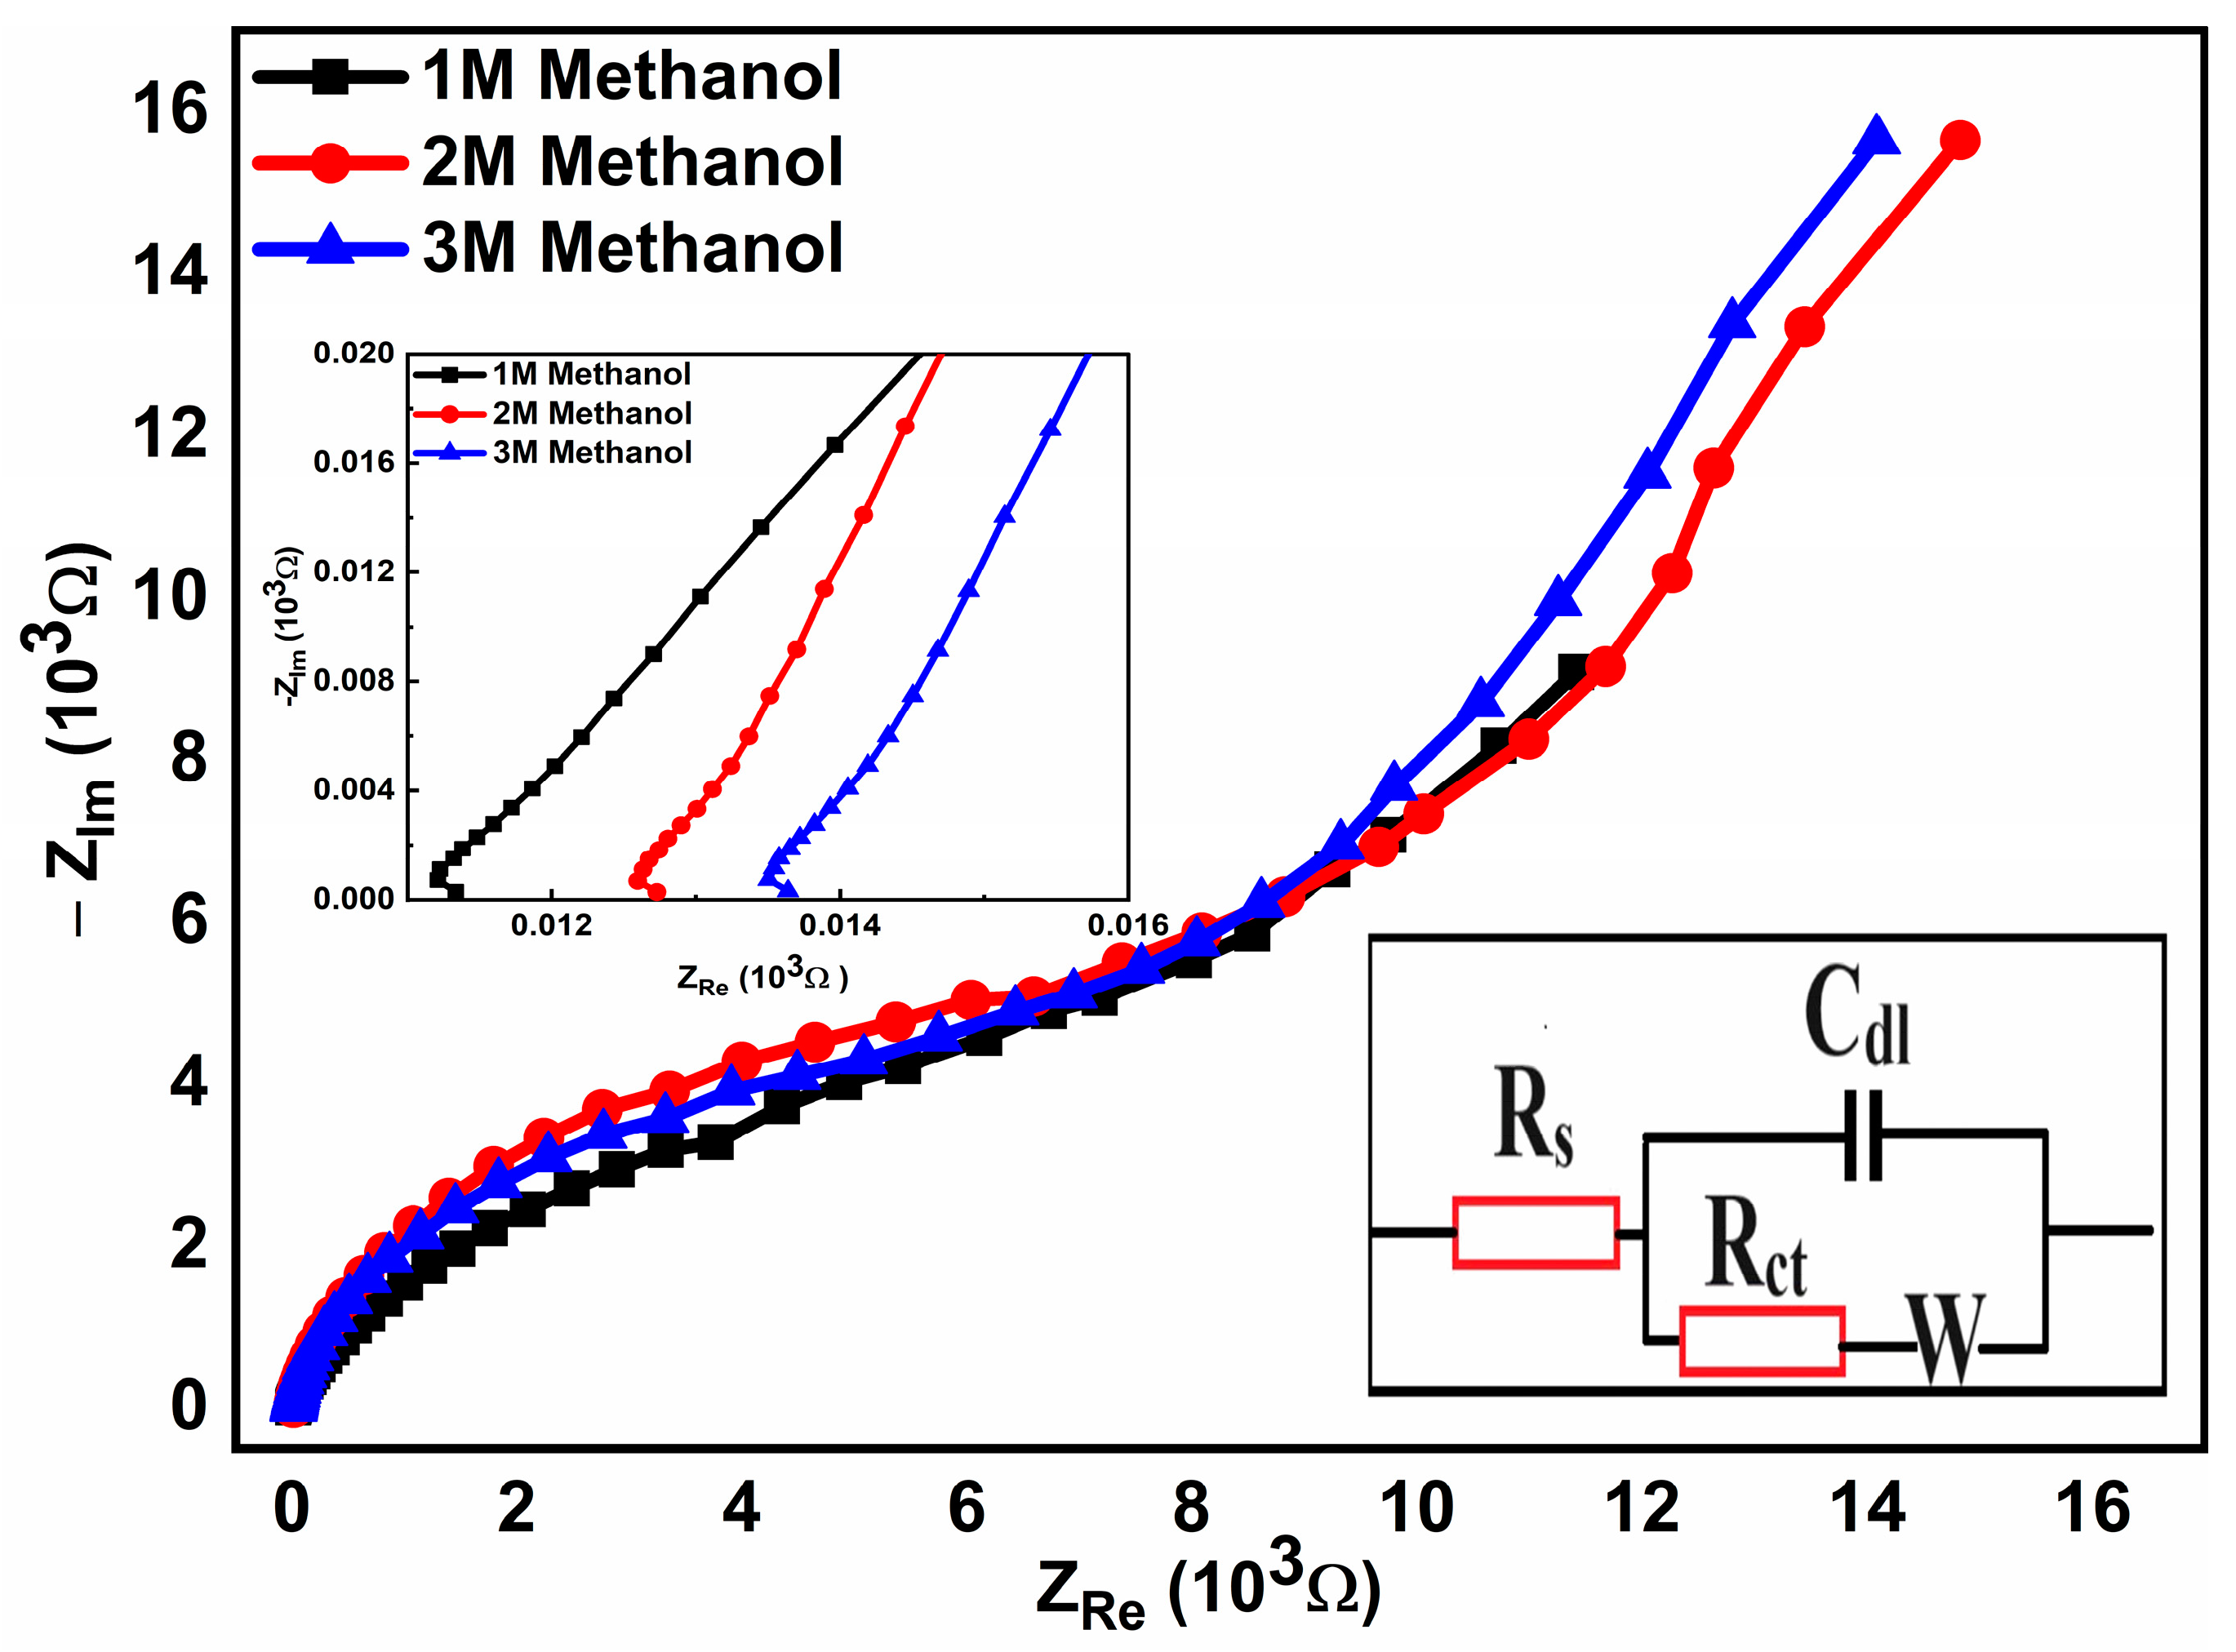
2.4.5. Electrochemical Impedance Spectroscopy (EIS)

The electrooxidation’s catalytic performance for the employed electrodes largely depends on the charge carriers’ dynamics. Another crucial test for determining the material’s conductivity is electrochemical impedance spectroscopy or EIS, both the electrode- and cell-equivalent series resistance. EIS measurements were made to investigate the interaction between the electrode and electrolyte at a frequency of 0.1 to 100,000 Hz with an applied voltage of 0.8 V. The electrocatalysts’ interfacial properties were characterized by measuring the EIS data using the Verstat workstation in different concentrations of methanol with 1 M of KOH.
The real and imaginary (ZRe, ZIm) components of the cell’s resistance and capacitance, respectively, add up to the total impedance [50]. Figure 14 displays the electrodes’ Nyquist graphs for Ni12Cu8/CNFs as the optimum performance of the prepared electrocatalysts—a small semicircle in the low-impedance region and a spike in the high-impedance regions—as can be seen in the figure for all different concentrations. At the electrode–electrolyte interface, the tiny semicircle is related to the charge transfer resistance (Rct), illustrating how easily charge transfer reactions can occur at the catalyst surface, indicating a quick transfer process [51].
An increase in charge transfer resistance (Rct) is indicated by the growing semicircle size as the methanol concentration rises from 1M to 3M. This implies that the kinetics of the electrochemical reactions, like the methanol oxidation process, slow down as the concentration of methanol increases. Mass transport constraints are linked to the sharp rise in impedance at higher ZRe values. Increased mass transport resistance results from the difficulty of moving the solvent methanol and its reaction intermediates to and from the electrode surface at higher methanol concentrations. Concentration gradients, methanol crossover, and fuel cell diffusion constraints are a few possible causes of this [52].
Higher methanol concentrations appear to increase the resistance to both mass transport and charge transfer, which indicates that the methanol fuel cell’s overall performance may suffer. Increased energy losses and decreased fuel cell efficiency are indicated by higher impedance values. To achieve the best fuel cell performance, 1 M of methanol is the ideal methanol concentration for the optimum electrocatalyst Ni12Cu8/CNFs that would balance the mass transport and kinetic factors. Conversely, a significant spike at a high impedance value is usually linked to the electrode’s capacitive behavior. It displays the double-layer capacitance (Cdl) that develops at the interface between the electrolyte and electrode surfaces. The broad spike and the small semicircle indicate that the catalyst Ni12Cu8/CNFs have a high active surface area and good electrochemical activity, two qualities that are critical for effective fuel cell performance.
Active electrolyte resistance (RS) relates to a parallel combination of the double-layer capacitance (Cdl) and the charge transfer resistance (Rct) in series with the Warburg impedance (W) that makes up the equivalent electrical circuit known as the Randles circuit [53,54]. The equivalent circuit of the Nyquist plot is depicted in the inset figure in Figure 14, and it precisely matches the Randles circuit; the element values are given in Table 3.
Ni12Cu8/CNFs exhibit the lowest (Rct) and lowest semicircle diameter in 1M of methanol. This is related to a lower mass transfer resistivity and an improved electron transfer progression because of the metal, carbon, and metal hydroxides cooperating effectively in the methanol oxidation reaction [55,56]. These findings, which are accepted with those from the cyclic voltammetry measurements, highlight the fact that Cu can function as a superior additive for enhancing Ni-based catalysts.

3. Experimental Details

3.1. Samples Preparation

Nickel acetate tetrahydrate with a purity of over 98% [Ni(CH3COO)2·4H2O, abbreviated as NiAc], cobalt acetate anhydrous also exceeding 98% purity [Co(C2H3O2)2, referred to as CoAc], cadmium acetate tetrahydrate [C4H16CdO8 referred as CdAc] with purity 98%, and copper acetate tetrahydrate [C4H16CuO8 referred as CuAc] with 99.6% purity, along with Nafion® D-521 dispersion (Thermo Scientific Chemicals, Waltham, MA, USA) at 5% wt. in a mixture with 1-isopropanol, were acquired. Polyvinyl alcohol with a repeating unit of [{-CH2CH-}n] and a molecular weight of 125,000 g/mol, plus potassium hydroxide in flake form, was procured from Alfa Aesar (Haverhill, MA, USA). Methanol of HPLC grade was sourced from Carlo Erba (Emmendingen, Germany).

3.2. Synthesis of Metal/CNFs

PVA with a concentration of 10% wt. in 20 mL deionized water was prepared under stirring with heat treatment at 70 °C for 4 h and left under stirring at room temperature overnight till a clear solution was obtained. Fixed percentages of the metal salt precursors NiAc, CdAc, CoAc, and CuAc were added to the PVA solution with a theoretical atomic ratio of 20% metal and 80% PVA by weight to make Ni12Cd8, Ni12Co8, and Ni12Cu8. For each catalyst, the metal to PVA was maintained at 20:80% weight percent and the metal loading of Ni was maintained constant.
An electrospinning device was used to produce PVA nanofiber decorated with metal additives at the desired ratio. The electrospun solution was put into a 10-milliliter plastic syringe fitted with a stainless-steel needle. As voltage is applied, the solution at the tip of the spinneret begins to form a droplet, which stretches into a conical shape known as a “Taylor cone”. Once the electric field strength exceeds the surface tension of the droplet, a charged jet of polymer solution emerges from the tip. The ejected jet travels towards the collector while undergoing rapid stretching and thinning due to the electrostatic repulsion of the charged molecules inside the jet. As the solvent evaporates during this process, it solidifies into a fiber.
The flow rate was then set to 0.3 mL/h and the syringe was connected to a digitally controlled syringe. The collection drum was covered with a smooth piece of paper that had the electrospun nanofibers on it. The applied voltage was adjusted to 20 kV, and the stainless-steel needle tip and drum collector were kept at 15 cm. A minimum of 30% humidity and a temperature of 25 °C were required for the electrospinning process to occur.
The prepared nanofiber network was removed from the drum and vacuum-dried for an entire night at 80 °C. Then, in argon atmosphere, the temperature was progressively raised to 750 °C at a rate of 2.5 °C/min to begin the carbonization process. For two hours, the final temperature was maintained. After the calcination process, the PVA solution with metal salts was successfully converted to uniform and fine carbon nanofiber with the desired metals nanoparticles implemented through its surface. Figure 15 displays a graphical chart that shows how metals/CNFs are prepared.

3.3. Characterization Techniques

An electron microscope (SEM Jeol JSM-IT200, Tokyo, Japan) and a transmission electron microscope (TEM, JEOL JEM-2000, Tokyo, Japan) operating at 200 kV were used to characterize the morphology and structure of nanofiber materials. Normal and high-resolution images were obtained. Following calcination, the material was studied in its crystallite phase using an X-ray diffractometer (XRD, BRUKER D8 ADVANCE, Billerica, MA, USA) with a copper target and Cu-Kα radiation wavelength of 1.540 Ao from a generator running at 30 kV and 30 mA for an angle range between 10 to 100 degrees. With monochromatic X-ray Al K-alpha radiation ranging from −10 to 1350 eV, XPS data were gathered on K-ALPHA (Thermo Fisher Scientific, Waltham, MA, USA).
Using a Verstat3 electrochemical system, electrochemical measurements and impedance spectroscopy were studied. An electrochemical cell consisting of three electrodes was established at room temperature in a 1 M KOH solution containing varying amounts of methanol. To ascertain the generated current density, three electrodes were utilized. The working electrode (the glassy carbon GC electrode), Ag/AgCl reference electrode, and counter-electrode, which is a Pt wire, were these three electrodes. Normalizing the current density involved using the working electrode’s surface area.
Catalyst ink was prepared using 5 mg of catalyst powder and 50 µL of Nafion in 0.45 mL of isopropyl alcohol were mixed. For 1 h, the liquid was agitated to produce a consistent catalyst ink. Next, a glassy carbon electrode with a surface area of 0.07065 cm2 was immediately coated with approximately 15 µL of this ink. The electrode was then allowed to dry for an hour at room temperature.
Open circuit potential (OCP) was applied before experiments to ensure no external current flows. This allows for the working electrode to acclimate in the electrolyte solution, stabilizing the system without applying voltage. The OCP is then measured as the potential difference between the working and reference electrodes. Additionally, the three-electrode cells used were optimized before the deposition of the catalyst ink, as discussed in Figure S1.

4. Conclusions

This study promotes a simple, non-expensive, and effective Ni bimetallic-based metal (Cd, Co, and Cu) synthesis process supported by carbon nanofibers with a Ni12M8/CNF ratio. The samples’ crystal structure, surface area, morphologies, and elemental analysis were examined by XRD, SEM, TEM, XPS, EDX, and EDS mapping. XRD analysis confirmed the crystalline nature of the prepared catalyst, indicating no residuals or impurities, and verified the formation of the rGO layer. SEM images showcased the intriguing morphology of synthesized carbon nanofibers coated by metal additives, exhibiting uniform, smooth, and bead-free nanofiber with diameters ranging from 250 to 400 nm. TEM analysis, using ImageJ, calculated an average particle size of 27 nm. EDS mapping demonstrated a homogeneous Ni, Cu, C, and O distribution in the Ni12Cu8/CNFs. EDX analysis validated the correct ratios obtained from the experimental procedure after calcination. XPS analysis revealed the oxidation states of Ni, Cu, C, and O, confirming the existence of the rGO layer and the presence of Ni and Cu as metal additives, with no extra elements detected. The electrochemical activity using different methanol concentrations, sweeping scan rates, chronoamperometry, and electrochemical impedances were examined successfully for all designed catalysts. They show typical methanol oxidation by enhancing Ni catalytic activity; moreover, the Ni12Co8/CNFs exhibited twice as much catalytic activity as reported in the literature. Regarding the prepared electrodes, Ni12Cu8/CNFs revealed the lowest charge transfer resistance of 14.25 Ω and the highest current density of 152 mA/cm2 at 0.8 V, indicating the best performance in methanol electrooxidation. It was confirmed that methanol oxidation is irreversible and controlled by kinetic and diffusion mechanisms. The material’s small, nanoscale size contributed to its improved performance by increasing the surface area available for the oxidation process. These bimetallic Ni12Cu8/CNFs represent properties that could make them an attractive alternative to costly DMFC catalysts.

Supplementary Materials

The following supporting information can be downloaded at: https://www.mdpi.com/article/10.3390/catal14100680/s1, Table S1: Different studies from reported literature using related electrocatalysts; Figure S1: CV voltammogram with no sample deposited on the working electrode surface. Refs. [57,58,59,60,61,62,63,64,65] are cited in Supplementary Materials.

Author Contributions

Conceptualization, E.E.A.-H. and M.O.A.-H.; methodology, M.M.G., Y.S.E. and M.I.; validation, E.E.A.-H., M.O.A.-H. and M.I.; formal analysis, E.E.A.-H., M.O.A.-H., M.M.G., Y.S.E. and M.I.; investigation, E.E.A.-H., M.O.A.-H., M.M.G., Y.S.E. and M.I.; resources, M.M.G., Y.S.E. and M.I.; data curation, E.E.A.-H., M.O.A.-H., M.M.G., Y.S.E. and M.I.; writing—original draft preparation, E.E.A.-H., M.O.A.-H. and M.I.; writing—review and editing, E.E.A.-H., M.O.A.-H., M.M.G., Y.S.E. and M.I.; visualization, M.M.G., Y.S.E. and M.I.; project administration, E.E.A.-H. and M.O.A.-H.; funding acquisition, E.E.A.-H., M.O.A.-H. and M.I. All authors have read and agreed to the published version of the manuscript.

Funding

The Science and Technology Development Fund (STDF), PGSG Grant No. 48345, provided financial support for this research.

Data Availability Statement

The data presented in this study are available on request from the corresponding author.

Acknowledgments

This paper is based upon work supported by the Science, Technology, and Innovation Funding Authority (STDF) under grant No. 48345.

Conflicts of Interest

The authors declare no conflicts of interest regarding the publication of this paper. The funders had no role in the design of the study; in the collection, analyses, or interpretation of data; in the writing of the manuscript; or in the decision to publish the results.

References

  1. Dincer, I.; Zamfirescu, C. Sustainable Energy Systems and Applications; Springer Science & Business Media: Berlin/Heidelberg, Germany, 2011. [Google Scholar]
  2. Wang, C.; Kaneti, Y.V.; Bando, Y.; Lin, J.; Liu, C.; Li, J.; Yamauchi, Y. Metal–organic framework-derived one-dimensional porous or hollow carbon-based nanofibers for energy storage and conversion. Mater. Horiz. 2018, 5, 394–407. [Google Scholar] [CrossRef]
  3. Güler, S.; Yavaş, A.; Mustafov, S.D.; Şen, F. The material development and characterization of direct alcohol fuel cells. In Nanomaterials for Direct Alcohol Fuel Cells; Elsevier: Amsterdam, The Netherlands, 2021; pp. 53–73. [Google Scholar]
  4. Ong, B.C.; Kamarudin, S.K.; Basri, S. Direct liquid fuel cells: A review. Int. J. Hydrogen Energy 2017, 42, 10142–10157. [Google Scholar] [CrossRef]
  5. Suter, T.A.; Smith, K.; Hack, J.; Rasha, L.; Rana, Z.; Angel, G.M.A.; Shearing, P.R.; Miller, T.S.; Brett, D.J.L. Engineering catalyst layers for next-generation polymer electrolyte fuel cells: A review of design, materials, and methods. Adv. Energy Mater. 2021, 11, 2101025. [Google Scholar] [CrossRef]
  6. Hou, J.; Yang, M.; Ke, C.; Wei, G.; Priest, C.; Qiao, Z.; Wu, G.; Zhang, J. Platinum-group-metal catalysts for proton exchange membrane fuel cells: From catalyst design to electrode structure optimization. EnergyChem 2020, 2, 100023. [Google Scholar] [CrossRef]
  7. Chen, A.; Holt-Hindle, P. Platinum-based nanostructured materials: Synthesis, properties, and applications. Chem. Rev. 2010, 110, 3767–3804. [Google Scholar] [CrossRef]
  8. Stacy, J.; Regmi, Y.N.; Leonard, B.; Fan, M. The recent progress and future of oxygen reduction reaction catalysis: A review. Renew. Sustain. Energy Rev. 2017, 69, 401–414. [Google Scholar] [CrossRef]
  9. Ciapina, E.G.; Santos, S.F.; Gonzalez, E.R. Electrochemical CO stripping on nanosized Pt surfaces in acid media: A review on the issue of peak multiplicity. J. Electroanal. Chem. 2018, 815, 47–60. [Google Scholar] [CrossRef]
  10. Sinniah, J.D.; Wong, W.Y.; Loh, K.S.; Yunus, R.M.; Timmiati, S.N. Perspectives on carbon-alternative materials as Pt catalyst supports for a durable oxygen reduction reaction in proton exchange membrane fuel cells. J. Power Sources 2022, 534, 231422. [Google Scholar] [CrossRef]
  11. Abdelkareem, M.A.; Sayed, E.T.; Mohamed, H.O.; Obaid, M.; Rezk, H.; Chae, K.-J. Nonprecious anodic catalysts for low-molecular-hydrocarbon fuel cells: Theoretical consideration and current progress. Prog. Energy Combust. Sci. 2020, 77, 100805. [Google Scholar] [CrossRef]
  12. Lee, J.D.; Jishkariani, D.; Zhao, Y.; Najmr, S.; Rosen, D.; Kikkawa, J.M.; Stach, E.A.; Murray, C.B. Tuning the electrocatalytic oxygen reduction reaction activity of Pt–Co nanocrystals by cobalt concentration with atomic-scale understanding. ACS Appl. Mater. Interfaces 2019, 11, 26789–26797. [Google Scholar] [CrossRef]
  13. Eshghi, A.; Sabzehmeidani, M.M. Platinum–Iron nanoparticles supported on reduced graphene oxide as an improved catalyst for methanol electro oxidation. Int. J. Hydrogen Energy 2018, 43, 6107–6116. [Google Scholar] [CrossRef]
  14. Colmati, F.; Magalhães, M.M.; Sousa, R.; Ciapina, E.G.; Gonzalez, E.R. Direct Ethanol Fuel Cells: The influence of structural and electronic effects on Pt–Sn/C electrocatalysts. Int. J. Hydrogen Energy 2019, 44, 28812–28820. [Google Scholar] [CrossRef]
  15. Peng, X.; Zhao, S.; Omasta, T.J.; Roller, J.M.; Mustain, W.E. Activity and durability of Pt-Ni nanocage electocatalysts in proton exchange membrane fuel cells. Appl. Catal. B Environ. 2017, 203, 927–935. [Google Scholar] [CrossRef]
  16. Zhao, X.; Sasaki, K. Advanced Pt-based core–shell electrocatalysts for fuel cell cathodes. Acc. Chem. Res. 2022, 55, 1226–1236. [Google Scholar] [CrossRef]
  17. De, S.; Zhang, J.; Luque, R.; Yan, N. Ni-based bimetallic heterogeneous catalysts for energy and environmental applications. Energy Environ. Sci. 2016, 9, 3314–3347. [Google Scholar] [CrossRef]
  18. Leonard, B.M.; Zhou, Q.; Wu, D.; DiSalvo, F.J. Facile synthesis of PtNi intermetallic nanoparticles: Influence of reducing agent and precursors on electrocatalytic activity. Chem. Mater. 2011, 23, 1136–1146. [Google Scholar] [CrossRef]
  19. Xu, X.; Wang, W.; Zhou, W.; Shao, Z. Recent advances in novel nanostructuring methods of perovskite electrocatalysts for energy-related applications. Small Methods 2018, 2, 1800071. [Google Scholar] [CrossRef]
  20. Li, Y.; Wei, X.; Chen, L.; Shi, J.; He, M. Nickel-molybdenum nitride nanoplate electrocatalysts for concurrent electrolytic hydrogen and formate productions. Nat. Commun. 2019, 10, 5335. [Google Scholar] [CrossRef]
  21. Monnerie, N.; Gan, P.G.; Roeb, M.; Sattler, C. Methanol production using hydrogen from concentrated solar energy. Int. J. Hydrogen Energy 2020, 45, 26117–26125. [Google Scholar] [CrossRef]
  22. Zhou, L.; Enakonda, L.R.; Harb, M.; Saih, Y.; Aguilar-Tapia, A.; Ould-Chikh, S.; Hazemann, J.-L.; Li, J.; Wei, N.; Gary, D.; et al. Fe catalysts for methane decomposition to produce hydrogen and carbon nano materials. Appl. Catal. B Environ. 2017, 208, 44–59. [Google Scholar] [CrossRef]
  23. Torres, D.; Pinilla, J.L.; Suelves, I. Screening of Ni-Cu bimetallic catalysts for hydrogen and carbon nanofilaments production via catalytic decomposition of methane. Appl. Catal. A Gen. 2018, 559, 10–19. [Google Scholar] [CrossRef]
  24. Bartholomew, C.H. Mechanisms of catalyst deactivation. Appl. Catal. A Gen. 2001, 212, 17–60. [Google Scholar] [CrossRef]
  25. Halim, E.M.; Chemchoub, S.; El Attar, A.; Salih, F.E.; Oularbi, L.; EL Rhazi, M. Recent advances in anode metallic catalysts supported on conducting polymer-based materials for direct alcohol fuel cells. Front. Energy Res. 2022, 10, 843736. [Google Scholar] [CrossRef]
  26. Roy, A.; Talarposhti, M.R.; Normile, S.J.; Zenyuk, I.V.; De Andrade, V.; Artyushkova, K.; Serov, A.; Atanassov, P. Nickel–copper supported on a carbon black hydrogen oxidation catalyst integrated into an anion-exchange membrane fuel cell. Sustain. Energy Fuels 2018, 2, 2268–2275. [Google Scholar] [CrossRef]
  27. Pieta, I.S.; Rathi, A.; Pieta, P.; Nowakowski, R.; Holdynski, M.; Pisarek, M.; Kaminska, A.; Gawande, M.B.; Zboril, R.; Pieta, I.S.; et al. Electrocatalytic methanol oxidation over Cu, Ni and bimetallic Cu-Ni nanoparticles supported on graphitic carbon nitride. Appl. Catal. B Environ. 2019, 244, 272–283. [Google Scholar] [CrossRef]
  28. Hu, B.; Xie, Y.; Yang, Y.; Meng, J.; Cai, J.; Chen, C.; Yu, D.; Zhou, X. Lattice strain controlled Ni@ NiCu efficient anode catalysts for direct borohydride fuel cells. Dalton Trans. 2023, 52, 12002–12009. [Google Scholar] [CrossRef]
  29. Abdel-Hady, E.E.; Shaban, M.; Abdel-Hamed, M.O.; Gamal, A.; Yehia, H.; Ahmed, A.M. Synthesis and characterization of NiCoPt/CNFs nanoparticles as an effective electrocatalyst for energy applications. Nanomaterials 2022, 12, 492. [Google Scholar] [CrossRef]
  30. Utkan, G.; Yumusak, G.; Tunali, B.C.; Ozturk, T.; Turk, M. Production of reduced graphene oxide by using three different microorganisms and investigation of their cell interactions. ACS Omega 2023, 8, 31188–31200. [Google Scholar] [CrossRef]
  31. Mohammed, S.; Aburabie, J.; Nassrullah, H.; Hashaikeh, R. Porous rGO/networked cellulose composite membranes: Towards enhanced nanofiltration performance of rGO-based membranes. Mater. Today Sustain. 2024, 25, 100682. [Google Scholar] [CrossRef]
  32. Aragaw, B.A. Reduced graphene oxide-intercalated graphene oxide nano-hybrid for enhanced photoelectrochemical water reduction. J. Nanostruct. Chem. 2020, 10, 9–18. [Google Scholar] [CrossRef]
  33. Guan, J.; Liu, Y.; Fang, Y.; Du, X.; Fu, Y.; Wang, L.; Zhang, M. Co-Ni alloy nanoparticles supported by carbon nanofibers for hydrogen evolution reaction. J. Alloys Compd. 2021, 868, 159172. [Google Scholar] [CrossRef]
  34. Shen, Y.; Lua, A.C. Synthesis of Ni and Ni–Cu supported on carbon nanotubes for hydrogen and carbon production by catalytic decomposition of methane. Appl. Catal. B Environ. 2015, 164, 61–69. [Google Scholar] [CrossRef]
  35. Xiao, S.; Xu, P.; Peng, Q.; Chen, J.; Huang, J.; Wang, F.; Noor, N. Layer-by-layer assembly of polyelectrolyte multilayer onto PET fabric for highly tunable dyeing with water soluble dyestuffs. Polymers 2017, 9, 735. [Google Scholar] [CrossRef]
  36. Han, H.; Dai, R.; Wang, Z. Fabrication of high-performance thin-film composite nanofiltration membrane by dynamic calcium-carboxyl intra-bridging during post-treatment. Membranes 2020, 10, 137. [Google Scholar] [CrossRef] [PubMed]
  37. Xiong, D.; Li, W.; Liu, L. Vertically aligned porous nickel (II) hydroxide nanosheets supported on carbon paper with long-term oxygen evolution performance. Chem. Asian J. 2017, 12, 543–551. [Google Scholar] [CrossRef]
  38. Hu, X.; Tian, X.; Lin, Y.-W.; Wang, Z. Nickel foam and stainless steel mesh as electrocatalysts for hydrogen evolution reaction, oxygen evolution reaction and overall water splitting in alkaline media. RSC Adv. 2019, 9, 31563–31571. [Google Scholar] [CrossRef]
  39. Wang, X.; Zhang, B.; Zhang, W.; Yu, M.; Cui, L.; Cao, X.; Liu, J. Super-light Cu@ Ni nanowires/graphene oxide composites for significantly enhanced microwave absorption performance. Sci. Rep. 2017, 7, 1584. [Google Scholar] [CrossRef] [PubMed]
  40. Kumar, M.; Bhatt, V.; Nayal, O.S.; Sharma, S.; Kumar, V.; Thakur, M.S.; Kumar, N.; Bal, R.; Singh, B.; Sharma, U. CuI nanoparticles as recyclable heterogeneous catalysts for C–N bond formation reactions. Catal. Sci. Technol. 2017, 7, 2857–2864. [Google Scholar] [CrossRef]
  41. Swadźba-Kwaśny, M.; Chancelier, L.; Ng, S.; Manyar, H.G.; Hardacre, C.; Nockemann, P. Facile in situ synthesis of nanofluids based on ionic liquids and copper oxide clusters and nanoparticles. Dalton Trans. 2012, 41, 219–227. [Google Scholar] [CrossRef]
  42. Chen, G.; Pan, Y.; Lu, T.; Wang, N.; Li, X. Highly catalytical performance of nanoporous copper for electro-oxidation of methanol in alkaline media. Mater. Chem. Phys. 2018, 218, 108–115. [Google Scholar] [CrossRef]
  43. Sheikhi, S.; Jalali, F. Zr-MOF@ Polyaniline as an efficient platform for nickel deposition: Application to methanol electro-oxidation. Fuel 2021, 296, 120677. [Google Scholar] [CrossRef]
  44. Li, F.; Chang, X.; Wang, S.; Guo, Y.; Li, H.; Wu, K. Excellent electrocatalytic performance toward methanol oxidation of hierarchical porous NiCu obtained by electrochemical dealloying. J. Alloys Compd. 2023, 934, 167811. [Google Scholar] [CrossRef]
  45. Mahmoud, I.; Farghali, A.A.; El-Rouby, W.M.A.; Abdelwahab, A. Nickel and cobalt-based tungstate nanocomposites as promising electrocatalysts in alkaline direct methanol fuel cells. Nanoscale Adv. 2024, 6, 2059–2074. [Google Scholar] [CrossRef]
  46. Liu, C.; Yang, F.; Schechter, A.; Feng, L. Recent progress of Ni-based catalysts for methanol electrooxidation reaction in alkaline media. Adv. Sens. Energy Mater. 2023, 2, 100055. [Google Scholar] [CrossRef]
  47. Yang, Y.; Hao, Y.; Huang, L.; Luo, Y.; Chen, S.; Xu, M.; Chen, W. Recent Advances in Electrochemical Sensors for Formaldehyde. Molecules 2024, 29, 327. [Google Scholar] [CrossRef]
  48. Awad, S.; Al-Sheqefi, F.U.Y.; Al-Ahmadi, A.N.; Ibrahim, M.; Abdel-Hady, E.E. Valuation of bimetallic Pd/Ni nanoparticles catalyst for the applications in direct methanol fuel cells. Polym. Adv. Technol. 2023, 34, 3137–3153. [Google Scholar] [CrossRef]
  49. Neghmouche, N.S.; Lanez, T. Calculation of electrochemical parameters starting from the polarization curves of ferrocene at glassy carbon electrode. Int. Lett. Chem. Phys. Astron. 2013, 4, 37–45. [Google Scholar] [CrossRef]
  50. Parsa, A.; Amanzadeh-Salout, S. Electrocatalytic activity and electrochemical impedance spectroscopy of poly (aniline-co-ortho-phenylenediamine) modified electrode on ascorbic acid. Orient. J. Chem 2016, 32, 2051–2058. [Google Scholar] [CrossRef]
  51. Feng, L.-J.; Zhang, X.-H.; Zhao, D.-M.; Wang, S.-F. Electrochemical studies of bovine serum albumin immobilization onto the poly-o-phenylenediamine and carbon-coated nickel composite film and its interaction with papaverine. Sens. Actuators B Chem. 2011, 152, 88–93. [Google Scholar] [CrossRef]
  52. Vijayakumar, P.; Pandian, M.S.; Pandikumar, A.; Ramasamy, P. Electrochemical interfacial charge transfer dynamics and photovoltaic performances of nanofibrous vanadium derivatives based platinum free counter electrodes in dye sensitized solar cells. Mater. Sci. Eng. B 2017, 222, 7–17. [Google Scholar] [CrossRef]
  53. Chen, M.; Du, C.; Yin, G.; Shi, P.; Zhao, T. Numerical analysis of the electrochemical impedance spectra of the cathode of direct methanol fuel cells. Int. J. Hydrogen Energy 2009, 34, 1522–1530. [Google Scholar] [CrossRef]
  54. Lai, C.-Y.; Huang, W.-C.; Weng, J.-H.; Chen, L.-C.; Chou, C.-F.; Wei, P.-K. Impedimetric aptasensing using a symmetric Randles circuit model. Electrochim. Acta 2020, 337, 135750. [Google Scholar] [CrossRef]
  55. Laschuk, N.O.; Easton, E.B.; Zenkina, O.V. Reducing the resistance for the use of electrochemical impedance spectroscopy analysis in materials chemistry. RSC Adv. 2021, 11, 27925–27936. [Google Scholar] [CrossRef]
  56. Song, Z.; Zhang, M.; Wang, Z.; Wang, A.; Huang, Z.; Yue, S.; Hang, C. Mof Derived Carbon Encapsulation Coni Nanocrystal In-Situ Grafting of N-Doped Carbon Nanotubes for Synergistically Enhancing Electrocatalytic Active for Methanol Oxidation. Available at SSRN 4081666. 2022. Available online: https://ssrn.com/abstract=4081666 (accessed on 12 April 2022).
  57. Mahapatra, S.S.; Datta, J. Characterization of Pt-Pd/C electrocatalyst for methanol oxidation in alkaline medium. Int. J. Electrochem. 2011, 2011, 563495. [Google Scholar] [CrossRef]
  58. Mohamed, A.; Shaban, M.; Kordy, M.G.M.; Al-Senani, G.M.; Eissa, M.F.; Hamdy, H. Fabrication and characterization of NiCu/GO and NiCu/rGO nanocomposites for fuel cell application. RSC Adv. 2024, 14, 6776–6792. [Google Scholar] [CrossRef]
  59. Kotp, A.A.; Abdelwahab, A.; Farghali, A.A.; El Rouby, W.M.; Allah, A.E. Ornated hydrangea-like M-MO/graphitic porous carbon derived via direct carbonization of MOFs for electrooxidation of methanol in alkaline DMFC. Diam. Relat. Mater. 2024, 145, 111119. [Google Scholar] [CrossRef]
  60. Sarwar, E.; Noor, T.; Iqbal, N.; Mehmood, Y.; Ahmed, S.; Mehek, R. Effect of Co-Ni ratio in graphene based bimetallic electro-catalyst for methanol oxidation. Fuel Cells 2018, 18, 189–194. [Google Scholar] [CrossRef]
  61. Patil, K.; Babar, P.; Lee, D.M.; Karade, V.; Jo, E.; Korade, S.; Kim, J.H. Bifunctional catalytic activity of Ni–Co layered double hydroxide for the electro-oxidation of water and methanol. Sustain. Energy Fuels 2020, 4, 5254–5263. [Google Scholar] [CrossRef]
  62. Mohamed, H.F.M.; E Abdel-Hady, E.; Hmamm, M.F.M.; Ibrahim, M.; Ahmed, H.; Mondy, M.; Yehia, H. A promising fuel cell catalyst using non-precious metal oxide. IOP Conf. Ser. Mater. Sci. Eng. 2018, 464, 012002. [Google Scholar] [CrossRef]
  63. Ahmad, T.; Wani, I.A.; Ahmed, J.; Al-Hartomy, O.A. Effect of gold ion concentration on size and properties of gold nanoparticles in TritonX-100 based inverse microemulsions. Appl. Nanosci. 2014, 4, 491–498. [Google Scholar] [CrossRef]
  64. Heineman, W.R. Laboratory Techniques in Electroanalytical Chemistry; CRC Press: Boca Raton, FL, USA, 2018. [Google Scholar]
  65. Ahammad, A.J.S.; Choi, Y.-H.; Koh, K.; Kim, J.-H.; Lee, J.-J.; Lee, M. Electrochemical detection of cardiac biomarker troponin I at gold nanoparticle-modified ITO electrode by using open circuit potential. Int. J. Electrochem. Sci. 2011, 6, 1906–1916. [Google Scholar] [CrossRef]
Figure 1. XRD pattern for (a) Ni, (b) Ni12Cd8, (c) Ni12Co8, and (d) Ni12Cu8/CNFs, respectively.
Catalysts 14 00680 g001
Figure 2. SEM images of the Ni12Cu8/CNF catalyst at (a) 10,000, (b) 20,000, (c) 30,000, and (d) 90,000 magnifications with 30 KV potential.
Catalysts 14 00680 g002
Figure 3. (ac). TEM micrographs of Ni12Cu8/CNFs and (d) the distribution of particle sizes distribution for Ni-Cu particles.
Catalysts 14 00680 g003
Figure 4. Mapping micrographs of Ni12Cu8/CNFs and related SEM images.
Catalysts 14 00680 g004
Figure 5. EDX analysis for sample Ni12Cu8/CNFs.
Catalysts 14 00680 g005
Figure 6. (a) XPS spectrum survey and spectral lines for (b) C 1s, (c) O 1s, (d) Ni 2p, and (e) Cu 2p for Ni12Cu8/CNFs.
Catalysts 14 00680 g006
Figure 7. Methanol oxidation mechanism using a prepared catalyst as an example (Ni12Cu8/CNFs).
Catalysts 14 00680 g007
Figure 8. Illustrates the different methanol concentrations for the prepared samples: (a) Ni, (b) Ni12Cd8, (c) Ni12Co8, and (d) Ni12Cu8.
Catalysts 14 00680 g008
Figure 9. (a) Comparison between the four prepared samples catalytic activity with different methanol concentrations. (b) The effect of sample compositions on electrocatalytic performance using 1 M methanol + 1 M KOH solutions.
Catalysts 14 00680 g009
Figure 10. Illustrates the different scan rates for methanol oxidation of (a) Ni, (b) Ni12Cd8/CNFs, (c) Ni12Co8/CNFs, and (d) Ni12Cu8/CNFs.
Catalysts 14 00680 g010
Figure 11. (a) Current density versus the square root of the scan rate and (b) anodic peak potential versus the logarithm of the scan rate for the methanol electrooxidation of the prepared catalyst.
Catalysts 14 00680 g011
Figure 12. (a) Linear sweep voltammetry and (b) associating Tafel plots for the prepared samples using 1 M methanol + 1 M KOH.
Catalysts 14 00680 g012
Figure 13. The current density variation over time using 1 M methanol + 1 M KOH for the prepared electrocatalyst.
Catalysts 14 00680 g013
Figure 14. The Nyquist plot for the optimum electrocatalyst Ni12Cu8/CNFs using different methanol concentrations.
Catalysts 14 00680 g014
Figure 15. Experimental graphical scheme for the synthesis of different samples.
Catalysts 14 00680 g015
Table 1. Crystallite size and specific surface area (SSA) calculations.
SampleshklPeak Position
(Degree)
FWHM
(Degree)
D (nm)
(Scherrer Equation)
Surface Area (m2/g)
Ni/CNFs(111)44.470.2431.6921.24
(200)51.830.27
(220)76.380.38
(311)92.940.44
Ni12Cd8/CNFs(101) Cd38.600.4430.8621.81
(111)44.450.27
(200)51.800.30
(220)76.320.44
(311)92.870.26
Ni12Co8/CNFs(111)44.420.3324.3727.63
(200)51.760.38
(220)76.200.38
(311)92.800.66
Ni12Cu8/CNFs(111) Cu43.320.2223.0729.18
(111)44.150.46
(200)51.440.60
(220)75.780.77
(311)92.270.88
Table 2. The slope of Tafel plots for the prepared samples.
SamplesTafel Slope (mV/dec.)
Ni/CNFs35.6 ± 0.002
Ni12Cd8/CNFs29.9 ± 0.003
Ni12Co8/CNFs28.6 ± 0.001
Ni12Cu8/CNFs22.6 ± 0.001
Table 3. Fitted values of the Nyquist plot of the Ni12Cu8/CNF electrocatalyst.
Concentration Rs (Ω)Rct (Ω)Cdl (µF)
1 M Methanol16.0714.252.47
2 M Methanol12.8717.462.74
3 M Methanol12.5936.254.14
Disclaimer/Publisher’s Note: The statements, opinions and data contained in all publications are solely those of the individual author(s) and contributor(s) and not of MDPI and/or the editor(s). MDPI and/or the editor(s) disclaim responsibility for any injury to people or property resulting from any ideas, methods, instructions or products referred to in the content.

