Article

Significant Effects of Adding Mode on Low-Temperature De-NOx Performance and SO2 Resistance of a MnCeTiOx Catalyst Prepared by the Co-Precipitation Method

by
Xi Yang
1,
Hongyan Xue
1,
Lei Wang
1,
Jun Yu
1,
Lupeng Han
2,* and
Dongsen Mao
1,*
1
School of Chemical and Environmental Engineering, Shanghai Institute of Technology, Shanghai 201418, China
2
Innovation Institute of Carbon Neutrality, International Joint Laboratory of Catalytic Chemistry, State Key Laboratory of Advanced Special Steel, Department of Chemistry, College of Sciences, Shanghai University, Shanghai 200444, China
*
Authors to whom correspondence should be addressed.
Catalysts 2024, 14(10), 690; https://doi.org/10.3390/catal14100690
Submission received: 28 August 2024 / Revised: 29 September 2024 / Accepted: 2 October 2024 / Published: 4 October 2024

Abstract

:
Three MnCeTiOx catalysts with the same composition were prepared by conventional co-precipitation (MCT-C), reverse co-precipitation (MCT-R), and parallel co-precipitation (MCT-P), respectively, and their low-temperature SCR performance for de-NOx was evaluated. The textural and structural properties, surface acidity, redox capacity, and reaction mechanism of the catalysts were investigated by a series of characterizations including N2 adsorption and desorption, XRD, SEM, XPS, H2-TPR, NH3-TPD, NO-TPD, and in situ DRIFTs. The results revealed that the most excellent catalytic performance was achieved on MCT-R, and more than 90% NOx conversion can be obtained at 100–300 °C under a high GHSV of 80,000 mL/(gcat·H). Furthermore, MCT-R possessed optimal tolerance to H2O and SO2 poisoning. The excellent catalytic performance of MCT-R can be attributed to its larger BET specific surface area; higher contents of Mn4+, Ce3+, and adsorbed oxygen species; and more adsorption capacity for NH3 and NO. Moreover, in situ DRIFTs results indicated that the NH3-SCR reaction follows simultaneously the Langmuir–Hinshelwood and Eley–Rideal mechanisms at 100 °C. By adjusting the adding mode during the co-precipitation process, excellent low-temperature de-NOx activity of MCT-R can be obtained simply and conveniently, which is of great practical value for the preparation of a MnCeTiOx catalyst for denitrification.

1. Introduction

The selective catalytic reduction with NH3 (NH3-SCR) has been proven to be one of the most effective technologies for controlling NOx emissions [1,2,3]. The research of low-temperature SCR catalysts has attracted considerable concerns owing to the lower temperatures of flue gas from non-electric industries [4]. Among the numerous low-temperature NH3-SCR catalysts, MnOx-based catalysts received tremendous attention due to their excellent de-NOx activity at low temperatures [5,6,7]. TiO2, as a typical NH3-SCR catalyst carrier, not only offers excellent dispersion of active components but also promotes the decomposition of sulfate species formed in the process of SO2 poisoning, thus alleviating the SO2 poisoning effect of the catalysts [8]. The rare earth element Ce can induce surface electron imbalance of the catalyst, forming unsaturated chemical bonds and oxygen vacancies and increasing the concentration of adsorbed oxygen on the catalyst surface [9]. Therefore, the catalyst of MnCeTiOx is considered a promising low-temperature de-NOx catalyst. Nevertheless, MnCeTiOx still has some obvious disadvantages, such as its relatively poor H2O/SO2 tolerance, narrow operation temperature window, and low N2 selectivity [9,10]. Hence, it is important to further develop MnCeTiOx catalysts with excellent low-temperature SCR activity, high N2 selectivity, and strong tolerance to H2O/SO2.
As is well-known, in addition to the component effect, the catalyst preparation method also has a significant effect on the catalytic performance [11]. Compared with other preparation methods, the co-precipitation method is widely used due to its simple preparation process, low cost, and the ability to refine the catalyst grain and increase the BET specific surface area [12]. Chao et al. [13] compared the effects of sol–gel, citric acid complexing, and co-precipitation methods on the catalytic performance of Mn-Ce-Ox/TiO2 for NH3-SCR. The results showed that the catalyst prepared by co-precipitation methods exhibited the best low-temperature de-NOx activity and resistance to SO2 poisoning. Wu et al. [14] also investigated the influence of preparation methods on the SCR activity of Mn-Ce/TiO2 and found that the SCR activity of catalysts decreased in the following sequence of co-precipitation method > citric acid method > impregnation method. Due to the large BET specific surface area and highly dispersed active component particles, the catalyst prepared by the co-precipitation method showed superior SCR performance.
The preparation parameters employed during the catalyst synthesis via the co-precipitation method significantly influence the NH3-SCR activity. For instance, Chen et al. [11] found that MnFeOx prepared with (NH4)2CO3 as the precipitating agent had the best low-temperature de-NOx activity compared to those prepared with NH4OH and NaOH. Sheng et al. [15] investigated the effect of different Ti sources on Mn-Ce-Ox/TiO2 prepared by co-precipitation, and their findings revealed that Mn-Ce-Ox/TiO2 prepared using Ti(NO3)4 as the Ti source exhibited superior SCR activity compared to those synthesized using Ti(SO4)2. On the other hand, the adding mode can also have a significant impact on the performance of catalysts prepared by the co-precipitation method. For example, Rahmani et al. [16] synthesized pure Yttrium Aluminum Garnet (YAG) nanoparticles by co-precipitation, and the effects of adding mode (normal and reverse) on the phase evolution, thermal behavior, the composition and morphology of precipitation, and chemical bonding of the powders were investigated. The results showed that the reverse adding mode obtained a more homogeneous fluffy precipitate with higher carbonate content. Thus, it is expected that various adding modes during the preparation of MnCeTiOx using the co-precipitation method may lead to significant differences in the structure and performance of the catalysts. However, to the best of our knowledge, the preparation of MnCeTiOx by the co-precipitation method with different adding modes has not been explored to date.
In this work, the MnCeTiOx catalysts were prepared by a co-precipitation method with three different adding modes, and their NH3-SCR activities and the tolerance to H2O/SO2 were investigated. The reasons for the significantly different low-temperature activity and resistance to H2O/SO2 over MnCeTiOx prepared by co-precipitation with different adding modes were explored by extensive characterizations. Furthermore, the reaction mechanisms of the related catalysts for NH3-SCR were investigated using in situ DRIFTs.

2. Results and Discussion

2.1. Textural and Structural Properties

2.1.1. XRD

Figure 1a shows the XRD patterns of MCT-C, MCT-R, and MCT-P. As can be seen, MCT-P exhibits diffraction peaks at 25.16°, 37.74°, 47.99°, 55.01°, and 62.62°, which can be indexed to anatase TiO2 (PDF#21-1272) [17,18]. Furthermore, the weak peaks of MnO2 (PDF#72-1982) and CeO2 (PDF#65-5923) are, respectively, observed at 27.95° and 32.9° for MCT-P. Similarly, both TiO2 and CeO2 diffraction peaks are clearly observed in MCT-C. Dissimilarly, only two weak diffraction peaks of TiO2 (25.16° and 55.01°) and one weak diffraction peak of MnO2 (27.95°) are observed on MCT-R, while no distinct diffraction peak of CeO2 can be observed. These results indicate that CeO2 is highly dispersed on the catalyst surface or in an amorphous state in MCT-R [19]. These phenomena reveal that reverse co-precipitation enhances the dispersion of active species, thereby increasing the BET specific surface area of MCT-R, as shown in Table 1.

2.1.2. N2 Adsorption–Desorption

Figure 1b shows the N2 adsorption–desorption isotherm of MCT-C, MCT-R, and MCT-P. The BET specific surface area, pore volume, and pore diameter of the catalysts are listed in Table 1. According to the IUPAC classification, all three catalysts present typical type IV with an H3 hysteresis loop, which indicates that they are mesoporous materials. Compared to other catalysts, the larger BET specific surface area (141.6 m2/g) and pore volume (0.46 cm3/g) can be observed on MCT-R.

2.1.3. SEM/EDX

Figure S1 shows the SEM images of all investigated catalysts, all of which can be observed as rough, irregular particles, stacked and agglomerated. Figure S2 shows the elemental mapping of Mn, Ce, Ti, and O. It can be found that the elements of Mn, Ce, Ti, and O are uniformly distributed on the surface of MCT-R, while these elements are somewhat aggregated on that of MCT-C and MCT-P. These observations illustrate that the reverse co-precipitation method alleviates the disadvantage of uneven distribution of component aggregates to a certain extent.

2.2. Catalytic Activity

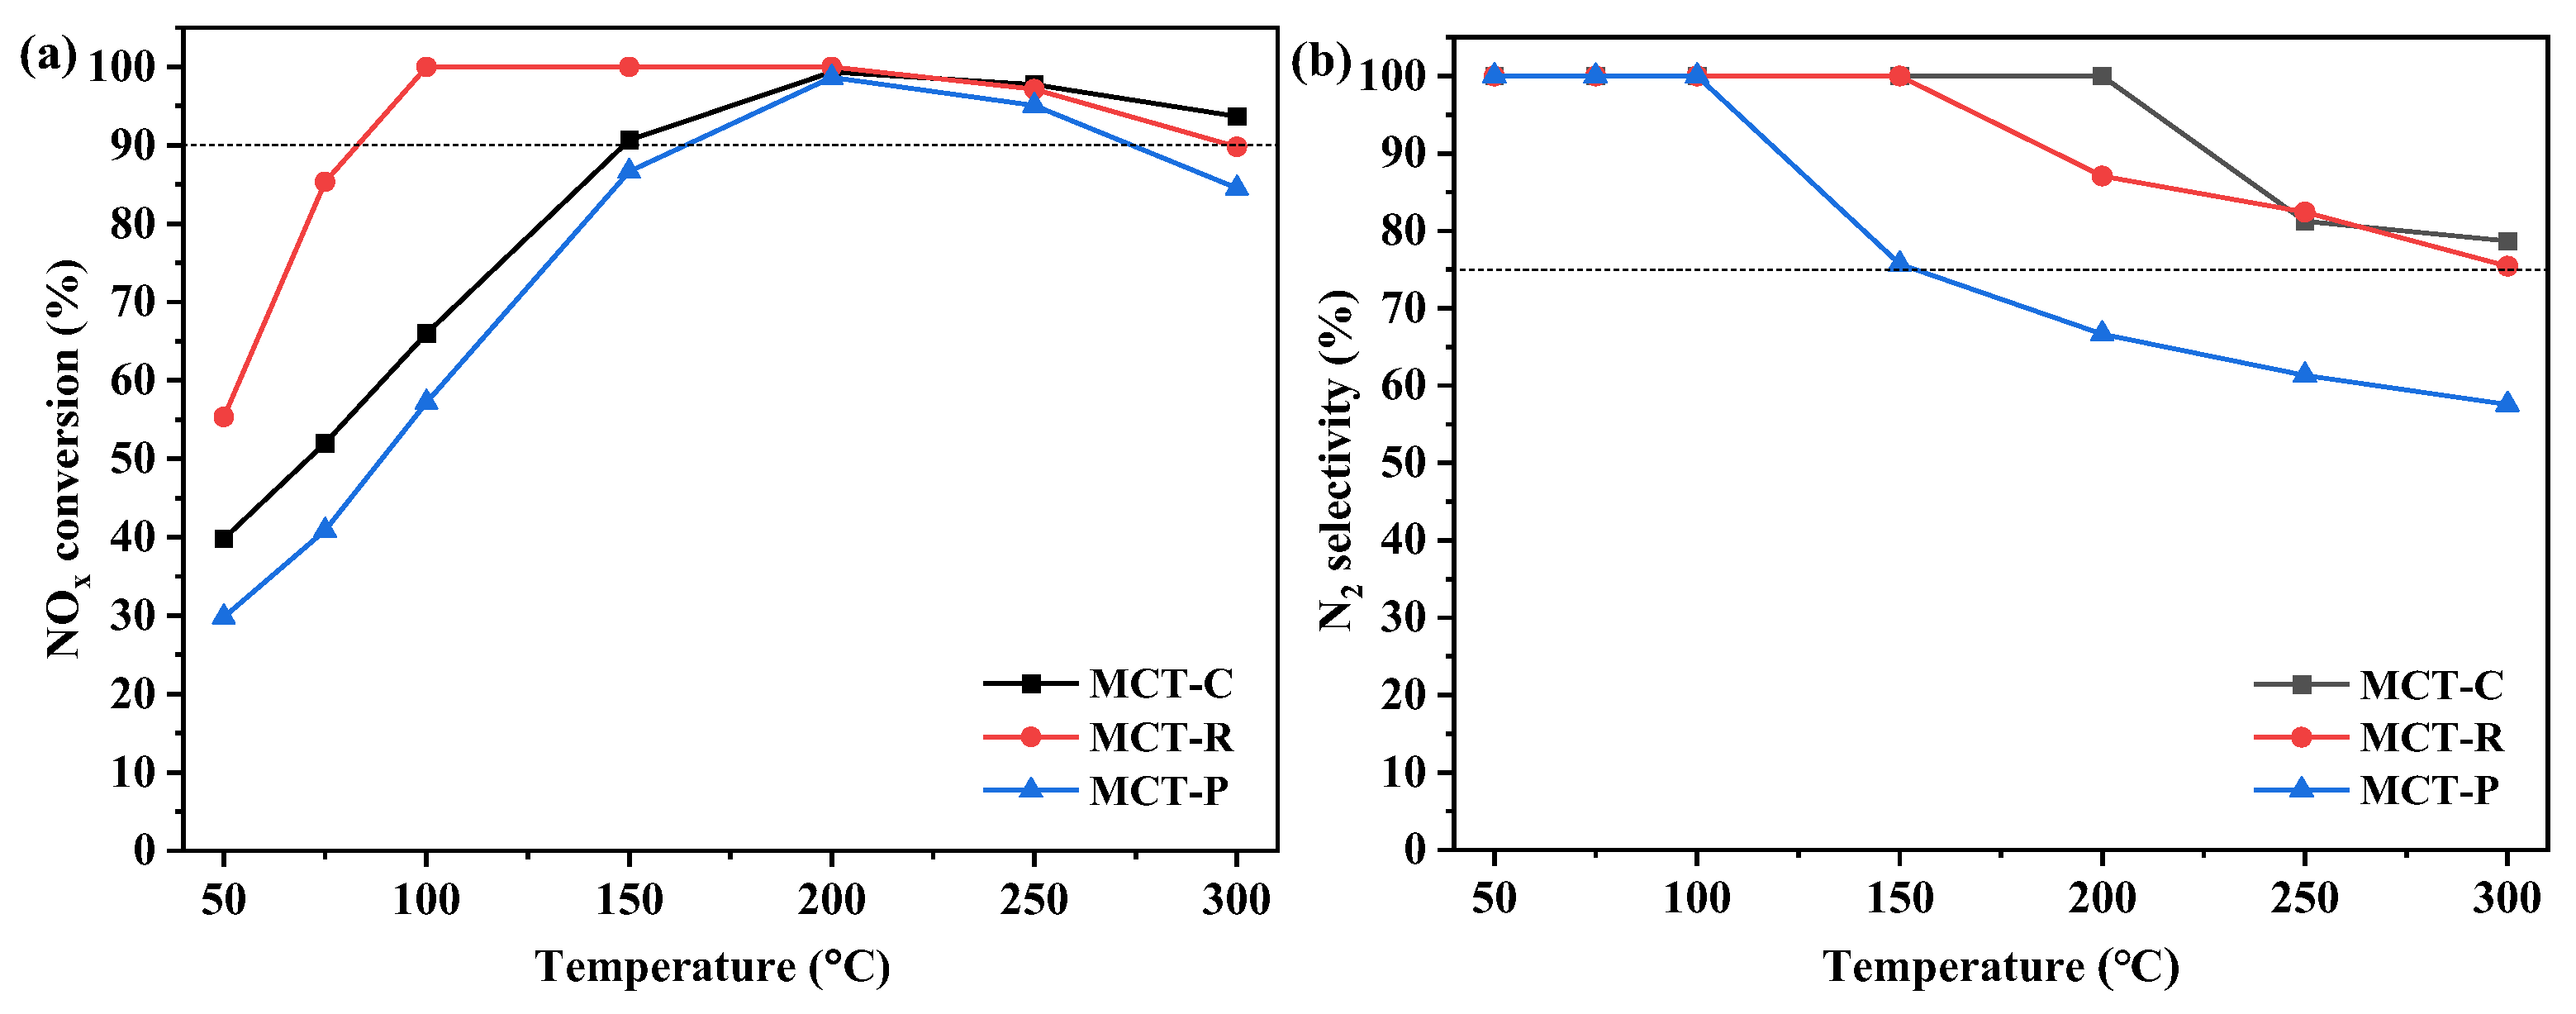
2.2.1. NH3-SCR Activity

Figure 2 shows the low-temperature SCR performance of MCT-C, MCT-R, and MCT-P at 50–300 °C. As shown in Figure 2a, the NOx conversion of MCT-C and MCT-P first increases and then decreases with the increase in the reaction temperature. However, the NOx conversion of MCT-R increases at 50–100 °C, remains the same at 100% at 100–200 °C, and then decreases slightly at 200–300 °C. Notably, MCT-R shows the widest operation temperature window (above 90% NOx conversion), of 100–300 °C, whereas the corresponding values of MCT-C and MCT-P are 150–300 °C and 200–250 °C, respectively. These results illustrate that the reverse adding mode remarkably improves the low-temperature activity and broadens the operation temperature window of the MCT catalyst.
The N2 selectivity of all the catalysts is provided in Figure 2b. The N2 selectivity of MCT-C remained at 100% in the range of 50–200 °C and decreased at 200 °C. However, the N2 selectivity of MCT-R and MCT-P decreases from 150 °C and 100 °C, respectively. In the whole temperature range, the N2 selectivity of MCT-C and MCT-R are higher than 75%, showing that MCT-C and MCT-R exhibit better N2 selectivity than MCT-P.
A comparison of the de-NOx performance of Mn-Ce-Ti catalysts prepared by the most common impregnation and co-precipitation methods is summarized in Table S1. It was found that MCT-R prepared in this work shows a wider operation temperature window (>90% NOx conversion at 100–300 °C) and excellent N2 selectivity (~100% at 50–150 °C). The results illustrate a promising prospect in the practical application of low-temperature flue gas stemmed from non-electricity industries.

2.2.2. H2O and SO2 Resistance

Figure 3 shows the resistance to H2O and SO2 of the catalysts for NH3-SCR. The effect of H2O on SCR performance at 200 °C is shown in Figure 3a. The NOx conversion of MCT-R remains close to 100% after 10% H2O is introduced to the NH3-SCR system for 6 h, while that of MCT-C and MCT-P gradually decreases to 96% and 88% for 6 h, respectively. Furthermore, the SCR activities of three catalysts could be fully recovered to the initial level after stopping the introduction of H2O. These results suggest that the deactivation of MCT by H2O is reversible, which may be attributed to the competitive adsorption between H2O and reactants rather than the destruction of the active sites [20].
Figure 3b shows the effect of SO2 on the SCR performance of three catalysts at 200 °C. NOx conversion of MCT-R is below 90% after SO2 introduction for 4 h, whereas that of MCT-C and MCT-P is below 90% after SO2 introduction for 2 h. Notably, the NOx conversion of MCT-R reduces to 70% after 8 h, whereas that of MCT-C and MCT-P decreases to 56% and 51%, respectively. Additionally, the NOx conversion of all the catalysts remains unchanged after stopping the introduction of SO2. These results indicate that the catalyst’s deactivation resulting from SO2 poisoning is irreversible, consistent with the results reported by Li et al. [21]. It is widely recognized that there are two main reasons for the irreversible deactivation of the catalyst poisoned by SO2. One is that the formation of ammonium sulfate ((NH4)2SO3) and/or ammonium bisulfate (NH4HSO4) covers the active sites and blocks the pores of the catalyst. The other one is that the active component of the catalysts undergoes sulfation, forming inactive sulfates. For the Mn-based catalysts, it is generally accepted that the latter poisoning effect is more serious than the former [22,23]. Notably, Shi et al. [24] found that the metal sulfates are more easily formed on MnOx-CeO2-TiO2, whereas (NH4)2SO3 and NH4HSO4 are rarely formed. Furthermore, Zhang et al. [25] reported that the formation of sulfate species is temperature-dependent. At a low temperature (100 °C), the deposition of (NH4)2SO3 and NH4HSO4 on MnOx-CeO2-TiO2 by SO2 is dominant, whereas the deactivation predominantly caused by the sulfation of the active components occurs at a high temperature (200 °C). Therefore, the irreversible deactivation of Mn-Ce/TiO2 observed in the work is mainly due to the sulfation of active components, leading to the formation of inactive sulfates.
In summary, MCT-R prepared in this work exhibits excellent low-temperature de-NOx activity, a broader operational temperature window, and superior resistance to H2O and SO2. It provides a good reference for efficiently solving the existing shortcomings of an MCT catalyst mentioned in Section 1 (Introduction).

2.3. Separate Oxidation of NO and NH3
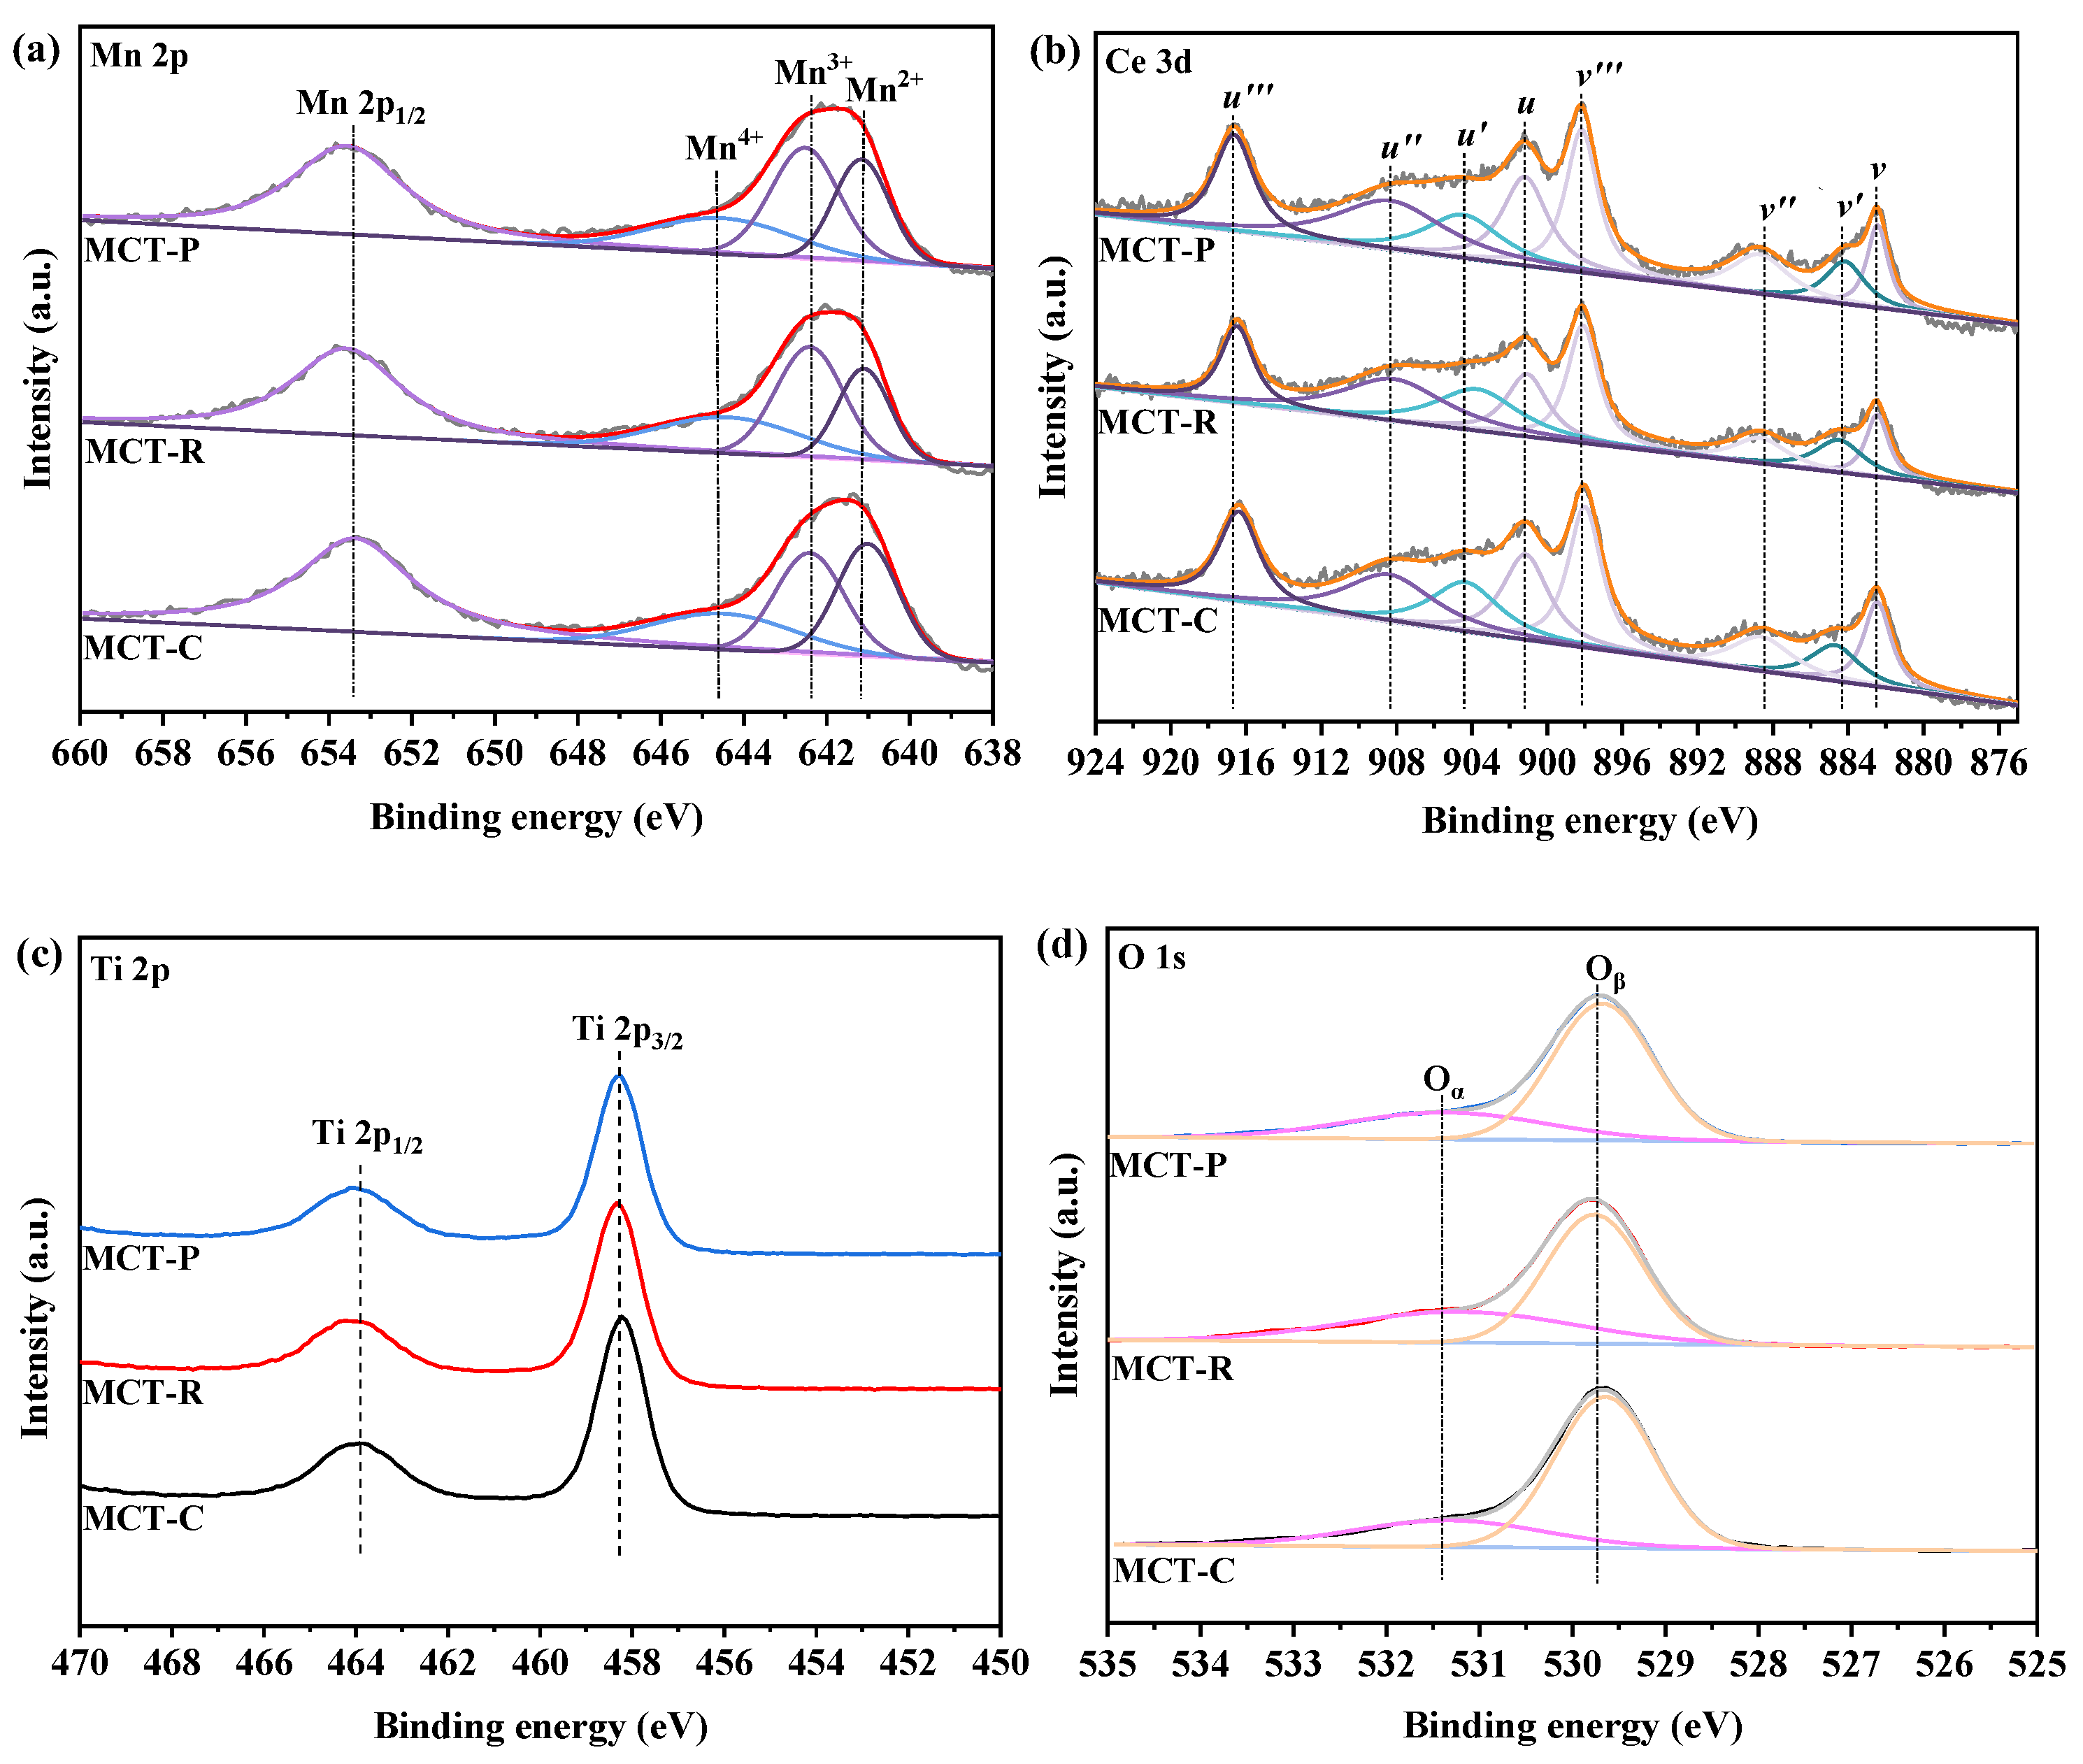
As shown in Figure 4a, negligible conversion of NH3 can be observed over MCT-C, MCT-R, and MCT-P at temperatures below 150 °C. The NH3 conversion of MCT-C and MCT-P increases at 200–300 °C and reaches almost 90% at 300 °C. Conversely, MCT-R has much higher activity in NH3 oxidation, which rises sharply in the range of 150–300 °C. Overall, the NH3 oxidation conversion of the catalysts abided by the order of MCT-R > MCT-C ≥ MCT-P, indicating that MCT-R possessed the strongest NH3 oxidation ability.
It has been widely recognized that the oxidation of NO to N2O can improve the de-NOx activity through the “Fast SCR” reaction (2NH3 + NO + NO2 → 2N2 + 3H2O) [8]. It is noteworthy that the NO oxidation conversion of all the catalysts is similar at 50–150 °C (Figure 4b), which demonstrates that the “Fast SCR” reaction is not predominant in this temperature region. A similar phenomenon has also been reported on Sm-MnOx [26] and MnCoVOx [27]. Nevertheless, the NO oxidation conversion significantly differs at higher temperatures of 150–300 °C. Specifically, the NO oxidation conversion on MCT-C and MCT-P are similar, ranging from 10% to 40%, whereas MCT-R spans a broader range, from 10% to 70%. The NO oxidation conversion followed the order of MCT-R > MCT-C ≥ MCT-P, indicating that MCT-R exhibits the strongest activity of NO oxidation at higher temperatures.

2.4. XPS Analysis

The XPS analysis was employed to investigate the surface composition and chemical nature of MCT-C, MCT-R, and MCT-P. The Mn 2p, Ce 3d, O 1s, and Ti 2p spectra of the catalysts are exhibited in Figure 5. The corresponding peaks of each catalyst were fitted to the split peaks and the peak areas were used to calculate the relative concentration ratios of the different valence states of the elements, and the results are summarized in Table S2.
Figure 5a shows the XPS patterns of Mn 2p. The two distinct peaks centered at about 642.0 and 653.5 eV could be ascribed to Mn 2p3/2 and Mn 2p1/2, respectively [21]. The Mn 2p3/2 spectra could be fitted into three peaks of Mn4+ (644.86 ± 0.1 eV), Mn3+ (642.66 ± 0.1 eV), and Mn2+ (641.34 ± 0.1 eV) [21,28]. As can be seen from Table S2, the Mn4+/Mnn+ of MCT-R (29.8%) is higher than that of MCT-C (27.2%) and MCT-P (27.4%), suggesting that the reverse co-precipitation method improves the dispersion of high valence Mn species on the catalyst surface. According to the literature [29], Mn4+ species play a crucial role in the SCR reaction and are conducive to the de-NOx performance in low-temperature regions.
The Ce 3d XPS spectra of the catalysts are shown in Figure 5b. The peaks labeled as u′ (903.2 ± 0.1 eV) and v′ (885 ± 0.2 eV) correspond to Ce3+, while the peaks denoted as u (900.7 ± 0.1 eV), u″ (906.9 ± 0.2 eV), u″′ (916.4 eV), v (882.1 ± 0.1 eV), v″ (888.7 eV), and v″′ (897.9 ± 0.1 eV) correspond to Ce4+ [30,31]. It is widely recognized that Ce3+ facilitates the formation of oxygen vacancies and charge imbalance on the catalyst surface, which in turn promotes oxygen migration from the bulk to the surface, thereby improving SCR activity [31]. From Table S2, the ratio of Ce3+/Cen+ (23.5%) over MCT-R is markedly higher than that of MCT-C (19.7%) and MCT-P (18.9%), demonstrating that the formation of Ce3+ species is promoted by the reverse co-precipitation method and consequently improves the NH3-SCR activity.
For the Ti 2p spectrum, it can be fitted into two kinds of peaks, as shown in Figure 5c. The binding energies located at 464.5 eV and 458.6 eV correspond to Ti 2p1/2 and Ti 2p3/2, respectively, which are characteristic of the Ti4+ species [21].
Figure 5d shows the XPS spectra of O 1s. It can be deconvoluted into two characteristic peaks at 530–530.5 eV and 531.5–531.8 eV, which are attributed to the lattice oxygen (denoted as Oβ) and surface chemisorbed oxygen (denoted as Oα), respectively [10,28]. It is well known that compared to Oβ species, the higher oxygen mobility and reactivity are obtained on Oα species [19]. As shown in Table S2, the Oα/O (36.1%) ratio of the MCT-R catalyst is significantly higher than that of MCT-C (25.7%) and MCT-P (28.1%), indicating that the catalyst prepared by the reverse co-precipitation method has much more surface chemisorbed oxygen species (Oα).

2.5. H2-TPR

H2-TPR profiles of MCT-C, MCT-R, and MCT-P catalysts are illustrated in Figure 6. For the MCT-C and MCT-P, the peaks at 335 °C (375 °C) and 365 °C (410 °C) may be attributed to the reduction of MnO2 → Mn2O3 and Mn2O3 → Mn3O4, respectively, and the reduction peak at 430 °C (465 °C) may be attributed to the overlapping reduction of Mn3O4 → MnO and surface CeO2. Notably, MCT-R shows a broader overlapping peak at 150–450 °C, which can be attributed to the successive reduction of MnOx species (MnO2 → Mn2O3 → Mn3O4) and the reduction of surface CeO2 species [32]. The appearance of seriously overlapping peaks over MCT-R can be attributed to the strong interaction between MnOx, CeOx, and TiO2 as evidenced by the results of XRD.
For the temperatures of the reduction peaks, the highest reduction temperature is observed on MCT-P, indicating the worst redox ability of MCT-P. Evidently, the reduction temperature of MCT-R is the lowest. The shift of the reduction peak towards lower temperatures implies better redox properties of MnOx and CeO2 of MCT-R [31]. Clearly, the optimal redox ability is obtained on MCT-R due to the synergistic effect of MnOx, CeOx, and TiO2 [4].

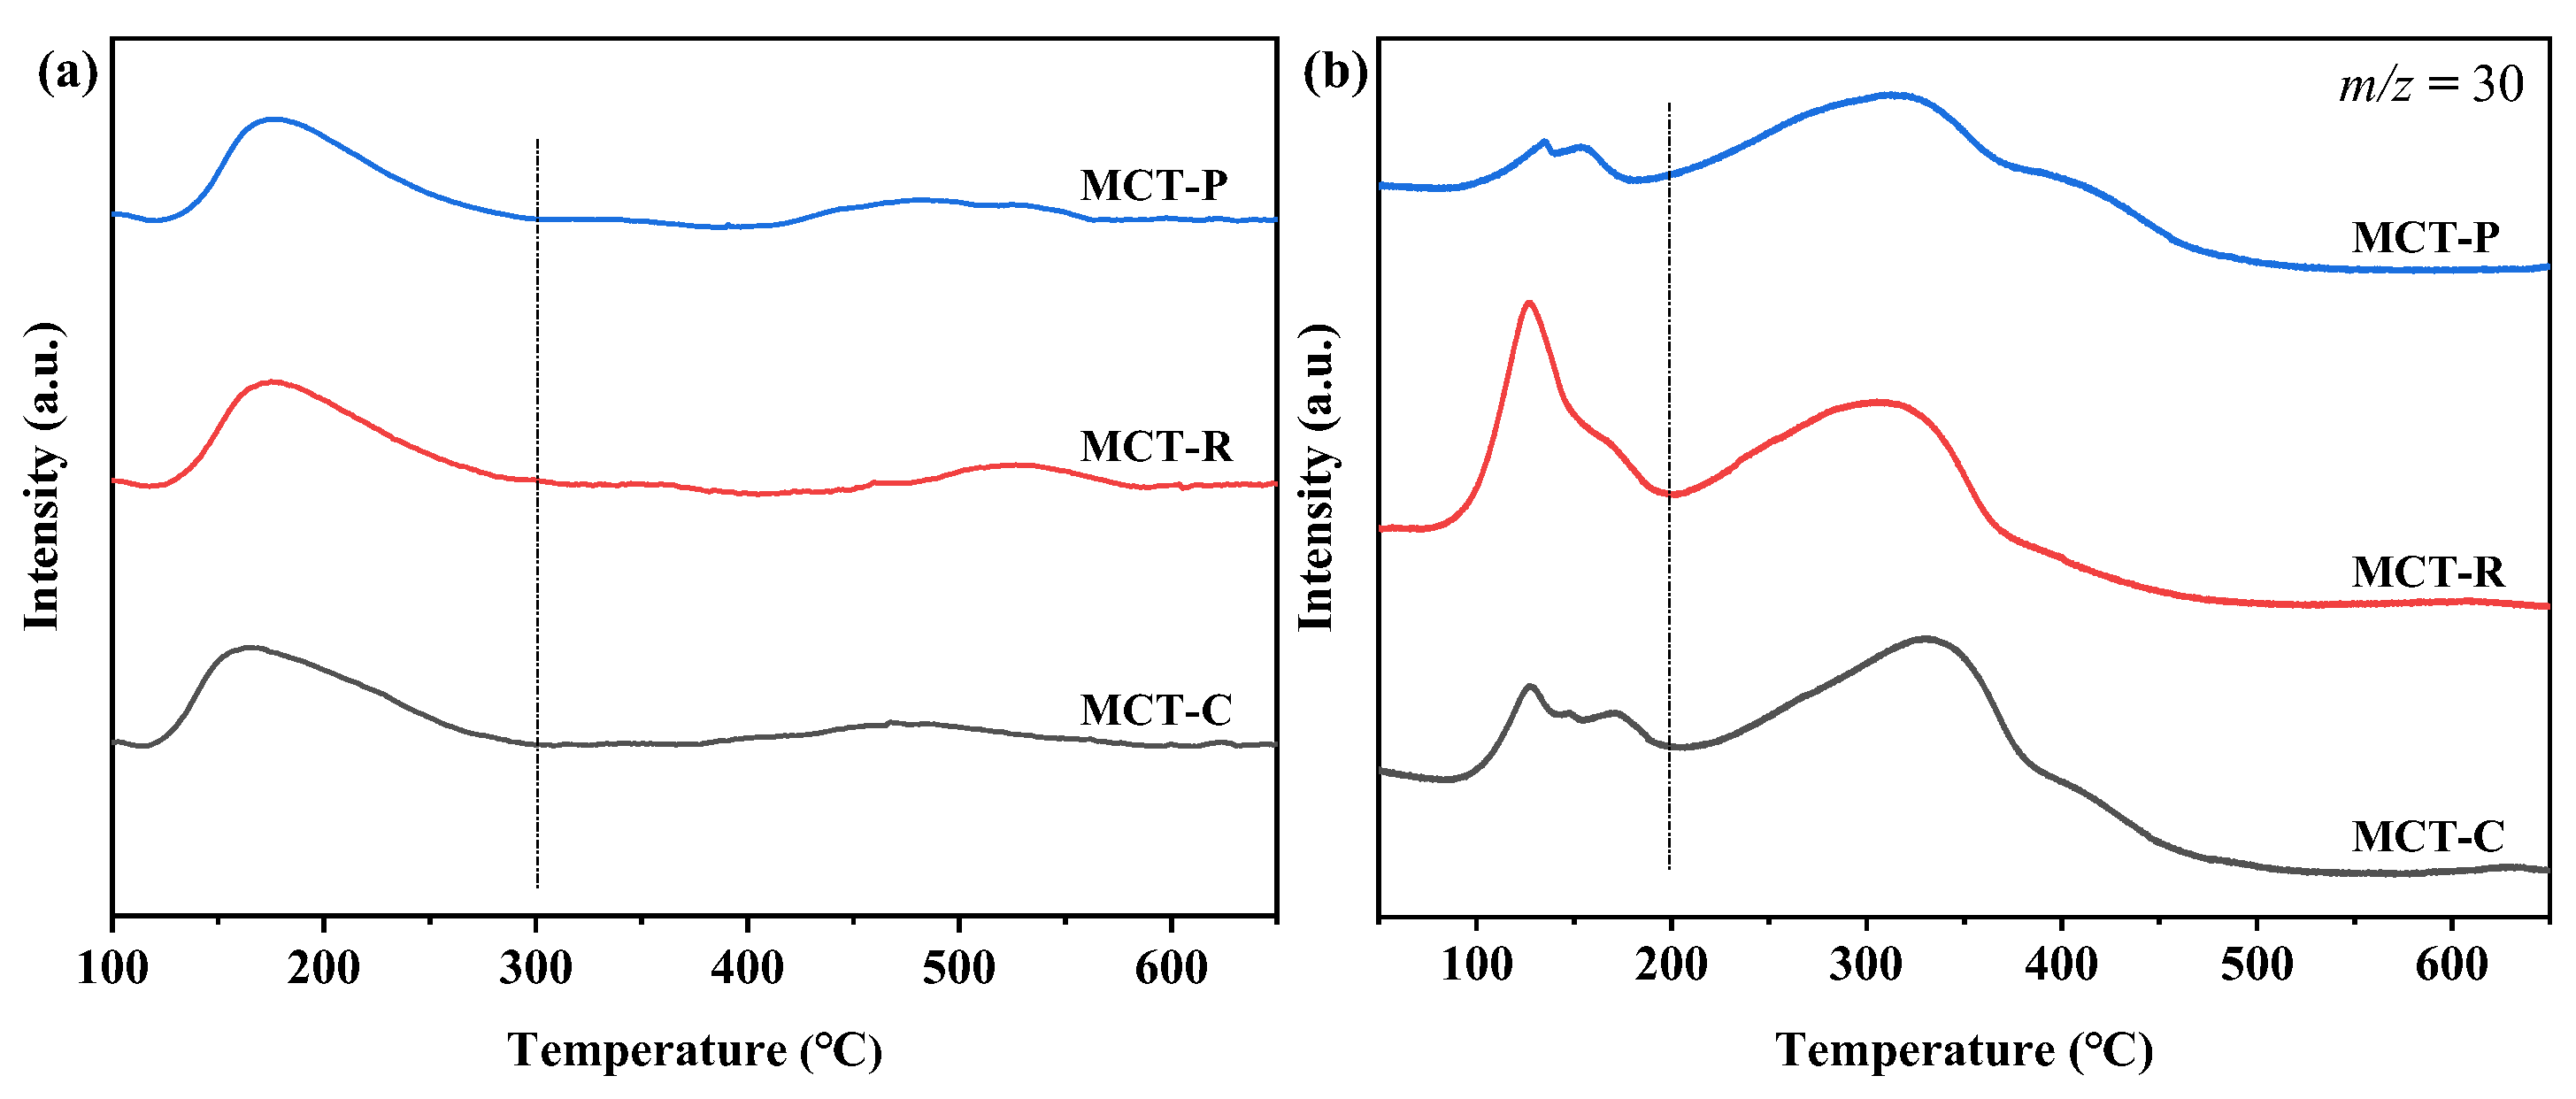
2.6. TPD Analyses for NH3 and NO

The adsorption abilities of NH3 on MCT-C, MCT-R, and MCT-P catalysts were investigated by the NH3-TPD experiment. As can be observed from Figure 7a, there are two distinct NH3 desorption peaks for each catalyst, which correspond to weak desorption peaks (100–300 °C) and middle-strong desorption peaks (300–500 °C), respectively [33]. Additionally, the normalized desorption peak areas S (a.u.) of all the investigated catalysts follows the order of MCT-R (1.00) > MCT-C (0.97) > MCT-P (0.85), indicating the more acidic peak sits on MCT-R.
Figure 7b shows the NO-TPD profiles of MCT-C, MCT-R, and MCT-P catalysts. Apparently, NO desorption on all catalysts can be divided into two zones between 50 and 650 °C. The peaks below 200 °C could be attributed to the decomposition of monodentate nitrite/nitrate species, whereas the broad peaks above 200 °C are due to the decomposition of bridging nitrate species and bidentate nitrate species with higher thermal stability [34]. Additionally, the desorption peak areas of NO at 100–200 °C were calculated, and the normalized peak areas (a.u.) follow the sequence of MCT-R (1.00) > MCT-C (0.87) > MCT-P (0.60).

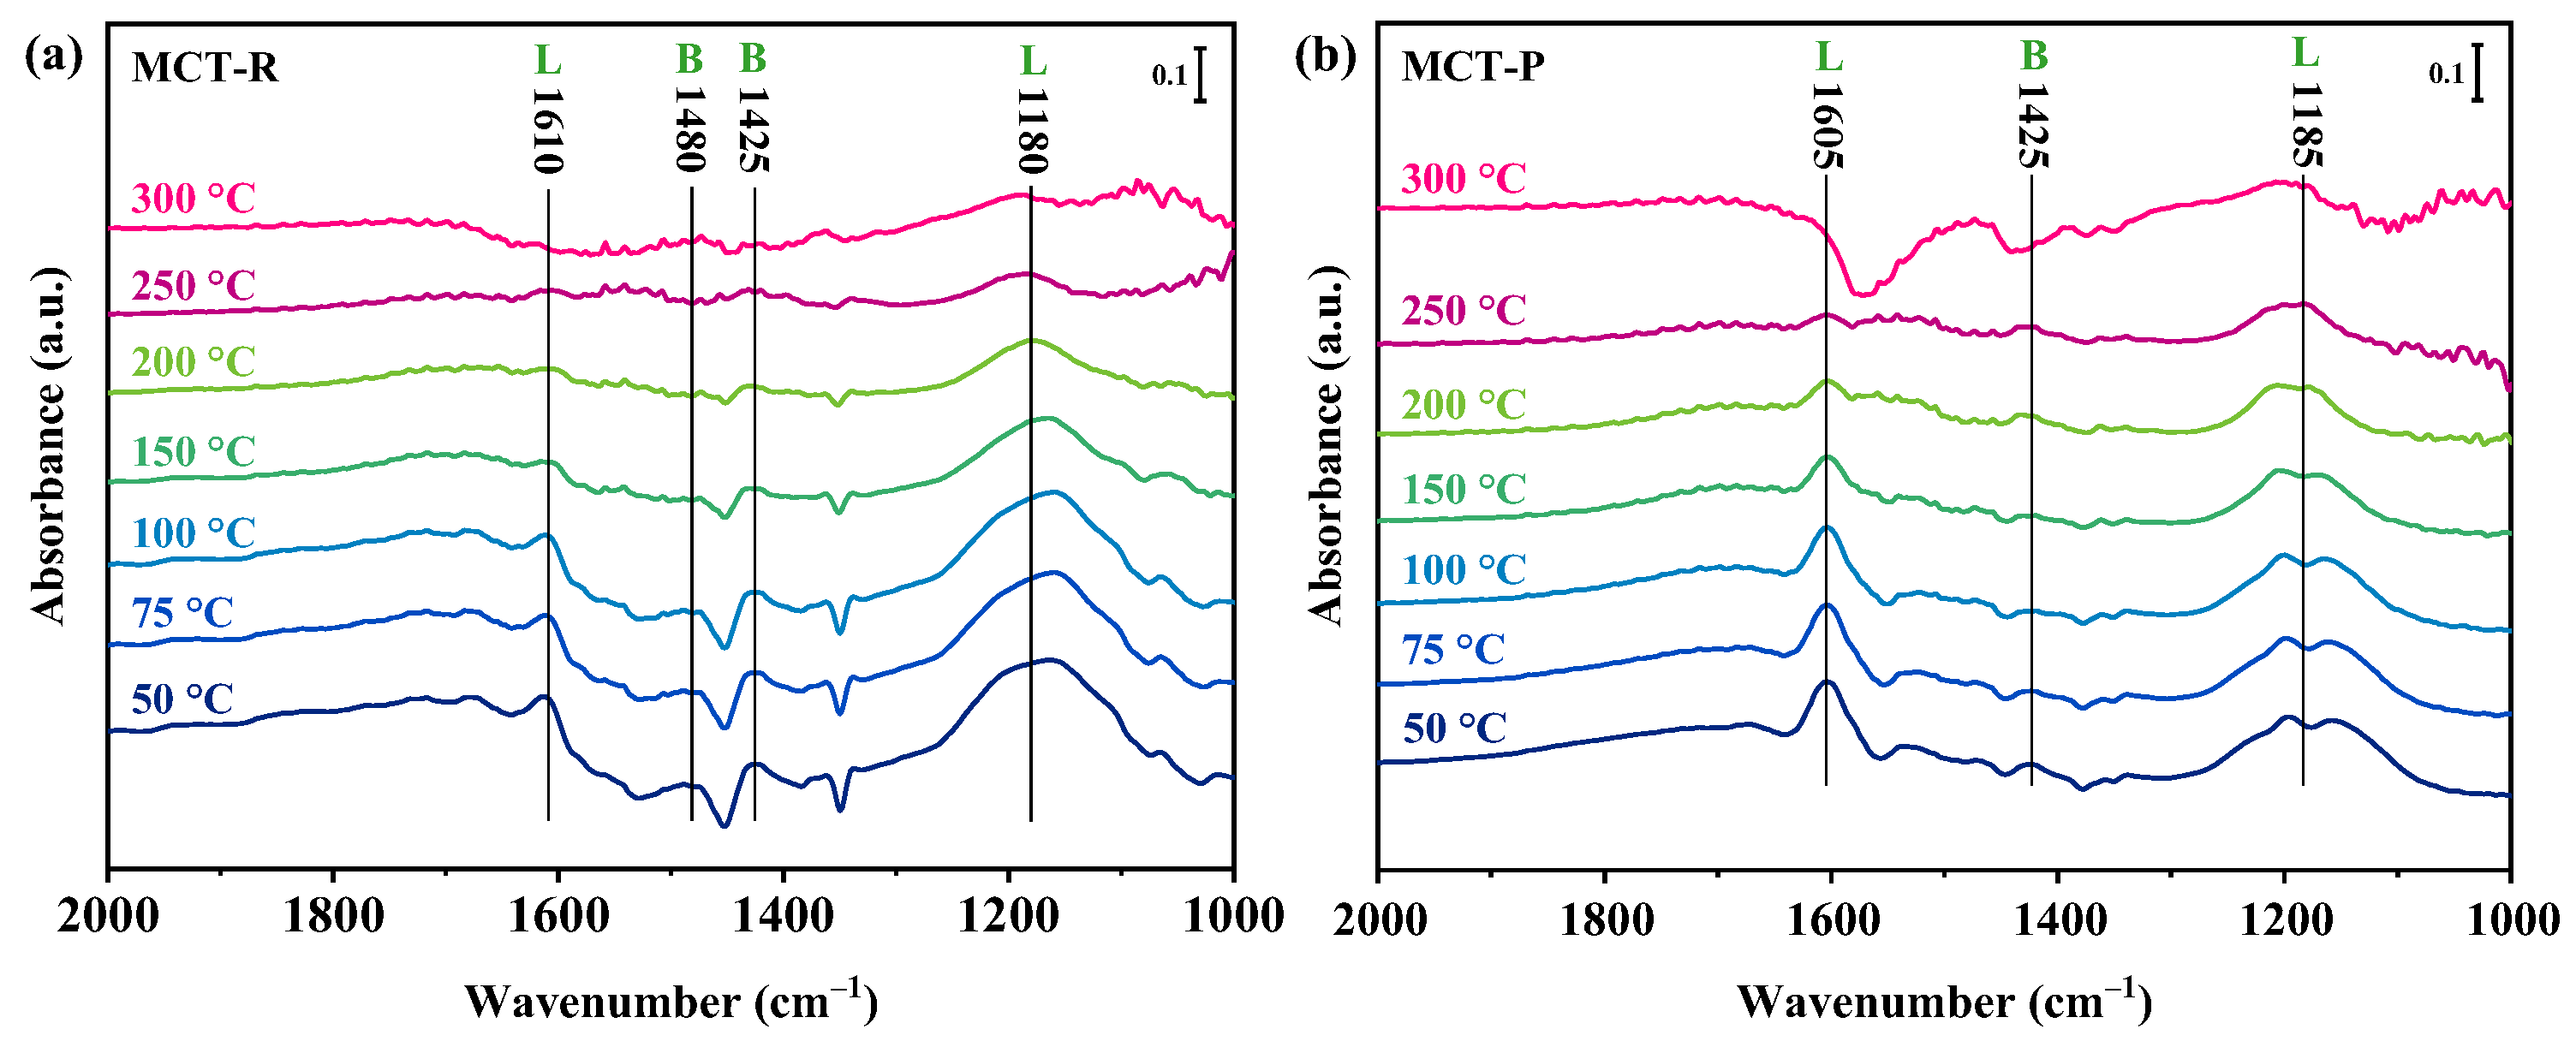
2.7. In Situ DRIFTs Characterization

2.7.1. Adsorption of NH3 Species

As shown in Figure 8, in situ DRIFTs spectra of NH3 adsorption on MCT-R and MCT-P catalysts at different temperatures were recorded. It can be observed that there are several bands in the range of 1000–2000 cm−1. The bands at 1180 cm−1 (1185 cm−1) and 1610 cm−1 (1605 cm−1) are assigned to NH3 species on Lewis acid sites, and those at 1425 cm−1 and 1480 cm−1 belong to NH4+ species on Brønsted acid sites [13,35]. The bands of NH3 species on the Lewis acid site remained present at the high temperature (300 °C), whereas those on the Brønsted acid sites disappeared gradually with increasing temperature and completely after 200 °C. Furthermore, the peak intensity of NH3 adsorbed on Lewis acid sites is significantly stronger than on Brønsted acid sites. These results indicate that Lewis acid sites have stronger thermal stability and dominate the acid sites on both catalysts. Clearly, under the same scale, the band intensities of adsorbed NH3 species on MCT-R are all significantly stronger than those on MCT-P, proving that MCT-R exhibits more active sites for NH3 adsorption [36].

2.7.2. Adsorption of NOx Species

As shown in Figure 9, in situ DRIFT spectra of NO adsorption on MCT-R and MCT-P at different temperatures were recorded. The bands at 1278 cm−1 (1290) cm−1, 1355 cm−1, 1510 cm−1 (1140 cm−1 and 1580 cm−1), 1620 cm−1 (1615 cm−1), and 1700 cm−1 can be ascribed to monodentate nitrate, monodentate nitrite, bidentate nitrate, bridged nitrate, and adsorbed NO species, respectively [37,38]. The bands of monodentate nitrate (1278(1290) cm−1) weakened with increasing temperature and finally disappeared at 250 °C owing to the poor thermal stability. In contrast, the bands of bidentate nitrate (1510 cm−1) and bridging nitrate (1620(1615) cm−1) species are still present at 300 °C. Notably, the bands of bidentate nitrate species at 1140 cm−1 and 1580 cm−1 appeared on MCT-R at higher temperatures, which may be due to the conversion of monodentate nitrite and monodentate nitrate to thermally more stable bidentate nitrate species at higher temperatures [39]. Additionally, the number of adsorption peaks on MCT-R is significantly greater than that on MCT-P, indicating the presence of more different types of NOx intermediates on MCT-R.

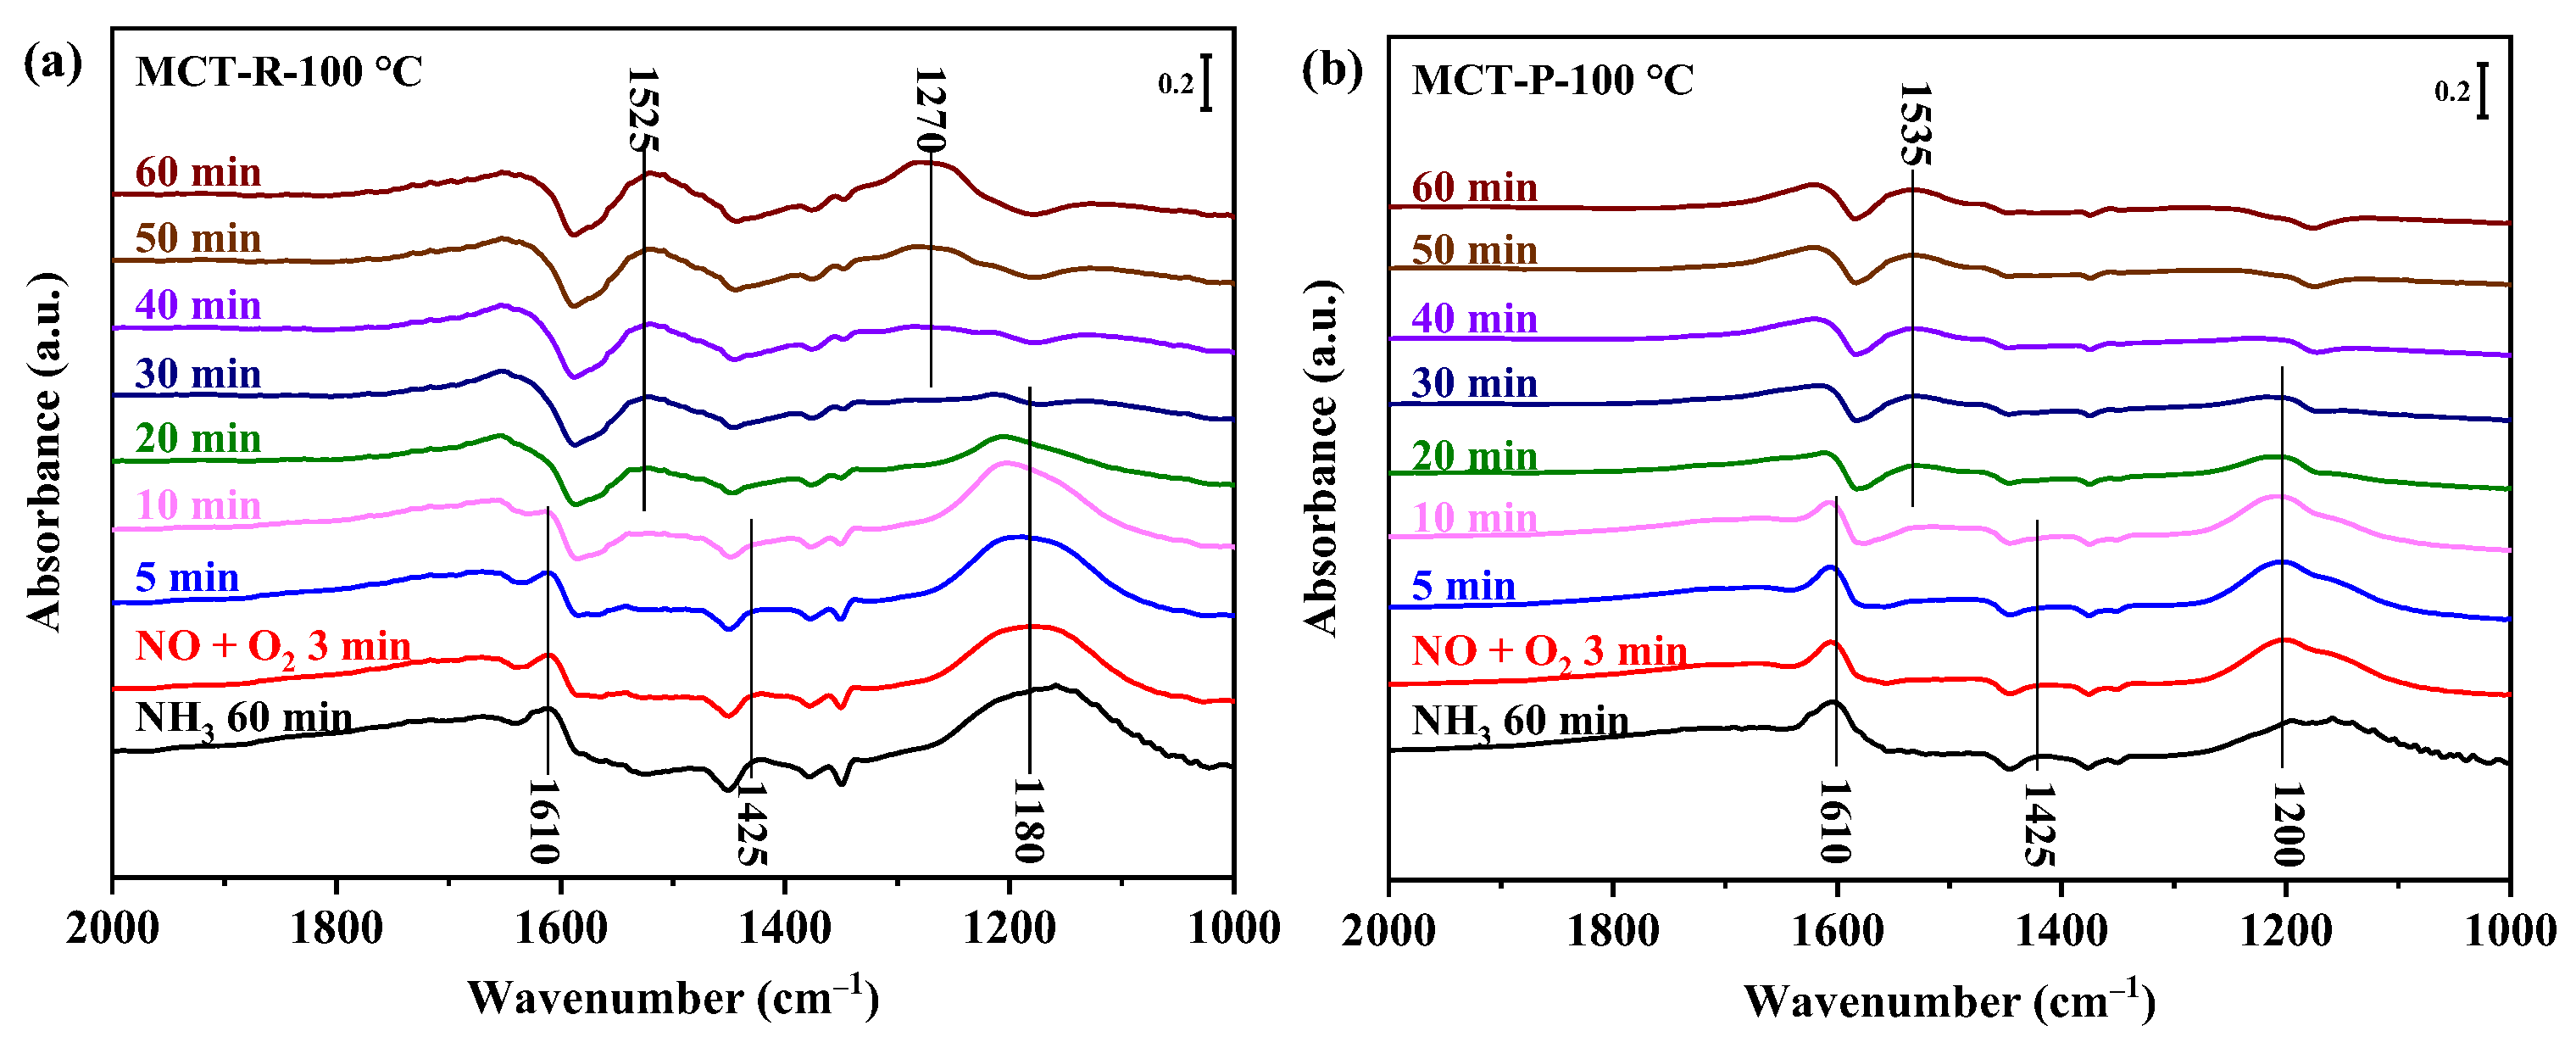
2.7.3. Reaction between NOx and Pre-Adsorbed NH3 Species

Figure 10 shows in situ DRIFT spectra of the reaction between NOx and pre-adsorbed NH3 species on MCT-R and MCT-P catalysts at 100 °C. As presented in Figure 10a, the NH3 species absorbed on Lewis acid sites (1180 and 1610 cm−1) and Brønsted acid sites (1425 cm−1) can be detected after NH3 was introduced for 60 min. The peaks at 1180, 1425, and 1610 cm−1 disappeared at 30 min, 10 min, and 10 min after the introduction of NO and O2 mixtures, respectively. With the continuous introduction of NO and O2 mixtures, the characteristic bands of monodentate nitrate (1270 cm−1) and bidentate nitrate (1525 and 1535 cm−1) species appear on the catalyst surface. These results suggest that all NH3 species can react with NOx via the Eley–Rideal (E-R) mechanism [26,40]. A similar situation for the reaction between NOx and pre-adsorbed NH3 species can be observed on MCT-P. Differently, the band intensity at 1180 cm−1 on MCT-R is stronger than that on MCT-P, suggesting more adsorption of NH3 species on MCT-R and thus promoting the elimination of NOx by the E-R route for NH3-SCR.

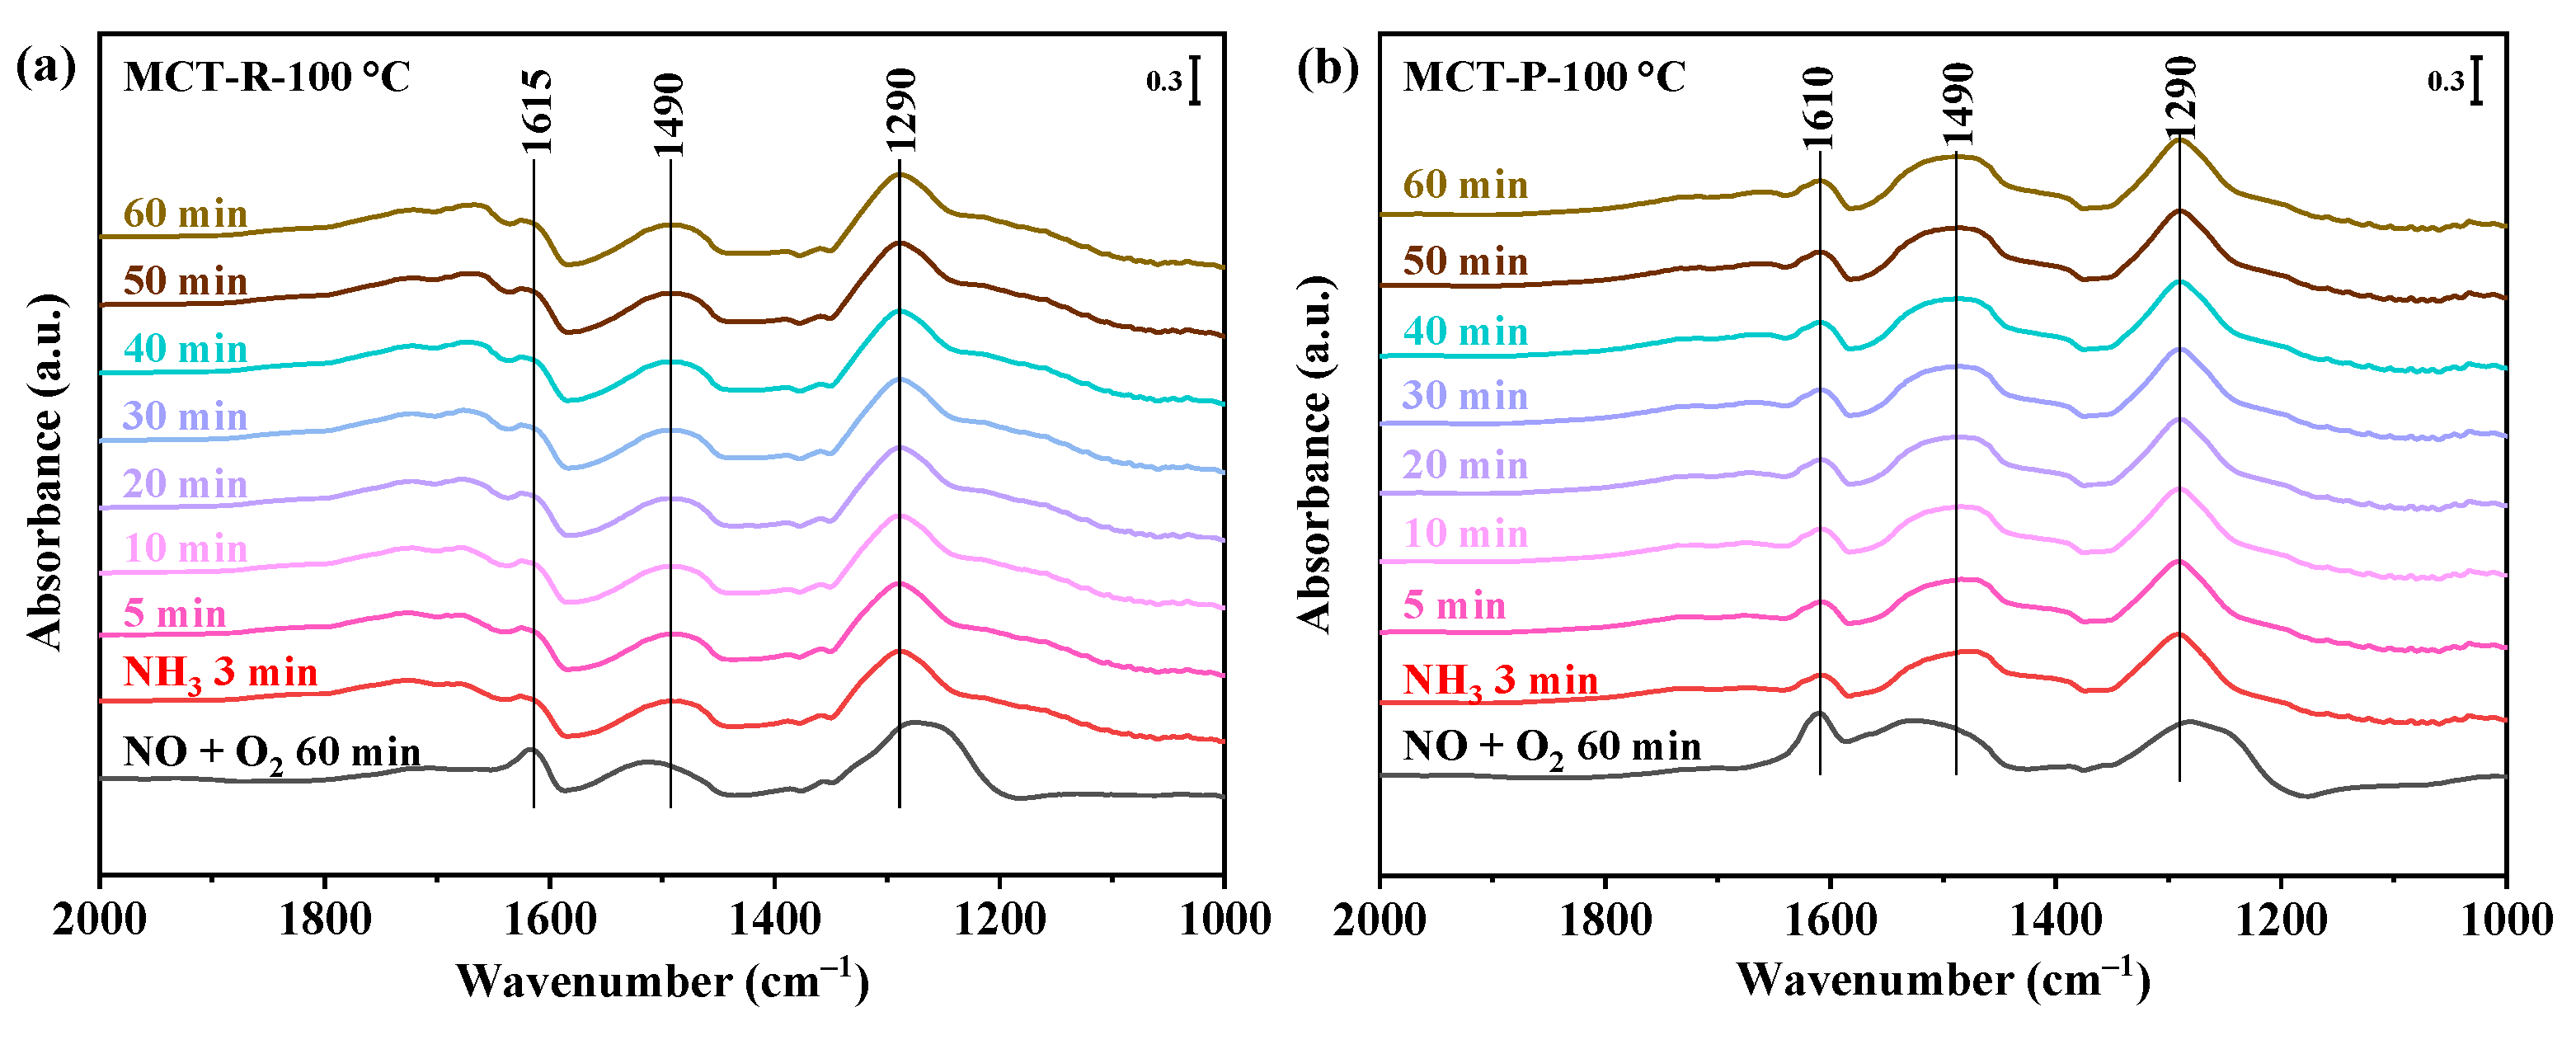
2.7.4. Reaction between NH3 and Pre-Adsorbed NOx Species

Figure 11 shows in situ DRIFT spectra of the reaction between NH3 and pre-adsorbed NOx species on MCT-R and MCT-P at 100 °C. After the catalysts were pretreated in a mixture of NO and O2, the bands of monodentate nitrate (1290 cm−1), bidentate nitrate (1490 cm−1), and bridged nitrate (1610(1615) cm−1) species can be detected. With the introduction of NH3, the bridged nitrate species at 1615(1610) cm−1 is gradually consumed, whereas the monodentate nitrate at 1290 cm−1 and the bidentate nitrate species at 1490 cm−1 remain almost unchanged. These observations demonstrate that bridged nitrate with higher reactivity can react with NH3 by the Langmuir–Hinshelwood (L-H) route for NOx elimination [41]. Significantly, the number of bridged nitrates species on MCT-R is significantly larger than that on MCT-P, indicating that MCT-R could provide more adsorption sites, and thus improve the activation capability.

2.8. Characterization of SO2-Poisoned Samples

As described in Section 2.2.2, MCT-R exhibits better resistance to SO2 poisoning than MCT-C and MCT-P. To explore the reason for the superior SO2 resistance of MCT-R, the SO2-poisoned MCT catalysts (MCT-C-S, MCT-R-S, and MCT-P-S) were characterized and discussed in the following sections.

2.8.1. N2 Adsorption–Desorption

As shown in Table 1, BET specific surface areas of MCT-C-S, MCT-R-S, and MCT-P-S decreased after SO2 poisoning, which may be attributed to the formation of metal sulfates that block the catalyst pore structure [23,42]. However, BET specific surface area and the pore volume of MCT-R-S (112.7 m2/g, 0.36 cm3/g) are still significantly higher than those of MCT-C-S (79.3 m2/g, 0.18 cm3/g) and MCT-P-S (39.4 m2/g, 0.19 cm3/g). This phenomenon might be explained by the fact that the reverse co-precipitation method could enhance the dispersion of sulfate species due to a larger BET specific surface area. Further evidence will be introduced in the XPS analysis described in Section 2.8.2.

2.8.2. XPS Analysis

To investigate the impact of SO2 on the chemical states of Mn, Ce, Ti, and O atoms on the surfaces of MCT-R, MCT-C, and MCT-P, XPS techniques were utilized and the results are depicted in Figure S3. After peak fitting deconvolution, the XPS spectra for various elements were resolved into multiple peaks. The relative ratios of different oxidation states were calculated based on peak areas and summarized in Table S2.
The Mn 2p spectra of SO2-poisoned catalysts are shown in Figure S3a. Compared to fresh catalysts, the higher ratios of Mn2+/Mnn+ are observed on the corresponding poisoned catalysts due to the generation of MnSO4 [23], which induces a decrease in the relative ratios of Mn4+/Mnn+ and Mn3+/Mnn+ (Table S2). Therefore, a decreasing trend of NH3-SCR activity occurred after SO2 was introduced into the SCR system. Mn4+ species as an active species; the relative ratios of Mn4+/Mnn+ of MCT-R-S (26.9%) were also higher than that of MCT-C-S (26.2%) and MCT-P-S (25.7%).
Figure S3b shows the XPS patterns of Ce 3d on SO2-poisoned catalysts. Ce4+ species can react with SO2 to generate Ce2(SO4)3 species by 2CeO2 + 3SO2 + O2 → Ce2(SO4)3 [43]. Ce2(SO4)3 species can deposit on the catalyst’s surface or active sites, obstructing de-NOx performance [21]. As shown in Table S2, the relative ratio of Ce3+/Cen+ increased for all the SO2-poisoned catalysts. Especially, compared to MCT-C-S and MCT-P-S, the smallest increase in the relative concentration of Ce3+ species is observed on MCT-R-S, revealing the least formation of Ce2(SO4)3 species.
Figure S3c shows Ti 2p spectra of SO2-poisoned catalysts, and the form of Ti4+ and the corresponding binding energy were not affected by introducing SO2.
In Figure S3d, the O 1s XPS spectra of the SO2-poisoned catalysts shift to higher binding energies compared to the fresh catalysts, and more surface chemisorbed oxygen (Oα) species are detected on the SO2-poisoned catalysts due to the formation of sulfate species [44,45]. Notably, the increased degree of Oα in MCT-R-S (3.3%) is remarkably lower than that of MCT-P-S (11.3%) and MCT-C-S (11.1%). This result reasonably accounts for the superior sulfur resistance of MCT-R-S since the formed sulfate species would cover the active sites, consequently resulting in a decrease in catalytic activity compared to the fresh catalysts [45,46].
Figure S3e shows the XPS profile of S 2p over SO2-poisoned catalysts. Two peaks assigned to SO42− (~169.3 eV) and SO32− (~168.2 eV) are observed on the S 2p spectra [23,47]. The S content of MCT-C-S, MCT-R-S, and MCT-P-S is 2.8%, 3.2%, and 3.1%, respectively, as shown in Table S2. This observation indicates that metal sulfate substances do exist in the catalysts after SO2 poisoning, and the amount of metal sulfates is similar. However, the BET specific surface area of MCT-R-S (112.7 m2/g) is much larger than MCT-C-S (79.3 m2/g) and MCT-P-S (39.4 m2/g) in Table 1, contributing to the dispersion of sulfate species and alleviating the poisoning effect of SO2 on the catalyst [23]. Additionally, the results of S atom/m2 were calculated as follows: MCT-P-S (0.079%) > MCT-C-S (0.035%) > MCT-R-S (0.028%). The results indicated that the lowest S atomic ratio per unit surface area is found on MCT-R-S, suggesting that S coverage is lower on MCT-R-S, thereby exhibiting the best SO2 resistance.

2.9. Promotional Effect of Reverse Co-Precipitation on the Catalytic Performance of MCT

Compared to MCT-C and MCT-P, excellent catalytic performance in NH3-SCR is exhibited on MCT-R, with above 90% NOx conversion achieved at 100–300 °C. Additionally, optimal resistance to H2O/SO2 is also demonstrated by MCT-R. The excellent catalytic performance of MCT-R can be attributed to highly dispersed active sites and the higher BET specific surface area; higher contents of Mn4+, Ce3+, and Oα; stronger reducibility; and more amounts of active NH3 and active bidentate nitrate species, which will be discussed in detail as follows.
Ⅰ. Activity
(1) Textural and structural properties: It is well-known that the dispersion of active sites is crucial for catalyst performance [48,49]. No diffraction peaks corresponding to Ce species and only weak diffraction peaks for Mn and Ti species are detected on the MCT-R in Figure 1a, suggesting that the Mn, Ce, and Ti oxides are highly dispersed on MCT-R [19,50]. On the other hand, the higher dispersion of the components favors the increase in the BET specific surface area [18,48,49]. The large BET specific surface area contributes to the contact between the active sites and reactive gases, enhancing the adsorption and activation of the reactants [41,50]. Evidently, the BET specific surface area of MCT-R (141.6 m2/g) is significantly higher than that of MCT-C (97.9 m2/g) and MCT-P (54.0 m2/g), as shown in Table 1. Thus, an efficient NOx conversion was obtained over MCT-R.
(2) Adsorption and activation of reactants: The superior redox capability of Mn4+ enhances NOx removal at low temperatures, and Ce3+ species quickly engage in the Ce-Mn redox cycle (Mn3+ + Ce4+ ↔ Mn4+ + Ce3+) with Oα species to accelerate NOx conversion [10,31,51]. Obviously, the XPS results reveal that the relative ratios of Mn4+, Ce3+, and Oα species on MCT-R are significantly higher than those in MCT-C and MCT-P (Table S2), suggesting that more active sites are exhibited on MCT-R. Meanwhile, the abundant active sites are in favor of NOx and NH3 adsorption [31,52]. Both NH3 and NO desorption amounts are higher over MCT-R compared to MCT-C and MCT-P, which can be reflected in the NH3/NO-TPD results (Figure 7). Moreover, the lower reduction temperatures are also observed on MCT-R (Figure 6), which implies the stronger reducibility on MCT-R. Notably, the excellent redox properties can activate adsorbed species and the activated active species to generate active intermediates [32,53]. Compared with MCT-P, the amount of active NH3 species and active bidentate nitrate species is much higher over MCT-R, as shown in Figure 8 and Figure 9, which is also one of the reasons for achieving excellent de-NOx activity.
Ⅱ. SO2 resistance
The formation and coverage of metal sulfates on the active sites have been regarded as the main reasons for the deactivation of Mn-based catalysts by SO2 poisoning [41,54,55]. Additionally, the larger BET specific surface can reduce the coverage of sulfate species on active sites owing to their higher dispersion [56,57]. In this study, the larger BET specific surface of MCT-R-S reduces the coverage of sulfate species, as shown in Table 1. As a result, the relative proportions of Ce3+/Cen+ and Mn4+/Mnn+ are higher on MCT-R-S compared to MCT-C-S and MCT-P-S (Table S2), resulting in a higher exposure of the active sites and maintaining relatively high activity.

3. Materials and Methods

3.1. Catalyst Preparation

MnCeTiOx catalysts were prepared by the co-precipitation method with different adding modes. The conventional co-precipitation method is as follows: Firstly, TiCl4 (≥99%, Adamas) was slowly added to the C2H5OH (≥99.7%, Adamas) in an ice water bath with vigorous stirring until well mixed. Subsequently, a certain amount of Mn(NO3)2 (50% aqueous solution, Adamas) and Ce(NO3)3·6H2O (≥99.99%, Adamas) were dissolved in the above solution. The aqueous solution formed by the dissolution of (NH4)2CO3 (≥40%, Adamas) was used as the precipitant and slowly added to the above mixture and stirred at the temperature of 30 °C until the pH value reached 8. After aging at 30 °C for 24 h, the resulting precipitate was filtered and washed with deionized water several times. Finally, the sample was dried in an oven at 80 °C for 12 h and then calcined at 500 °C for 4 h in a muffle furnace, and the obtained catalyst was denoted as MCT-C. Similar to the above steps, the reverse co-precipitation method involves the slow dropwise addition of the above metal salt solution to the (NH4)2CO3 solution, and the resulting catalyst was denoted as MCT-R. The parallel co-precipitation method involves simultaneously adding the above metal salt solution and the (NH4)2CO3 solution dropwise to a beaker containing a small amount of deionized water, and the resulting catalyst was denoted as MCT-P. According to previous works [13,31], the optimal ratio of Mn:Ce:Ti is 0.4:0.1:1 in the MnCeTiOx catalyst. Therefore, the molar ratio of Mn:Ce:Ti is a constant (0.4:0.1:1) in the work. Considering the toxicity of TiCl4, the experiments were conducted in a fume hood. Meanwhile, personal protective equipment including gloves, masks, and goggles was worn to reduce the risk.

3.2. Characterization

The N2 adsorption and desorption isotherm curves of the catalysts were measured using an ASAP 2020 HD88 adsorption device manufactured by Micromeritics, Inc. (Norcross, GA, USA). About 0.1 g of sample was degassed at 200 °C for 10 h under vacuum, followed by N2 adsorption and desorption at –196 °C in liquid nitrogen. The specific surface area was determined using the BET model, while the pore volume and pore diameter were determined using the BJH model.
The X-ray diffraction patterns of the catalysts were measured using an X-ray diffractometer model XRD-6100 from Shimadzu, Japan. The diffractometer was scanned using Cu-Kα rays at an operating current and voltage of 40 mA and 40 kV with a rate of 7°/min and an angle 2θ of 10–70°. A Zeiss Gemini 300 scanning electron microscope was used for SEM analysis of the samples with a maximum operating voltage of 200 kV.
The X-ray photoelectron spectra of the catalysts were measured by an ESCALAB 250Xi photoelectron spectrometer from Thermo Scientific (Waltham, MA, USA) for the analysis of the surface elemental composition and valence states of each catalyst, using an Al Kα (1486.6 eV) target as the excitation source. The binding energy of each element measured was corrected using the C 1s peak (284.6 eV).
The temperature-programmed reduction experiments of the catalysts with H2 (H2-TPR) were carried out on a homemade device. First, 0.1 g of sample was loaded into a quartz reaction tube and pretreated with high purity nitrogen (99.999%) for 30 min at 300 °C to remove impurities and moisture from the catalyst surface, followed by cooling to 50 °C, switching the nitrogen to reducing gas (10% H2/N2) at a flow rate of 50 mL/min. The temperature was increased from 50 °C to 650 °C at a rate of 5 °C/min. The reduction curve was obtained from the change in the signal detected by the thermal conductivity cell detector (TCD) of the gas chromatograph (GC 9750, Fuli, China).
The temperature-programmed desorptions of NH3 or NOx pre-adsorbed on the catalysts were carried out on a homemade apparatus. Firstly, each catalyst was pretreated according to the same procedure as in the H2-TPR experiment. For NH3-TPD experiments, after the catalyst cooled to room temperature, the nitrogen gas was switched to an ammonia–nitrogen mixture (10% NH3/N2) at a flow rate of 30 mL/min. After 30 min, the physically adsorbed NH3 on the catalyst surface was blown off with nitrogen gas, and then the gas was passed into the gas chromatograph. The temperature was increased from 50 °C to 650 °C with a ramp rate of 10 °C/min. For the NO-TPD experiments, He was used for both pretreatment and purging, and after the catalyst was cooled to room temperature, the He was replaced by a mixture of NO/N2 (500 ppm NO) at a flow rate of 30 mL/min. The temperature was increased from 50 °C to 650 °C at a rate of 10 °C/min. The change of gas was detected on a mass spectrometer (Pfeiffer Vacuum Quadstar, 32-bit, Aßlar, Germany) during the temperature increase to obtain the desorption curve.
The in situ diffuse reflectance infrared Fourier transform spectra (DRIFTs) of the catalysts were measured using a Nicolet 6700 IR spectrometer (Waltham, MA, USA) with a cadmium mercury telluride detector, 64 spectral scans, and a resolution of 4 cm−1. The catalysts were loaded into a reaction cell with a window sheet of calcium fluoride (CaF2), and pretreatment in a nitrogen atmosphere occurred at 300 °C for 30 min. The spectra of samples were recorded under flowing N2 at the required temperatures and set as backgrounds. Afterward, the gas mixture (500 ppm NH3 or 500 ppm NO + 5 vol% O2, and N2 as the balanced gas) was introduced to the cell with a flow rate of 100 mL/min for 1 h, followed by N2 purge. For the reaction between pre-adsorbed NH3 and the mixture of NO and O2, the catalysts were first exposed to NH3 for 60 min, then N2 purging occurred for 30 min before introducing the mixture of NO and O2 into the reaction system. Similarly, the spectra of the transient reaction between pre-adsorbed NOx and NH3 on the catalysts at 100 °C were obtained by changing the introduction sequence of NH3 and the mixture of NO and O2.

3.3. Activity Tests

The NH3-SCR reaction was carried out in a fixed-bed quartz reaction tube (6 mm inner diameter, and 400 mm length). First, the catalyst was pressed and sieved to obtain particles with a grain size of 40–60 meshes to eliminate the impacts of mass transfer limitation. Then, 0.15 g of catalyst was placed into the reactor for each experiment. The simulated flue gas consisted of 500 ppm NO, 500 ppm NH3, 5 vol% O2, 10% H2O (when used), 50 ppm SO2 (when used), and N2 as balance gas. The total flow rate of the simulated flue gas was 200 mL/min, corresponding to a space velocity of 80,000 mL/(gcat·h). The concentrations of NO and NO2 in the outlet stream of the reactor were analyzed via a flue gas analyzer (Testo 340, Lenzkirch, Germany), and N2O concentration was detected by online gas chromatography (Panna, A91, China; Polymer Quaternary Ammonium (PQ) column). Catalytic activity testing was performed from 50 °C to 300 °C with a step of 50 °C, and reactant and product concentration in the reactor were determined after 30 min of stabilization at each temperature point. For the resistance experiments to H2O or SO2, the SCR reaction was required to stabilize for 2 h at 200 °C, and then H2O or SO2 was introduced into the simulated flue gas. The samples after the SO2 resistance testing were recovered and donated as MCT-C-S, MCT-R-S, and MCT-P-S, respectively. The NO and NH3 oxidation reaction performance test was also performed on the SCR reaction setup, but the reaction gas is slightly different, i.e., 500 ppm NO (when used), 500 ppm NH3 (when used), 5 vol% O2, and N2 as carrier gas.
NOx conversion (NOx = NO + NO2) and N2 selectivity were calculated by the following equations:
NO x   conversion   % = NO x in NO x out NO x in × 100 %
N 2   selectivity   % = 1 2 × N 2 O out NO x in + NH 3 in NO x out NH 3 out × 100 %
The conversion of NO oxidation, NH3 oxidation, and N2O selectivity were calculated by the following equations:
NO   conversion   % = NO in NO out NO in × 100 %
NH 3   conversion   % = NH 3 in NH 3 out NH 3 in × 100 %
N 2 O   selectivity % = 2 ×   N 2 O out NH 3 in NH 3 out × 100 %
The subscripts “in” and “out” indicate the inlet and outlet of the gas, respectively.

4. Conclusions

In summary, different adding modes have a great influence on the low-temperature catalytic activity and H2O/SO2 resistance of the MnCeTiOx catalyst prepared by the co-precipitation method. Among them, MCT-R possesses excellent catalytic performance at 100–300 °C and optimal resistance to H2O or SO2 at 200 °C. This remarkable SCR performance is attributed to the fact that the reverse co-precipitation can enlarge the specific surface area, promote the dispersion of MnOx and CeOx, and improve the redox capacity, as well as the activation of NOx and NH3. Excellent low-temperature de-NOx activity of the MnCeTiOx catalyst can be obtained simply and conveniently by changing the adding mode during the co-precipitation process, which is of great practical value for the preparation of the MnCeTiOx catalyst for denitrification.

Supplementary Materials

The following supporting information can be downloaded at: https://www.mdpi.com/article/10.3390/catal14100690/s1, Figure S1: SEM images of the MCT-C (a), MCT-R (b), and MCT-P (c) catalysts; Figure S2: (a) O, (b) Mn, (c) Ce, (d) Ti mapping of MCT-P; (e) O, (f) Mn, (g) Ce, (h) Ti mapping of MCT-R; (i), O (j), Mn (k), Ce, (l) Ti mapping of MCT-C; Figure S3: XPS spectra of SO2-poisoned catalysts: (a) Mn 2p, (b) Ce 3d, (c) Ti 2p, (d) O 1s, and (e) S 2p; Table S1: Performance comparison of MnCeTiOx catalysts for NH3-SCR reaction reported in the literature; Table S2: The contents of the element and the ratios of different valence states of the different catalysts.

Author Contributions

Conceptualization, X.Y. and H.X.; methodology, X.Y. and J.Y.; software, X.Y. and L.W.; validation, H.X., L.H. and D.M.; formal analysis, X.Y. and L.W.; investigation, X.Y. and H.X.; resources, D.M.; data curation, L.W.; writing—original draft preparation, X.Y.; writing—review and editing, H.X., L.H. and D.M.; visualization, X.Y.; supervision, J.Y.; project administration, D.M.; funding acquisition, D.M. All authors have read and agreed to the published version of the manuscript.

Funding

This work was financially supported by the Alliance Project of Shanghai City in China (No. LM201641).

Data Availability Statement

Data are contained within the article or Supplementary Materials.

Conflicts of Interest

The authors declare no conflicts of interest.

References

  1. Li, Q.; Li, X.; Li, W.; Zhong, L.; Zhang, C.; Fang, Q.Y.; Chen, G. Effect of preferential exposure of anatase TiO2 {0 0 1} facets on the performance of Mn-Ce/TiO2 catalysts for low-temperature selective catalytic reduction of NOx with NH3. Chem. Eng. J. 2019, 369, 26–34. [Google Scholar] [CrossRef]
  2. Wang, F.M.; Shen, B.X.; Zhu, S.W.; Wang, Z. Promotion of Fe and Co doped Mn-Ce/TiO2 catalysts for low temperature NH3-SCR with SO2 tolerance. Fuel 2019, 249, 54–60. [Google Scholar] [CrossRef]
  3. Han, L.P.; Cai, S.X.; Gao, M.; Hasegawa, J.Y.; Wang, P.L.; Zhang, J.P.; Shi, L.Y.; Zhang, D.S. Selective catalytic reduction of NOx with NH3 by using novel catalysts: State of the art and future prospects. Chem. Rev. 2019, 119, 10916–10976. [Google Scholar] [CrossRef]
  4. Leng, X.S.; Zhang, Z.P.; Li, Y.S.; Zhang, T.R.; Ma, S.B.; Yuan, F.L.; Niu, X.Y.; Zhu, Y.J. Excellent low temperature NH3-SCR activity over MnaCe0.3TiOx (a = 0.1–0.3) oxides: Influence of Mn addition. Fuel Process. Technol. 2018, 181, 33–43. [Google Scholar] [CrossRef]
  5. Xue, H.Y.; Guo, X.M.; Mao, D.S.; Meng, T.; Yu, J.; Ma, Z. Unveiling the temperature-dependent effect of Zn on phosphotungstic acid-modified MnOx catalyst for selective catalytic reduction of NOx: A poison at <180 °C or a promoter at >180 °C. Chem. Eng. J. 2023, 470, 144170. [Google Scholar]
  6. Li, S.J.; Wang, X.X.; Tan, S.; Shi, Y.; Li, W. CrO3 supported on sargassum-based activated carbon as low temperature catalysts for the selective catalytic reduction of NO with NH3. Fuel 2017, 191, 511–517. [Google Scholar] [CrossRef]
  7. Xie, S.Z.; Li, L.L.; Jin, L.J.; Wu, Y.H.; Liu, H.; Qin, Q.J.; Wei, X.L.; Liu, J.X.; Dong, L.H.; Li, B. Low temperature high activity of M (M = Ce, Fe, Co, Ni) doped M-Mn/TiO2 catalysts for NH3-SCR and in situ DRIFTS for investigating the reaction mechanism. Appl. Surf. Sci. 2020, 515, 146014. [Google Scholar] [CrossRef]
  8. Hu, H.; Cai, S.X.; Li, H.R.; Huang, L.; Shi, L.Y.; Zhang, D.S. Mechanistic aspects of deNOx processing over TiO2 supported Co-Mn oxide catalysts: Structure-activity relationships and in situ DRIFTs analysis. ACS Catal. 2015, 5, 6069–6077. [Google Scholar] [CrossRef]
  9. Jin, L.Y.; Xu, X.T.; Wang, Y.H.; Li, J.Y.; Fan, K.H.; Hu, B.; Shen, Y.; Liu, X.S. Study on H2O2, Ce, W modified MnO/TiO2 based NH3-SCR Catalyst: The status and effect of doped promoters and synergies. Mater. Res. Bull. 2023, 168, 112494. [Google Scholar] [CrossRef]
  10. Feng, J.W.; Wang, Y.; Gao, D.W.; Kang, B.T.; Li, S.; Li, C.S.; Chen, G.Z. Ce-Mn coordination polymer derived hierarchical/porous structured CeO2-MnOx for enhanced catalytic properties. Nanoscale 2020, 12, 16381–16388. [Google Scholar] [CrossRef]
  11. Chen, Z.C.; Ren, S.; Xing, X.D.; Li, X.D.; Chen, L.; Wang, M.M. Unveiling the inductive strategy of different precipitants on MnFeO catalyst for low-temperature NH3-SCR reaction. Fuel 2023, 335, 126986. [Google Scholar] [CrossRef]
  12. Yao, X.J.; Ma, K.L.; Zou, W.X.; He, S.G.; An, J.B.; Yang, F.M.; Dong, L. Influence of preparation methods on the physicochemical properties and catalytic performance of MnO-CeO2 catalysts for NH3-SCR at low temperature. Chin. J. Catal. 2017, 38, 146–159. [Google Scholar] [CrossRef]
  13. Chao, M.X.; Mao, D.S.; Li, G.H.; Li, G.; Yu, J.; Guo, X.M. Low-temperature selective catalytic reduction of NO with NH3 over Mn-Ce-Ox/TiO2: A comparison between catalyst preparation methods. J. Sol-Gel Sci. Technol. 2020, 95, 332–343. [Google Scholar] [CrossRef]
  14. Wu, Y.X.; Liang, H.L.; Chen, X.; Tang, J.; Chen, Y.F.; Zhao, C.L. Influences of preparation parameters of catalyst support on the SCR denitration activity of Mn-Ce/TiO2. Key Eng. Mater. 2016, 697, 279–283. [Google Scholar] [CrossRef]
  15. Sheng, Z.Y.; Hu, Y.F.; Xue, J.M.; Wang, X.M.; Liao, W.P. A novel co-precipitation method for preparation of Mn-Ce/TiO2 composites for NOx reduction with NH3 at low temperature. Environ. Technol. 2012, 33, 2421–2428. [Google Scholar] [CrossRef]
  16. Rahmani, M.; Mirzaee, O.; Tajally, M.; Loghman-Estarki, M.R. A comparative study of synthesis and spark plasma sintering of YAG nano powders by different co-precipitation methods. Ceram. Int. 2018, 44, 10035–10046. [Google Scholar] [CrossRef]
  17. Li, L.L.; Wu, Y.H.; Hou, X.Y.; Chu, B.X.; Nan, B.; Qin, Q.J.; Fan, M.G.; Sun, C.Z.; Li, B.; Dong, L.H.; et al. Investigation of two-phase intergrowth and coexistence in Mn-Ce-Ti-O catalysts for the selective catalytic reduction of NO with NH3: Structure-activity relationship and reaction mechanism. Ind. Eng. Chem. Res. 2018, 58, 849–862. [Google Scholar] [CrossRef]
  18. Zhang, S.B.; Zhao, Y.C.; Yang, J.P.; Zhang, J.Y.; Zheng, C.G. Fe-modified MnOx/TiO2 as the SCR catalyst for simultaneous removal of NO and mercury from coal combustion flue gas. Chem. Eng. J. 2018, 348, 618–629. [Google Scholar] [CrossRef]
  19. Chen, J.Y.; Fu, P.; Lv, D.F.; Chen, Y.; Fan, M.L.; Wu, J.L.; Meshram, A.; Mu, B.; Li, X.; Xia, Q.B. Unusual positive effect of SO2 on Mn-Ce mixed-oxide catalyst for the SCR reaction of NOx with NH3. Chem. Eng. J. 2021, 407, 127071. [Google Scholar] [CrossRef]
  20. Wang, H.J.; Huang, B.C.; Yu, C.L.; Lu, M.J.; Huang, H.; Zhou, Y.L. Research progress, challenges and perspectives on the sulfur and water resistance of catalysts for low temperature selective catalytic reduction of NOx by NH3. Appl. Catal. A Gen. 2019, 588, 117207. [Google Scholar] [CrossRef]
  21. Li, J.C.; Zhang, C.; Li, Q.; Gao, T.; Yu, S.H.; Tan, P.; Fang, Q.Y.; Chen, G. Promoting mechanism of SO2 resistance performance by anatase TiO2 {0 0 1} facets on Mn-Ce/TiO2 catalysts during NH3-SCR reaction. Chem. Eng. Sci. 2022, 251, 117438. [Google Scholar] [CrossRef]
  22. Sjoerd Kijlstra, W.; Biervliet, M.; Poels, E.K.; Bliek, A. Deactivation by SO2 of MnOx/Al2O3 catalysts used for the selective catalytic reduction of NO with NH3 at low temperatures. Appl. Catal. B Environ. 1998, 16, 327–337. [Google Scholar] [CrossRef]
  23. Lee, T.; Bai, H. Metal sulfate poisoning effects over MnFe/TiO2 for selective catalytic reduction of NO by NH3 at low temperature. Ind. Eng. Chem. Res. 2018, 57, 4848–4858. [Google Scholar] [CrossRef]
  24. Shi, W.; Liu, J.J.; Zhu, Y.; Zhao, L.; Wang, Y.G.; Cheng, Z.H.; Peng, X.P.; Shi, X.Y.; Yu, Y.B.; He, H. Extruded monolith MnO-CeO2-TiO2 catalyst for NH3-SCR of low temperature flue gas from an industry boiler: Deactivation and recovery. J. Rare Earths 2023, 41, 1336–1343. [Google Scholar] [CrossRef]
  25. Zhang, B.; Li, D.; Wang, X.Y. Catalytic performance of La-Ce-O mixed oxide for combustion of methane. Catal. Today 2010, 158, 348–353. [Google Scholar] [CrossRef]
  26. Meng, D.M.; Zhan, W.C.; Guo, Y.; Guo, Y.L.; Wang, L.; Lu, G.Z. A highly effective catalyst of Sm-MnOx for the NH3-SCR of NOx at low temperature: Promotional role of Sm and its catalytic performance. ACS Catal. 2015, 5, 5973–5983. [Google Scholar] [CrossRef]
  27. Li, Y.L.; Chen, H.N.; Chen, L.; Zhang, Y.Y.; Mi, Y.Y.; Liao, M.Y.; Liu, W.M.; Wu, D.S.; Li, Z.G.; Peng, H.G. Ternary MnCoVOx catalysts with remarkable deNOx performance: Dual acid-redox sites control strategy. Appl. Catal. B Environ. 2022, 318, 121779. [Google Scholar] [CrossRef]
  28. Chen, R.Y.; Fang, X.Y.; Li, J.H.; Zhang, Y.; Liu, Z.M. Mechanistic investigation of the enhanced SO2 resistance of Co-modified MnOx catalyst for the selective catalytic reduction of NOx by NH3. Chem. Eng. J. 2023, 452, 139207. [Google Scholar] [CrossRef]
  29. Niu, C.H.; Wang, B.R.; Xing, Y.; Su, W.; He, C.; Xiao, L.; Xu, Y.R.; Zhao, S.Q.; Cheng, Y.H.; Shi, J.W. Thulium modified MnOx/TiO2 catalyst for the low-temperature selective catalytic reduction of NO with ammonia. J. Clean. Prod. 2021, 290, 125858. [Google Scholar] [CrossRef]
  30. Mao, D.; Yang, W.; Xia, J.; Zhang, B.; Song, Q.Y.; Chen, Q.L. Highly effective hybrid catalyst for the direct synthesis of dimethyl ether from syngas with magnesium oxide-modified HZSM-5 as a dehydration component. J. Catal. 2005, 230, 140–149. [Google Scholar] [CrossRef]
  31. Li, G.H.; Xue, H.Y.; Yu, J.; Mao, D.S. Insights into the simultaneously enhanced activity, selectivity, and H2O resistance of cobalt modified MnCeOx/TiO2 catalyst for selective catalytic reduction of NOx with NH3. Fuel 2023, 354, 129416. [Google Scholar] [CrossRef]
  32. Chen, L.Q.; Yuan, F.L.; Li, Z.B.; Niu, X.Y.; Zhu, Y.J. Synergistic effect between the redox property and acidity on enhancing the low temperature NH3-SCR activity for NOx removal over the Co0.2CexMn0.8−xTi10 (x = 0–0.40) oxides catalysts. Chem. Eng. J. 2018, 354, 393–406. [Google Scholar] [CrossRef]
  33. Gao, Y.; Jiang, W.C.; Luan, T.; Li, H.; Zhang, W.K.; Feng, W.C.; Jiang, H.L. High-efficiency catalytic conversion of NOx by the synergy of nanocatalyst and plasma: Effect of Mn-based bimetallic active species. Catalysts 2019, 9, 103. [Google Scholar] [CrossRef]
  34. Liu, F.D.; He, H.; Ding, Y.; Zhang, C.B. Effect of manganese substitution on the structure and activity of iron titanate catalyst for the selective catalytic reduction of NO with NH3. Appl. Catal. B Environ. 2009, 93, 194–204. [Google Scholar] [CrossRef]
  35. Ali, S.; Chen, L.Q.; Yuan, F.L.; Li, R.; Zhang, T.R.; Bakhtiar, S.u.H.; Leng, X.S.; Niu, X.Y.; Zhu, Y.J. Synergistic effect between copper and cerium on the performance of Cux-Ce0.5−x-Zr0.5 (x = 0.1–0.5) oxides catalysts for selective catalytic reduction of NO with ammonia. Appl. Catal. B Environ. 2017, 210, 223–234. [Google Scholar] [CrossRef]
  36. Cheng, J.; Song, L.Y.; Wu, R.; Li, S.N.; Sun, Y.M.; Zhu, H.T.; Qiu, W.G.; He, H. Promoting effect of microwave irradiation on CeO2-TiO2 catalyst for selective catalytic reduction of NO by NH3. J. Rare Earths 2020, 38, 59–69. [Google Scholar] [CrossRef]
  37. Chen, W.S.; Li, Z.; Hu, F.L.; Qin, L.B.; Han, J.; Wu, G.M. In situ DRIFTS investigation on the selective catalytic reduction of NO with NH3 over the sintered ore catalyst. Appl. Surf. Sci. 2018, 439, 75–81. [Google Scholar] [CrossRef]
  38. Mu, J.C.; Li, X.Y.; Sun, W.B.; Fan, S.Y.; Wang, X.Y.; Wang, L.; Qin, M.C.; Gan, G.Q.; Yin, Z.F.; Zhang, D.K. Enhancement of low-temperature catalytic activity over a highly dispersed Fe-Mn/Ti catalyst for selective catalytic reduction of NOx with NH3. Ind. Eng. Chem. Res. 2018, 57, 10159–10169. [Google Scholar] [CrossRef]
  39. Qiu, L.; Pang, D.D.; Zhang, C.L.; Meng, J.J.; Zhu, R.S.; Ouyang, F. In situ IR studies of Co and Ce doped Mn/TiO2 catalyst for low-temperature selective catalytic reduction of NO with NH3. Appl. Surf. Sci. 2015, 357, 189–196. [Google Scholar] [CrossRef]
  40. Liu, S.M.; Guo, R.T.; Sun, P.; Wang, S.X.; Pan, W.G.; Li, M.Y.; Liu, S.W.; Sun, X.; Liu, J. The enhancement of Zn resistance of Mn/TiO2 catalyst for NH3-SCR reaction by the modification with Al2(SO4)3. J. Taiwan Inst. Chem. Eng. 2017, 78, 370–377. [Google Scholar] [CrossRef]
  41. Li, G.; Mao, D.S.; Chao, M.X.; Li, G.H.; Yu, J.; Guo, X.M. Low-temperature NH3-SCR of NO over MnCeO/TiO2 catalyst: Enhanced activity and SO2 tolerance by modifying TiO2 with Al2O3. J. Rare Earths 2021, 39, 805–816. [Google Scholar] [CrossRef]
  42. He, Z.H.; Wang, Y.; Liu, Y.X.; Lian, L.Q.; Kong, D.X.; Zhao, Y.C. Recent advances in sulfur poisoning of selective catalytic reduction (SCR) denitration catalysts. Fuel 2024, 365, 131126. [Google Scholar] [CrossRef]
  43. Wu, H.L.; Liu, W.Z.; Cao, J.; Huang, J.B.; Liu, Q.C. Mechanistic and performance insights into low-temperature NH3-SCR based on Ce-modified Mn-Ti catalysts. J. Environ. Chem. Eng. 2023, 11, 110072. [Google Scholar] [CrossRef]
  44. Chen, Z.C.; Ren, S.; Wang, M.M.; Yang, J.; Chen, L.; Liu, W.Z.; Liu, Q.C.; Su, B.X. Insights into samarium doping effects on catalytic activity and SO2 tolerance of MnFeO catalyst for low-temperature NH3-SCR reaction. Fuel 2022, 321, 124113. [Google Scholar] [CrossRef]
  45. Zhu, Y.J.; Qu, P.Y.; Qiu, L.M.; Wang, J.T.; Lian, C.; Ma, C.; Jia, X.F.; Qiao, W.M.; Ling, L.C. Polymer-directed self-assembly synthesis of tin-titanium-manganese compounded oxides with enhanced activity and sulfur tolerance for NH3-SCR. Appl. Surf. Sci. 2023, 607, 154956. [Google Scholar] [CrossRef]
  46. Chen, L.; Ren, S.; Xing, X.D.; Yang, J.; Li, X.D.; Wang, M.M.; Chen, Z.C.; Liu, Q.C. Poisoning mechanism of KCl, K2O and SO2 on Mn-Ce/CuX catalyst for low-temperature SCR of NO with NH3. Process Saf. Environ. 2022, 167, 609–619. [Google Scholar] [CrossRef]
  47. Fang, X.; Liu, Y.J.; Cheng, Y.; Cen, W.L. Mechanism of Ce-modified Birnessite-MnO2 in promoting SO2 poisoning resistance for low-temperature NH3-SCR. ACS Catal. 2021, 11, 4125–4135. [Google Scholar] [CrossRef]
  48. Sun, P.; Guo, R.T.; Liu, S.M.; Wang, S.X.; Pan, W.G.; Li, M.Y. The enhanced performance of MnOx catalyst for NH3-SCR reaction by the modification with Eu. Appl. Catal. A Gen. 2017, 531, 129–138. [Google Scholar] [CrossRef]
  49. Zhu, Y.W.; Zhang, Y.P.; Xiao, R.; Huang, T.J.; Shen, K. Novel holmium-modified Fe-Mn/TiO2 catalysts with a broad temperature window and high sulfur dioxide tolerance for low-temperature SCR. Chem. Commun. 2017, 88, 64–67. [Google Scholar] [CrossRef]
  50. Chen, C.; Xie, H.D.; He, P.W.; Liu, X.; Yang, C.; Wang, N.; Ge, C.M. Comparison of low-temperature catalytic activity and H2O/SO2 resistance of the Ce-Mn/TiO2 NH3-SCR catalysts prepared by the reverse co-precipitation, co-precipitation and impregnation method. Appl. Surf. Sci. 2022, 571, 151285. [Google Scholar] [CrossRef]
  51. Jiang, Y.; Yang, L.; Liang, G.T.; Liu, S.J.; Gao, W.Q.; Yang, Z.D.; Wang, X.W.; Lin, R.Y.; Zhu, X.B. The poisoning effect of PbO on CeO2-MoO3/TiO2 catalyst for selective catalytic reduction of NO with NH3. Mol. Catal. 2020, 486, 110877. [Google Scholar] [CrossRef]
  52. Wang, J.W.; Xie, H.; Shu, D.B.; Chen, T.H.; Liu, H.B.; Zou, X.H.; Chen, D. The promotion of NH3-SCR performance and its mechanism on Sm modified birnessite. Fuel 2024, 356, 129604. [Google Scholar] [CrossRef]
  53. Gao, L.; Li, C.T.; Li, S.H.; Zhang, W.; Du, X.Y.; Huang, L.; Zhu, Y.C.; Zhai, Y.B.; Zeng, G.M. Superior performance and resistance to SO2 and H2O over CoOx-modified MnOx/biomass activated carbons for simultaneous Hg0 and NO removal. Chem. Eng. J. 2019, 371, 781–795. [Google Scholar] [CrossRef]
  54. Wei, L.; Cui, S.P.; Guo, H.X.; Ma, X.Y.; Zhang, L.J. DRIFT and DFT study of cerium addition on SO2 of Manganese-based catalysts for low temperature SCR. J. Mol. Catal. A Chem. 2016, 421, 102–108. [Google Scholar] [CrossRef]
  55. Xie, Q.; An, D.Q.; Zhou, L.S.; Li, T.Z.; Hu, Z.H.; Chen, M.H.; Ma, M.L.; Zhang, L.; Sun, J.F.; Dong, L. Deactivation induced by metal sulfate over MnCeO catalyst in NH3-SCR reaction at low temperature. J. Rare Earths 2024, 42, 1056–1065. [Google Scholar] [CrossRef]
  56. Kang, T.H.; Youn, S.; Kim, D.H. Improved catalytic performance and resistance to SO2 over V2O5-WO3/TiO2 catalyst physically mixed with Fe2O3 for low-temperature NH3-SCR. Catal. Today 2021, 376, 95–103. [Google Scholar] [CrossRef]
  57. Wang, X.P.; Ye, Q.; Liu, W.Y.; Meng, F.W.; Yang, F.; Zhang, X.; Dai, H.X. Improved sulfur dioxide resistance of the Mn/Fe-pillared interlayered clay by the doping of ceria in the selective catalytic reduction of NO with NH3. React. Kinet. Mech. Catal. 2023, 136, 1263–1281. [Google Scholar] [CrossRef]
Figure 1. XRD profiles (a) and N2 adsorption–desorption isotherms (b) of the different catalysts.
Catalysts 14 00690 g001
Figure 2. NOx conversion (a) and N2 selectivity (b) of the different catalysts. Reaction conditions: 500 ppm NO, 500 ppm NH3, 5 vol% O2, N2 as balance gas, and GHSV = 80,000 mL/(gcat·h).
Catalysts 14 00690 g002
Figure 3. Resistance to H2O (a) and SO2 (b) poisoning on the different catalysts at 200 °C. Reaction conditions: 500 ppm NO, 500 ppm NH3, 5 vol% O2, N2 as balance gas, 10 vol% H2O (when used), 50 ppm SO2 (when used), and GHSV = 80,000 mL/(gcat⋅h).
Catalysts 14 00690 g003
Figure 4. NH3 oxidation conversion (a) and NO oxidation conversion (b). Reaction conditions: 200 °C, 500 ppm NO (when used), 500 ppm NH3 (when used), 5 vol% O2, N2 as balance gas, and GHSV = 80,000 mL/(gcat⋅h).
Catalysts 14 00690 g004
Figure 5. XPS spectra of different catalysts: (a) Mn 2p, (b) Ce 3d, (c) Ti 2p, and (d) O 1s.
Catalysts 14 00690 g005
Figure 6. H2-TPR profiles of the different catalysts.
Catalysts 14 00690 g006
Figure 7. TPD profiles of NH3 (a) and NO (b) for the different catalysts.
Catalysts 14 00690 g007
Figure 8. In situ DRIFT spectra of MCT-R (a) and MCT-P (b) catalysts during NH3 adsorption at different temperatures.
Catalysts 14 00690 g008
Figure 9. In situ DRIFT spectra of MCT-R (a) and MCT-P (b) catalysts during NOx adsorption at different temperatures.
Catalysts 14 00690 g009
Figure 10. In situ DRIFT spectra of the reaction between NOx and the pre-adsorbed NH3 species on MCT-R (a) and MCT-P (b) catalysts at 100 °C.
Catalysts 14 00690 g010
Figure 11. In situ DRIFT spectra of the reaction between NH3 and the pre-adsorbed NOx species on MCT-R (a) and MCT-P (b) catalysts at 100 °C.
Catalysts 14 00690 g011
Table 1. BET specific surface area and pore characteristics of fresh and SO2 poisoned catalysts.
CatalystBET Specific Surface Area (m2/g)Pore Volume
(cm3/g)
Average Pore Diameter
(nm)
MCT-C97.90.228.8
MCT-R141.60.4612.9
MCT-P54.00.2317.2
MCT-C-S79.30.189.2
MCT-R-S112.70.3612.6
MCT-P-S39.40.1918.9
Disclaimer/Publisher’s Note: The statements, opinions and data contained in all publications are solely those of the individual author(s) and contributor(s) and not of MDPI and/or the editor(s). MDPI and/or the editor(s) disclaim responsibility for any injury to people or property resulting from any ideas, methods, instructions or products referred to in the content.

