Article

Pd-Co Supported on Anodized Aluminium for VOCs Abatement: Reaction Mechanism, Kinetics and Applicability as Monolithic Catalyst

1
Institute of General and Inorganic Chemistry, Bulgarian Academy of Sciences, Acad. G. Bonchev St., Bldg. 11, 1113 Sofia, Bulgaria
2
Institute of Catalysis, Bulgarian Academy of Sciences, Acad. G. Bonchev St., Bldg. 11, 1113 Sofia, Bulgaria
3
Department of Chemistry, Faculty of Electronic Engineering and Technology, Technical University of Sofia, Kliment Ohridski Blvd., 8, 1000 Sofia, Bulgaria
4
Institute of Optical Materials and Technologies “Acad. Jordan Malinowski”, Bulgarian Academy of Sciences, 1113 Sofia, Bulgaria
*
Author to whom correspondence should be addressed.
Catalysts 2024, 14(10), 736; https://doi.org/10.3390/catal14100736
Submission received: 19 September 2024 / Revised: 12 October 2024 / Accepted: 17 October 2024 / Published: 20 October 2024
(This article belongs to the Special Issue Featured Papers in “Environmental Catalysis” Section)

Abstract

:
It has been found out that Pd-Co-based catalyst, supported on anodized aluminum, possesses very high activity in combustion reactions of C1–C6 alkanes and toluene. The catalyst characterization has been made by N2-pysisorption, XRD, SEM, XPS, FTIR, TEM, and EPR methods. In view of the great interest, methane combustion was investigated in detail. It is ascertained that the complete oxidation of methane proceeds by dissociative adsorption on PdO and formation of hydroxyl and methyl groups, the former being highly reactive, and it undergoes further reaction to oxygen-containing intermediates, whereupon HCHO is one of them. The presence of Co2+ cations promotes greatly oxygen adsorption. The dissociative adsorption is favored on neighboring Co2+ cations, leading to the formation of bridging peroxides. Further, the oxygen dissociates on the nearest Pd2+ cations. According to the results from the experimental data, instrumental methods, and the observed kinetics and DFT model calculations, it can be concluded that the reaction pathway over Pd+Co/anodic alumina support (AAS) catalyst proceeds most probably through Mars–van Krevelen. The obtained data on the kinetics were used for simulation of the methane combustion in a full-scale adiabatic reactor.

Graphical Abstract

1. Introduction

Volatile organic compounds (VOCs) include alkanes, aromatics, chlorinated hydrocarbons, alcohols, aldehydes, ketones, esters, etc.—a group of carbon-containing molecules that easily volatilize at ambient temperature and pressure [1,2]. VOCs are mostly used in industries as solvents, and they can cause many environmental problems, such as the formation of tropospheric ozone, photochemical smog, and the greenhouse effect intensification [3]. The most promising technique for reducing the emissions of volatile organic compounds is heterogeneous catalytic oxidation, which uses low energy and produces a selective conversion into innocuous molecules [2,3,4,5,6].
VOCs are also largely used in industries as fuels, and nowadays the use of compressed natural gas (CNG) as an alternative to gasoline fuel offers several benefits, such as its lower ignition temperature, high hydrogen-to-carbon ratio, low content of sulfur, and the formation of nitrogen oxides in the exhaust gases from the internal combustion engines. It was reported that automobiles that run on compressed natural gas have the potential to emit substantially fewer emissions than the vehicles running on gasoline [3]. A collection of policies aimed at achieving Europe carbon neutrality by 2050, the so-called Green Deal, also known as the Green Pact, was proposed by the European Commission in December 2019. The goal is to achieve zero pollution by 2050 and a minimum 50% reduction in greenhouse gas production from 1990 levels. Methane is a significant greenhouse gas (GHG) that is mostly produced by oil and gas facilities, coal mines, land fields, wastewater treatment plants, and agriculture. Methane makes up 14% of all GHG emissions worldwide [7]. Nevertheless, issues arising from the unburned methane in exhaust gases impede the widespread use of methane as a fuel for internal combustion engines. In particular, the most recent Euro VI standards for compressed natural gas (CNG) vehicles and the greenhouse gas legislation of the US Environmental Protection Agency (EPA) stipulate very strict limits on methane emissions, with the maximum being 0.5 g kWh−1 [8], or 0.10 g km−1 for passenger cars and 0.16 g km−1 for light commercial vehicles [9]. When compared to catalytic systems for gasoline-powered vehicles, these methane emission restrictions necessitate extremely active oxidation catalysts with up to four times the noble metal content [10]. The problems of the catalytic gas purification are associated with the low concentrations of the VOCs (ranging below 0.5 vol.%), thus making difficult the realization of auto-thermal operation of the reactor. In addition to it, the exhaust gases in practice are characterized by their large volumetric flow rates, and the use of granulated catalysts requires significant spending of energy due to the high pressure drop, and the only possible solution is the application of structured or monolithic catalysts. The low reactivity of methane requires operation at relatively high temperatures, which involves the need for catalysts with high thermal (and hydrothermal) stability—a problem that is not sufficiently solved. Therefore, improving the catalysts’ thermal stability is one of the main goals of the researchers’ efforts [4,5,6]. An alternative way is the development of catalytic systems allowing a decrease in the reaction temperature down to the range of 250–400 °C, thus avoiding one of the main drawbacks related to the sintering of the catalytically active phase.
Regarding the active phase, the main part of the applied catalysts for methane combustion is based on palladium only or its combination with various metal oxides of Ce, Ni, Cu, Mn, and Co, supported on gamma-alumina, whose role is to supply oxygen to the couple Pd/PdO, extracted by the methane during the oxi-redox process. The problems of the catalytic gas purification are associated with the low concentrations of the VOCs (ranging below 0.5 vol.%), thus making difficult the realization of the auto-thermal operation of the reactor. In addition to it, the exhaust gases in practice are characterized by their large volumetric flow rates, and the use of granulated catalysts requires significant spending of energy due to the high pressure drop, and the only possible solution is the application of structured or monolithic catalysts. Aiming to combine the advantages of the Pd–Co bimetallic catalyst with the monolithic structure, an alumina-supported mono- and bimetallic cobalt (Co) and palladium (Pd) monolithic catalysts were prepared and tested for methane catalytic combustion; the composition of 0.1 wt.% Pd and 0.25 wt.% Co was found to be the most promising [11]. A high stability has been attributed to the influence of Co upon hindering the decomposition of PdO to metallic palladium and the increase in oxygen mobility from the cobalt oxide. Among the monolithic systems, well spread is the use of ceramics [12,13,14,15,16] or stainless-steel substrates [17,18] (most of them based on Fe-Cr-Al alloys), the former offering some advantages due to their higher specific surface area per volume of the catalyst, low thermal capacity and therefore fast response to the changes in the temperature, etc. In parallel with the high price, one of the main disadvantages of the steel metal substrates is related to difficulties in ensuring long life and reliable bonding of strongly adhered layers of the applied washcoat to the corresponding catalytically active phase. Most of these problems can be solved by using monoliths, based on anodized aluminum. As a result, during the anodization, a nanoporous layer of anodic aluminum oxide is being formed on the metal surface with a honeycomb-like structure [19,20,21,22]. In addition, during the anodizing process, a significant tuning of the features of the alumina layer is possible, especially regarding the adjustment of the pore characteristics—dimensions, orientation, and shape. The active phase can be applied by simple impregnation; however, some additional options could be offered by the implementation of different electrodeposition processes. Anodized aluminum monolith was applied in the development of effective catalysts for hydrogen combustion [23] and hydrogenation [24,25].
There is a discrepancy in the literature data about the reaction kinetics of the methane combustion on palladium catalysts: Eley–Rideal (ER), Langmuir–Hinshelwood (LH), and Mars van Krevelen (MvK) mechanisms have been proposed, MvK models being the most frequently used [26].
In our previous investigation [27], we reported that the use of the Co-Pd system, supported on granulated gamma–alumina, allows the decrease in the reaction temperature of methane combustion down to starting at 210 °C, the thermal and hydrothermal stability being confirmed by the aging procedure at 505 °C. The function of the surface cobalt oxide phase was found to be oxygen storage and stabilization of the palladium in its oxidized form.
The aim of this present study is devoted to the development of a monolithic catalyst for methane combustion based on a combination between the well-approved Pd-Co active phase and the benefits that provide the anodized aluminum as a catalytic substrate (noted anodic alumina support, AAS). The monolithic catalyst based on anodized aluminum combines the advantages of granular gamma alumina with those of steel monoliths and avoids their main disadvantages described above. Anodic aluminum oxide offers (i) a promising chemical composition similar to that of granular gamma oxide, (ii) a nanoporous structure providing a highly adhesion and developed catalytic surface, (iii) a tubular design with low pressure drop, and (iv) an easy-to-metalworking, light, and cheap metal support.

2. Results and Discussion

2.1. Nitrogen Physisorption

Using nitrogen adsorption, the Pd+Co/AAS catalyst’s structure has been examined. The overall pore volume was 0.12 cm3/g, the average pore diameter was 11 nm, and the measured BET specific surface area was 46 m2/g.
Based on nitrogen adsorption–desorption studies on the Pd+Co/AAS, the results (Figure 1A) show that the isotherm corresponds to type IV of the IUPAC classification [28], with an H2 hysteresis loop. Type IV isotherm is typical of mesoporous materials [29]. The most characteristic feature of this isotherm is the hysteresis loop, which is attributed to the pore condensation phenomenon. A well-defined distribution of pore size and shape is lacking, and H2 hysteresis is frequently unpredictable. The pore size distribution (PSD) is unimodal and narrow with a maximal pore diameter of 5.1 nm (as stated above, the parallel pores model predicts an average diameter of 11 nm).

2.2. Scanning Electron Microscopy

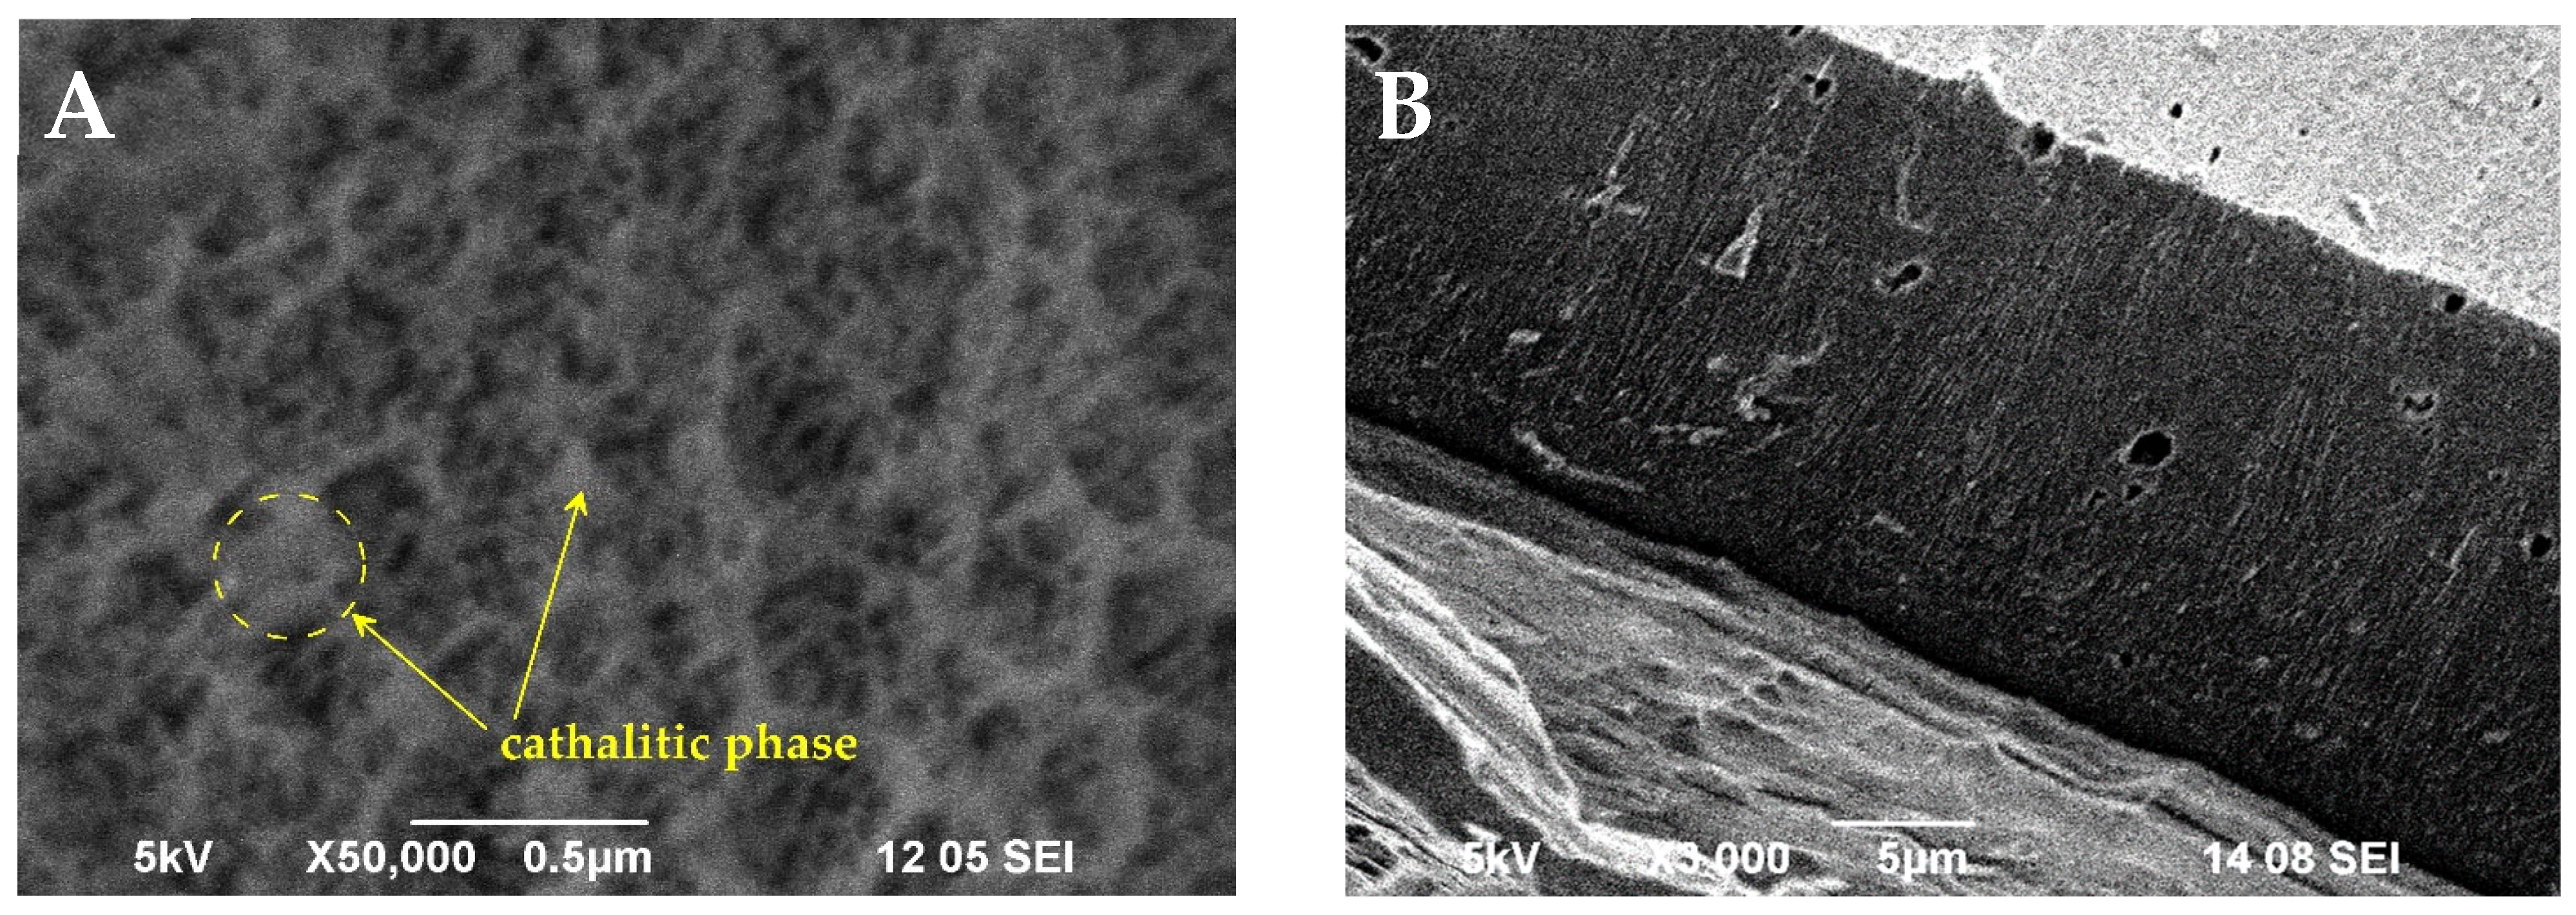
The SEM surface observation of AAS (Figure 2A) demonstrates the highly developed support surface. The larger shallow depressions on the surface are between 150 and 300 nm in diameter. They are a result of the chemical roughening of the aluminum substrate during the pretreatment etching process in 4% NaOH. Regularly distributed pores with an average diameter of 50 nm are visible on the surface too. They are formed in the course of anodization of aluminum and extend to the depth of the entire oxide layer. Catalyst impregnation does not change the morphology of the oxide layer, and the nanoporous structure of AAS is preserved. Therefore, the catalytic phase forms a relatively uniform and thin layer that follows the relief of the anodic oxide. Isolated clusters of the catalytic phase can be observed on the surface, such as in the left part of the image in Figure 2A.
The cross section of the Pd+Co/AAS system after catalytic tests shows that the thickness of the layer is about 25 microns (Figure 2B). The surface compositions of fresh and used samples were determined by energy dispersive X-ray spectroscopic (EDX) analysis in an area of 1400 μm2 (at low magnification of 3000×). The results are represented in (Table 1). The decrease in the Co content after the catalytic tests could be related to the increase in the oxygen content. This suggests an increase in oxidized forms of Co.

2.3. Catalytic Tests

Figure 3 represents the catalytic activity of the Pd+Co/AAS system in combustion reactions of C1–C6 alkanes and toluene as a representative of saturated aromatic compounds. Obviously, the catalyst possesses very high activity, and the highest light-off temperature is required for methane combustion. The adding of one carbon atom to the hydrocarbon chain C1–C6 leads to a decrease in T50, as also reported earlier for the Pd/CaWO4 catalytic system [30]. The observed decrease can be correlated with the strength of the weakest H-C bond of the corresponding n-alkane [31,32]: methane (T50 = 325 °C): 433 kJ/mol; ethane (T50 = 306 °C): 410 kJ/mol; propane (T50 = 297 °C), n-butane (T50 = 293 °C), n-pentane (T50 = 292 °C), n-hexane (T50 = 285 °C): 394 kJ/mol. Catalytic tests with the samples prepared in the form of structured (monolithic) catalysts based on anodized alumina were reported earlier [27]. An approximated comparison by using the reactor model for re-calculation of the measured conversions at different gas hourly space velocities shows that the currently reported catalysts possess slightly lower activity than the reported earlier (within 8–12%, expressed as difference in conversions ranging from 20% to 80%). It should be pointed out that the active phase composition, the specific surface of the anodized alumina, and the testing conditions differ significantly).
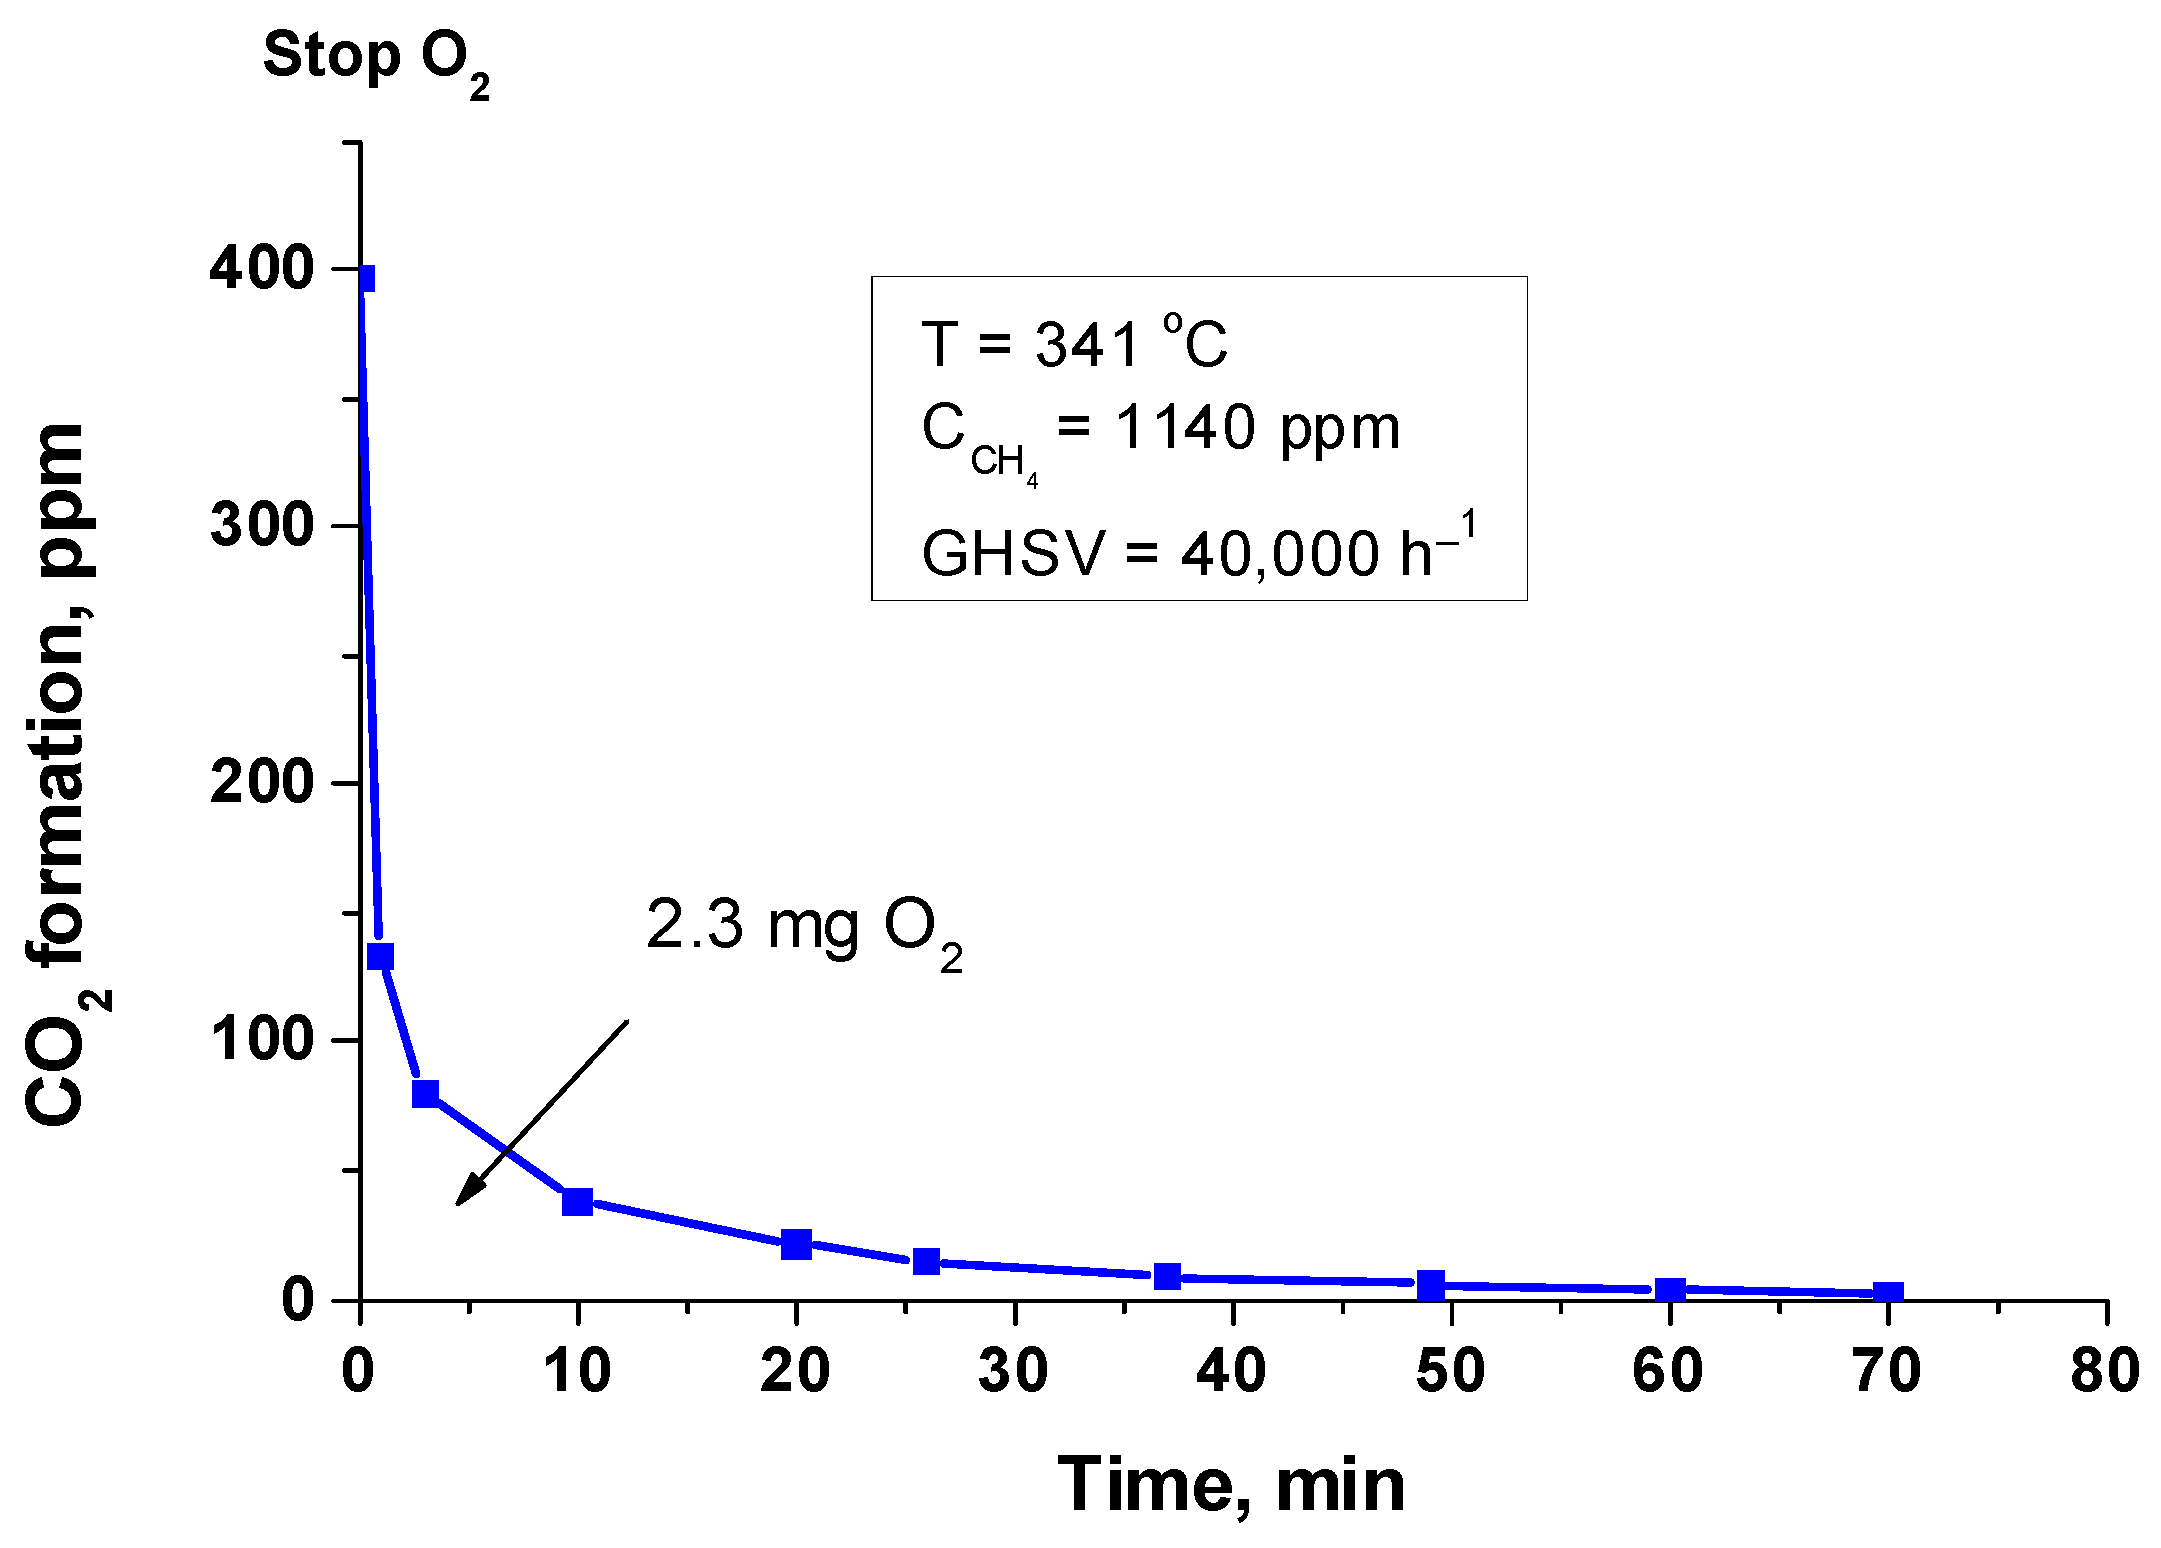
An experiment on the so-called “depletive” oxidation [33] was carried out to obtain information on the reactivity of oxygen species present on the catalyst surface (Figure 4).
The “depletive” oxidation experiment was limited to 70 min, when the formation of oxidation products and their emission in the gas phase is practically complete. According to the results of “depletive” oxidation, 2.3 mg of oxygen originated from the catalysts were involved in the reaction with CH4 (layer parameters: 3.0 weight percent Pd, 26.0% Co, layer thickness of 25 µm, 45 mg active phase on 0.2 g sample determined by SEM; 1 mg Pd can be bonded with 0.15 mg O2). The amount of oxygen is above the theoretically calculated one, on the basis that all the palladium is in the form of PdO. Therefore, part of reactive oxygen should be originating or supplied by the cobalt oxides.
According to a report, PdO supported on γ-Al2O3 is reduced by CH4 molecules to Pd0 within the temperature range of 240–290 °C depending on the particle sizes [34], while the Co3O4 of different morphologies undergoes two-step reduction within the temperature range of 590–820 °C [35]. When the oxygen supply was restored following the “depletive” oxidation test, the catalyst displayed some activation. The catalyst’s activity is growing as a result of the reductive treatment, although this improvement has a temporary effect.
The data on the thermal and hydrothermal stability of the catalyst were confirmed by the following aging procedure: treatment of the catalyst at 500 °C in an atmosphere containing 19% O2 (N2 balance to 100%) and water vapor at a concentration of 2.2 vol.% (corresponding to the dew point at room temperature). The duration of the aging test was 170 h.

2.4. X-Ray Diffraction

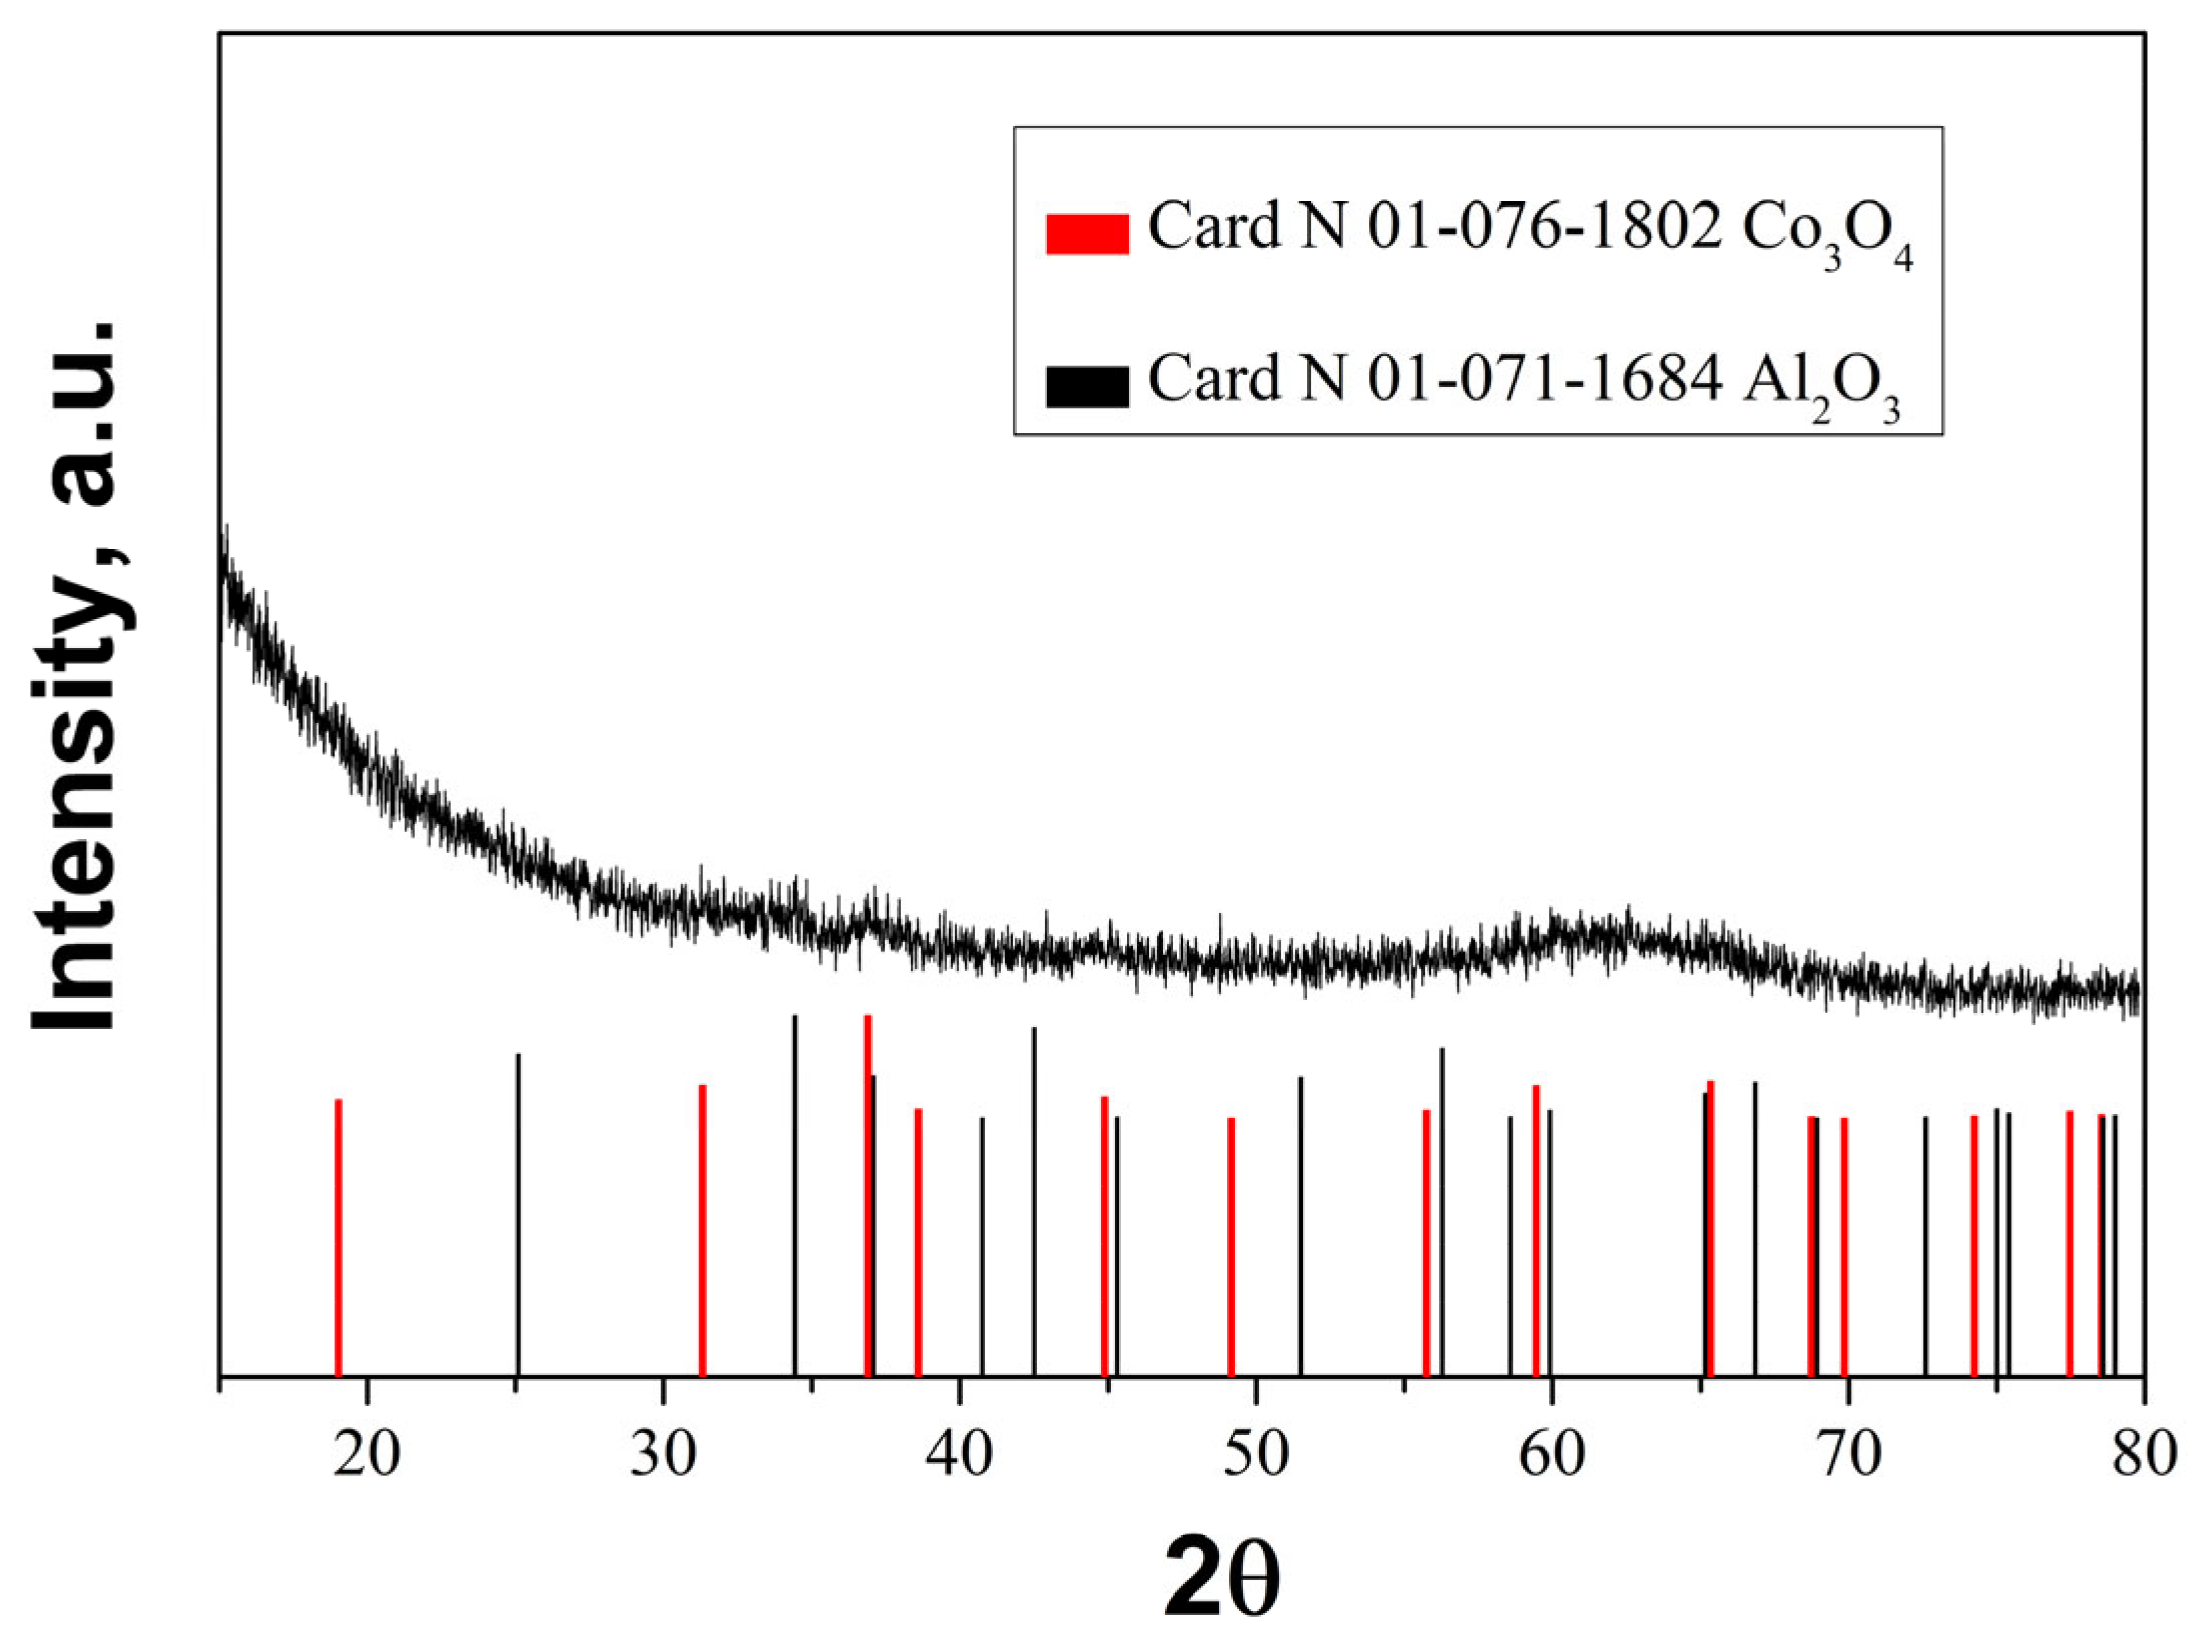
The XRD pattern (Figure 5) of the fresh sample after calcination at 500·°C revealed broad and low intensive peaks associated with Co3O4 and Al2O3, indicating the formation of finely divided oxide phases. Very likely the synthesized layer of Al2O3 is a highly disordered one and/or there is an amorphous Al-oxide compound [36]. The XRD patterns for palladium and palladium oxide were not detected in the catalyst, revealing finely divided phases. This claim is further supported in the article with TEM data.

2.5. Fourier Transforms Infrared Spectroscopy

Due to the sensitivity of the infrared spectrum towards amorphous components and those with short-range order, infrared spectroscopy is frequently a necessary alternative and helpful supplement to X-ray diffraction [37]. Figure 6 displays the IR spectra of AAS support and Pd+Co/AAS sample (fresh and aged). The IR spectrum of support after calcination at 500 °C is given for comparison as well.
A broad band, centered at 1000 cm−1 is visible in the anodic alumina support. It is indicative of no uniformity in the coordination surroundings of Al in the amorphous aluminum oxide [38]. The presence of amorphous aluminum is confirmed by XRD data. Some low-intensity absorption peaks at 720 cm−1 are also observed, and these could be attributed to the ν-AlOH [39]. The bands at 584 cm−1, 624 cm−1, and 654 cm−1 are appearing in infrared spectra after deposition of cobalt and palladium and after aging. The bands for both cobalt oxide and alumina are observed within this region, which makes the assignment very difficult.
It is known that Co3O4 has two bands in its FTIR spectrum: one band is located in the 550–600 cm−1 region (ν1), while the second band is located in the 650–700 cm−1 interval (ν2). The first one is linked to the octahedral stretching vibration of the Co3+–O bond, and the second one is linked to the tetrahedral stretching vibration of the Co2+–O bond [40]. The IR bands for normal CoAl2O4 spinel occur at 666 cm−1, 554 cm−1, and 504 cm−1 [41,42]. According to data in the literature [39], the IR spectrum of anodic alumina as prepared and after calcination at 500 °C exhibits absorbance of asymmetric (νas) and symmetric (νs) stretching vibrations of Al–O bonds in the “isolated” AlO4 tetrahedra (830–760 cm−1), in the “isolated” and “condensed” AlO6 octahedra (500–400 and 680–500 cm−1, respectively) in different alumina modifications [43]. The IR spectrum of the anodic alumina support does not provide any evidence about the formation of AlO4 tetrahedral and AlO6 octahedral structural units. The bands at 584, 624, and 654 cm−1 are appearing in the infrared spectrum after the addition of cobalt and palladium and subsequent calcination. The inverse spinel, with tetrahedrally coordinated aluminum, is characterized by bands at 626 cm−1 and 559 cm−1 [44]. According to Arnoldy et al. [45], the Co2+-Al3+ spinel-like phase is being formed during the deposition of cobalt at low concentrations on the surface of Al2O3. Taking into account the above-mentioned facts, we could suppose that a band at 626 cm−1 arises from inverse spinel, i.e., after cobalt deposition on the AAS and following calcination, the part of Co is included in the Co3O4 and a part in the Al2O3. The band at 626 cm−1 could originate from PdO [46].

2.6. X-Ray Photoelectron Spectroscopy

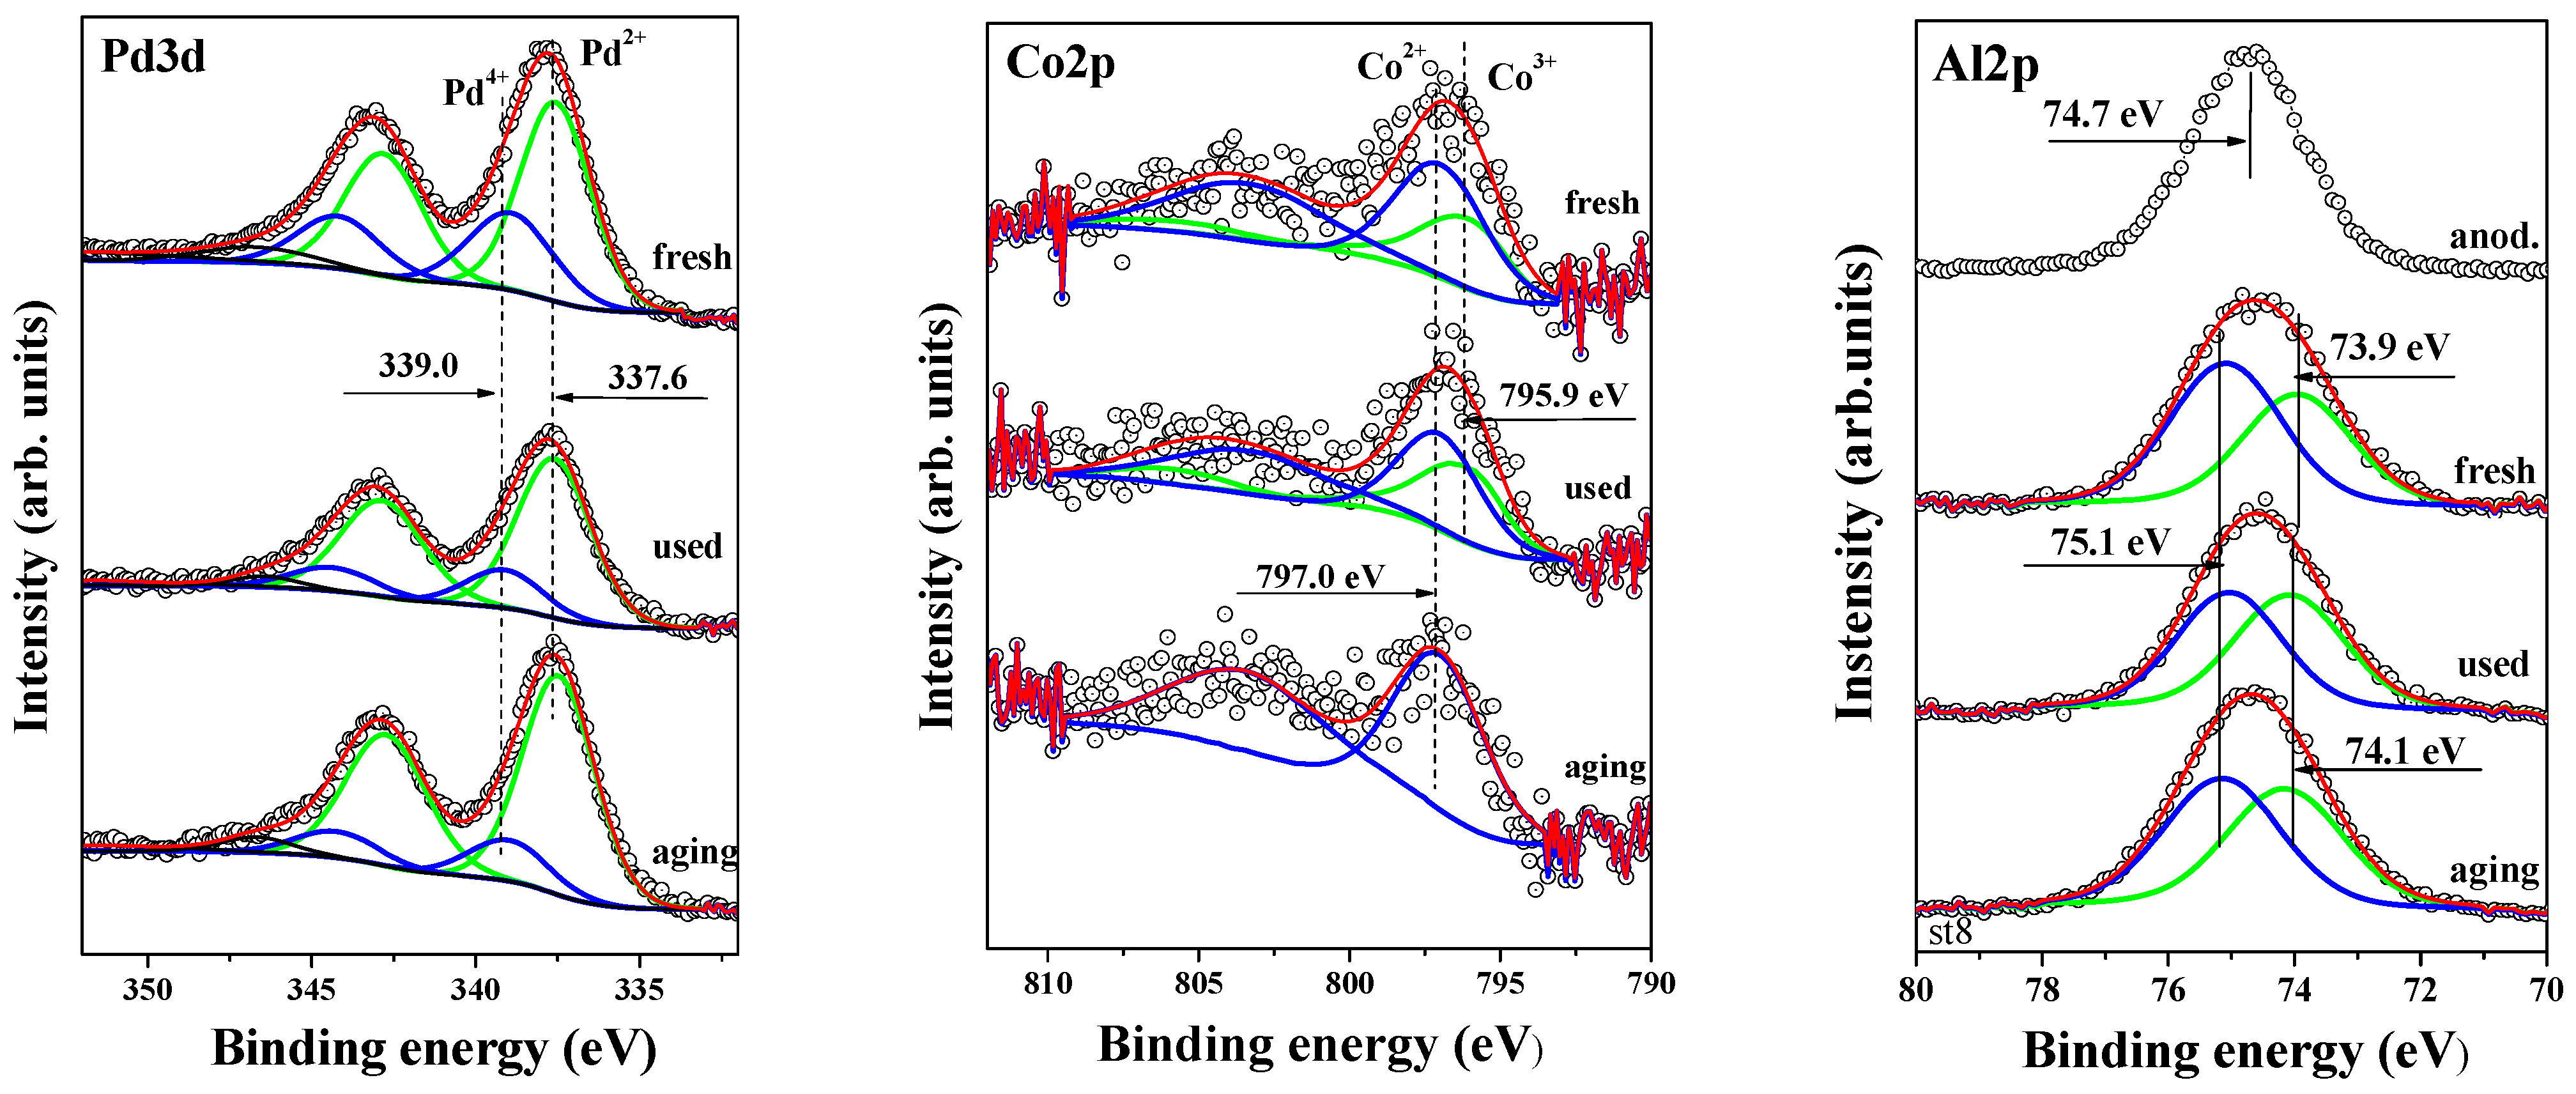
The oxidation states of surface palladium, cobalt, and aluminum were investigated using X-ray photoelectron spectroscopy (XPS). Figure 7 shows the XPS spectra for the Co 2p1/2, Pd 3d, and Al 2p regions. A peak within the 792–798 eV energy range is observed for cobalt, with binding energies (BEs) of 795.9 eV (Co3+) and 797.0 eV (Co2+). The presence of Co2+ in the cobalt-containing samples is confirmed by a peak with a BE of 797.0 eV, along with the relatively intense 3d → 4s “shake-up” satellite at a BE of 803–804 eV. Both Co3+ and Co2+ species are detected in the fresh sample and after the first catalytic run, while only Co2+ is observed after sample aging. As described earlier, the aging process was conducted at 500 °C. According to Arnoldy et al. [45], calcination of the CoO/Al2O3 system below 950 K results in the formation of a surface phase of Co2+ ions.
The binding energies of Co 2p1/2 and Pd 3d5/2 core levels are summarized in Table 2, which also provides the XPS surface atomic concentrations of O 1s, Al 2p, Pd 3d, and Co 2p1/2, along with the relative oxidation states of cobalt and palladium as percentages of the total atomic concentration. The variations in the ratios of Co 2p1/2 and Pd 3d are also calculated and presented for fresh, used, and aged samples.
To further explore peak shapes and full-width half-maxima (FWHM), the Pd 3d core-level spectra of all catalysts are displayed in Figure 7. The binding energies of 337.5–337.6 eV in the fresh, aged, and post-catalytic activity samples indicate the presence of PdO [47,48]. A peak at 338.9–339.1 eV corresponds to Pd4+ from PdO2 [49], which we have previously observed in palladium catalysts deposited on alumina and alumina modified with various oxides, where it was assigned to Pd4+ from PdO2 [50]. According to Venezia et al. [51], the formation of PdO2 is attributed to oxygen incorporation into the PdO crystalline lattice during calcination. PdO2 is unstable and decomposes into PdO [52]. Barr [53] suggests that prolonged exposure of Pd metal particles to air leads to the formation of PdO with outermost layers of PdO2 or Pd(OH)4. Bi and Lu [54] report that PdO2 species can be stabilized by the NaZSM-5 framework. Otto et al. [52] attribute the high-energy XPS peak of oxidized palladium on γ-Al2O3 to highly dispersed, deficiently coordinated (ionic) Pd2+ in intimate contact with the support. Although it is difficult to definitively identify the particles responsible for the high BE in our study, it is clear that their oxidation state exceeds Pd2+, and these species are stable. The formation of palladium in higher oxidation states at the PdO/Co3O4 interface has also been reported [55].
As shown in Table 2, the binding energy for Pd2+ remains unchanged after the catalytic test and aging. The surface concentration of this species also changes only slightly, suggesting that the particles are well stabilized on the surface.
In Figure 7, the right-hand spectra show the Al 2p core-level peaks for fresh, used, and aged samples, compared with the anodized alumina peak (labeled “anod.”). The line shape and FWHM of the Al 2p peaks for the fresh, used, and aged samples indicate that the Al 2p signal consists of at least two subpeaks, representing different aluminum bonding environments, either with oxygen or hydroxyl groups. After applying the curve-fitting procedure, we identified a peak at approximately 74.0 eV (73.9–74.1 eV), attributed to Al–O bonding in Al2O3, and a second peak at approximately 75.1 eV, attributed to the Al3+ oxidation state in AlOOH [56]. The curve-fitting was performed with the aim of minimizing the number of peaks. Given that the sample contains both Co2+ and Al3+ oxidation states, we propose that the Al 2p peak is best fitted with three subpeaks, including one at approximately 74.6 eV. Under these thermodynamic conditions, the formation of CoAl₂O₄—like species, particularly in the aged sample, cannot be excluded [57].

2.7. High Resolution Transmission Electron Microscopy (HRTEM)

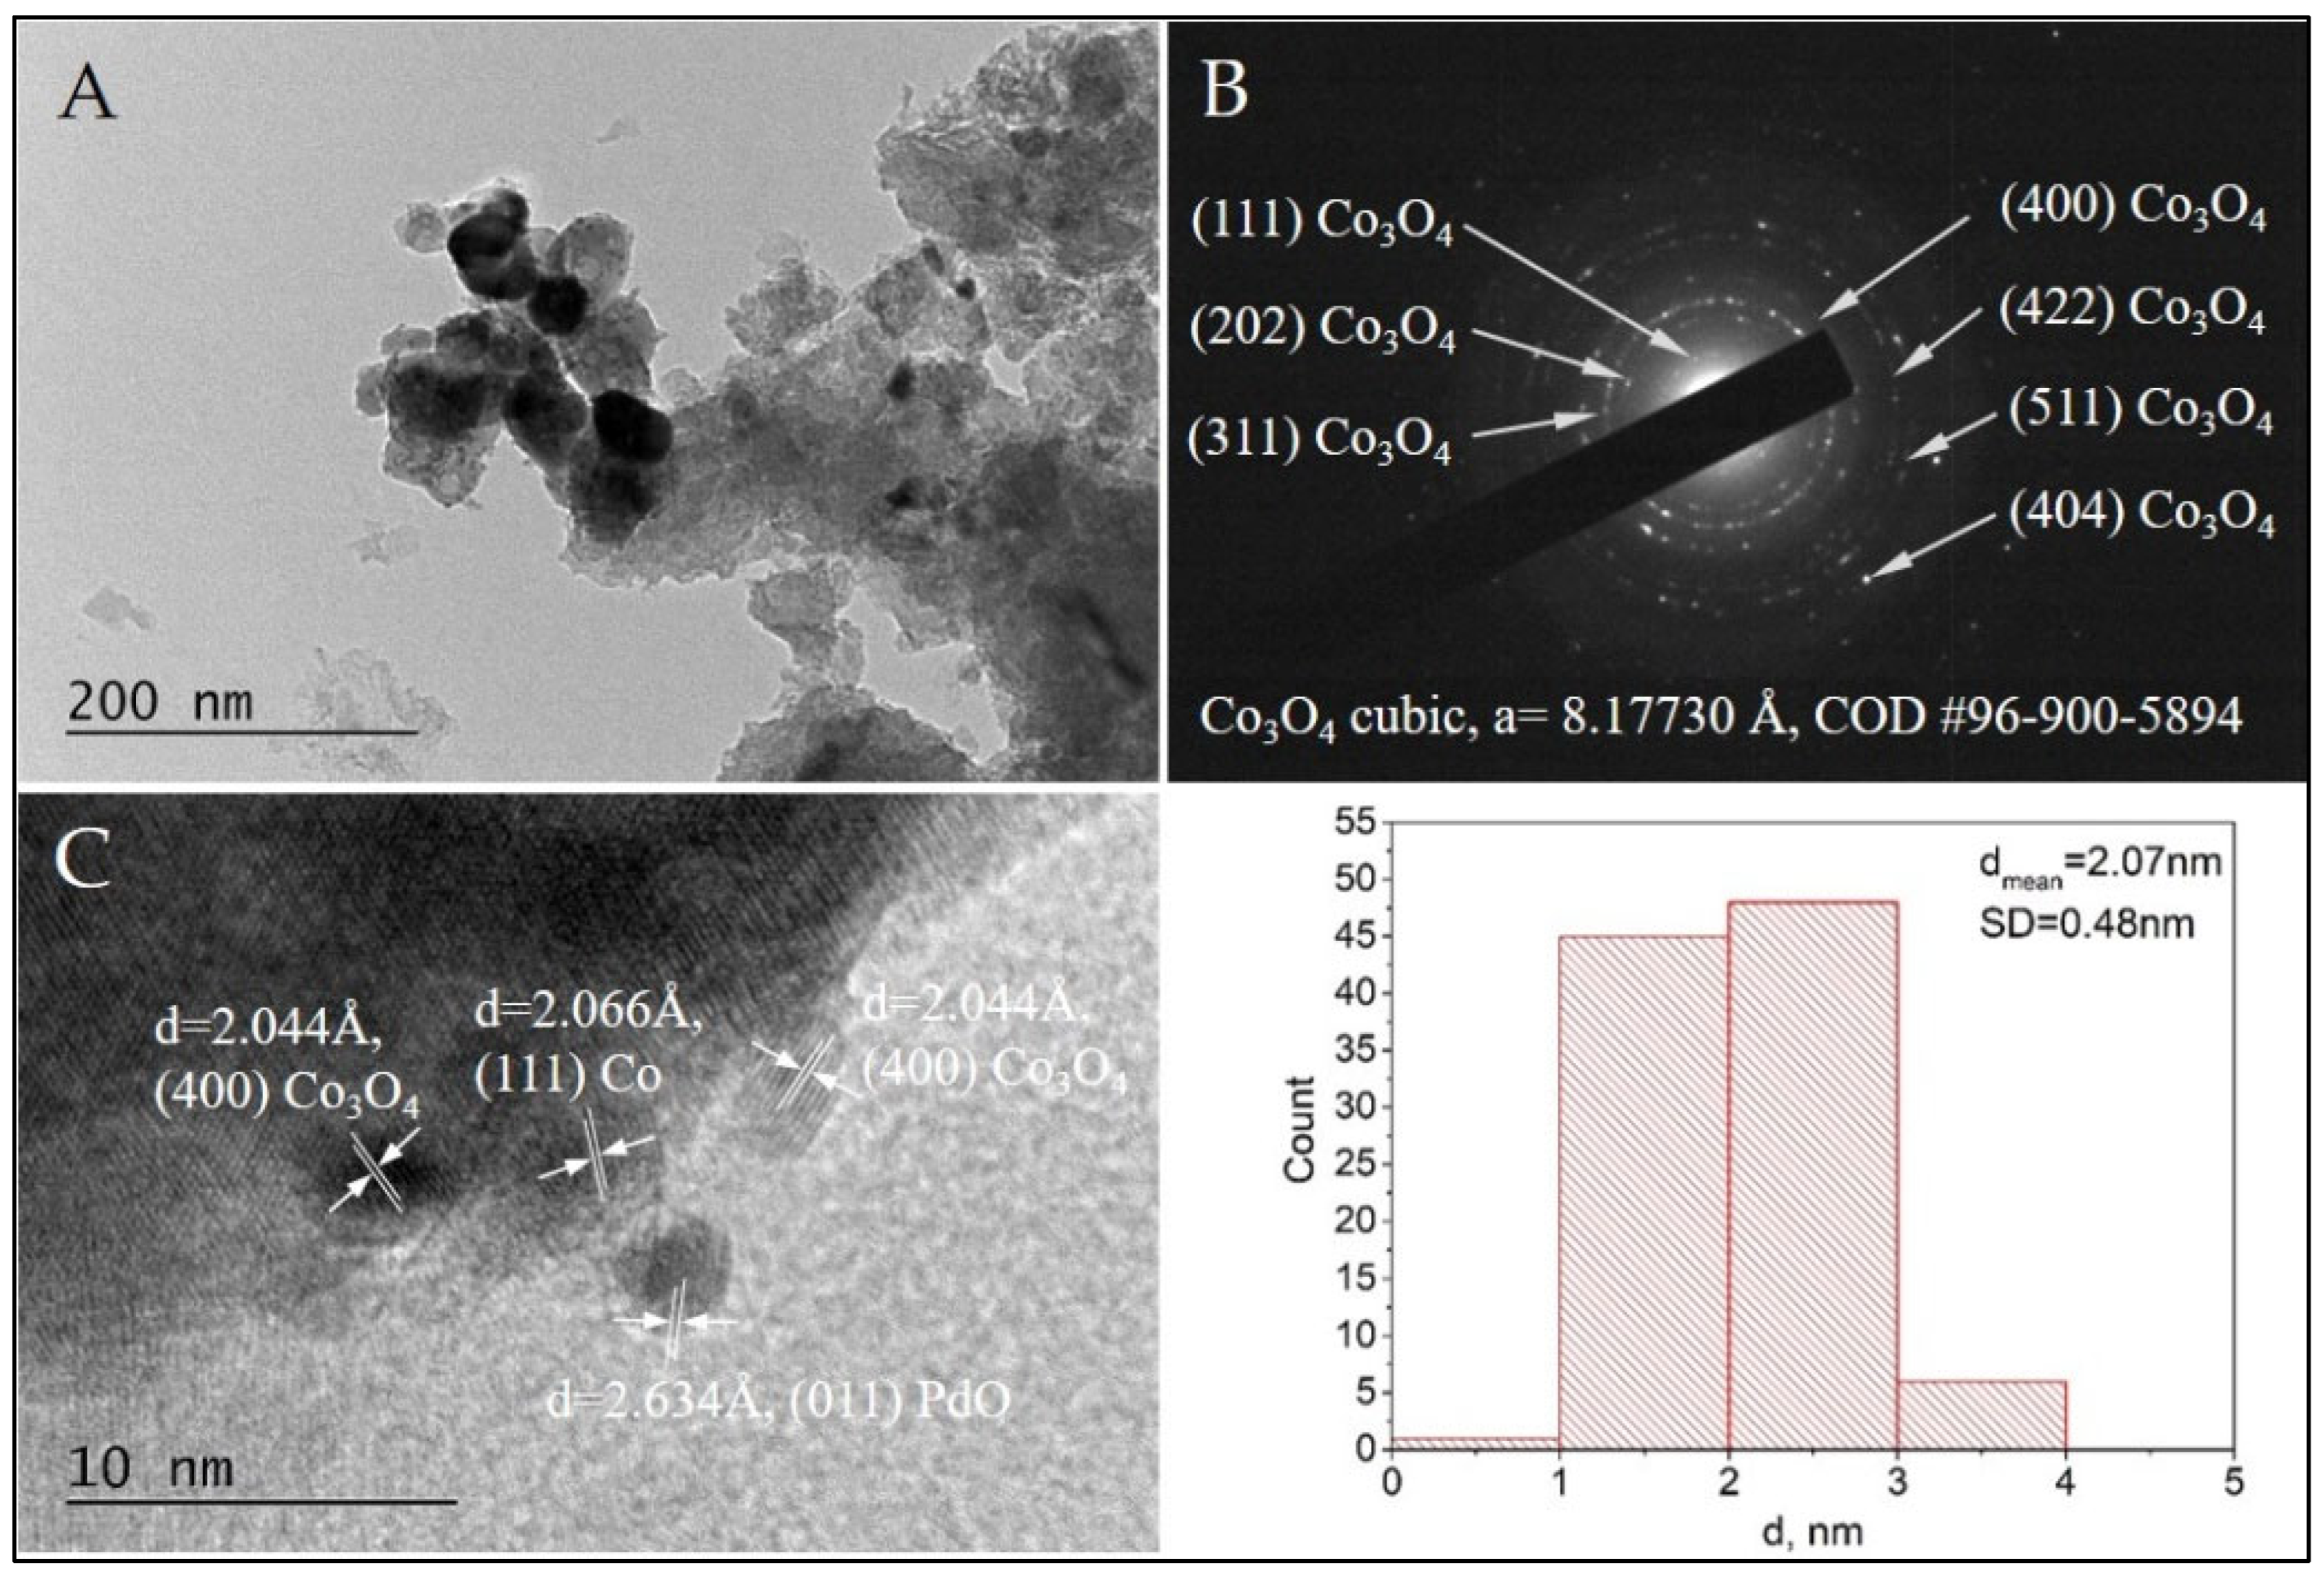
The formation of cubic Co3O4 phase (COD Entry#96-900-5894) in the Pd+Co/AAS sample is confirmed by selected area electron diffraction (SAED) indexing (Figure 8B) and HRTEM (Figure 8C). The calculated d-spacing value of 2.044 Å is appropriated to the (400) crystal plane of Co3O4, and it is one more evidence for the presence of this phase in the Pd+Co/AAS catalyst. This result is in accordance with the data received from IR, XPS, and EPR.
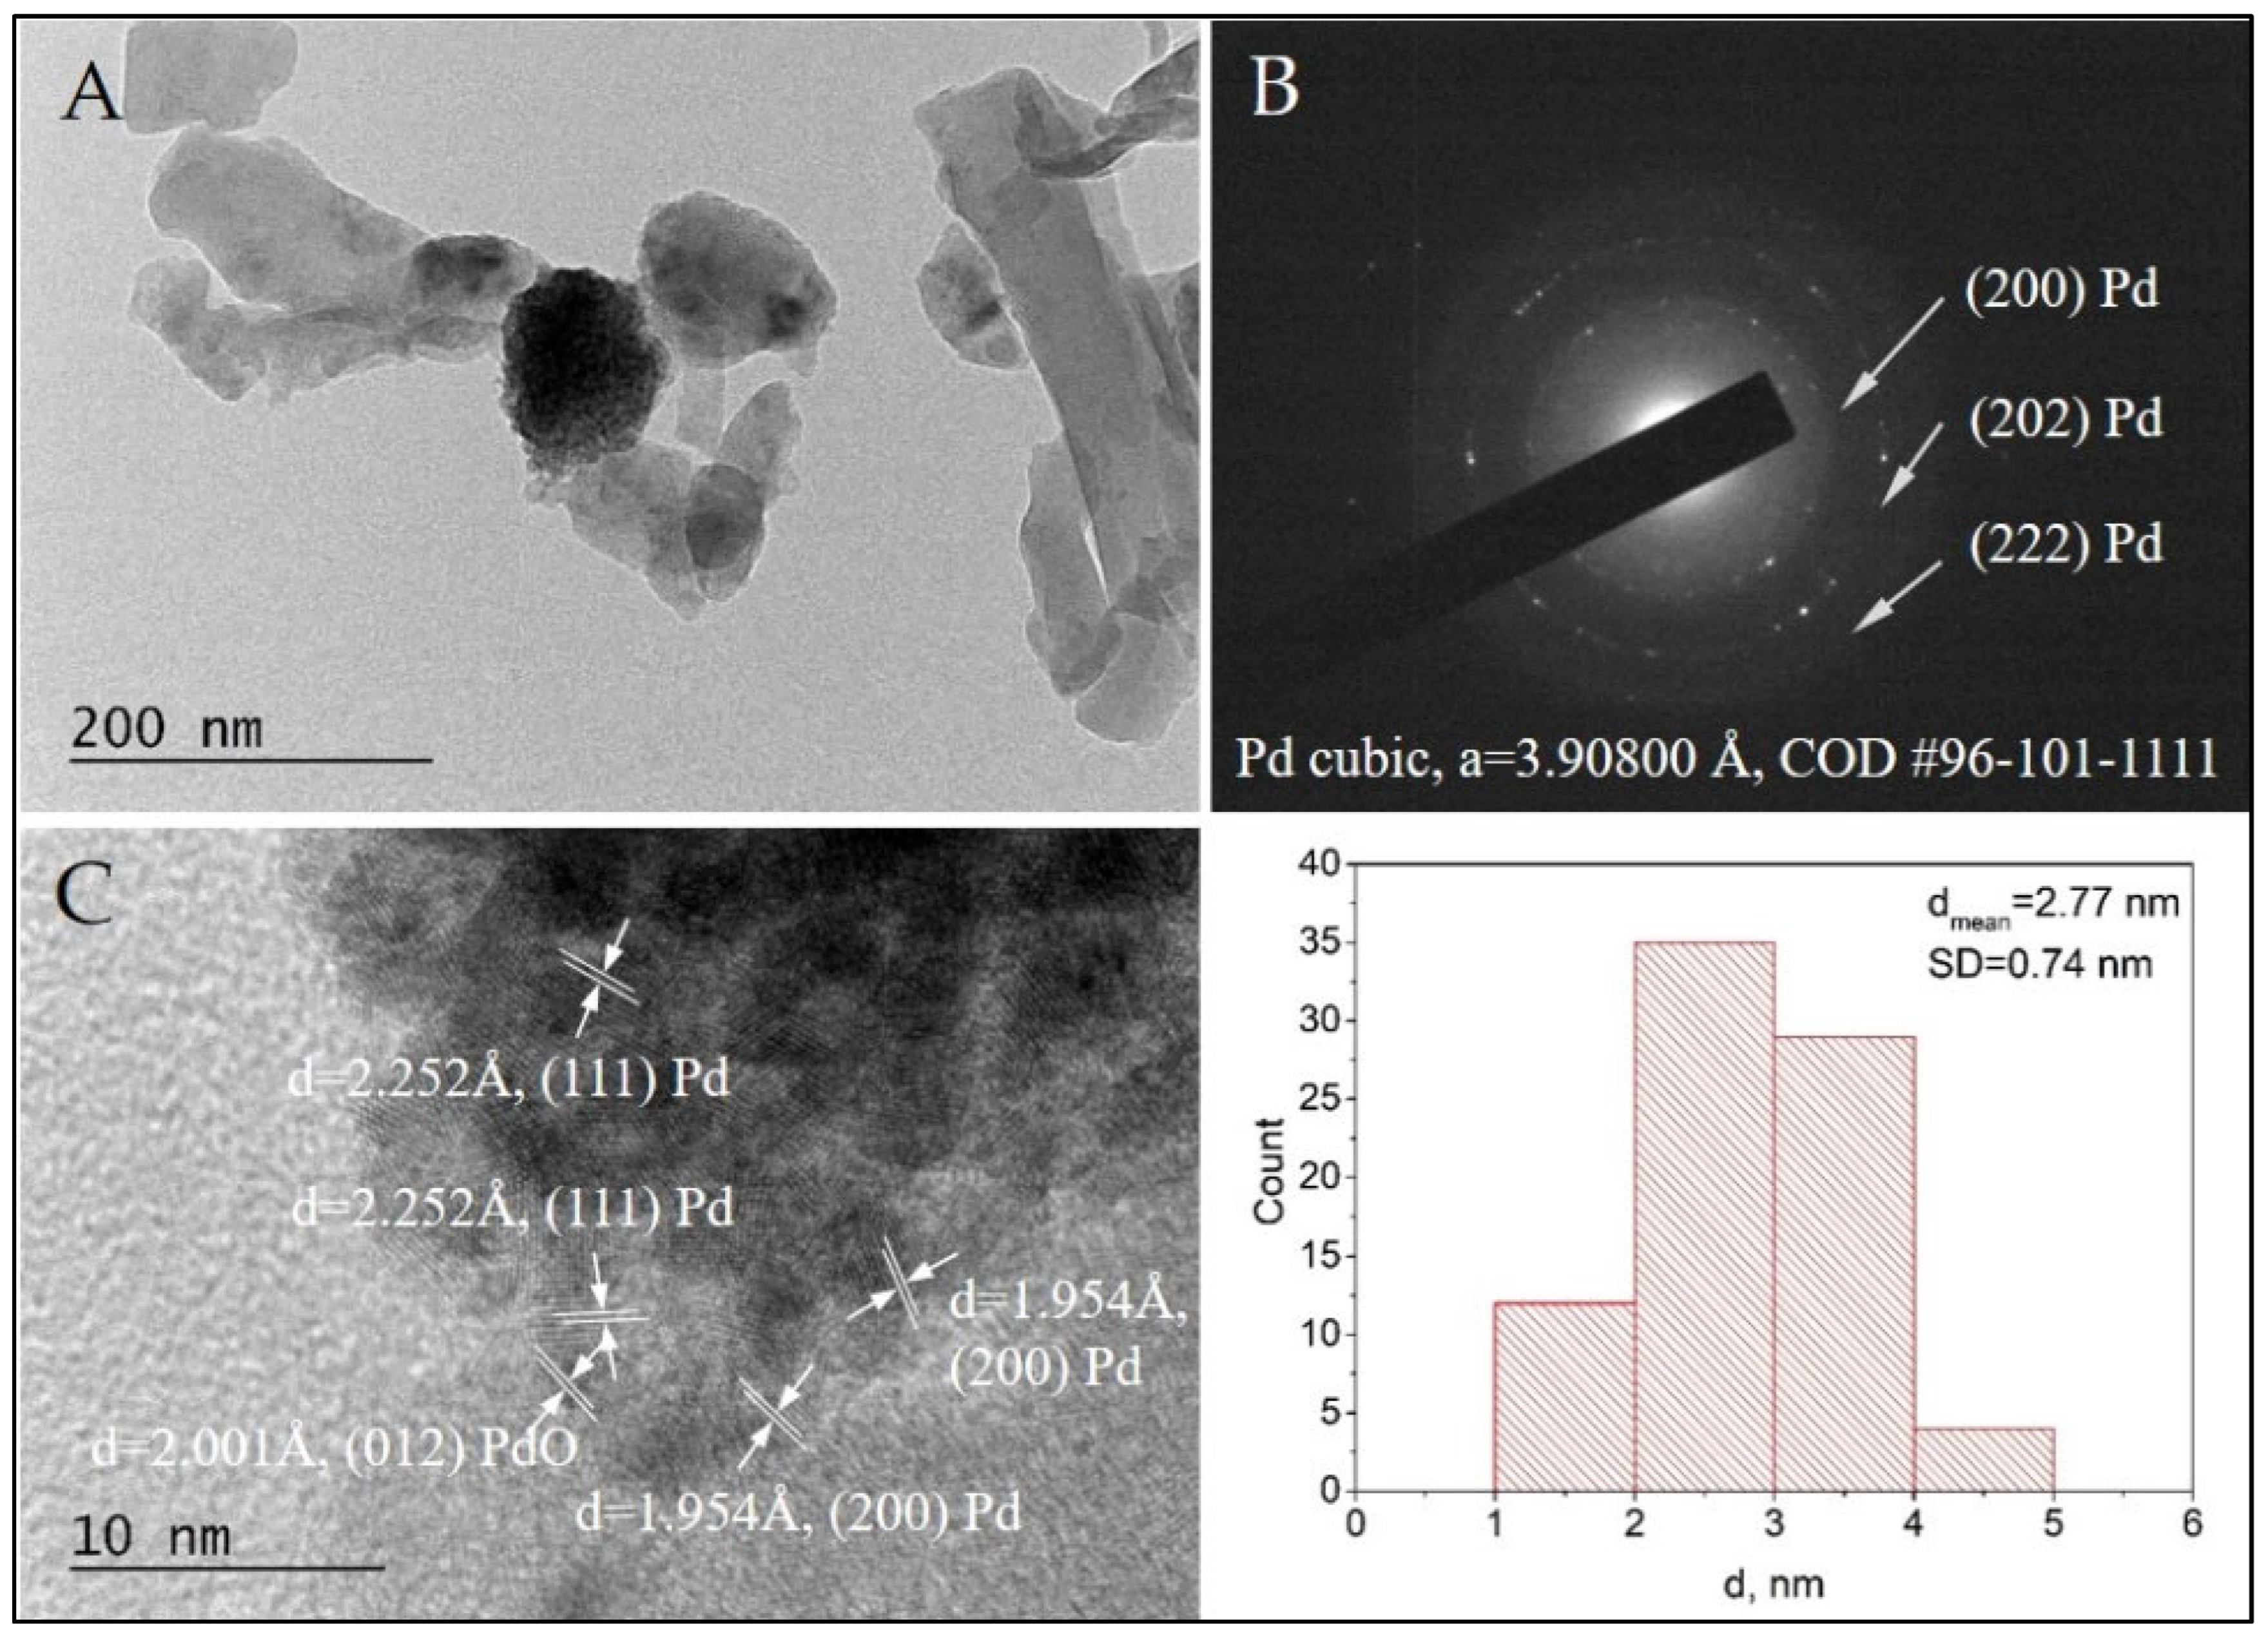
TEM observations of the morphology and microstructure of sample Pd/AAS were performed for a comparative study. The SAED analysis confirmed the formation of cubic Pd (COD Entry #96-101-1111) (Figure 9B). Additionally, the HRTEM imaging showed the co-existance of Pd (COD Entry #96-101-1111) and tetragonal PdO (COD Entry #96-100-9032) (Figure 9C,D). The presence of PdO in the Pd+Co/AAS sample was confirmed by XPS analysis. In our previous investigation, we suggested that the role of the surface cobalt oxide phase is to stabilize the palladium in its oxidized state and to serve as a reservoir of the oxygen species [27]. Direct evidence for this statement can be seen in Figure 8C, where the PdO particle is seen to be surrounded by cobalt oxide particles, and the cobalt particle in direct contact with the PdO has been reduced to metallic cobalt (Figure 8C).
The HRTEM of both samples revealed the formation of metal nanoparticles of Pd and Co, mostly oxidized to PdO and Co3O4, with a spherical morphology. The statistical analysis based on bright-field TEM imaging demonstrated the presence of populations of very small nanoparticles with a narrow size distribution. The average diameters for Pd and Pd+Co nanoparticles were estimated to be 2.07 nm and 2.77 nm, respectively. The small particle size is probably the reason for the absence of these two phases (Pd and Co) as well as their oxides in the X-ray pattern of the Pd+Co/AAS sample.

2.8. Electron Paramagnetic Resonance

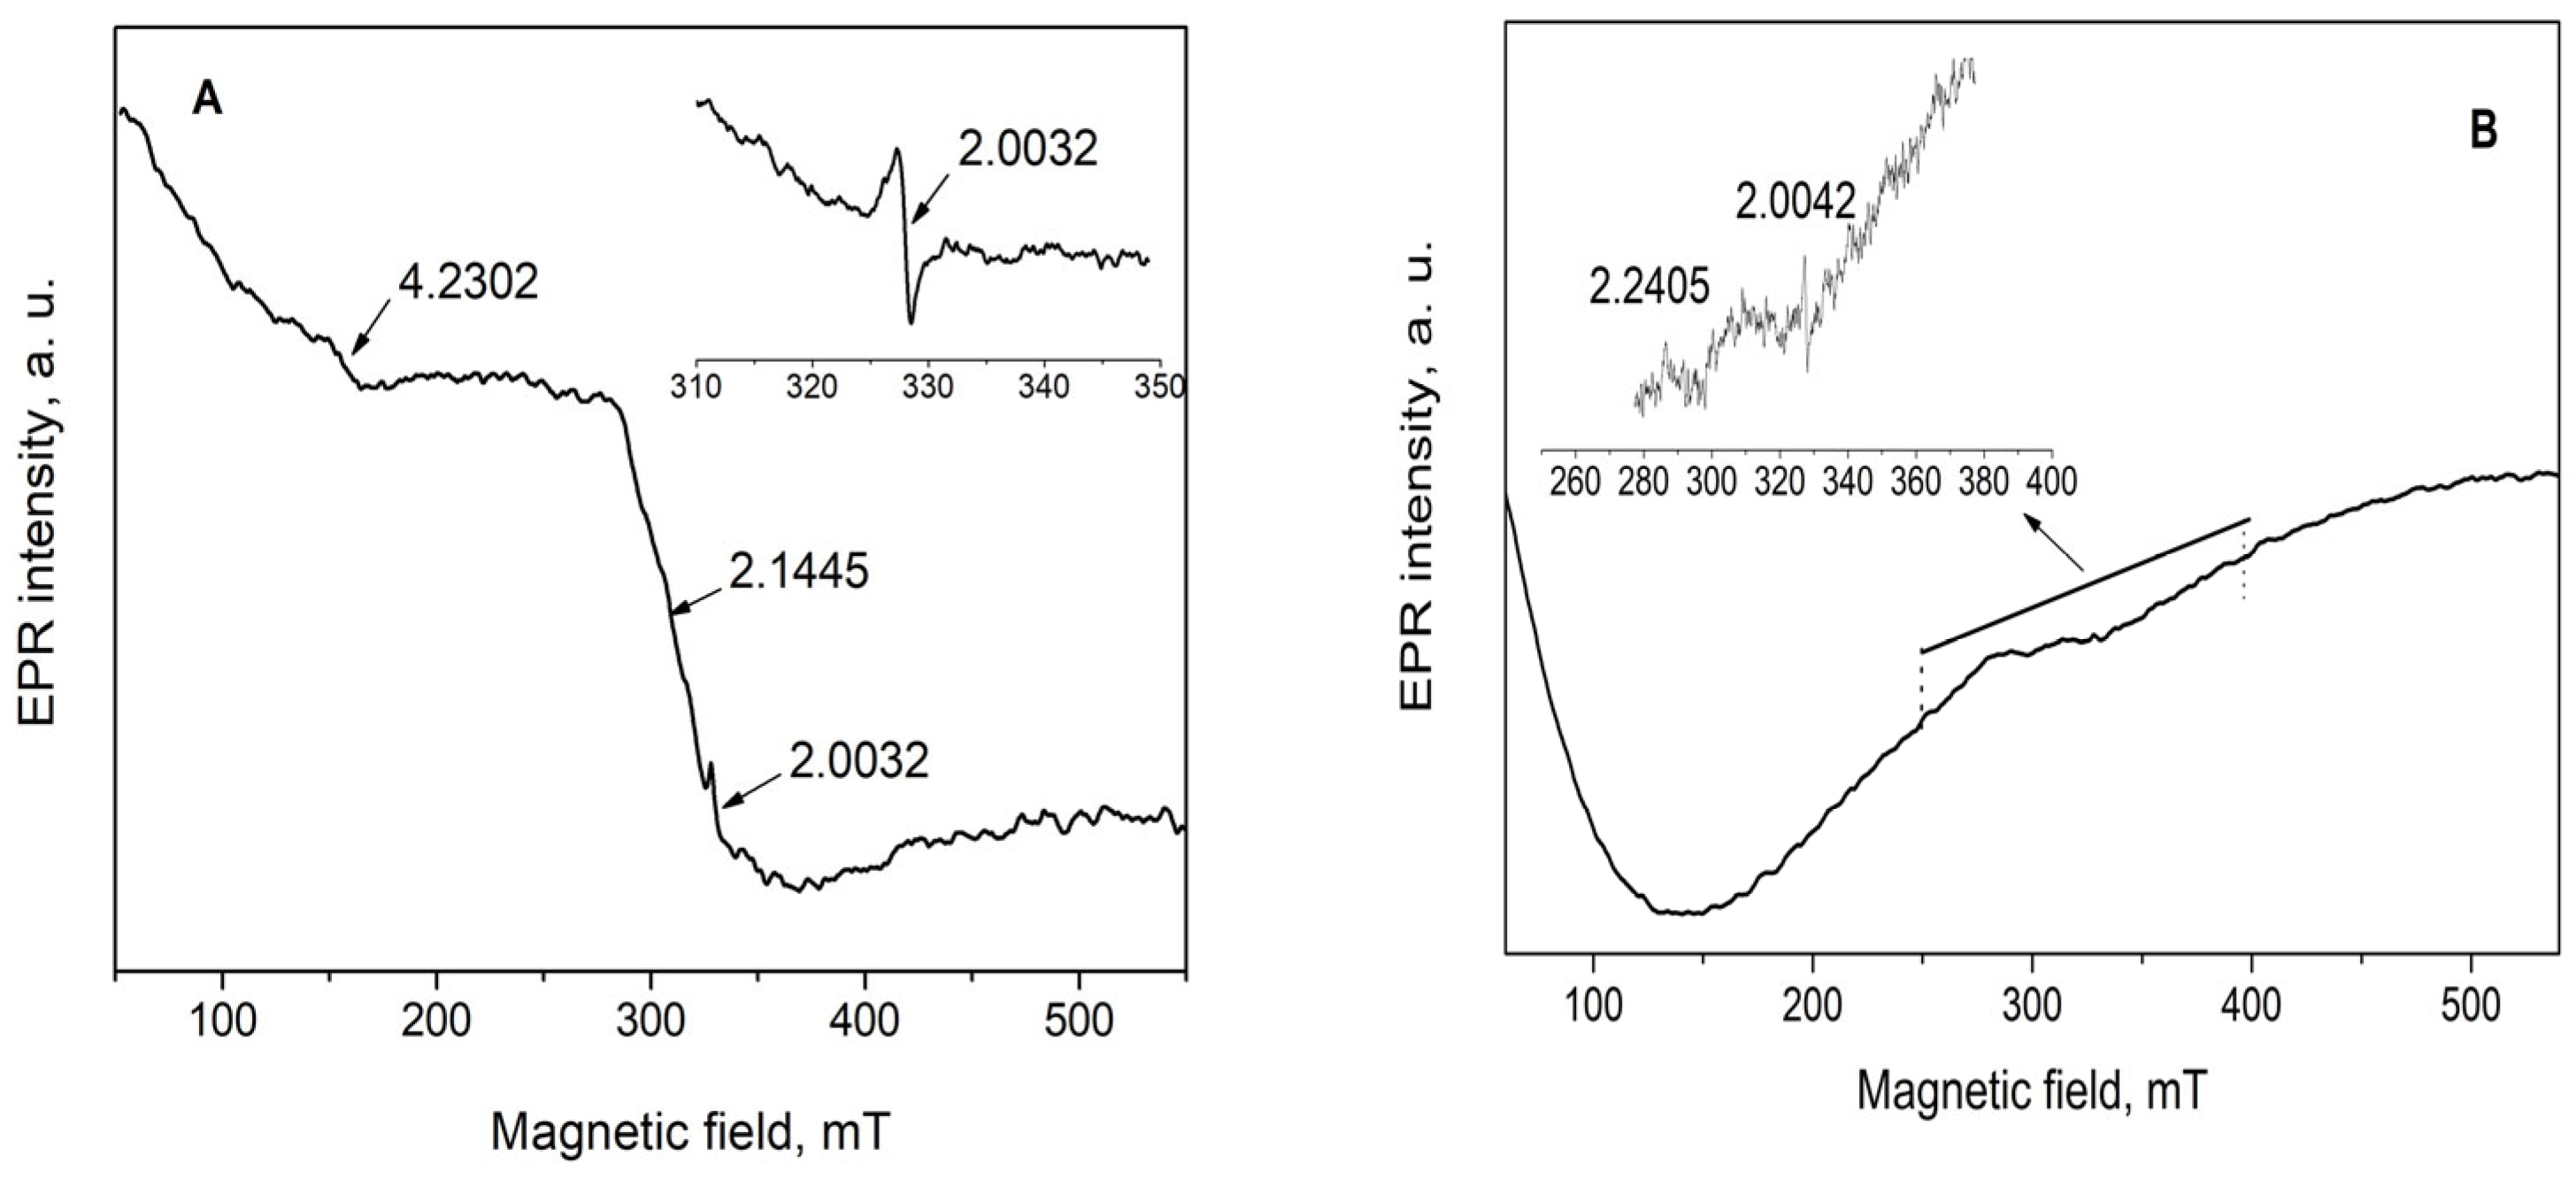
The EPR spectrum of a fresh sample is consisting of a signal at g = 4.2302 with low intensity, two overlapping signals at about g = 2.2 and g = 2.1, and a narrow signal with line width ΔH = 1.197 mT and g factor 2.0032 (Figure 10). The appearance of the signals at 4.23 and 2.2 can be interpreted as the impurity of iron species with different coordination states. [58] The EPR signal having g value 2.1445, denoted in the figure, can be attributed to tetrahedrally coordinated Co2+ in Co3O4. As was described above, the FTIR and SAED data confirm the Co3O4 presence in the sample. The weak deviation of the g factor from the g value reported in the literature is probably due to the presence of palladium in the sample.
According to literature data, the EPR signal having g = 2.0032 is due to a carbon-centered radical [59]. The carbon-centered radicals have g-values close to the g-value of free electron-2.0023. Carbon-centered radicals with an adjacent oxygen atom have higher g-values of the order of 2.003–2.004, while oxygen centered radicals have g-values that are >2.004. The g-value of 2.0032 is characteristic of carbon centered radicals in the vicinity of an oxygen heteroatom. In this case, it can belong to different kinds of carbonate radicals, such as CO33−, CO3, and CO2 captured in the material. Keeping in mind that CO33−, CO3 species are stable only at low temperatures, then this signal is most probably related to CO2 [60].
The EPR spectrum of Pd/AAS without any cobalt was measured for comparison as well. The EPR spectrum over the entire range of magnetic field shows a very broad EPR signal due to the dipole–dipole interaction of paramagnetic species in the sample. That kind of spectrum usually appears when there are more than one kind of metal ion with high concentration in the samples, which interact with each other and form metal clusters. The EPR spectrum of Pd/AAS shows two low-intensity signals of g factors 2.2405 and 2.0042. Palladium has two paramagnetic ionic forms—Pd3+ and Pd+ with 4d7 and 4d9 electron configurations, respectively. The EPR signal having g = 2.2405 can be attributed to Pd3+ species [61], and this ionic state is formed upon oxidation of palladium-containing catalysts at high temperatures. Pd in the Pd(III) form was detected by ESR spectrometry after treatment by oxygen at 500 °C in the palladium-loaded Y zeolites [62] and in the Ca-X zeolite exchanged with Pd(NH3)42+ [63]. The presence of Pd4+ established by XPS and lack of Pd3+ in the cobalt-modified samples can be considered as evidence that cobalt donates oxygen to palladium and stabilizes it in a Pd4+ ionic state.
The EPR signal of g = 2.0042 is close to the g value of a free electron (2.0023), and it may be due to carbon-centered or oxygen-centered free radicals. The oxygen radicals are unstable; therefore, more probably, the observed free radical is due to carbon.

2.9. Computational Modeling

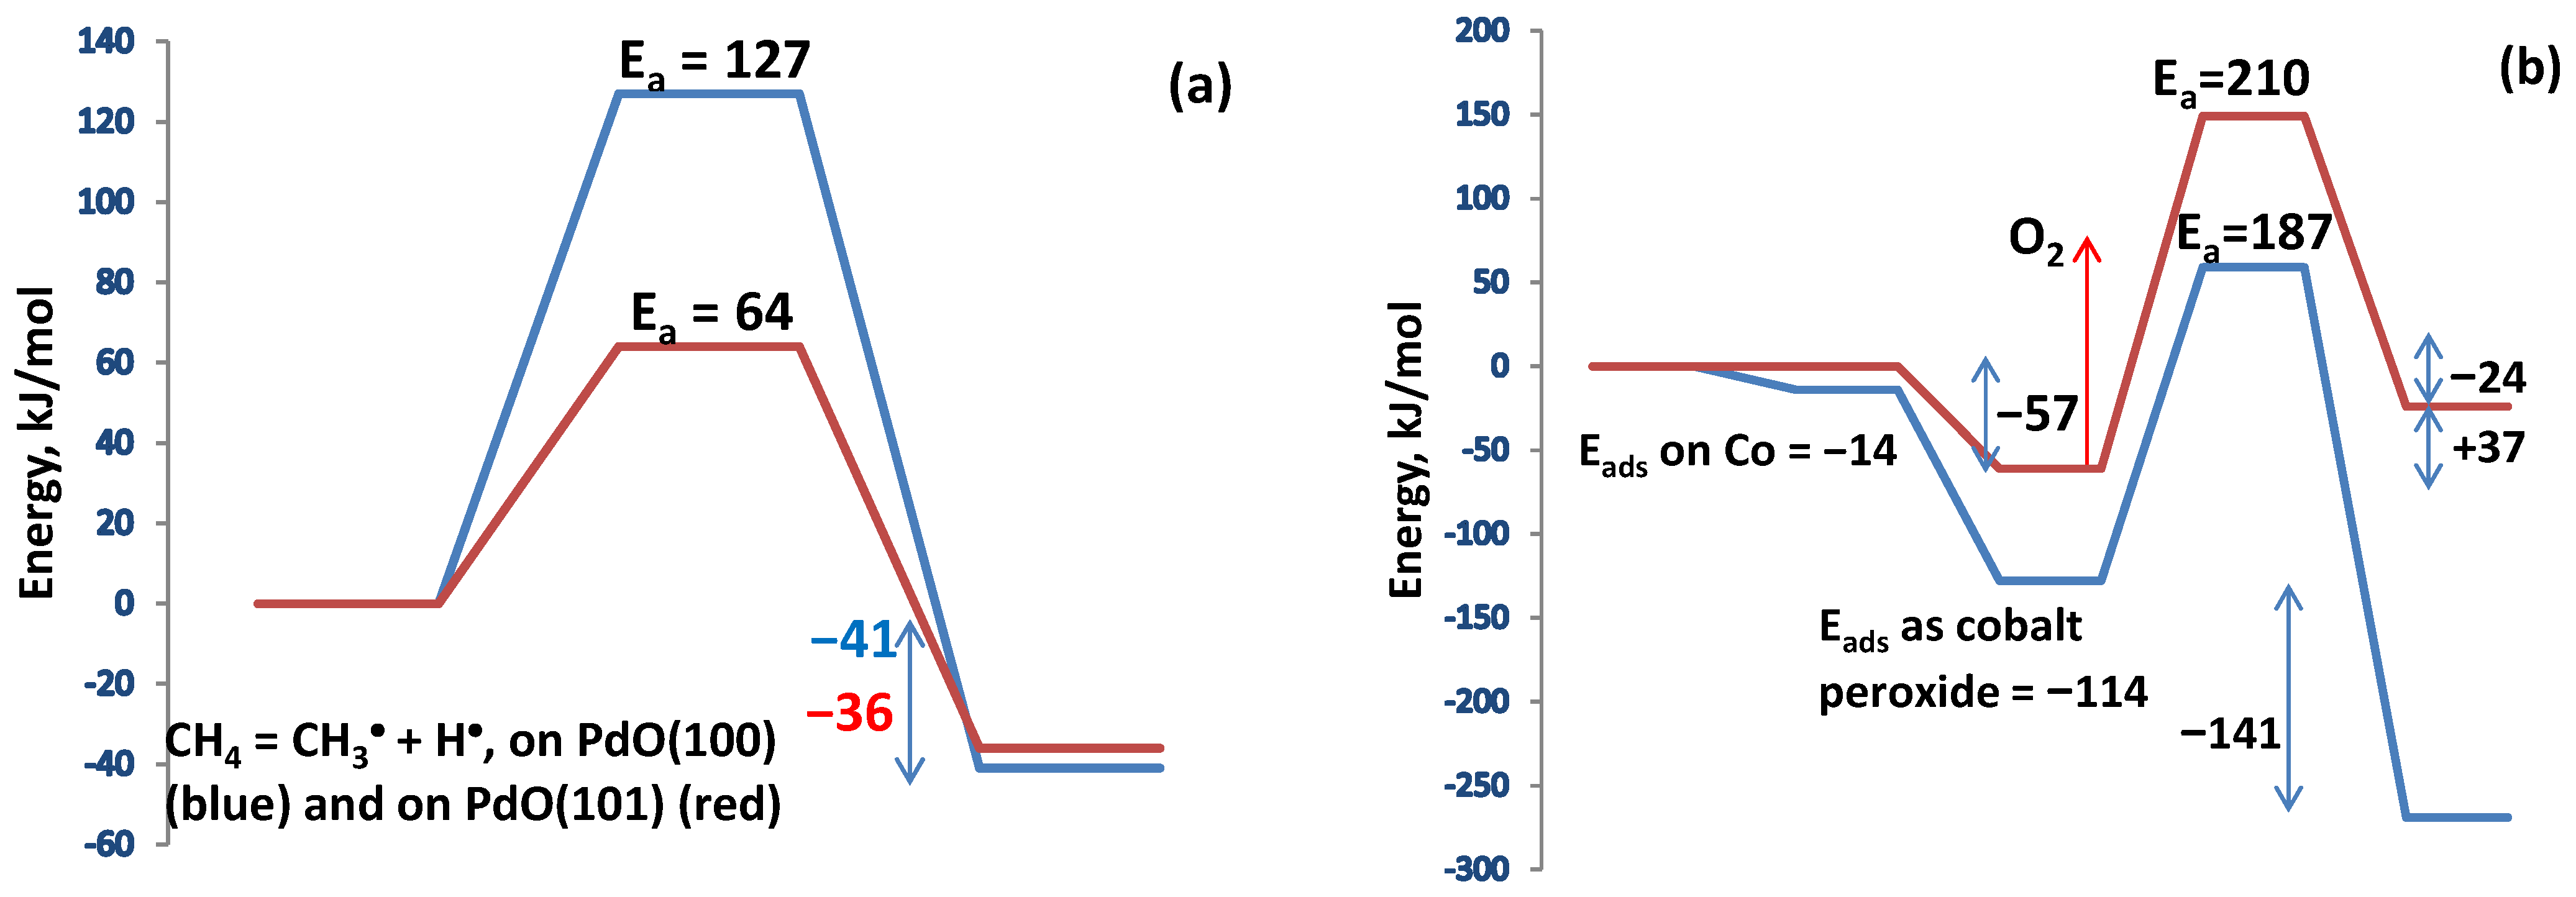
The considerations regarding the reaction mechanism were supplemented by calculations on clusters selected from the nanolayer optimization, Pd16O16 and CoPd15O16, resp. Co2Pd14O16 clusters, in which Co(II) substituted Pd(II) cations in A and B sites of the PdO structure (Figure 11). Methane is adsorbed on PdO dissociatively, and this first reaction step is considered to be the rate-determining one in a number of studies. The C-H bond in methane is strong, and without a catalyst, high energy of 440 kJ mol−1 is required to break it [64]. The PdO(100) surface is the most stable one, and therefore it prevails over other PdO terminations in a polycrystalline catalyst, but the PdO(101) surface is more active, as the energy barrier is about twice lower [65,66,67]. In the first step of methane dissociation, the hydroxyl group is formed on an oxygen atom bonded to the Pd atom, to which the methyl group is attached.
This configuration proves favorable for the coadsorption of an oxygen molecule needed for subsequent oxidation.
The oxygen molecule is activated upon its adsorption on Pd atoms as the O-O bond is elongated to 1.319 Å. The presence of surface hydroxyl groups on PdO favors oxygen adsorption because Pd cations bonded to a surface hydroxyl acquire a more positive partial charge.
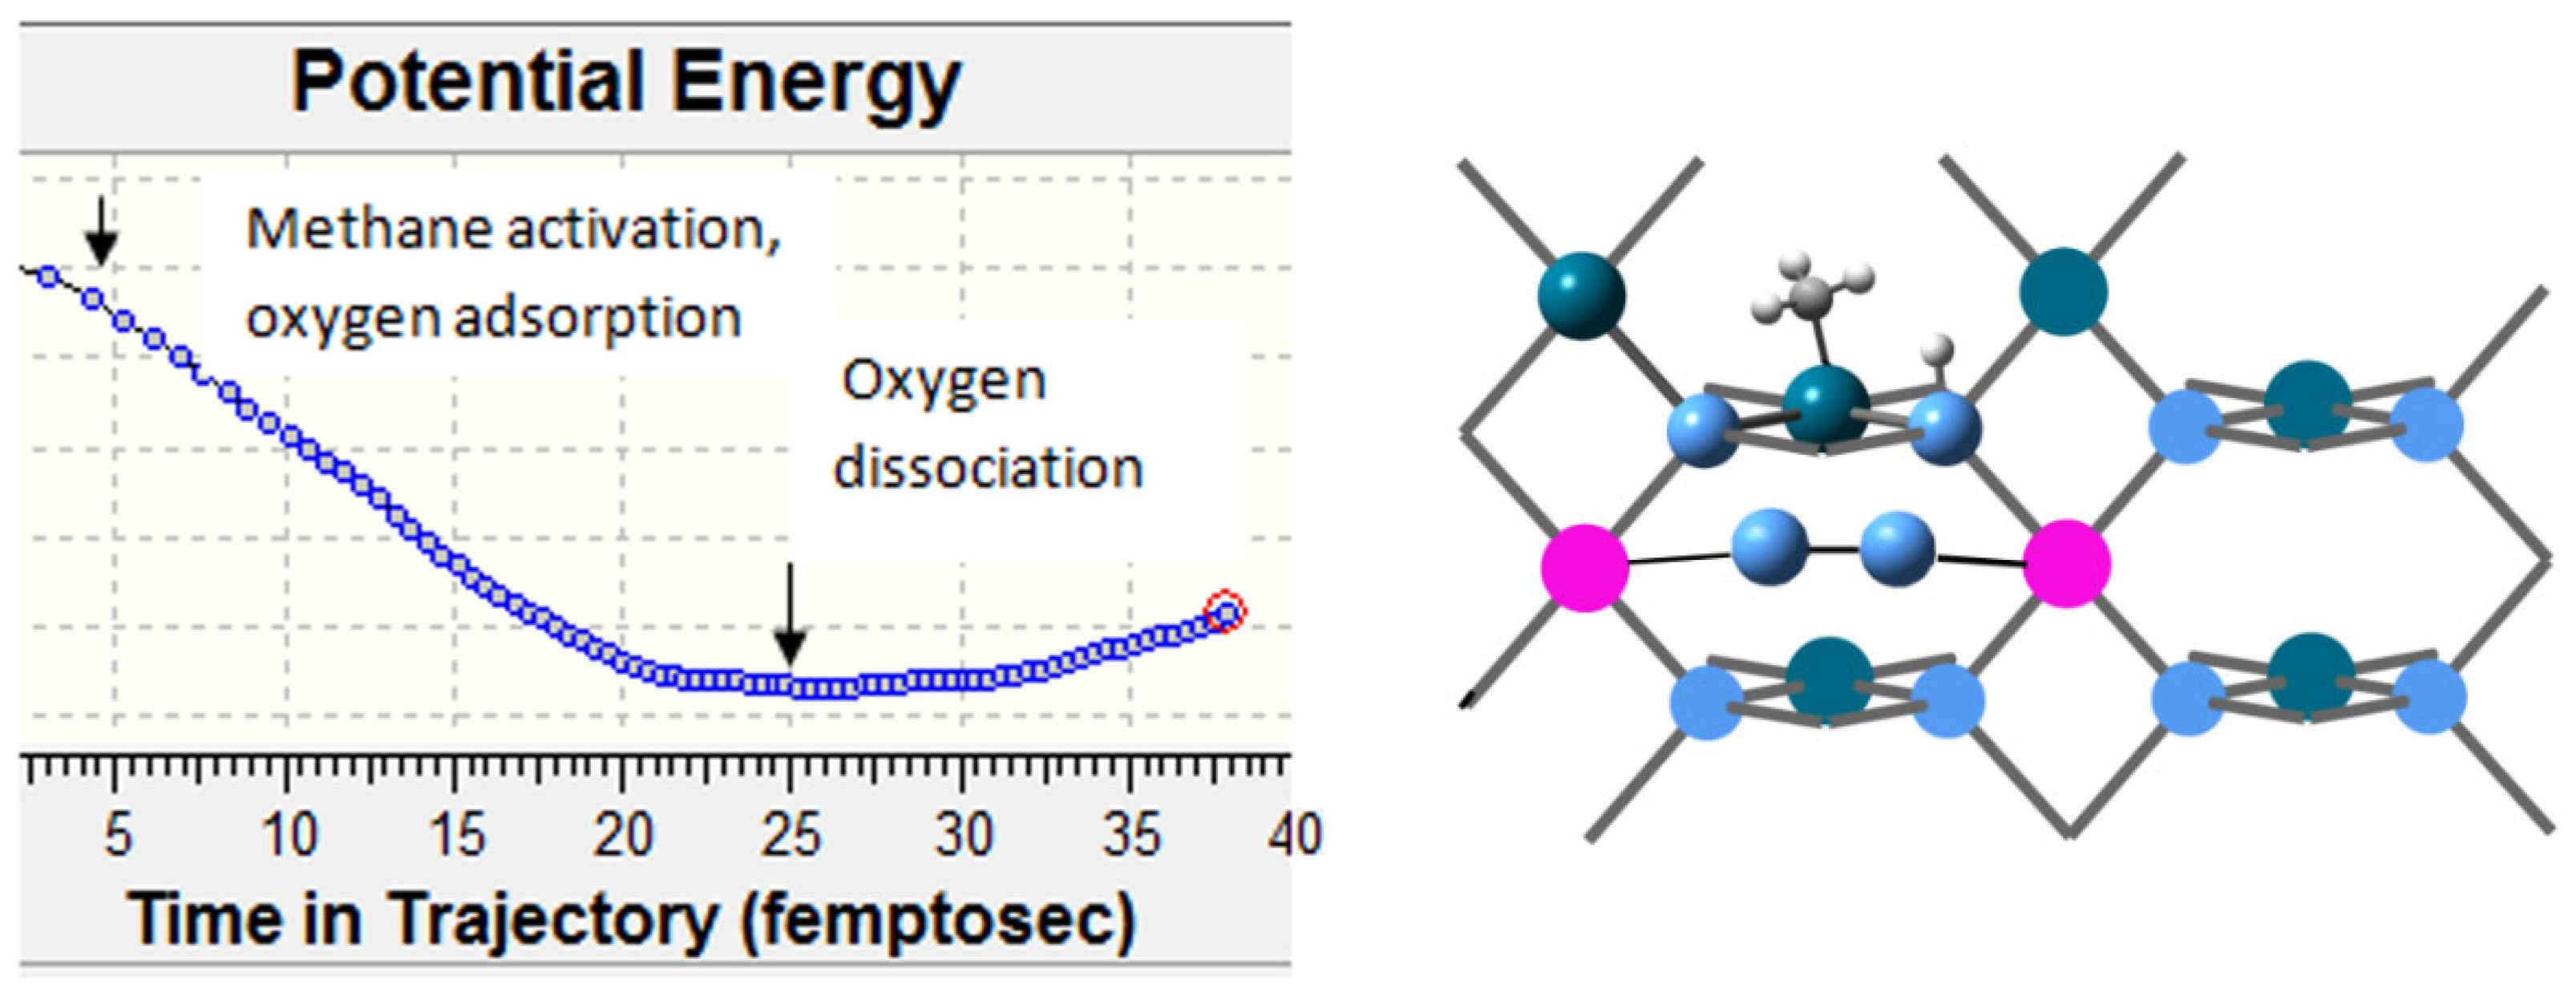
The presence of Co(II) cations favors greatly oxygen adsorption. The first step in this case is the adsorption to form cobalt peroxide. In the second step, oxygen dissociates over the nearest Pd(II) cations. Each step is exothermic, and the activation barrier to dissociation is lower compared to that of pure PdO. The role of cobalt can thus be regarded as an oxygen supplier to reduced Pd sites during oxidation. Molecular dynamics simulations reveal that on pure PdO, activation of methane occurs prior to oxygen adsorption.
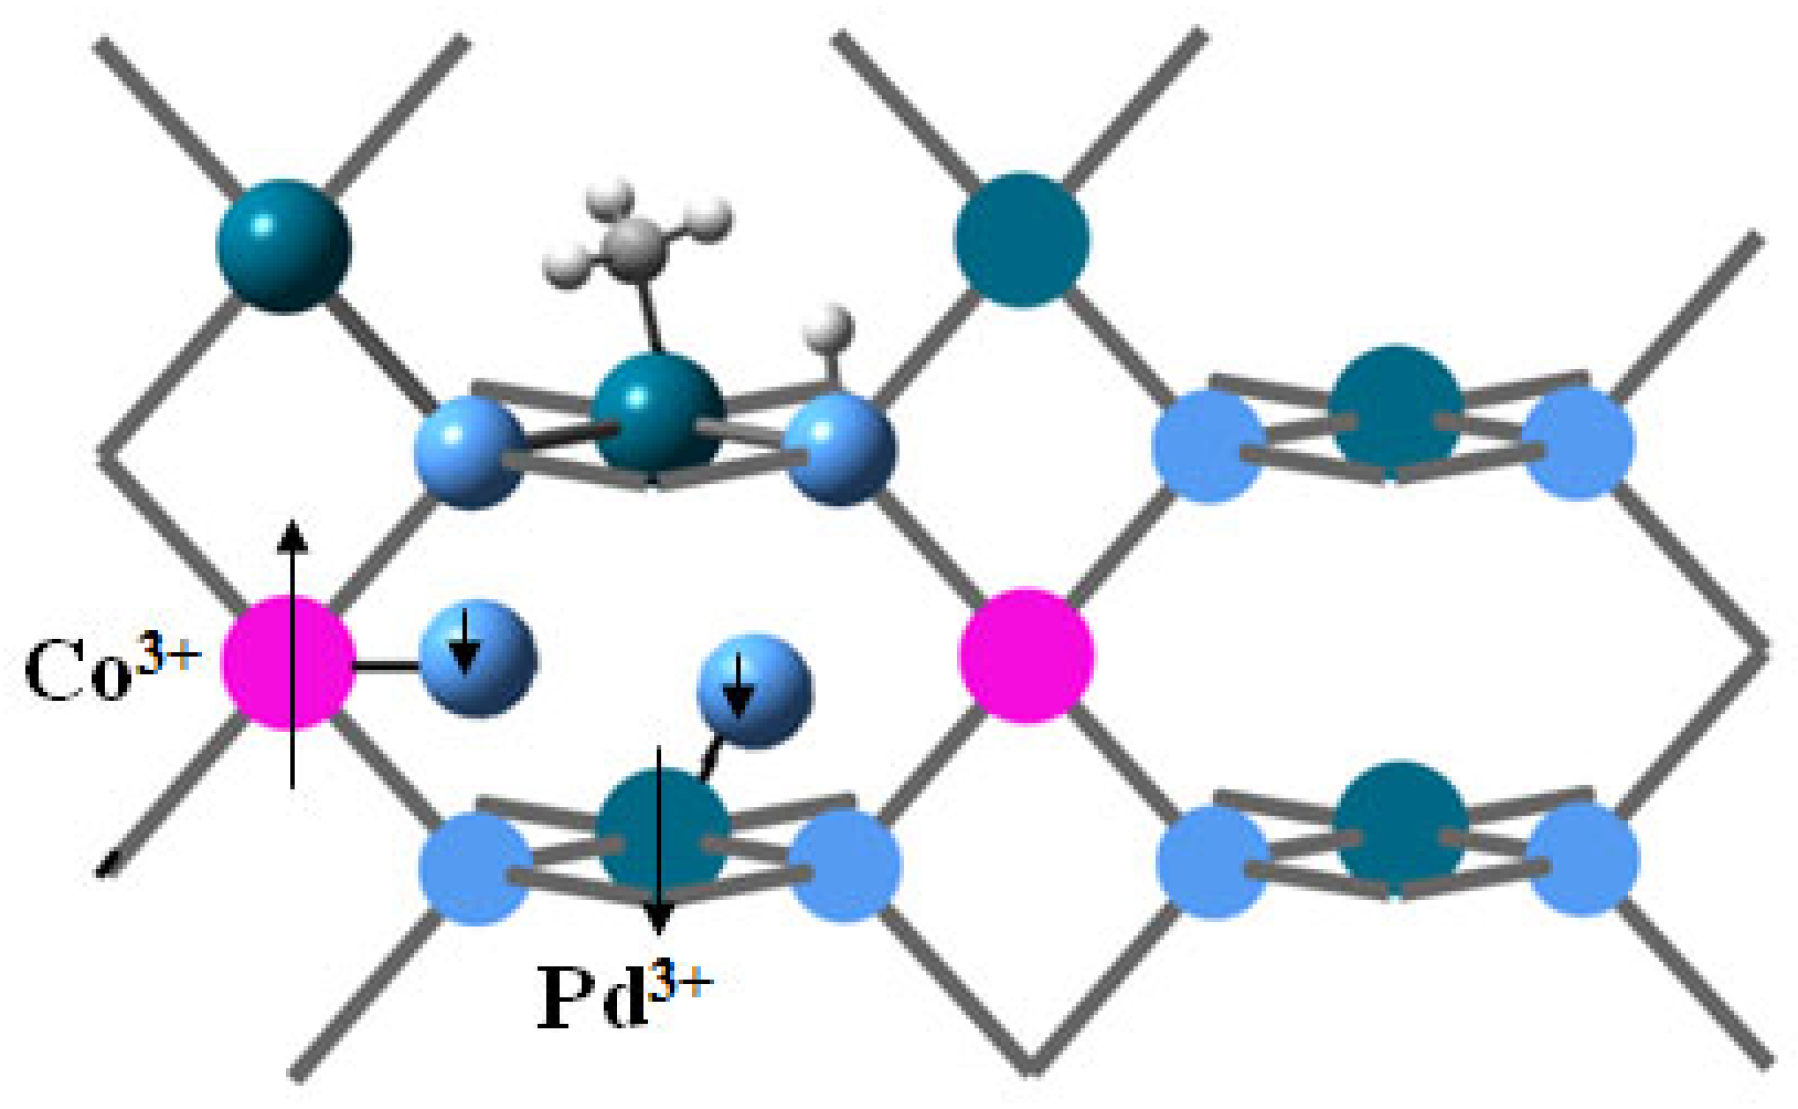
The results indicate that on Co(II) ions, the oxygen adsorption is faster in comparison to that on Pd(II). Dissociative adsorption on Co(II) is favored on neighboring Co(II) ions, forming bridging peroxides, Figure 12.
The methyl group, located on Pd cations after the dissociative adsorption of methane, is highly reactive, and it undergoes further reaction to oxygen-containing intermediates, among which HCHO is most important. In the presence of surface hydroxyl groups and dissociative oxygen adsorbed, HCHO is formed in a spontaneous (no energy barrier) strongly exothermal reaction (ΔH = −210 kJ mol−1).
The local charges on cobalt and the nearest palladium sites increase upon oxygen adsorption, Table 3. Since the bonds formed are predominantly covalent, the local charges alone do not provide information about the oxidation state of cations; however, the changes in spin density indicate that Co(II) becomes Co(III), and the induced magnetic moment on Pd indicates the presence of Pd(III), and the two cations are anti-ferromagnetically coupled, but the spin moment is not quenched by the interaction of metal cations alone; the adsorbed triplet oxygen also orientates its spin moment in antiferromagnetic interaction with cobalt, Figure 13. The dissociation of oxygen re-oxidizes the cations after the first catalytic cycle, accompanied by the release of HCHO through a Mars-van Krevelen mechanism, Figure 14. PdO2 is present in the fresh catalyst sample, and while this site can also be re-oxidized by dissociative adsorption of oxygen on Pd, this process is endothermal and energetically less favorable.

2.10. Reaction Mechanism and Kinetics of Methane Combustion on Pd+Co/AAS

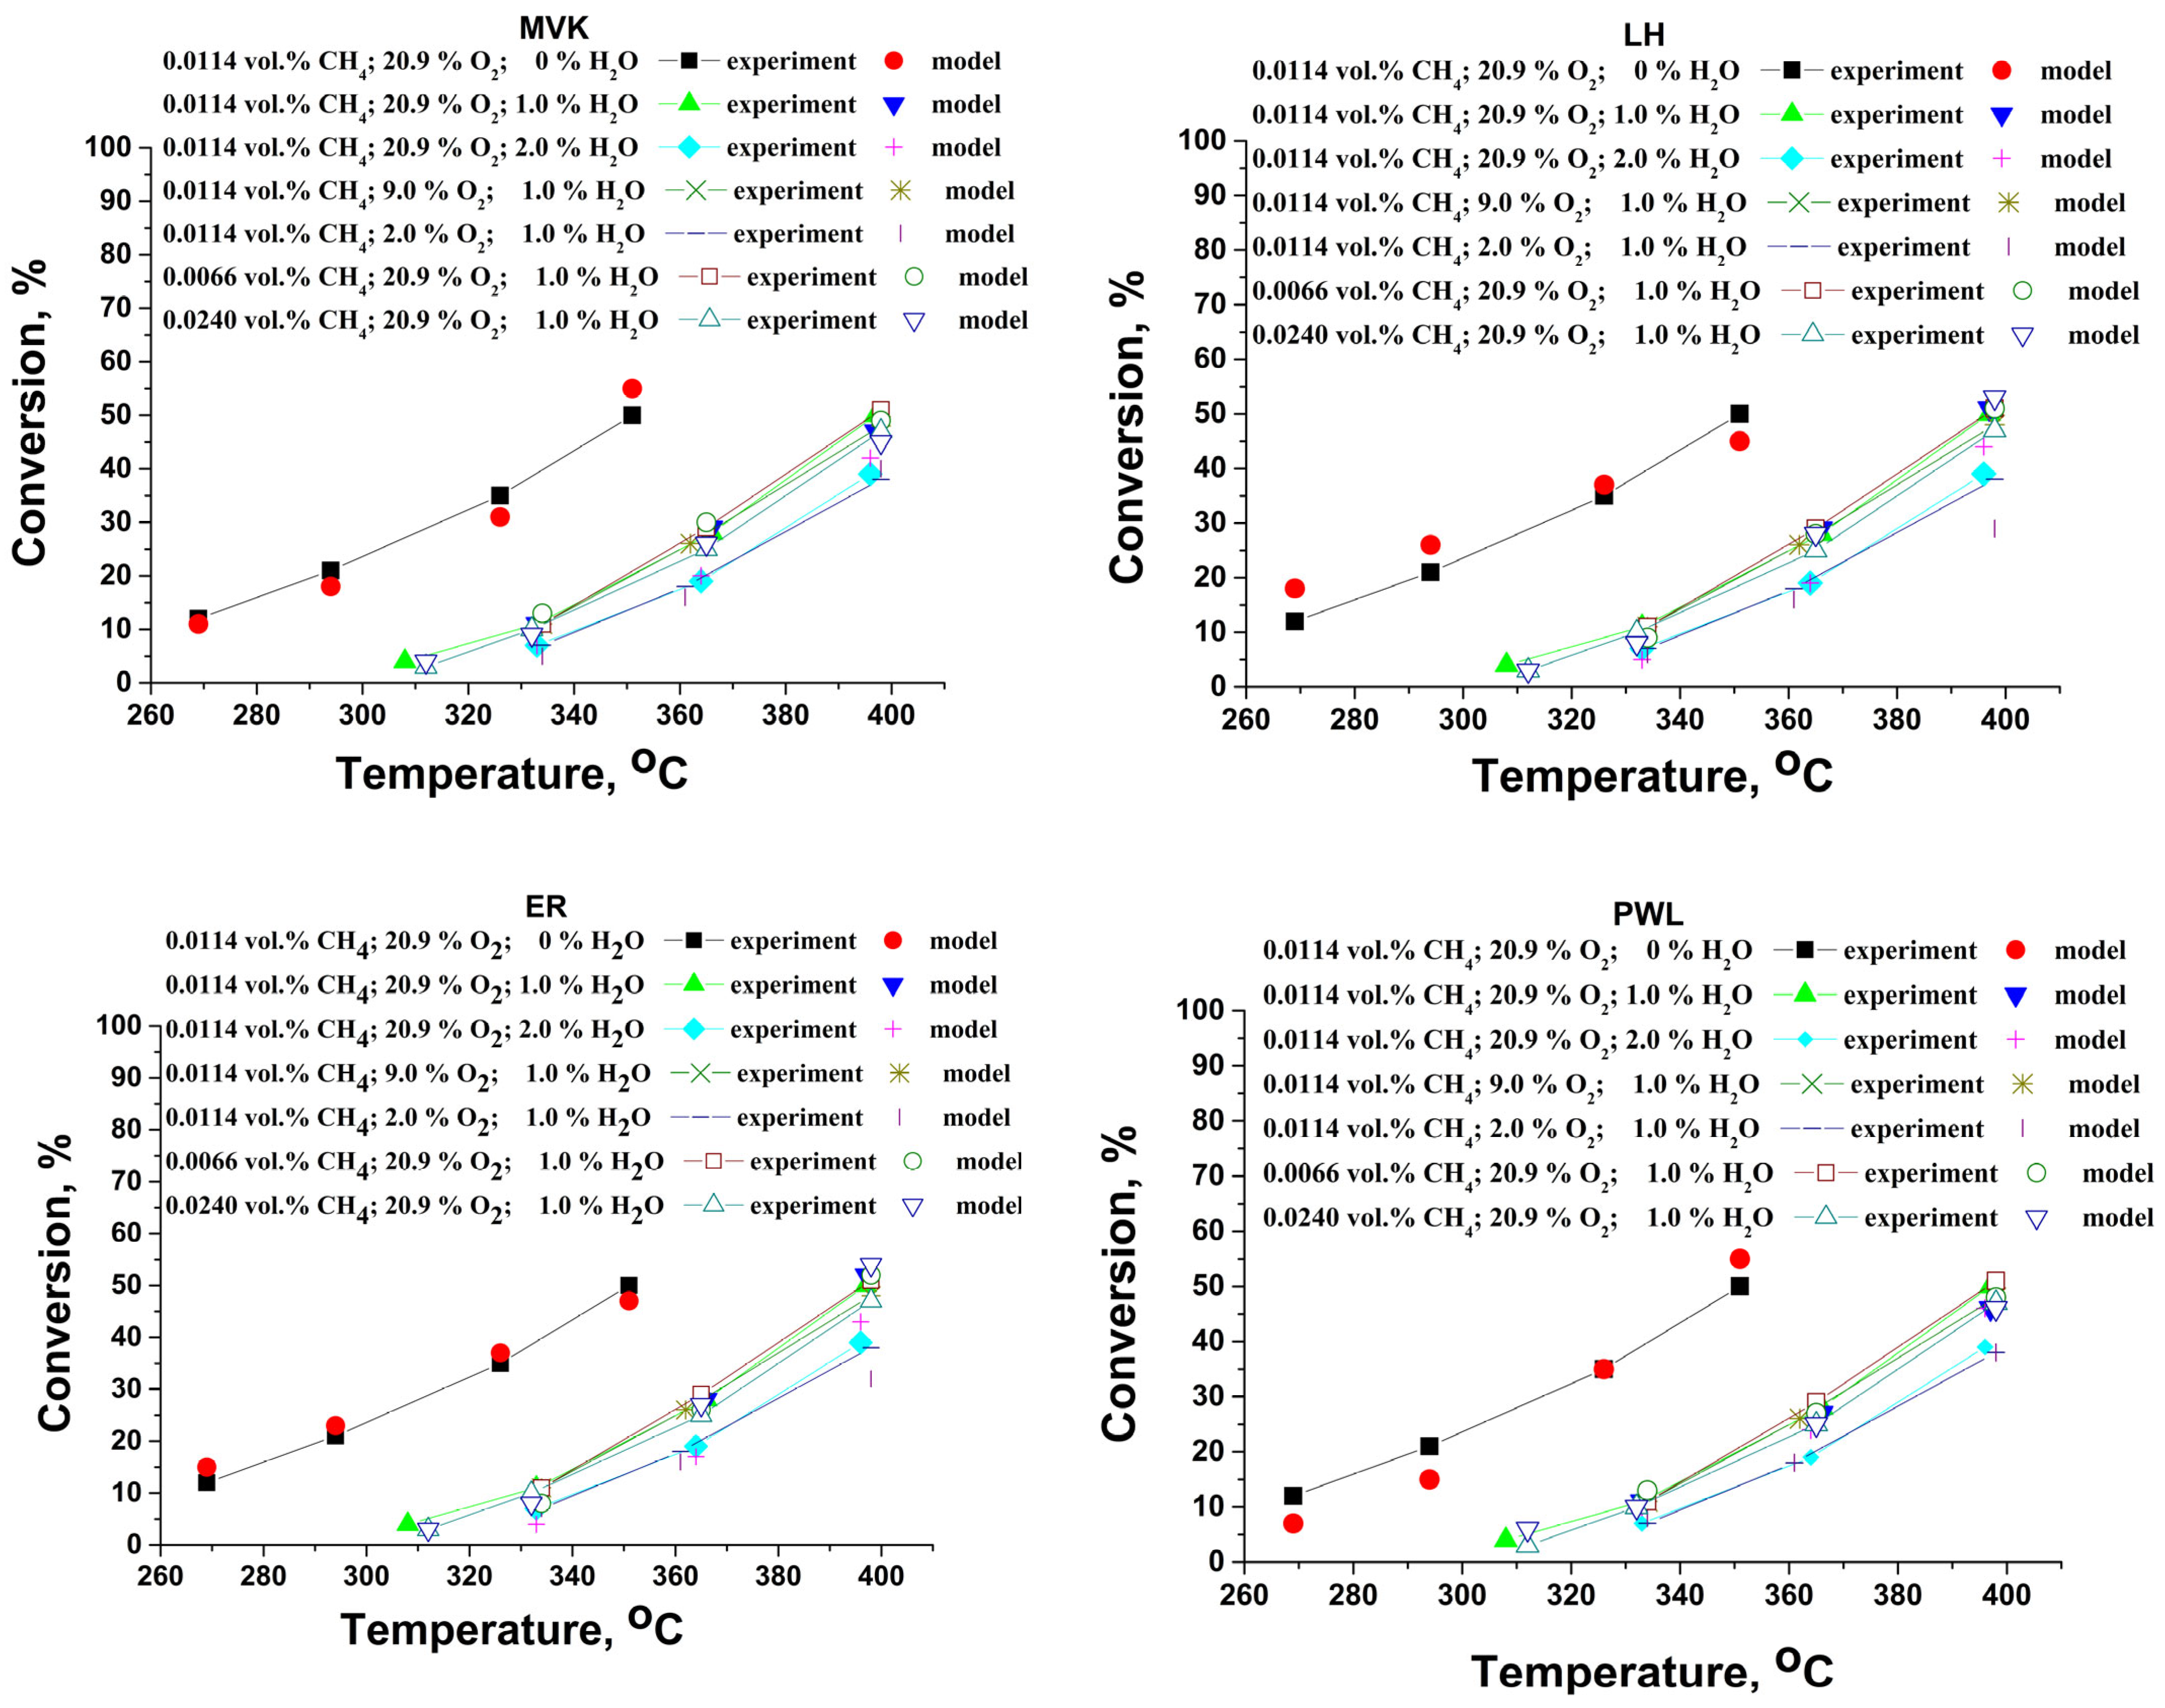
Using the procedure described by Duprat [68], the inlet concentrations of the reagents were varied and the corresponding kinetic parameters were calculated. Figure 15 shows the temperature dependence of the methane conversion degree during the complete oxidation at different reaction conditions. An earlier publication [69] included information on the calculation procedure. Utilizing a numerical nonlinear optimization process based on iterative gradient reduction, the material balance of an isothermal plug-flow reactor (PFR) was solved. This allowed for the estimation of the kinetic parameters based on the experimental results (conversions below 40–45%). The conversions below 40–45% were used in order to minimize the effect of the internal diffusion limitations where the effectiveness factor is close to unity. Obviously, at higher temperatures, where the reaction is very fast, the resistance due to the internal diffusion plays a more significant role, and the decreasing of the effectiveness factor cannot be neglected. The square of the correlation coefficient (R2), the squared sum of the residuals (RSS), between the observed conversions and the model predictions, is reduced during the optimization process. In order to find the global minimum, the fitting software was run under various sets of reaction conditions.
Within the current investigation, a power law kinetic model (PWL) has been used as a first approximation. Table 4, Table 5, Table 6 and Table 7 show the calculated kinetics parameter values.
The inhibition effect of water vapor reflects the observed reaction order—the value is −0.16. Similar negative reaction orders with respect to the water were discussed earlier [27]. It should be pointed out that the water vapor is present in all exhaust gas compositions, and its impact on the performance of the catalytic converter is very significant. The reaction orders towards methane are ranging between 0.90 and 0.95, and taking into account the values for the oxygen reaction order (0.2), one could conclude that the catalytic surfaces are predominantly covered by the oxygen species and the methane is suffering from a lack of vacant active sites for its dissociative adsorption.
Regarding the oxygen, the reaction order values (approximately 0.2) indicate that the oxygen reaction route involves interaction with the catalytic surface (adsorption step with dissociation). This is not the case for methane, where values approaching unity also indicate the possibility of direct reaction from the gas phase (Eley–Rideal mechanism [70]). According to the rate equation, the partial pressure of oxygen should increase to the power of 1/2 when it undergoes dissociative adsorption [O2 + 2Z → 2Z(O)].
Based on the parameters calculated based on the PWL model and the DFT calculations, the following mechanistic models were selected for fitting with the experimental results:
-
Mars–van Krevelen (MVK) mechanism, water molecules compete with the methane molecules for the oxidized or reduced sites;
-
Langmuir–Hinshelwood (LH) mechanism, water molecules compete with the oxygen and methane for the same type of adsorption sites,
-
Eley–Rideal (ER) mechanism, water molecules compete with the oxygen for the same type of adsorption sites, and methane molecules react directly, impinging from the gas phase.
The model simulations indicate that the reaction pathway over the Pd+Co/AAS catalyst most likely follows the Mars–van Krevelen mechanism, where the water molecules adsorb on both reduced and oxidized sites and the reaction products are slowly desorbed (Table 6). Based on the surface coverage, the calculated rates of oxidation and reduction correspond with the fundamental presumptions of the MVK model for the step that rate-determining (the hydrocarbon molecules react with the oxidized catalytic surface) [71]. Despite the experiments indicating that the Mars–van Krevelen mechanism is the most probable, it is not correct to exclude the Eley–Rideal mechanism, which involves methane to react from the gas phase.
The MVK model predicting adsorption of water molecules on the PdO sites is in accordance with the model of Ciuparu et al. [72,73]. According to these authors, methane molecules are dissociatively adsorbed on the PdO ion pair, generating surface OH groups and methyl groups. Supports having high oxygen mobility can easily exchange oxygen with the PdO particle, and, thus, they contribute to the oxygen balance of the PdO phase [74]. According to the literature data, the Co2+ ions can be active sites for oxygen adsorption and the formation of activated oxygen species [75]. The formation of such oxygen species could contribute to the refilling process of the oxygen vacancies in the active Pd phase, thus stabilizing it as the PdO phase. Theoretical calculations show that the synergism between Pd ions and Co ions at the interface can enhance the interaction between active oxygen species and the catalyst surface [55].
For practical evaluation, it is of interest to obtain data on the catalytic activity of the Pd+Co/AAS model composition under conditions close to the operation of the catalyst in the form of a monolithic catalytic element. The results are represented in Figure 16.
The combustion of methane in a monolithic reactor was simulated using a two-dimensional heterogeneous model of a monolithic channel. In order to simulate adiabatic monolithic elements for pilot-scale and full-scale reactors for the reduction of methane emissions under conditions that are similar to real practice (some heat loss is predicted, so it is more precise to define the reactors as semi-adiabatic), the calculated conversion degree and temperature profiles inside the monolithic channel were used with the data obtained for the kinetics of the methane combustion. The corresponding averaged thermal conductivity is 92 Wm−1K−1 (Al: 237 Wm−1K−1; for porous alumina at 20 °C: 28 Wm−1K−1; air: 0.026 Wm−1K−1 [76].
Despite the fact that the calculations are in a way approximative (several additional parameters should be implemented into the model), the results show that for treatment of 3500 Nm3/h methane containing air (CH4: 0.2 vol.%, H2O: 1.2 Vol.%), the needed catalyst amount for achieving 99% is 0.39 m3 (D = 1.0 m, L = 0.5 m).

3. Materials and Methods

3.1. Catalyst Synthesis

The Pd-based catalysts, modified by metal oxide, have been prepared by sequential impregnation of Al2O3 obtained on aluminium by the electrochemical anodization process.
Aluminum foil (thickness of 0.1 mm and 99% purity) was used to obtain the anodic alumina support (AAS). First, the aluminum was cut into 6 × 120 mm plates, which are bent into a tube with a diameter of 3 mm. Pretreatment includes degreasing in acetone, etching in 4% NaOH, washing with distillate water, and drying with warm air. Aluminum tubes are anodized at a constant voltage of 40 V in a 0.3 M solution of oxalic acid for three hours at a temperature of 15 °C. The widening of pores was achieved in the same electrolyte at 40 °C for 30 min. The samples were washed with distilled water and dried for 2 h at 100 °C.
The anodized alumina was first impregnated in aqueous solutions of Co(NO3)2·6H2O (Sigma-Aldrich Chemie GmbH, Taufkirchen, Germany, 99%) for 30 min and dried at 100 °C for 1 h. Then the samples were calcined for 2 h at 500 °C in an air atmosphere to undergo thermal decomposition of cobalt salt and transformation to CoxOy. The palladium component was introduced by impregnation in an aqueous solution of Pd(NO3)22H2O (99.8%, Thermo Scientific Chemicals, Waltham, MA, USA) and then calcined additionally for 2 h at 500 °C. The sample is denoted by Pd+Co/AAS. For the characterization by different methods, the layer of the catalyst was scraped out of the anodized foil.

3.2. Catalyst Characterization

The specific surface area of the supported catalyst Pd+Co/AAS has been determined by low-temperature adsorption of nitrogen at 77 K according to the Brunauer–Emmett–Teller (BET) method [77] using Nova 1200e (Quantachrome, Boynton Beach, FL, USA) apparatus. The sample was preliminary degassed for 3 h at 300 °C in vacuum. The total pore volume was measured at a relative pressure of 0.99. The desorption branches of isotherms were used in the Barrett, Joyner, and Halenda (BJH) [78] approach to determine the pore size distributions.
Powder X-ray diffraction (XRD) was used to study the phase formation, surface morphology, and catalyst evolution. Using a LynxEye detector and Cu Kα radiation, powder X-ray diffraction patterns were obtained at a constant step of 0.02° 2θ on a Bruker D8 Advance diffractometer within the 2θ range, which varied from 10 to 80°. X’Pert HighScore software (PANalytical) and the PDF-4+ 2020 database from the International Centre for Diffraction Data (ICDD) were used to identify the phase.
X-ray photoelectron spectroscopy (XPS) measurements were performed in the UHV chamber of an ESCALAB MkII electron spectrometer (VG Scientific, Waltham, MA, USA), utilizing a non-monochromated Al Kα X-ray source with an excitation energy of 1486.6 eV, operating at a power of 160 W (8 kV, 20 mA). The hemispherical analyzer was set to a pass energy of 20 eV. Spectral calibration was performed using the C 1s line of adventitious carbon, centered at a binding energy (BE) of 285.0 eV. Data analysis was carried out using SpecsLab2 and CasaXPS software (version 2.3.25PR1)). The measured spectra were processed by subtracting X-ray satellites and the Shirley-type background, with peak positions determined and areas calculated using a curve-fitting procedure similar to that described by Rosmini et al. [79].
The phase composition was studied by transmission electron microscopy (TEM) using a JEOL JEM 2100 microscope (JEOL Ltd., Tokyo, Japan) at an accelerating voltage of 200 kV. The samples were prepared by dispersing them in ethanol and sonicating for 3 min. Drops of the prepared suspensions were dripped on standard holey carbon/Cu grids.
The electronic paramagnetic resonance (EPR) spectra were recorded as a first derivative of the absorption signal of a JEOL JES-FA 100 EPR spectrometer at room temperature. The spectrometer operating in X–band (9.5 GHz) was equipped with a standard TE011 cylindrical resonator. The samples were placed in special quartz tubes with i. d. 3.0 mm and were fixed in the cavity center. The spectra are recorded at microwave power of 2.0 mW and at a modulation amplitude of 0.2 mT.
Scanning electron microscopy (SEM) was used to analyze the sample surface morphology in secondary electron image (SEI) regimes using a JEOL JSM 6390 electron microscope (JEOL Ltd., Tokyo, Japan) equipped with an ultrahigh resolution scanning system (ASID-3D). 20 kV at I~65 µA was the accelerating voltage. It was approximately 10−4 Pa of pressure. The energy dispersive X-ray spectroscopy (EDX) was used to obtain the elemental composition of the surface, and the data were obtained from a layer with an area of 1400 μm2 and a depth of about 1 μm. The elemental composition in the presented results was recalculated for 100% with respect to the elements oxygen, aluminum, cobalt, and palladium.
In order to find out which mechanism is more probable, an experiment on so-called “depletive” oxidation was performed [33]. It consists of measuring the formation of oxidation products (CO and CO2) when the supply of oxygen to the gas mixture is stopped, after achievement of stationary conditions at temperature for conversion of 33%. The purpose of these experiments is to find out whether the oxygen from the catalyst participates in the oxidation process.
Infrared (IR) spectra were collected on a Nicolet 6700 Fourier transform infrared (FTIR) spectrophotometer with a spectral resolution of 4 cm−1, using a KBr pellet technique. The IR spectra are shown after baseline correction.

3.3. Catalytic Activity Tests

The catalytic activity measurements were carried out in a continuous-flow laboratory reactor. The gaseous hourly space velocity (GHSV) was fixed at 40,000 h–1. For compensation of the adiabatic effect of the reaction, the catalyst bed temperature was kept constant (the deviations did not exceed +/–1 °C). The pressure drop of the catalytic bed was measured to be less than 2 kPa. The axial dispersion effect was neglected as the ratio between the length of the catalytic channel and its diameter exceeded 40. For the collection of experimental data for fitting the reaction parameters, the inlet concentrations of reactant were varied as follows: methane feed concentrations were set at levels of 0.0063, 0.0114, and 0.0240 vol.%, oxygen at levels of 1.9, 8.0, and 20.9 vol.%, and water vapor at levels of 0, 1.0, and 2.0 vol.%. All feed gas mixtures were balanced to 100 vol.% by nitrogen (4.0). The inlet concentrations of C1–C6 alkanes and toluene were fixed to 0.0114 vol.%, the oxygen being 20.9 vol.%. Preliminary tests were conducted to determine the repeatability and confidence intervals for the measured conversion degrees. These tests involved repeating the tests under settings that were comparable, but not exact, to the individual experimental runs that were included in the study. Based on the average of six measurements at each experimental point, the standard deviation (+/−1.5%) was computed. The presented results are based on the average conversion degrees from two parallel measurements.
The converted gas mixture analysis was made using the gas analyzers THC-FID (analyzer for total organic content in gas phase, Thermo FID-TG, SK Elektronik GmbH, Leverkusen, Germany) and for CO/CO2/O2 determination (MultiGas FTIR Gas Analyzer 2030G, MKS Instruments Inc., Andover, MA, USA).

3.4. Computational Details

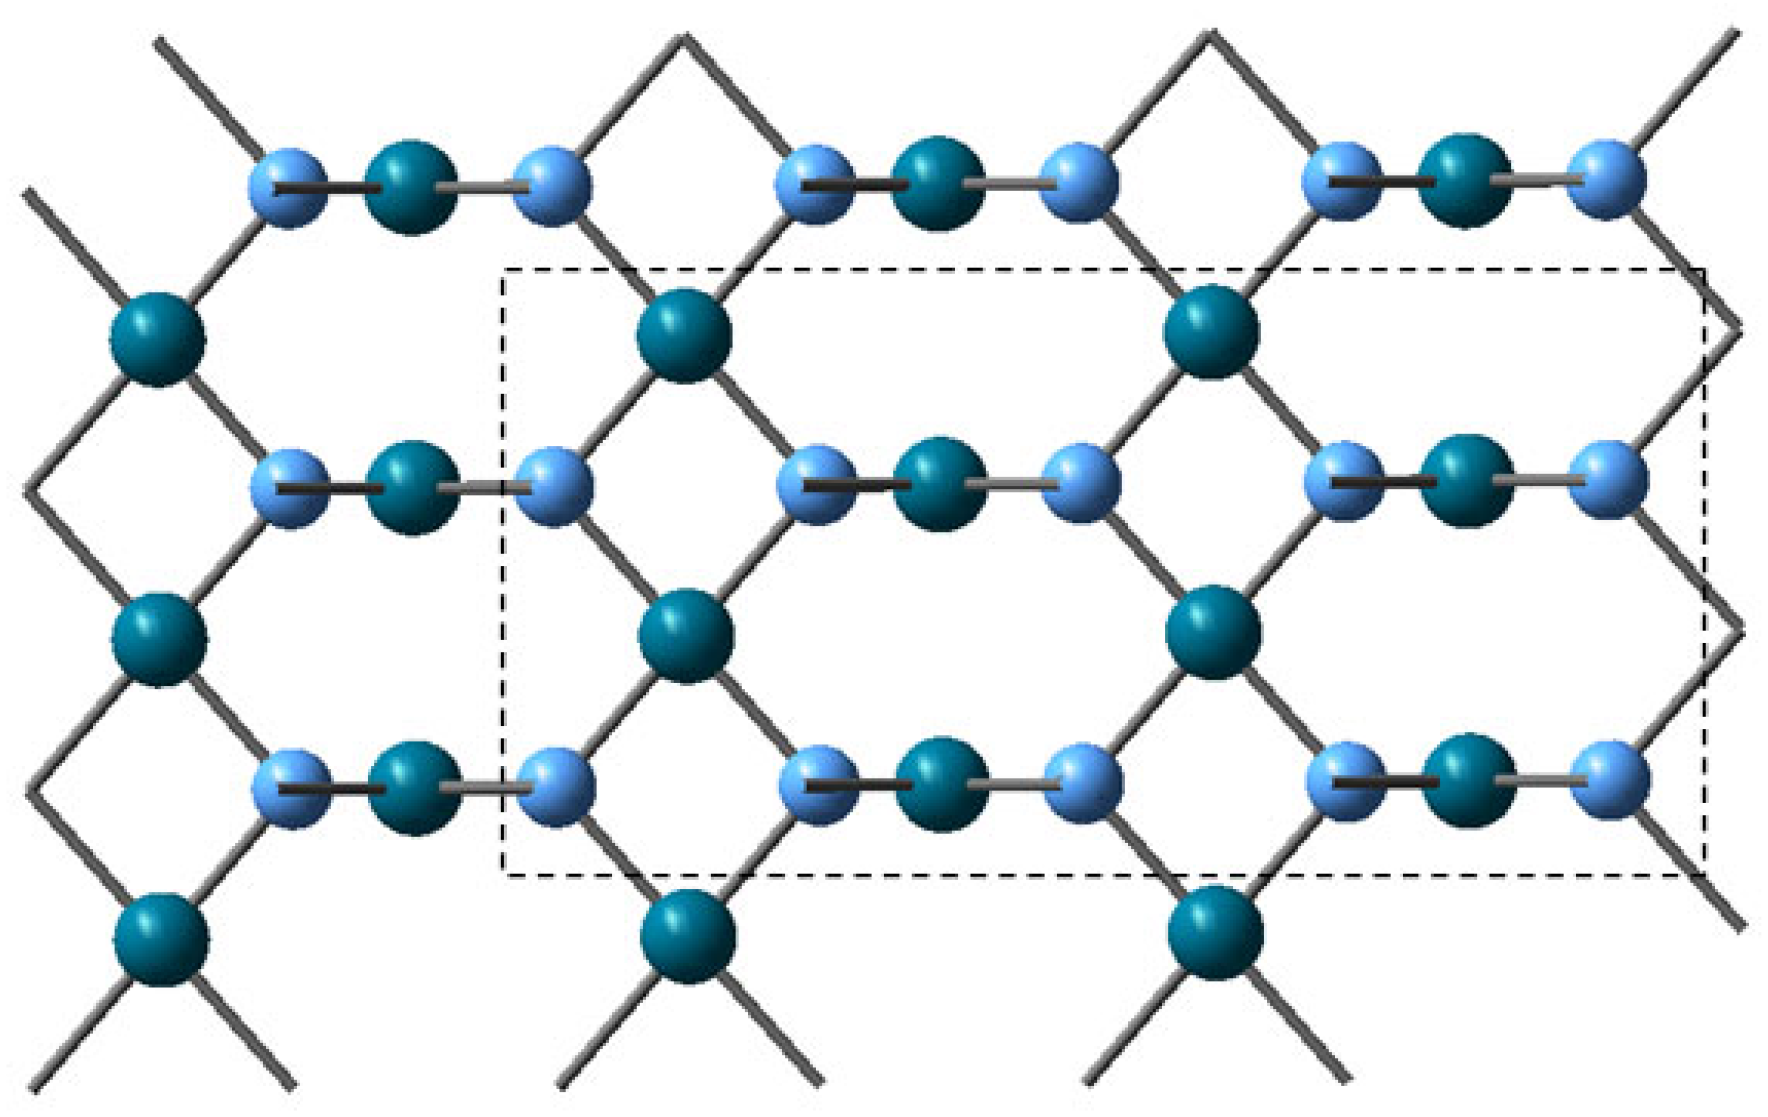
The reaction mechanism was examined using clusters, selected from the 2D monolayer optimization, Pd16O16 and CoPd15O16, resp. Co2Pd14O16 clusters, in which Co(II) substituted Pd(II) cations in A and B sites of the PdO structure. The ONIOM method was applied to the clusters, as it was implemented in Gaussian 16 [80,81], so that the active layer, corresponding to a Pd8O8 array, was calculated by density functional theory (DFT) using the B3LYP density functional [82], while the surrounding array was described by molecular mechanics, Figure 17. The 6-311+G(d) basis data set was used for Co and O, and the LanL2DZ basis data set and pseudo-potential, which account for relativistic effects, was used for Pd. The minima on the potential energy surfaces were identified by the absence of negative eigenvalues in the diagonalized Hessian matrix; transition states were characterized by the presence of a single imaginary frequency. The synchronous transit-guided quasi-Newton (STQN) method was used for the transition state optimizations [83]. Dispersion effects were taken into account by using the empirical formula of Grimme [84]. The complete oxidation of methane includes several elementary steps, some of which are fast enough to be traced by molecular dynamics. The classical trajectory simulations were performed with BOMD (Born–Oppenheimer molecular dynamics) on clusters, Pd16O16, and Co2Pd14O16 with methane and oxygen [85].

3.5. Reactor Modeling

A two-dimensional heterogeneous model of the monolithic channel was used for simulation of the methane combustion in the monolithic reactor. A detailed description of the principles and the applied calculation procedures is given in the literature [86,87,88,89,90,91,92].
Gas phase:
u ( r ) C g z = D b i n 2 C g r 2 + 1 r C g r
u ( r ) T g z = α T 2 T g r 2 + 1 r T g r
u ( r ) = 2 u a v e r a g e 1 r R 2
Center line of the circular channel:
u c e n t r e C g z = D b i n 2 2 C g r 2
u c e n t r e T g z = α T 2 2 T g r 2
Initial conditions:
z = 0 (inlet): Cg = Cs = Cinlet; Tg = Ts = Tinlet
Boundary conditions:
r   = 0   ( centreline ) :   C g r = 0 ;   T g r = 0
r   =   R   ( wall ) :   D b i n C g r = D e f f 2 C s l 2 = η r a C s , T
u s C g z = η R   ( C g ,   T )
φ = L . k v o l u m e t r i c D e f f
η = tanh ( φ ) φ
The conversion degree at the outlet of the monolithic channel was calculated by using the method of mixing-cup average concentration. The heat transfer within the monolithic catalyst is accomplished by conduction through the channels in the radial direction and by fluid convection in the axial direction. The relationship between the effective radial dispersion coefficient E r and the thermal conductivity λ r is the following:
E r = λ r ρ C p
The wall boundary condition has the following expression:
r   =   R   ( wall ) :   λ r T r = h r T R T W
where h r is the heat transfer coefficient, which value can be found by an empirical way.
u a v T z = E r 2 T r 2 + 1 r T r Δ H R R ρ C p
u a v T z = E r 2 2 T r 2 Δ H R R ρ C p

4. Conclusions

The Pd-Co-based catalyst samples, supported on anodized aluminum, possess very high activity in combustion reactions of C1–C6 alkanes and toluene (T50 for methane being 325 °C, for toluene T50 = 207 °C, GHSV = 40,000 h−1).
Regarding the characteristics of the catalytic support, an aluminium oxide has been obtained on aluminium by the electrochemical anodization process. The Co2+ is the predominant species in the fresh Pd+Co/AAS sample, and it is the only species after aging, probably as a result of the formation of spinel-like surface phase.
Finely dispersed palladium particles are formed on the surface, and both Pd2+ and Pd4+ ions are present on the surface of the fresh, used, and aged catalysts. It should be pointed out that Pd3+ presence is identified by EPR study in the case of comparative sample of Pd/AAS, i.e., in the absence of CoOx. On the other hand, the mathematical calculations show that the changes in spin density indicate that Co(II) becomes Co(III), and the induced magnetic moment on Pd indicates the presence of Pd(III), and the two cations are anti-ferromagnetically coupled.
The abatement of methane (being of major concern) was investigated in the present study in detail. It was proposed that the complete oxidation of methane proceeds by dissociative adsorption on PdO and formation of hydroxyl and methyl groups, the former being highly reactive, and it undergoes further reaction to oxygen-containing intermediates, HCHO being one of them. The oxygen molecule is activated upon adsorption on Pd atoms, and the presence of surface hydroxyl groups on PdO favors oxygen adsorption because Pd cations bonded to a surface hydroxyl acquire a more positive partial charge. The presence of Co2+ cations favors greatly oxygen adsorption. Dissociative adsorption favors neighboring Co2+ cations, leading to the formation of bridging peroxides. Further, the oxygen molecule dissociates on the nearest Pd2+ cations. “Depletive” oxidation tests confirm that part of reactive oxygen is originating or is being supplied by the cobalt oxide, and the presence of Pd contributes to the increased reducibility of CoOx. Therefore, the role of cobalt can thus be regarded as an oxygen supplier to reduced Pd sites during oxidation.
The parameters, calculated based on the power law kinetic model, suppose an inhibition effect of water vapor (the reaction order with respect to the water has a value of −0.16). The reaction order with respect to methane is calculated to be 0.93, and taking into account the value for the oxygen reaction order (0.16), one could conclude that the catalytic surfaces are predominantly covered by the oxygen species and the methane is suffering from a lack of vacant active sites for its dissociative adsorption.
According to the results from the experimental data, instrumental methods, and the performed kinetics and DFT model calculations, it can be concluded that the reaction pathway over the Pd+Co/AAS catalyst proceeds most probably through Mars–van Krevelen mechanism upon adsorption of water molecules on both oxidized and reduced sites and slow desorption of reaction products.
In order to simulate adiabatic monolithic elements for pilot-scale and full-scale reactors for the reduction of methane emissions in conditions that are similar to actual practice, the methane combustion kinetics data that was acquired was employed.

Author Contributions

Conceptualization, A.N., S.T. and B.T.; methodology, A.N., S.T. and B.T.; computational modeling, E.U.; XPS investigation, H.K.; EPR investigation Y.K.; TEM investigation D.K.; data curation, R.V.; writing—original draft preparation, A.N., S.T. and B.T.; writing—review and editing, A.N., S.T. and B.T.; visualization, R.V. All authors have read and agreed to the published version of the manuscript.

Funding

This research received no external funding.

Data Availability Statement

The data presented in this study are available on request from the corresponding author.

Acknowledgments

ELU is grateful for the provided access to the infrastructure, purchased under the National Roadmap for RI, financially coordinated by the MES of the Republic of Bulgaria (Grant No. D01-325/01.12.2023). Research equipment of the project No. BG16RFPR002-1.014-0006 “National Center of Excellence Mechatronics and Clean Technologies “was used for experimental work financially supported by the European Regional Development Fund under “Research Innovation and Digitization for Smart Transformation” program 2021–2027. Research equipment of distributed research infrastructure INFRAMAT (part of Bulgarian National roadmap for research infrastructures) supported by Bulgarian Ministry of Education and Science was used in this investigation.

Conflicts of Interest

The authors declare no conflict of interest.

Nomenclature

Cozoneconcentration of methane at working conditions, mol/m3;
Dbinbinary diffusion coefficient, m2/s;
Deffeffective diffusion coefficient, m2/s;
Drradial diffusion coefficient, m2/s;
E r effective radial dispersion coefficient for heat, m2/s;
kssurface reaction rate constant, m/s
kvvolumentric reaction rate constant (based on the volume of the catalytic layer), s−1
lcoordinate for depth of the catalytic layer, m;
Lthickness of the catalytic layer, m;
ΔQrheat of reaction, J/mol.
ussuperficial gas velocity, m/s;
uaveragegas velocity based on total channel diameter, m/s;
u(r)gas velocity at radial coordinate r;
u(o)free streamline gas velosity, m/s;
ReReynolds number, ρud/µ;
Rchannel radius, m;
rareaction rate of ozone decomposition, mol·m−3·s−1.
rradial coordinate for channel, m;
xaxial dimensionless coordinate alongside the channel length;
zaxial coordinate, m;
Zchannel length, m;
αTthermal conductivity of gas phase (air) W/(m·K);
λ r effective radial thermal conductivity, W/(m·K);
µdynamic viscosity of gas, Pa·s;
ηeffectiveness factor;
φTielle modulus;
ρgas density, kg/m3;
χconversion.

References

  1. United States Environmental Protection Agency. Technical Overview of Volatile Organic Compounds. (n.d.). Available online: https://www.epa.gov/indoor-air-quality-iaq/technical-overview-volatile-organic-compounds (accessed on 3 November 2017).
  2. Lamonier, J.-F. Catalytic Removal of Volatile Organic Compounds. Catalysts 2016, 6, 7. [Google Scholar] [CrossRef]
  3. Ojala, S.; Pitkäaho, S.; Laitinen, T.; Koivikko, N.N.; Brahmi, R.; Gaálová, J.; Matejova, L.; Kucherov, A.; Päivärinta, S.; Hirschmann, C.; et al. Catalysis in VOC Abatement. Top. Catal. 2011, 54, 1224–1256. [Google Scholar] [CrossRef]
  4. Ribeiro, B.M.B.; Pinto, J.F.; Suppino, R.S.; Marçola, L.; Landers, R.; Tomaz, E. Catalytic oxidation at pilot-scale: Efficient degradation of volatile organic compounds in gas phase. J. Hazard. Mater. 2018, 365, 581–589. [Google Scholar] [CrossRef] [PubMed]
  5. Kamal, M.S.; Razzak, S.A.; Hossain, M.M. Catalytic oxidation of volatile organic compounds (VOCs)—A review. Atmos. Environ. 2016, 140, 117–134. [Google Scholar] [CrossRef]
  6. Tomatis, M.; Xu, H.-H.; He, J.; Zhang, X.-D. Recent development of catalysts for removal of volatile organic compounds in flue gas by combustion: A review. J. Chem. 2016, 2016, 832482. [Google Scholar] [CrossRef]
  7. Revisions to the Greenhouse Gas Reporting Rule and Proposed Confidentiality Determinations for New or Substantially Revised Data Elements; Federal Register/Vol. 78, No. 63/Tuesday, 2 April 2013/Proposed Rules, 40 CFR Part 98; Environmental Protection Agency: Washington, DC, USA, 2013.
  8. Raj, A. Methane emission control, a review of mobile and stationary source emissions abatement technologies for natural gas engines. Johns. Matthey Technol. Rev. 2016, 60, 228–235. [Google Scholar] [CrossRef]
  9. Emission Standards: Europe: Cars and Light Trucks. (n.d.). Available online: https://www.dieselnet.com/standards/eu/ld.php (accessed on 12 January 2017).
  10. Yan, J. Handbook of Clean Energy Systems Clean Energy Conversion Technologies, 1st ed.; John Wiley & Sons: Hoboken, NJ, USA, 2015; Volume 2. [Google Scholar]
  11. Li, J.; Zhang, J.; Lei, Z.; Chen, B. Pd–Co coating onto cordierite monoliths as structured catalysts for methane catalytic combustion. Energy Fuels 2011, 26, 443–450. [Google Scholar] [CrossRef]
  12. Barbato, P.S.; Di Sarli, V.; Landi, G.; Di Benedetto, A. High pressure methane catalytic combustion over novel partially coated LaMnO3-based monoliths. Chem. Eng. J. 2015, 259, 381–390. [Google Scholar] [CrossRef]
  13. Landi, G.; Di Benedetto, A.; Barbato, P.S.; Russo, G.; Di Sarli, V. Transient behavior of structured LaMnO3 catalyst during methane combustion at high pressure. Chem. Eng. Sci. 2014, 116, 350–358. [Google Scholar] [CrossRef]
  14. Di Sarli, V.; Barbato, P.S.; Di Benedetto, A.; Landi, G. Start-up behavior of a LaMnO3 partially coated monolithic combustor at high pressure. Catal. Today 2015, 242, 200–210. [Google Scholar] [CrossRef]
  15. Ercolino, G.; Karimi, S.; Stelmachowski, P.; Specchia, S. Catalytic combustion of residual methane on alumina monoliths and open cell foams coated with Pd/Co3O4. Chem. Eng. J. 2017, 326, 339–349. [Google Scholar] [CrossRef]
  16. Ercolino, G.; Stelmachowski, P.; Specchia, S. Catalytic Performance of Pd/Co3O4 on SiC and ZrO2 Open Cell Foams for the Process Intensification of Methane Combustion in Lean Conditions. Ind. Eng. Chem. Res. 2017, 56, 6625–6636. [Google Scholar] [CrossRef]
  17. Zhao, S.; Zhang, J.; Weng, D.; Wu, X. A method to form well-adhered γ-Al2O3 layers on FeCrAl metallic supports. Surf. Coat. Technol. 2003, 167, 97–105. [Google Scholar] [CrossRef]
  18. Kucharczyk, B.; Tylus, W. Metallic monolith supported LaMnO3 perovskite-based catalysts in methane combustion. Catal. Lett. 2007, 115, 3–4. [Google Scholar] [CrossRef]
  19. Fedotiev, N.P.; Grilijes, S.Y. (Eds.) Electropulido y Anodizacion de Metals; Gustavo Gili Editorial: Barcelona, Spain, 1972; p. 188. [Google Scholar]
  20. González Fernández, J.A. (Ed.) Teoría y Práctica de la Lucha Contra la Corrosion; CSIC Press: Madrid, Spain, 1984; p. 461. [Google Scholar]
  21. Hönicke, D. Comparative investigations of the catalytic properties of an anodic Al2O3-coated catalyst and of α- and γ-Al2O3 bulk catalysts. Appl. Catal. 1983, 5, 199–206. [Google Scholar] [CrossRef]
  22. Nourbakhsh, N.; Smith, B.; Webster, I.; Wei, J.; Tsotsis, T. Metal deposition in porous anodic alumina films under hydrotreating conditions. J. Catal. 1991, 127, 178–189. [Google Scholar] [CrossRef]
  23. Kozhukhova, A.E.; du Preez, S.P.; Bessarabov, D. Preparation of highly active and thermally conductive platinum nanoparticle/Ce–Zr–Y mixed oxide/AAO washcoat catalyst for catalytic hydrogen combustion technologies. ACS Appl. Nano Mater. 2022, 5, 8161–8174. [Google Scholar] [CrossRef]
  24. Troncoso, F.D.; Tonetto, G.M. Highly stable platinum monolith catalyst for the hydrogenation of vegetable oil. Chem. Eng. Proc. 2022, 170, 108669. [Google Scholar] [CrossRef]
  25. Tonetto, G.; Troncoso, F.; Costa, T.H.M. Novel monolithic catalysts for the hydrotreating of oleic acid. Lat. Am. Appl. Res./Chem. Eng. 2024, 54, 369–374. [Google Scholar] [CrossRef]
  26. Liu, W.; Guo, D.; Xu, X. Research progress of palladium catalysts for methane combustion. China Pet. Process. Petrochem. Technol. 2012, 14, 1–9. Available online: http://www.chinarefining.com/EN/Y2012/V14/I3/1 (accessed on 30 September 2012).
  27. Stefanov, P.; Todorova, S.; Naydenov, A.; Tzaneva, B.; Kolev, H.; Atanasova, G.; Stoyanova, D.; Karakirova, Y.; Aleksieva, K. On the development of active and stable Pd–Co/γ-Al2O3 catalyst for complete oxidation of methane. J. Chem. Eng. 2015, 266, 329–338. [Google Scholar] [CrossRef]
  28. Gregg, S.J.; Sing, K.S.W. The physical adsorption of gasses by mesoporous solids: The type IV isotherm. In Adsorption, Surface Area and Porosity, 2nd ed.; Academia Press: London, UK, 1982; pp. 111–190. [Google Scholar]
  29. Leofanti, G.; Padovan, M.; Tozzola, G.; Venturelli, B. Surface area and pore texture of catalysts. Catal. Today 1998, 41, 207–219. [Google Scholar] [CrossRef]
  30. Georgieva, R.; Gancheva, M.; Ivanov, G.; Shipochka, M.; Markov, P.; Nihtianova, D.; Iordanova, R.; Naydenov, A. Synthesis, characterization and activity of Pd/CaWO4 catalyst in complete oxidation of C1–C6 alkanes and toluene. React. Kinet. Catal. Lett. 2021, 132, 811–827. [Google Scholar] [CrossRef]
  31. Zboray, M.; Bell, A.T.; Iglesia, E. Role of C−H bond strength in the rate and selectivity of oxidative dehydrogenation of alkanes. J. Phys. Chem. C 2009, 113, 12380–12386. [Google Scholar] [CrossRef]
  32. Deshlahra, P.; Iglesia, E. Reactivity and selectivity descriptors for the activation of C–H bonds in hydrocarbons and oxygenates on metal oxides. J. Phys. Chem. C 2016, 120, 16741–16760. [Google Scholar] [CrossRef]
  33. Brooks, C. The kinetics of hydrogen and carbon monoxide oxidation over a manganese oxide. J. Catal. 1967, 8, 272–282. [Google Scholar] [CrossRef]
  34. Castellazzi, P.; Groppi, G.; Forzatti, P.; Finocchio, E.; Busca, G. Activation process of Pd/Al2O3 catalysts for CH4 combustion by reduction/oxidation cycles in CH4-containing atmosphere. J. Catal. 2010, 275, 218–227. [Google Scholar] [CrossRef]
  35. Wang, F.; Zhang, L.; Xu, L.; Deng, Z.; Shi, W. Low temperature CO oxidation and CH4 combustion over Co3O4 nanosheets. Fuel 2017, 203, 419–429. [Google Scholar] [CrossRef]
  36. Poinern, G.E.J.; Ali, N.; Fawcett, D. Progress in nano-engineered anodic aluminum oxide membrane development. Materials 2011, 4, 487–526. [Google Scholar] [CrossRef]
  37. Kang, L.; Zhang, M.; Liu, Z.-H.; Ooi, K. IR spectra of manganese oxides with either layered or tunnel structures. Spectrochim. Acta Part A Mol. Biomol. Spectrosc. 2007, 67, 864–869. [Google Scholar] [CrossRef]
  38. Chernyakova, K.V.; Vrublevsky, I.A.; Ivanovskaya, M.I.; Kotsikau, D.A. Impurity-defect structure of anodic aluminum oxide produced by two-sided anodizing in tartaric acid. J. Appl. Spectrosc. 2012, 79, 76–82. [Google Scholar] [CrossRef]
  39. Vrublevsky, I.; Chernyakova, K.; Bund, A.; Ispas, A.; Schmidt, U. Effect of anodizing voltage on the sorption of water molecules on porous alumina. Appl. Surf. Sci. 2012, 258, 5394–5398. [Google Scholar] [CrossRef]
  40. Lefez, B.; Nkeng, P.; Lopitaux, J.; Poillerat, G. Characterization of cobaltite spinels by reflectance spectroscopy. Mater. Res. Bull. 1996, 31, 1263–1267. [Google Scholar] [CrossRef]
  41. Kurajica, S.; Popović, J.; Tkalčec, E.; Gržeta, B.; Mandić, V. The effect of annealing temperature on the structure and optical properties of sol–gel derived nanocrystalline cobalt aluminate spinel. Mater. Chem. Phys. 2012, 135, 587–593. [Google Scholar] [CrossRef]
  42. Wang, C.; Liu, S.; Liu, L.; Bai, X. Synthesis of cobalt–aluminate spinels via glycine chelated precursors. Mater. Chem. Phys. 2006, 96, 361–370. [Google Scholar] [CrossRef]
  43. Saniger, J.M. Al-O Infrared Vibrational Frequencies of g-alumina. Mater. Lett. 1995, 22, 109–113. [Google Scholar] [CrossRef]
  44. Chapskaya, A.Y.; Radishevskaya, N.I.; Kasatskii, N.G.; Lepakova, O.K.; Naiborodenko, Y.S.; Vereshchagin, V.V. The effect of composition and synthesis conditions on the structure of cobalt-bearing pigments of the spinel type. J. Glass Ceram. 2005, 62, 388–390. [Google Scholar] [CrossRef]
  45. Arnoldy, P.; Moulijn, J. Temperature-programmed reduction of CoO/AI2O3 catalysts. J. Catal. 1985, 93, 38–54. [Google Scholar] [CrossRef]
  46. Kliche, G. Far-infrared reflection spectra of Pdo, PdS, PdSe and PtS. Infrared Phys. 1985, 25, 381–383. [Google Scholar] [CrossRef]
  47. O’Shea, V.d.l.P.; Álvarez-Galván, M.; Fierro, J.; Arias, P. Influence of feed composition on the activity of Mn and PdMn/Al2O3 catalysts for combustion of formaldehyde/methanol. Appl. Catal. B Environ. 2005, 57, 191–199. [Google Scholar] [CrossRef]
  48. O’shea, V.d.l.P.; Alvarez-Galvan, M.; Requies, J.; Barrio, V.; Arias, P.; Cambra, J.; Güemez, M.; Fierro, J. Synergistic effect of Pd in methane combustion PdMnOx/Al2O3 catalysts. Catal. Commun. 2007, 8, 1287–1292. [Google Scholar] [CrossRef]
  49. Fan, X.; Wang, F.; Zhu, T.; He, H. Effects of Ce on catalytic combustion of methane over Pd-Pt/Al2O3 catalyst. J. Environ. Sci. 2012, 24, 507–511. [Google Scholar] [CrossRef] [PubMed]
  50. Kibis, L.S.; Stadnichenko, A.I.; Koscheev, S.V.; Zaikovskii, V.I.; Boronin, A.I. Highly oxidized palladium nanoparticles comprising Pd4+ species: Spectroscopic and structural aspects, thermal stability, and reactivity. J. Phys. Chem. C 2012, 116, 19342–19348. [Google Scholar] [CrossRef]
  51. Venezia, A.; Di Carlo, G.; Liotta, L.; Pantaleo, G.; Kantcheva, M. Effect of Ti(IV) loading on CH4 oxidation activity and SO2 tolerance of Pd catalysts supported on silica SBA-15 and HMS. Appl. Catal. B Environ. 2011, 106, 529–539. [Google Scholar] [CrossRef]
  52. Otto, K.; Haack, L.; Devries, J. Identification of two types of oxidized palladium on γ-alumina by X-ray photoelectron spectroscopy. Appl. Catal. B Environ. 1992, 1, 1–12. [Google Scholar] [CrossRef]
  53. Barr, T.L. An ESCA study of the termination of the passivation of elemental metals. J. Phys. Chem. 1978, 82, 1801–1810. [Google Scholar] [CrossRef]
  54. Bi, Y.; Lu, G. Catalytic CO oxidation over palladium supported NaZSM-5 catalysts. Appl. Catal. B Environ. 2003, 41, 279–286. [Google Scholar] [CrossRef]
  55. Hu, T.; Wang, Y.; Zhang, L.; Tang, T.; Xiao, H.; Chen, W.; Zhao, M.; Jia, J.; Zhu, H. Facile synthesis of PdO-doped Co3O4 nanoparticles as an efficient bifunctional oxygen electrocatalyst. Appl. Catal. B Environ. 2018, 243, 175–182. [Google Scholar] [CrossRef]
  56. He, H.; Alberti, K.; Barr, T.L.; Klinowski, J. ESCA studies of aluminophosphate molecular sieves. J. Phys. Chem. 1993, 97, 13703–13707. [Google Scholar] [CrossRef]
  57. Garbowski, E.; Guenin, M.; Marion, M.-C.; Primet, M. Catalytic properties and surface states of cobalt-containing oxidation catalysts. Appl. Catal. 1990, 64, 209–224. [Google Scholar] [CrossRef]
  58. Szegedi, A.; Popova, M.; Dimitrova, A.; Cherkezova-Zheleva, Z.; Mitov, I. Effect of the pretreatment conditions on the physico-chemical and catalytic properties of cobalt- and iron-containing Ti-MCM-41 materials. Microporous Mesoporous Mater. 2010, 136, 106–114. [Google Scholar] [CrossRef]
  59. Green, U.; Aizenshtat, Z.; Ruthstein, S.; Cohen, H. Reducing the spin–spin interaction of stable carbon radicals. Phys. Chem. Chem. Phys. 2013, 15, 6182–6184. [Google Scholar] [CrossRef] [PubMed]
  60. Motoji, I. New Application of Electron Paramagnetic Resonance; World Scientific Publisher: Singapore, 1993; p. 143. [Google Scholar]
  61. Filimonov, I.N.; Ikonnikov, I.A.; Loginov, A.Y. EPR investigation of paramagnetic species on palladium-promoted yttria and lanthana. J. Chem. Soc. Faraday Trans. 1994, 90, 219–226. [Google Scholar] [CrossRef]
  62. Naccache, C.; Primet, M.; Mathieu, M.V. Study of hydrogen and carbon monoxide interactions with palladium-Y zeolite by ESR and IR spectroscopy in molecular sieves. In Advances in Chemistry; Meier, W., Ed.; American Chemical Society: Washington, DC, USA, 1973. [Google Scholar]
  63. Michalik, J.; Narayna, M.; Kevan, L. Studies of the interaction of palladium(3+) and palladium(1+) with organic adsorbates, water, and molecular oxygen in palladium-Ca-X zeolite by electron spin resonance and electron spin-echo modulation spectroscopy. J. Phys. Chem. 1985, 89, 4553–4560. [Google Scholar] [CrossRef]
  64. Cottrell, T.L. The Strengths of Chemical Bonds, 2nd ed.; Butterworth: London, UK, 1958. [Google Scholar]
  65. Antony, A.; Asthagiri, A.; Weaver, J.F. Pathways and kinetics of methane and ethane C–H bond cleavage on PdO(101). J. Chem. Phys. 2013, 139, 104702. [Google Scholar] [CrossRef]
  66. Chin, Y.-H.; Buda, C.; Neurock, M.; Iglesia, E. Consequences of Metal–Oxide Interconversion for C–H Bond Activation during CH4Reactions on Pd Catalysts. J. Am. Chem. Soc. 2013, 135, 15425–15442. [Google Scholar] [CrossRef]
  67. Mayernick, A.D.; Janik, M.J. Methane oxidation on Pd–Ceria: A DFT study of the mechanism over PdxCe1−xO2, Pd, and PdO. J. Catal. 2011, 278, 16–25. [Google Scholar] [CrossRef]
  68. Duprat, F. Light-off curve of catalytic reaction and kinetics. Chem. Eng. Sci. 2002, 57, 901–911. [Google Scholar] [CrossRef]
  69. Todorova, S.; Naydenov, A.; Kolev, H.; Holgado, J.; Ivanov, G.; Kadinov, G.; Caballero, A. Mechanism of complete n-hexane oxidation on silica supported cobalt and manganese catalysts. Appl. Catal. A Gen. 2012, 413, 43–51. [Google Scholar] [CrossRef]
  70. Vannice, M.A. Kinetics of Catalytic Reactions; Springer Science-Business Media, Inc.: New York, NY, USA, 2005. [Google Scholar]
  71. Mars, P.; van Krevelen, D. Oxidations carried out by means of vanadium oxide catalysts. Chem. Eng. Sci. 1954, 3, 41–59. [Google Scholar] [CrossRef]
  72. Ciuparu, D.; Perkins, E.; Pfefferle, L. In situ DR-FTIR investigation of surface hydroxyls on γ-Al2O3 supported PdO catalysts during methane combustion. Appl. Catal. A Gen. 2004, 263, 145–153. [Google Scholar] [CrossRef]
  73. Ciuparu, D.; Pfefferle, L. Contributions of lattice oxygen to the overall oxygen balance during methane combustion over PdO-based catalysts. Catal. Today 2002, 77, 167–179. [Google Scholar] [CrossRef]
  74. Schwartz, W.R.; Pfefferle, L.D. Combustion of methane over palladium-based catalysts: Support interactions. J. Phys. Chem. C 2012, 116, 8571–8578. [Google Scholar] [CrossRef]
  75. Łojewska, J.; Kołodziej, A.; Żak, J.; Stoch, J. Pd/Pt promoted Co3O4 catalysts for VOCs combustion: Preparation of active catalyst on metallic carrier. Catal. Today 2005, 105, 655–661. [Google Scholar] [CrossRef]
  76. Živcová, Z.; Gregorová, E.; Pabst, W.; Smith, D.S.; Michot, A.; Poulier, C. Thermal conductivity of porous alumina ceramics prepared using starch as a pore-forming agent. J. Eur. Ceram. Soc. 2009, 29, 347–353. [Google Scholar] [CrossRef]
  77. Gómez-Serrano, V.; González-García, C.; González-Martín, M. Nitrogen adsorption isotherms on carbonaceous materials. Comparison of BET and Langmuir surface areas. Powder Technol. 2001, 116, 103–108. [Google Scholar] [CrossRef]
  78. Barrett, E.P.; Joyner, L.G.; Halenda, P.P. The determination of pore volume and area distributions in porous substances. I. Computations from nitrogen isotherms. J. Am. Chem. Soc. 1951, 73, 373–380. [Google Scholar] [CrossRef]
  79. Rosmini, C.; Urrea, M.P.; Tusini, E.; Indris, S.; Kovacheva, D.; Karashanova, D.; Kolev, H.; Zimina, A.; Grunwaldt, J.-D.; Rønning, M.; et al. Unveiling the synergistic effects of pH and Sn content for tuning the catalytic performance of Ni0/NixSny intermetallic compounds dispersed on Ce-Zr mixed oxides in the aqueous phase reforming of ethylene glycol. Appl. Catal. B Environ. 2024, 350, 123904. [Google Scholar] [CrossRef]
  80. Vreven, T.; Frisch, M.J.; Kudin, K.N.; Schlegel, H.B.; Morokuma, K. Geometry optimization with QM/MM methods II: Explicit quadratic coupling. Mol. Phys. 2006, 104, 701–714. [Google Scholar] [CrossRef]
  81. Frisch, M.J.; Trucks, G.W.; Schlegel, H.B.; Scuseria, G.E.; Robb, M.A.; Cheeseman, J.R.; Scalmani, G.; Barone, V.; Petersson, G.A.; Nakatsuji, H.; et al. Gaussian 16, Revision C.01; Gaussian, Inc.: Wallingford, CT, USA, 2016. [Google Scholar]
  82. Becke, A.D. Density-functional thermochemistry. III. The role of exact exchange. J. Chem. Phys. 1993, 98, 5648–5652. [Google Scholar] [CrossRef]
  83. Peng, C.; Ayala, P.Y.; Schlegel, H.B.; Frisch, M.J. Using redundant internal coordinates to optimize equilibrium geometries and transition states. J. Comput. Chem. 1996, 17, 49–56. [Google Scholar] [CrossRef]
  84. Grimme, S.; Antony, J.; Ehrlich, S.; Krieg, H. A consistent and accurate ab initio parametrization of density functional dispersion correction (DFT-D) for the 94 elements H-Pu. J. Chem. Phys. 2010, 132, 154104–154119. [Google Scholar] [CrossRef] [PubMed]
  85. Bolton, K.; Hase, W.L.; Peslherbe, G.H. Modern Methods for Multidimensional Dynamics Computation in Chemistry; Thompson, D.L., Ed.; World Scientific: Singapore, 1998; p. 143. [Google Scholar]
  86. Belfiore, L.A. Transport Phenomena for Chemical Reactor Design; John Wiley & Sons, Inc: Hoboken, NJ, USA, 2003. [Google Scholar]
  87. Nauman, E.B. Chemical Reactor Design, Optimization, and Scaleup; McGraw-Hill Companies: New York, NY, USA, 2008. [Google Scholar]
  88. Tomašić, V. Application of the monoliths in DeNOx catalysis. Catal. Today 2006, 119, 106–113. [Google Scholar] [CrossRef]
  89. Tomašić, V.; Gomzi, Z. Experimental and theoretical study of NO decomposition in a catalytic monolith reactor. Chem. Eng. Proc. 2004, 43, 765–774. [Google Scholar] [CrossRef]
  90. Tomašić, V.; Jović, F. State-of-the-art in the monolithic catalysts/reactors. Appl. Catal. A Gen. 2006, 311, 112–121. [Google Scholar] [CrossRef]
  91. Satterfield, C.N. Mass Transfer in Heterogeneous. Catalysis; MIT Press: Cambridge, MA, USA, 1970. [Google Scholar]
  92. Levenspiel, O. Chemical Reactor Engineering, 3rd ed.; John Wiley & Sons, Inc.: New York, NY, USA, 1999. [Google Scholar]
Figure 1. Nitrogen physisorption isotherm (A) and pore size distribution (B) of Pd+Co/AAS.
Catalysts 14 00736 g001
Figure 2. SEM micrographs of Pd+Co/AAS system after catalytic tests: (A) top view; (B) cross section.
Catalysts 14 00736 g002
Figure 3. Catalytic activity of Pd+Co/AAS system in C1–C6 alkanes and toluene combustion, single monolithic channel experiments under isothermal conditions.
Catalysts 14 00736 g003
Figure 4. Depletive oxidation of methane on Pd+Co/AAS catalyst.
Catalysts 14 00736 g004
Figure 5. XRD pattern of fresh Pd+Co/AAS catalyst.
Catalysts 14 00736 g005
Figure 6. The FTIR spectra of anodic alumina support (AAS) and Pd+Co/AAS fresh and aged Pd+Co/AAS.
Catalysts 14 00736 g006
Figure 7. X–ray photoelectron spectra of Pd3d, Co2p, and Al2p for Pd+Co/AAS fresh, used and aged.
Catalysts 14 00736 g007
Figure 8. Bright Field TEM micrograph (A), the corresponding SAED pattern (B), and HRTEM (C) of the sample Pd+Co/AAS. The size distribution histogram of the Pd+Co nanoparticles is also presented.
Catalysts 14 00736 g008
Figure 9. Bright Field TEM micrograph (A), the corresponding SAED pattern (B), and HRTEM (C) of the sample Pd/AAS. The size distribution histogram of the Pd nanoparticles is also presented.
Catalysts 14 00736 g009
Figure 10. EPR spectra of Pd+Co/AAS (A) and Pd/AAS (B) samples.
Catalysts 14 00736 g010
Figure 11. (a)—Energy diagram of the dissociative adsorption of methane on PdO(100) and on PdO(101). (b)—Energy diagram of oxygen adsorption on PdO(100) surface in presence of hydroxyl groups (red line) and on a CoPd15O16 cluster (blue line). The activation barriers are calculated for the ONIOM clusters.
Catalysts 14 00736 g011
Figure 12. Dissociative adsorption of methane on Pd8O8 and molecular dynamics simulation of the methane activation in presence of oxygen. Pd centers are dark-green, oxygen centers are blue, carbon is grey, and hydrogens are small light-grey balls.
Catalysts 14 00736 g012
Figure 13. Dissociative adsorption of methane on Co2Pd6O8 and molecular dynamics simulation of the methane activation in presence of oxygen. Pd centers are dark-green, oxygen centers are blue, cobalt is pink, carbon is grey, and hydrogens are small light-grey balls.
Catalysts 14 00736 g013
Figure 14. Oxygen dissociation in the reoxidation step of Mars–van Krevelen mechanism. The arrows denote magnetic moments and their orientation. Pd centers are dark-green, oxygen centers are blue, cobalt is pink, carbon is grey, and hydrogens are small light-grey balls.
Catalysts 14 00736 g014
Figure 15. Comparison between the experimentally measured conversions at different conditions and the model prediction by Mars–van Krevelen–mechanism, Langmuir–Hinshelwood (LH) mechanism, Eley−Rideal (ER) mechanism, and power law kinetic model (PWL).
Catalysts 14 00736 g015
Figure 16. Model of catalytic element under semi-adiabatic conditions.
Catalysts 14 00736 g016
Figure 17. Monolayer of PdO with the selection of ONIOM active layer used in calculations with the B3LYP density functional. Pd centers are dark-green, and oxygen centers are blue.
Catalysts 14 00736 g017
Table 1. EDX element composition in wt.% of the active phase of Pd+Co/AAS.
ElementPd+Co/AAS-FreshPd+Co/AAS-After Tests
Al35.838.4
O35.242.6
Co26.015.3
Pd3.03.7
Table 2. XPS surface atomic concentrations of O1s, Al2p, Pd3d, and Co2p1/2. The ratios of oxidation states of catalytic elements cobalt and palladium are given as percentages of total atomic concentration, respectively. The ratio variations between Co2p1/2 and Pd3d are also calculated for fresh, used, and aging-marked samples.
Elements SampleO1sAl2pPd3dCo2p1/2Co2p1/2/Pd3d
Pd+Co/AAS fresh61 at.%31 at.%6 at.%2 at.%0.333
Pd2+Pd4+Co2+Co3+
71%29%70%30%
BE, eV 337.6338.9797.0795.9
Pd+Co/AAS used
after first catalytic
activity run
59 at.%36 at.%3 at.%2 at.%0.667
Pd2+Pd4+Co2+Co3+
81%19%64%36%
BE, eV 337.6339.1797.0796.0
Pd+Co/AAS aging
170 h at
500 °C
61 at.%35 at.%2 at.%1 at.%0.500
Pd2+Pd4+Co2+Co3+
84%16%100%
BE, eV 337.5339.0797.0-
Table 3. Net natural charges and spin densities (MB Bohr magnetons) on cobalt and palladium in the surface layer, calculated for the ONIOM cluster Co2Pd14O16: prior to oxygen adsorption, upon adsorption, and upon oxygen dissociative adsorption.
Natural Charge, qSpin Density, MB
Pd(II)1.020.00
Co(II)1.131.25
Pd-O2 (ads)1.560.00
Co-O2 (ads)1.162.52
Pd next to CoO2 (ads)1.08−0.08
Co-O2 (dissoc. ads)1.232.63
Pd next to Co-O2 (dissoc. ads)1.12−0.78
Table 4. Kinetics parameters based on power-law model.
PWL
r = k C v o c m C o x n C w a t e r p
koEam (CH4)n (O2)p (H2O)RSSR2
Pd+Co/AAS6.18 × 1010102.30.930.16−0.169.00.956
Ea, kJ/mol; ko mol s−1 m−3; ko,pwl, mol s−1−[1−(m+n+p)], (R2)—squared correlation coefficient.
Table 5. Reaction rate expressions and kinetic parameters for applied LH, MVK, and ER models.
LH-DS-D: Water Compete with Oxygen and Methane
r = k K v o c C v o c K o x 1 / 2 C o x 1 / 2 ( 1 + K v o c C v o c + K w a t e r v o c C w a t e r ) ( 1 + K o x 1 / 2 C o x 1 / 2 + K w a t e r o x C w a t e r )
koEako.vocΔHvocko.ox−ΔHoxko.water−ΔHwaterko.water.red−ΔHwater.redRSSR2
Pd+Co/AAS7.54 × 1020159.11.09 × 10−866.32.00 × 10−1284.36.50 × 10−476.16.00 × 10−373.314.60.956
Table 6. Reaction rate expressions and kinetic parameters for applied MVK-models.
Model: MVK-SDP: Water Adsorbs on Oxidized and Reduced Sites. Slow Desorption of Products
r = k r e d k o x C v o c C o x γ k r e d C v o c 1 + K w a t e r v o c . C w a t e r v o c + k o x C o x 1 + K w a t e r o x . C w a t e r o x + ( k r e d k o x / k d e s ) C v o c C o x . γ = 2
ko.oxEa.oxko.reductionEa.redko.desEa.desko.water.ox−ΔHwater.oxko.water.red−ΔHwater.redRSSR2
Pd+Co/AAS2.29 × 101062.41.56 × 10859.45.00 × 10−141.29.55 × 10−782.12.24 × 10−382.23.90.985
Ea, kJ/mol; ΔHi. kJ/mol; koi, m3/mol; k = ko. exp (−Ea/RT); Ki(voc,ox) = ko(voc,ox). exp (−ΔHi,voc,ox/RT); −ΔHi = Edes − Eads, (R2)—squared correlation coefficient.
Table 7. Reaction rate expressions and kinetic parameters for applied Langmuir-Hinshelwood models.
ER-D: Water Compete with Oxygen
r = k C v o c K o x 1 / 2 C o x 1 / 2 1 + K o x 1 / 2 C o x 1 / 2 + K w a t e r C w a t e r
koEako.ox−ΔHoxko.water−ΔHwaterRSSR2
Pd+Co/AAS1.75 × 101398.62.28 × 10−1176.35.90 × 10−363.69.30.977
Ea, kJ/mol; ΔHi. kJ/mol; koi. atm−1; k = ko. exp (−Ea/RT); Ki (voc.ox) = ko. (voc.ox). exp (−ΔHi. voc.ox/RT); −ΔHi = Edes − Eads. (R2)—squared correlation coefficient.
Disclaimer/Publisher’s Note: The statements, opinions and data contained in all publications are solely those of the individual author(s) and contributor(s) and not of MDPI and/or the editor(s). MDPI and/or the editor(s) disclaim responsibility for any injury to people or property resulting from any ideas, methods, instructions or products referred to in the content.