2.1. Hydrocracking Yields and Conversion
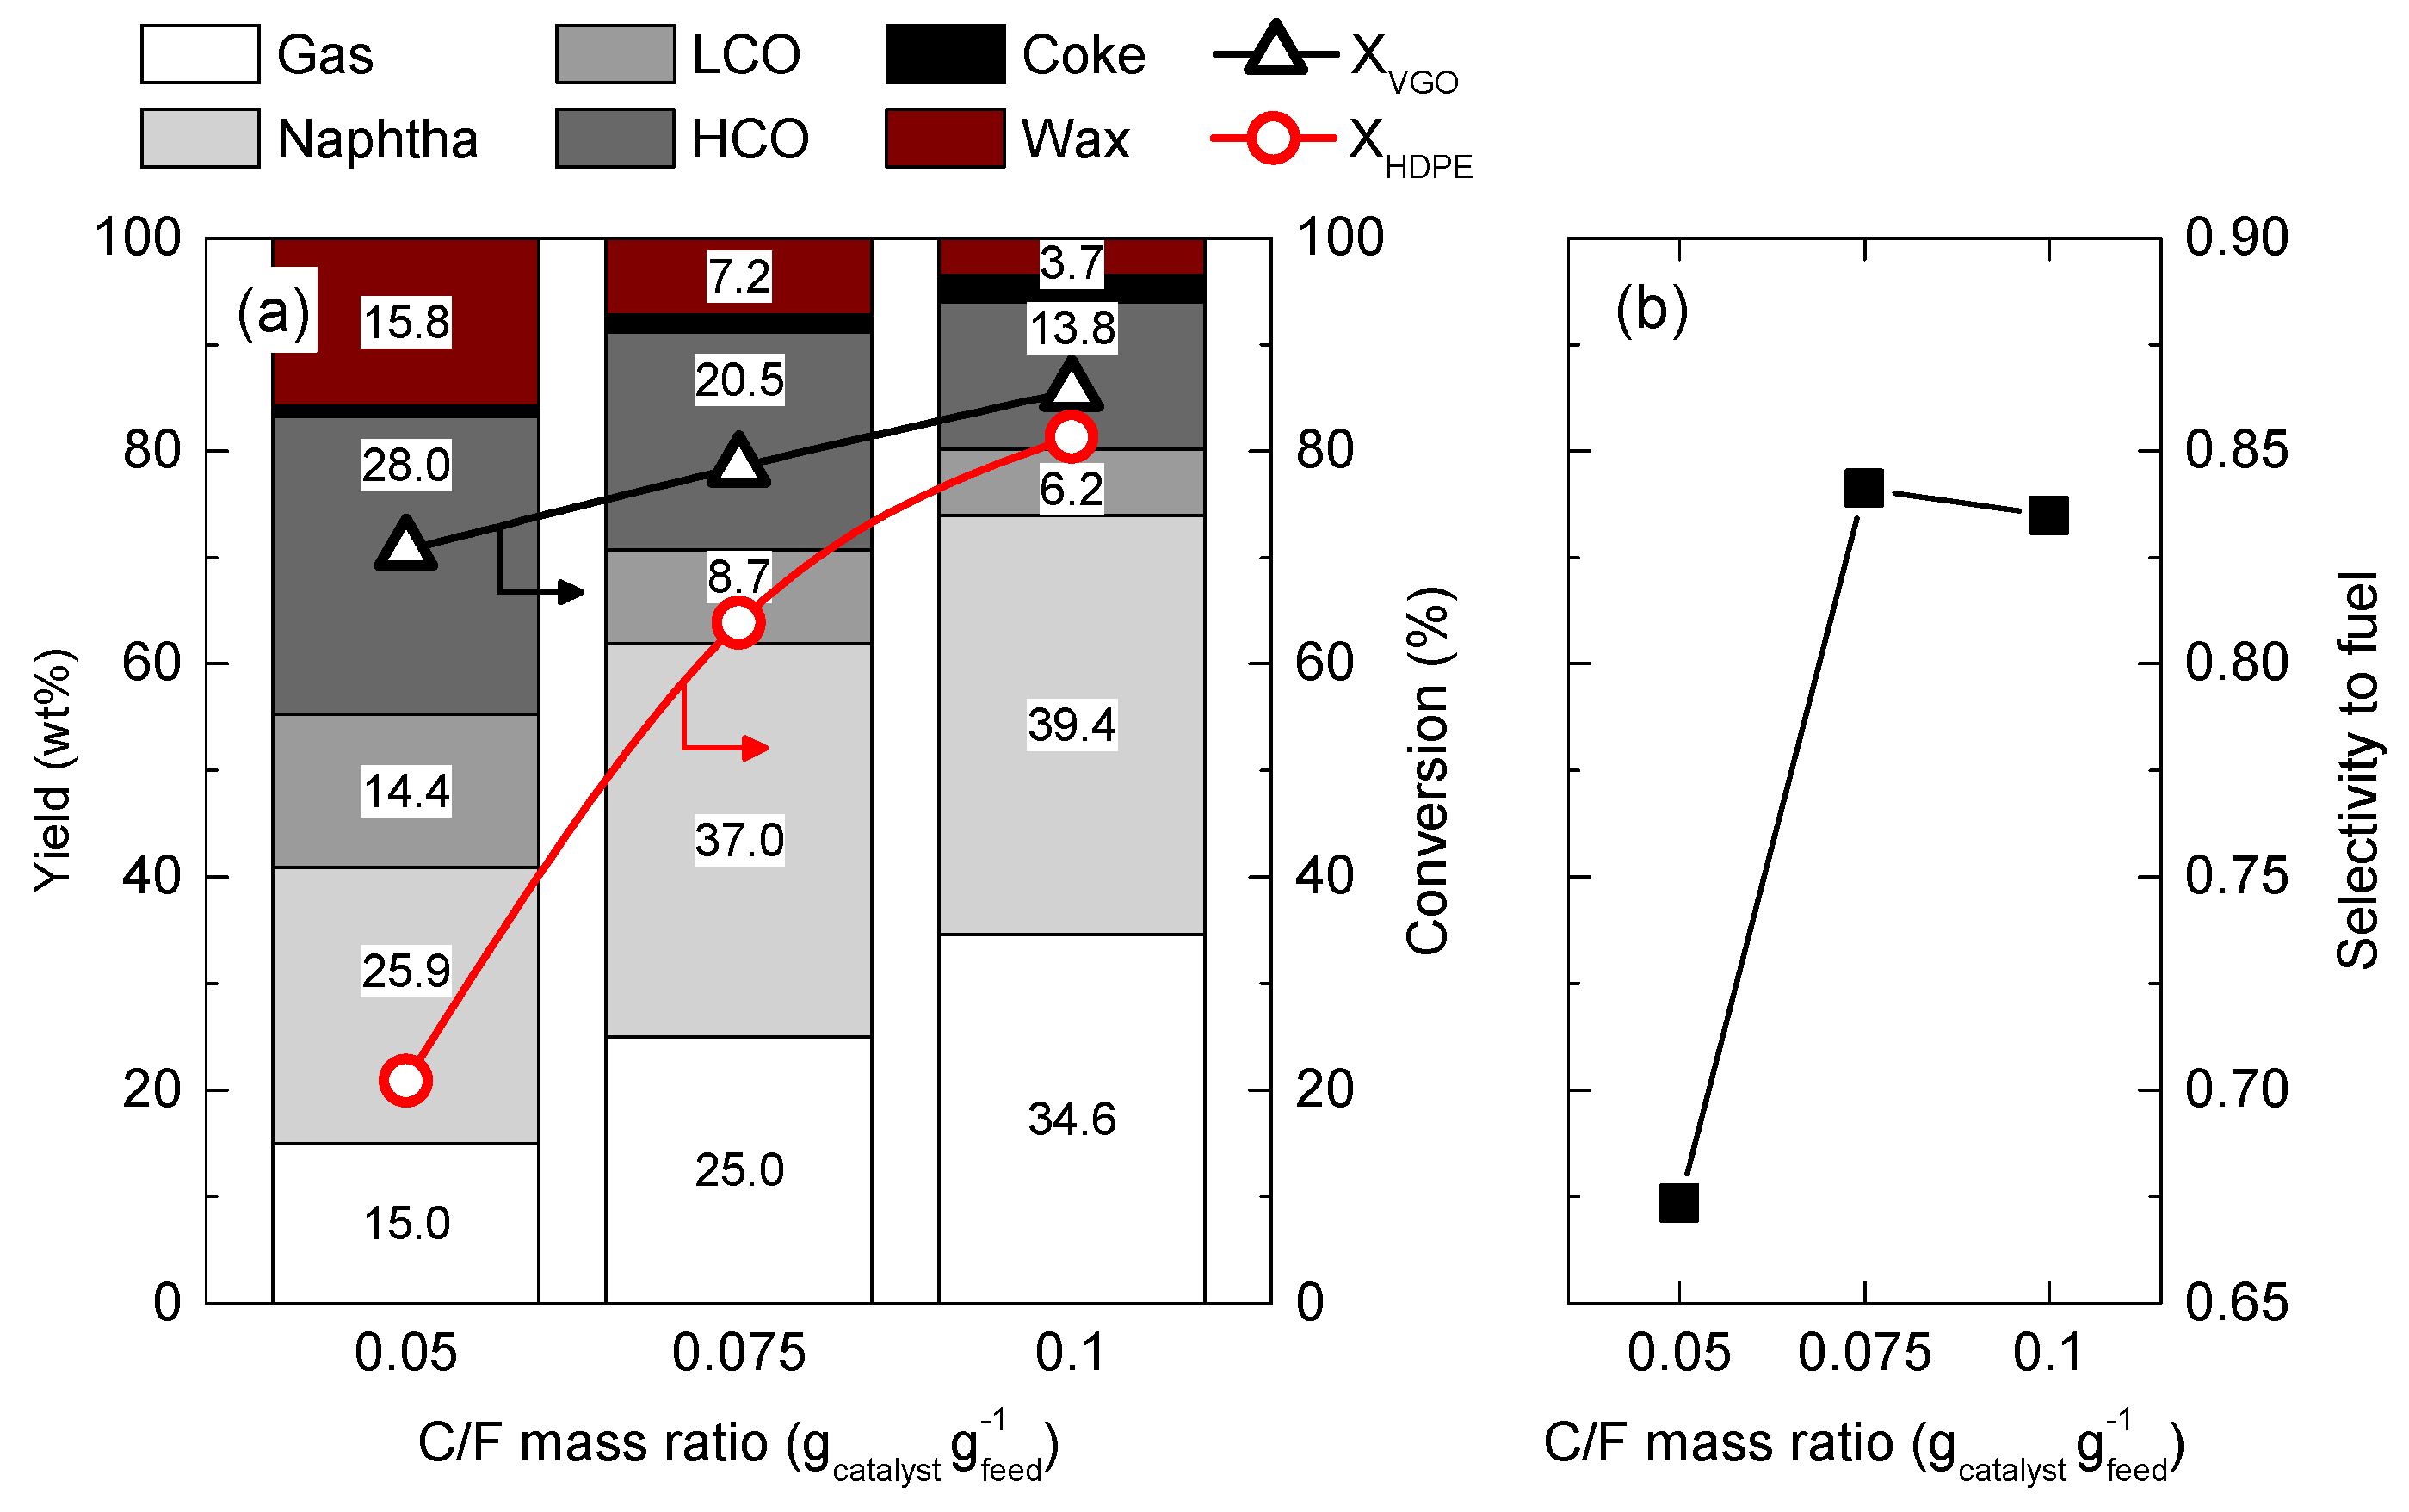
Figure 1a collects the distribution of the yields of products obtained in the hydrocracking of the HDPE/VGO blend for the three different C/F mass ratios, together with the HCO and HDPE conversions attained. Attending to the results obtained for a C/F of 0.05 g
catalyst g
feed−1, it can be seen that an HCO conversion of 70.7% was obtained, which entails a reduction in the content of HCO from 95.4 wt% in the feed to 28.0 wt%. Consequently, the naphtha fraction became the major product (yield of 25.9 wt%), followed by gas and LCO fractions (yields of 15.0 and 14.4 wt%, respectively). However, the HDPE conversion attained remained low at a value of 20.9%.
An increase in the C/F mass ratio up to 0.075 gcatalyst gfeed−1 brought a positive effect on the obtained results due to the greater availability of catalytically active sites. Consequently, both the HCO and HDPE conversions achieved increased notably, especially that of HDPE (63.9%). At the same time, the yield of HCO was reduced to 20.5 wt%, which entails an HCO conversion of 78.5%. Naphtha was the main product with a yield of 37.0 wt%, whereas the yield of the LCO fraction was sharply reduced (8.7 wt%). Nevertheless, the higher catalytic activity also provoked a higher formation of gases (25.0 wt%).
At the highest C/F mass ratio tested (0.1 g
catalyst g
feed−1), the yield of HCO was reduced, reaching a value of 13.8 wt%. This fact pushed the HCO conversion up to 85.6%. Naphtha remained as the main product (yield of 39.4 wt%) but was closely followed by the yield of gases produced (yield of 34.6 wt%). The increase in the C/F mass ratio also improved the HDPE conversion, reaching a very attractive value of 81.3%, which is almost equal to that obtained for the HCO conversion. These results are in good agreement with those previously reported by Uçar et al. [
18] in the hydrocracking of a blend composed of low-density polyethylene and heavy VGO.
With regard to the formation of coke, it can be seen that the higher the C/F mass ratio used, the higher the amount of coke deposited on the catalyst. Thus, the yield of coke was of 0.9 wt% for the lowest C/F mass ratio used (0.05 gcatalyst gfeed−1), but it increased up to 2.5 wt% for a C/F mass ratio of 0.1 gcatalyst gfeed−1.
The evolution of the selectivity to fuel index (S
F) depicted in
Figure 1b summarizes the product distribution obtained. Thus, for a C/F mass ratio of 0.05 g
catalyst g
feed−1, the lowest selectivity to fuel was obtained (0.67). This result may be a direct consequence of (i) the low HDPE conversion (20.9%) and the moderate HCO conversion attained (70.7%); and (ii) the important gas formation (15.0 wt%). An increase in the C/F mass ratio to 0.075 g
catalyst g
feed−1 increased the selectivity to fuel to 0.84, exposing that the increase in the yield of naphtha contributed to increasing this index. However, a further increase up to 0.1 g
catalyst g
feed−1 did not entail a higher selectivity to fuel; it remained almost constant at a value of 0.83. Therefore, the higher yield of naphtha produced was counterbalanced by the gas formation and did not have a positive effect in the formation of the fractions of interest.
In order to assess the effects of the addition of the HDPE to the hydrocracking units, the results have been compared with those previously reported about the hydrocracking of neat VGO for a C/F mass ratio of 0.1 g
catalyst g
feed−1 [
15]. In this regard, the HCO conversion was 91.7%, slightly higher than the one obtained for the HDPE/VGO blend (85.6%). The distribution of yields was more influenced by the addition of the HDPE, since the gas formation increased from 22.5 to 34.6 wt%, and the yield of the naphtha fraction was reduced from 59.6 to 39.4 wt%. Therefore, the addition of the HDPE modified the distribution of products since the macromolecules of HDPE react faster than the bulky polyaromatics compounds within the VGO, leading to a superior formation of gas products. Furthermore, the existence of possible synergistic effects derived from the role of dissolved HDPE macromolecules acting as hydrogen donors must be also considered. This fact was ratified with the selectivity to fuel index obtained for the VGO (2.12) that is considerably higher than that of the HDPE/VGO blend (0.83). One should note that this value is importantly affected by the conversion level attained.
2.2. Characterization of the Gas Fraction
Figure 2 displays how the composition of the gas fraction evolved with the C/F mass ratio. As it can be seen, this fraction was composed of light paraffins composed of hydrocarbons between one and four carbon atoms: methane, ethane, propane, n-butane and iso-butane. One should note that no light olefins were detected in this fraction because they are easily saturated under the tested operation conditions. By splitting the gas fraction into dry gas (C
1 and C
2 compounds) and liquefied petroleum gases (LPG, C
3 and C
4 compounds), the concentration of the latter was by far predominant as it reached values above 70 wt% for all the C/F mass ratios studied.
For a C/F mass ratio of 0.05 g
catalyst g
feed−1, the concentration of dry gas accounted for 30.2 wt%, with the concentration of ethane higher than that of methane (17.1 vs. 13.1 wt%, respectively). On the other hand, LPGs were composed of 26.7 wt% propane, 26.2 wt% iso-butane and 16.9 wt% n-butane. A similar composition of the gas fraction was reported by Metecan et al. [
19] in the hydrocracking of a blend of polyolefin plastics (HDPE, LDPE and PP). When the C/F mass ratio was increased, a marked overall trend was observed. In this regard, the concentration of dry gas decreased in contrast to that of LPG, reaching values of 26.6 wt% and 73.4 wt%, respectively. With regard to the individual components, it can be seen that the concentration of methane was reduced, while that of ethane remained almost constant. Attending to the components of the LPG fraction, the concentration of propane was notably increased since it went from a value of 26.7 wt% for a C/F mass ratio of 0.05 g
catalyst g
feed−1 to a value of 52.2 wt% for a C/F mass ratio of 0.1 g
catalyst g
feed−1. This trend can be a consequence of the promotion of the over-cracking reactions that lead to an increase in the concentration of the C
1–C
3 products, with that of propane being especially remarkable. Furthermore, the concentration of iso-butane went from 26.2 wt% for a C/F mass ratio of 0.05 g
catalyst g
feed−1 to 13.1 wt% for a C/F mass ratio of 0.1 g
catalyst g
feed−1. Thus, it can be deduced that the mechanism that governs gas formation is the protolytic cracking instead of β-scission reactions.
The composition of the gas fraction was quite similar to that obtained in the hydrocracking of neat VGO for a C/F mass ratio of 0.1 g
catalyst g
feed−1 [
15]. In that case, the yield of dry gas was slightly lower (24.3 wt% vs. 26.6 wt%), thus being higher that of LPG (75.7 wt% vs. 73.4 wt%) but without the difference between them being so remarkable. With regard to individual components, propane was also the compound with the highest yield (50.4 wt%), which was slightly lower than the one obtained with the HDPE/VGO blend (52.2 wt%).
2.3. Characterization of the Naphtha and LCO Fractions
Since the fractions of interest in hydrocracking processes are both naphtha and LCO fractions, which can be respectively assimilable by gasoline and diesel fractions of refineries, they have been analyzed in detail. Thus, the PIANO composition of these fractions for the tested C/F mass ratios is depicted in
Figure 3. Focusing on the PIANO composition of the naphtha fraction (
Figure 3a) in the first place, it can be seen that it is mainly aliphatic independently of the value of the C/F mass ratio. Indeed, the less aliphatic one is that obtained for a C/F mass ratio of 0.1 g
catalyst g
feed−1 (49.6 wt% of aliphatics). Attending to the distribution of n- and iso-paraffins, there is a clear predominance of the ramified ones, even though their concentration decreased with the C/F mass ratio and went from 30.2 to 21.3 wt% for an increase in the C/F mass ratio from 0.05 to 0.1 g
catalyst g
feed−1. Moreover, the concentration of linear paraffins also decreased, leading to an increase in the naphthenes that reached their maximum concentration (20.3 wt%) at 0.1 g
catalyst g
feed−1. On the other hand, the concentration of aromatics increased with the C/F mass ratio, and the maximum value of 50.4 wt% was obtained at 0.1 g
cat g
feed−1. However, the aromatic fraction was mainly composed of monoaromatics, the concentration of diaromatics being inferior to 4 wt% independently of the C/F mass ratio used. Furthermore, the concentration of monoaromatics increased with the C/F mass ratio, while that of the diaromatics decreased. This result is directly related to the hydrodearomatization (HDA) of the heavy and bulky aromatics from the LCO and HCO fractions of the VGO [
20]. Thus, the HDA of those high-molecular-weight molecules led to the formation of partially hydrogenated molecules within the naphtha fraction, such as tetralin-like compounds. Moreover, it should be taken into account that the formation of aromatics from the HDPE macromolecules is very unlikely to occur.
It must be also taken into account that two additional routes could have led to the formation of light aromatic compounds: (i) the cyclization of the olefins that are formed as a consequence of the cracking reactions; and (ii) the hydrogen transfer reactions that may occur within the naphthenes. Even though the aforementioned routes could occur within the narrower pores of the zeolite, their contribution to the reaction is not expected to be crucial. Nonetheless, considering the high concentration of monoaromatics in the naphtha fraction (
Figure 3a), they must be also contemplated. Therefore, these reactions together with the HDA route are likely to promote the production of benzene, toluene, xylenes (BTX) and alkylbenzenes. This assumption was correlated by analyzing the aromatics present in the naphtha fraction. In this regard, the concentration of BTX increased with the C/F mass ratio from a value of 20.6 wt% for a C/F mass ratio of 0.05 g
catalyst g
feed−1 to a value of 29.2 wt% for a C/F mass ratio of 0.1 g
catalyst g
feed−1.
In order to fully characterize the naphtha fraction, the research octane number (RON) was computed for the different C/F mass ratios. To calculate it, the method developed by Anderson et al. [
21], which is based on chromatographic results, was used. At the lowest C/F mass ratio (0.05 g
catalyst g
feed−1), an RON of 94 was obtained, which is a value very similar to the one required by commercial gasoline (95). This result is mainly based on the high concentration of ramified paraffins that undoubtedly boosted it. However, an increase in the C/F mass ratio up to 0.075 g
catalyst g
feed−1 brought a detriment in the RON (92.5), which continued decreasing (92.3) for the highest C/F mass ratio (0.1 g
catalyst g
feed−1). Therefore, these naphtha fractions may require to be submitted to a catalytic reforming stage to adapt their composition and be suitable for being used in the blending of commercial gasoline.
In the hydrocracking of neat VGO with a C/F mass ratio of 0.1 g
catalyst g
feed−1 [
15], the naphtha fraction obtained was less aromatic (32.3 wt%) than the one obtained with the blend (50.4 wt%). These results exposed that the HDPE macromolecules interfered in the access of the molecules within the VGO to the active sites of the catalyst, thus affecting its performance. Therefore, it can be concluded that a certain degree of fouling may be caused by the degraded HDPE macromolecules that occlude the channels of the zeolite.
Focusing on the PIANO composition of the LCO fraction (
Figure 3b), it can be seen that it is highly influenced by the C/F mass ratio used. The lowest C/F mass ratio (0.05 g
catalyst g
feed−1) produced an almost balanced composition between aliphatics and aromatics (49.5 and 50.5 wt%, respectively). Attending to paraffins distribution, the concentration of iso-paraffins exceeded to large extent in contrast to that of n-paraffins (38.7 wt% vs. 10.7 wt%, respectively). Likewise, diaromatics are the main compounds in the aromatics fraction (38.3 wt%), with that of mono- and polyaromatics substantially being smaller (7.5 and 4.7 wt%, respectively). An increase in the C/F mass ratio brought an increase in the paraffins and a subsequent decrease in the aromatics. Particularly, for a C/F mass ratio of 0.1 g
catalyst g
feed−1, paraffins accounted for more than 70 wt% of the compounds in the LCO fraction, where iso-paraffins predominated over n-paraffins (52.4 vs. 18.1 wt%, respectively). Consequently, the concentration of aromatics decreased notably, especially that of diaromatics (22.9 wt%). One should note also that the family of naphthenes has not been included in the results depicted in
Figure 3b, since its concentration was negligible (<1 wt%) and independent of the C/F mass ratio tested.
Hence, according to these last results, it can be concluded that an increase in the C/F mass ratio resulted in (i) a promotion of the HDA capability to saturate (at least partially) the aromatics within the LCO fraction, resulting in an important reduction in the aromatics within this fraction; and (ii) a bigger amount of acidic sites becoming available, especially on the outside of zeolite crystals, for the cracking of the HDPE molecules to hydrocarbons within the LCO fraction [
22].
Finally, the cetane index of the LCO fraction has been also calculated in order to obtain a full picture of the quality of this fraction. Cetane indexes were determined according to the procedure explained on the ASTM D4737 Standard. There is a marked and clear effect of the C/F mass ratio on the values of the cetane index obtained, which are a consequence of the aforementioned changes in the composition of the LCO fraction. The lower the concentration of aromatics, especially polyaromatics, in the LCO fraction, the higher the cetane index will be [
23]. Thus, the cetane index increased with the C/F mass ratio, and values of 40.5, 44.7 and 54.9 were obtained for 0.05, 0.075 and 0.1 g
catalyst g
feed−1, respectively. These values are high enough for LCO to be suitable for being used in the blending of commercial diesel in refineries.
In contrast to the results obtained for the naphtha fraction, these ones improved those obtained in the hydrocracking of neat VGO with a C/F mass ratio of 0.1 g
catalyst g
feed−1 [
15]. In this regard, the LCO fraction obtained from the neat VGO was more aromatic (36.2 wt%) that the LCO fraction of the blend (29.4 wt%). This result drives to conclude that the HDPE macromolecules are decomposed into long aliphatic compounds with a boiling point within the range of the LCO fraction.
2.4. Characterization of the Coke
The spent catalysts were analyzed via TPO analysis in order to obtain information about the nature and location of the coke deposited on each case. The obtained results are collected in
Figure 4, where the effects that the C/F mass ratio has on the formation of this carbonaceous deposit can be seen. Attending to the shape of the TPO profiles, it can be seen that they are quite wide and that their deconvolution was encouraged to really assess the contribution of the different types of coke [
24]. Thus, three different types of coke were distinguished. Coke type I, which burns at the lowest temperature range (375–435 °C) was attributed to amorphous coke with high H/C ratios [
25] that presumably was deposited on the outside of catalyst particles and was mainly composed of partially degraded HDPE molecules [
26]. Coke type II was composed of more developed structures (lower H/C ratio) and was mainly located in the mesopores of the zeolite, but it could be also formed in the micropores. This type of coke burnt at intermediate temperatures (435–490 °C). Finally, coke type III is ascribed to highly condensed aromatic structures (very low H/C ratio). These structures are formed within the crystalline channels of the zeolite by means of condensation and hydrogen transfer reactions that take place on the inner acidic sites of the zeolite [
27]. Due to its internal location and the possible partial blocking of the micropores that it could create, the combustion of this last type of coke can be affected by diffusional restrictions. Hence, higher temperatures were required for combusting this type III of coke (490–540 °C).
For the C/F mass ratios of 0.05 and 0.075 gcatalyst gfeed−1, the TPO profiles were deconvoluted into two different peaks, meaning that just coke type I and type II were found on these samples. However, comparing the peaks of both samples, it can be seen that those obtained for a C/F mass ratio of 0.075 gcatalyst gfeed−1 shifted towards higher temperatures. In this regard, the combustion of the coke of this sample was composed of structures with a higher condensation degree, and higher temperatures were required for burning them. At the highest C/F mass ratio (0.1 gcatalyst gfeed−1), three peaks were required for deconvoluting the TPO profile. So, in this third sample, the aforementioned three types of coke were detected. Moreover, this third profile was shifted towards even higher temperatures than those required for burning the sample obtained at 0.075 gcatalyst gfeed−1. Therefore, an increase in the C/F mass ratio augmented the acidic sites available for cracking molecules but also their availability for condensing the coke precursors, obtaining more condensed structures.
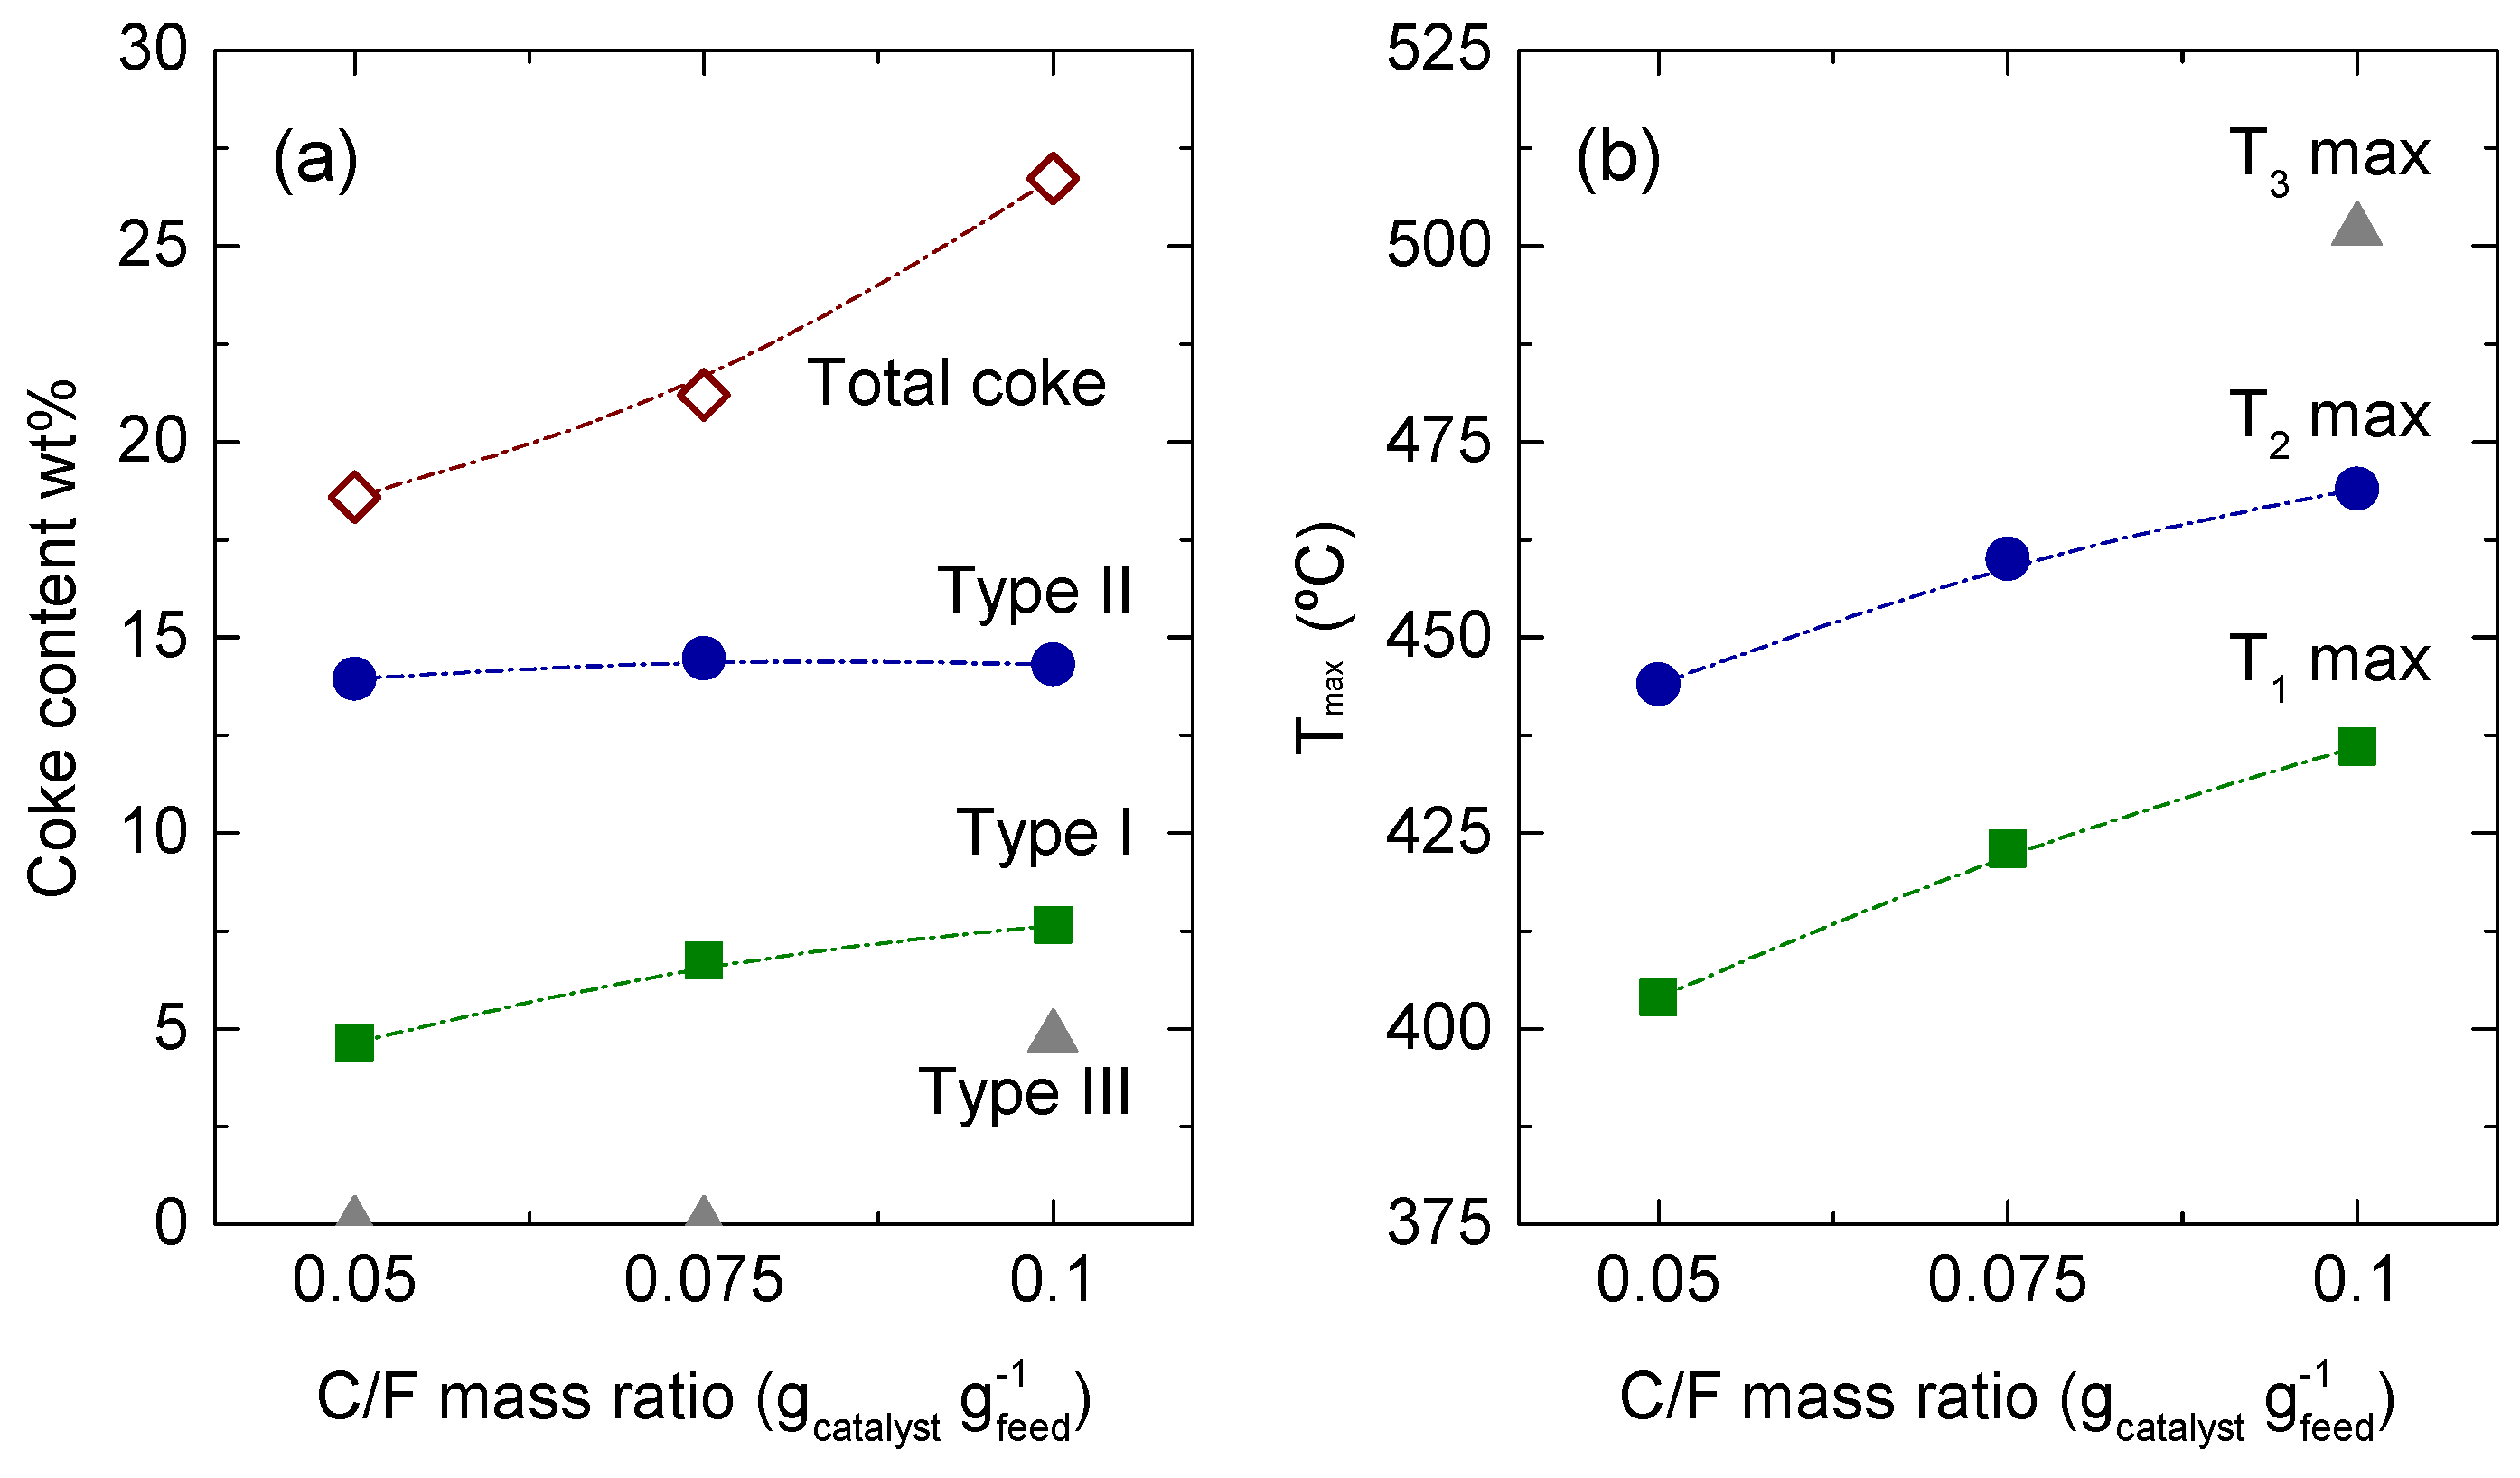
The results obtained from the deconvolution of the TPO profiles are summarized in
Figure 5. In this figure, the following can be found: (i) the total amounts of coke formed for each C/F mass ratio together with the contribution of each type of coke (
Figure 5a); and (ii) the maximum temperature at which each type of coke burnt (
Figure 5b). With regard to the amount of coke, the C/F mass ratio had an important effect on coke formation. Hence, the higher the C/F mass ratio, the higher the amount of coke produced. It increased from 18.6 to 26.7 wt% when increasing the C/F mass ratio from 0.05 to 0.1 g
catalyst g
feed−1. Regarding coke distribution, an increase in the C/F mass ratio caused an increase in both types of coke, the increasing rate of coke type I being higher. In this regard, at 0.05 g
catalyst g
feed−1, the content of coke type I and II was 4.6 and 13.9 wt%, respectively, whereas the values obtained at 0.075 g
catalyst g
feed−1 were 6.7 and 14.5 wt%, respectively. However, as explained before, the maximum combustion temperature of each peak increased, resulting in more complex coke structures. At the highest C/F mass ratio (0.1 g
catalyst g
feed−1), the trends followed by the types of coke were similar, with the exception that coke type III was also detected. This fact meant that coke type II was capable of developing to a greater extent, leading to more condensed structures and causing its splitting into two different types of coke (coke type II and type III). In this regard, coke type I increased to a value of 7.6 wt%, while coke type II slightly decreased down to 14.3 wt%. Finally, the amount of coke III formed was 4.8 wt%.
Attending to the results collected in
Figure 4 and
Figure 5, the content of coke and the development degree increased with the C/F mass ratio. A greater amount of catalysts implied an enhancement of the catalytic reactions, leaving the role of thermal reactions in second place. Furthermore, the formation of coke precursors and their subsequent condensation that lead to the formation of coke were also boosted with the C/F mass ratio. Similar results were previously reported by Wang et al. [
28] in the hydroprocessing of vacuum residue. They observed that thermal reactions produced smaller amounts of coke and that the coke formed through this mechanism was less developed (higher H/C ratio) than the coke produced by catalytic means. This fact is a consequence of the lack of reaction of the polyaromatics within the VGO that tended to produce bulky but poorly developed agglomerates on the external surface of the catalyst. However, when those polyaromatics were hydrocracked, leading to the production of smaller and lighter compounds, both aliphatics and aromatics could enter into the inner channels of the zeolite. There, they were condensed into complex polyaromatics molecules than ended up forming coke, which requires high temperatures to be burnt because of its condensation degree and its location in the inner channels of the zeolite.


