Article

Cu-MOF-74-Derived CuO-400 Material for CO2 Electroreduction

1
Key Laboratory of Petroleum Molecular & Process Engineering, Shanghai Key Laboratory of Green Chemistry and Chemical Processes, School of Chemistry and Molecular Engineering, East China Normal University, Shanghai 200062, China
2
College of Chemistry and Chemical Engineering, Ningxia Normal University, Guyuan 756099, China
3
Institute of Eco-Chongming, 20 Cuiniao Road, Chenjia Town, Chongming District, Shanghai 202162, China
*
Author to whom correspondence should be addressed.
These authors contributed equally to this work.
Catalysts 2024, 14(6), 361; https://doi.org/10.3390/catal14060361
Submission received: 28 March 2024 / Revised: 27 May 2024 / Accepted: 28 May 2024 / Published: 31 May 2024
(This article belongs to the Special Issue New Insights into Electrocatalysis for Energy Storage and Conversion)

Abstract

:
This study proposes a straightforward strategy utilizing metal–organic frameworks (MOFs) to obtain efficient electrocatalysts for synthesizing C2 products (C2H4 and C2H5OH) via a CO2 reduction reaction. Cu-MOF-74 was chosen as the precursor, while copper oxide nanoparticles were obtained through a calcination method. During the calcination process, by controlling the calcination conditions, the porous structure of the MOF framework was successfully retained, leading to CuO-400 with a high catalytic activity and C2 production efficiency. Compared to CuO-n formed by the calcination of Cu(NO3)2, CuO-400 derived from MOFs exhibits a 1.6 times higher C2 activity as an electrocatalytic material at −1.15 V vs. RHE.

1. Introduction

With the improvement of living standards, the world’s demand for energy continuous to grow rapidly. However, due to the excessive exploitation of hydrocarbon resources, the emissions of carbon dioxide (CO2) from fossil fuel combustion continue to rise, resulting in a series of impacts on the ecological environment. According to the latest research by the Global Carbon Budget scientific team, the global emissions of CO2 from fossil fuels rose again in 2023, reaching a record level of 36.8 billion tons, an increase of 1.1% compared to 2022 [1]. In response to the environmental issues caused by the increase in CO2 emissions, various CO2 reduction and conversion technologies have been rapidly developed by researchers. Among these, electrochemical CO2 reduction reactions (CO2RRs) have attracted widespread attention due to their mild conditions, environmental friendliness, and the ability to produce a variety of valuable additional products [2]. However, electrochemical methods also face challenges such as noticeable competing reactions, high overpotential, and poor selectivity, which require further improvement. Electrochemical methods are influenced by various conditions, such as the electrolyzer, electrolyte, pH, and electrode materials [3]. Among the many influencing factors, the electrode materials are the most critical. Therefore, it is crucial to find efficient and selective catalysts.
Metal catalysts have been extensively studied by researchers due to their excellent conductivity and catalytic performance. In the early 20th century, metals such as mercury and zinc were discovered to be capable of CO2 electroreductions. By the 1980s, it was found that copper-based catalysts could be used for the electrocatalytic reduction of CO2, producing hydrocarbons and alcohols with high Faradaic efficiency (FE) [4]. Subsequently, an increasing number of metals were found to be capable of electrocatalytic CO2 reduction. Among these metals, Cu-based catalysts demonstrate a superior catalytic performance compared to others. However, simple Cu catalysts still suffer from issues such as a poor selectivity for single-product and a low current efficiency in CO2RR. To enhance the catalytic activity and product selectivity of Cu catalysts for CO2RR, numerous scientific teams have conducted research focusing on copper-based catalysts, leading to the development of various types of Cu-based catalysts and their derivative catalysts. These catalysts include copper nanoparticles [5,6], copper alloy catalysts [7,8,9,10,11], single-atom catalysts [12,13,14], non-metal element-doped copper-based catalysts [15,16], and copper-based metal–organic framework (Cu-MOF) catalysts [17,18,19,20].
In recent years, metal–organic frameworks (MOFs) have become popular due to their novel properties. MOFs are a type of porous coordination polymer composed of metal ions/clusters and organic ligands, characterized by their high permanent porosity, high crystallinity, and order [21,22,23]. Compared to inorganic catalytic materials, nano-materials derived from MOFs exhibit an excellent catalytic activity in CO2 electroreduction due to their high surface area, tunable geometric structures, and controllable pore sizes. This type of material is also frequently used in the modification of Cu-based catalysts. Among these, Cu-MOFs and their derivative catalytic materials have played a significant role in CO2RR reactions [24,25]. Research has found that Cu-MOFs and their derivatives exhibit an excellent selectivity and high performance for C2 products. Xiao et al. [26] prepared Cu-MOF material Cu-BTC using 1,3,5-benzenetricarboxylic acid as the ligand. A series of different catalysts were prepared under various calcination conditions to modulate the oxidation states of Cu, resulting in a range of catalysts with different Cu oxidation states derived from Cu-BTC. The Cu/C-T-air catalyst, obtained by calcining in air, showed a preference for producing C2H4; in particular, the Cu/C-450-air catalyst calcined at 450 ℃ achieved an FE of 34.8%. Sargent et al. [27] used a thermochemical method to deform the symmetrical paddle-wheel Cu dimers of HKUST-1 (the alias of Cu-BTC) into asymmetrical forms, by changing the calcination isothermal time and maintaining the calcination temperature at 250 °C, thus controlling the deformation of the copper dimers, while preserving the HKUST-1 structure. Studies on the crystal structure showed that most of the paddle-wheel copper Cu dimers were located within the (111) plane. The loss of crystallinity on the (111) face could be explained by the structural distortion and loss of order of the Cu dimers in the paddle-wheel dimers. This method provides an effective strategy to maintain the MOF structure.
Cu-MOF-74 is an MOF material with a large specific surface area, containing highly dispersed and fully exposed unsaturated metal centers, which also has advantages in the form of nanocrystals in CO2RR [28]. In this study, we subjected Cu-MOF-74 material to calcination to prepare CuO-400. By controlling the calcination conditions, we preserved the original rod-like structure of CuO-400 from the MOF. The calcined material was then employed in CO2RR.

2. Results and Discussion

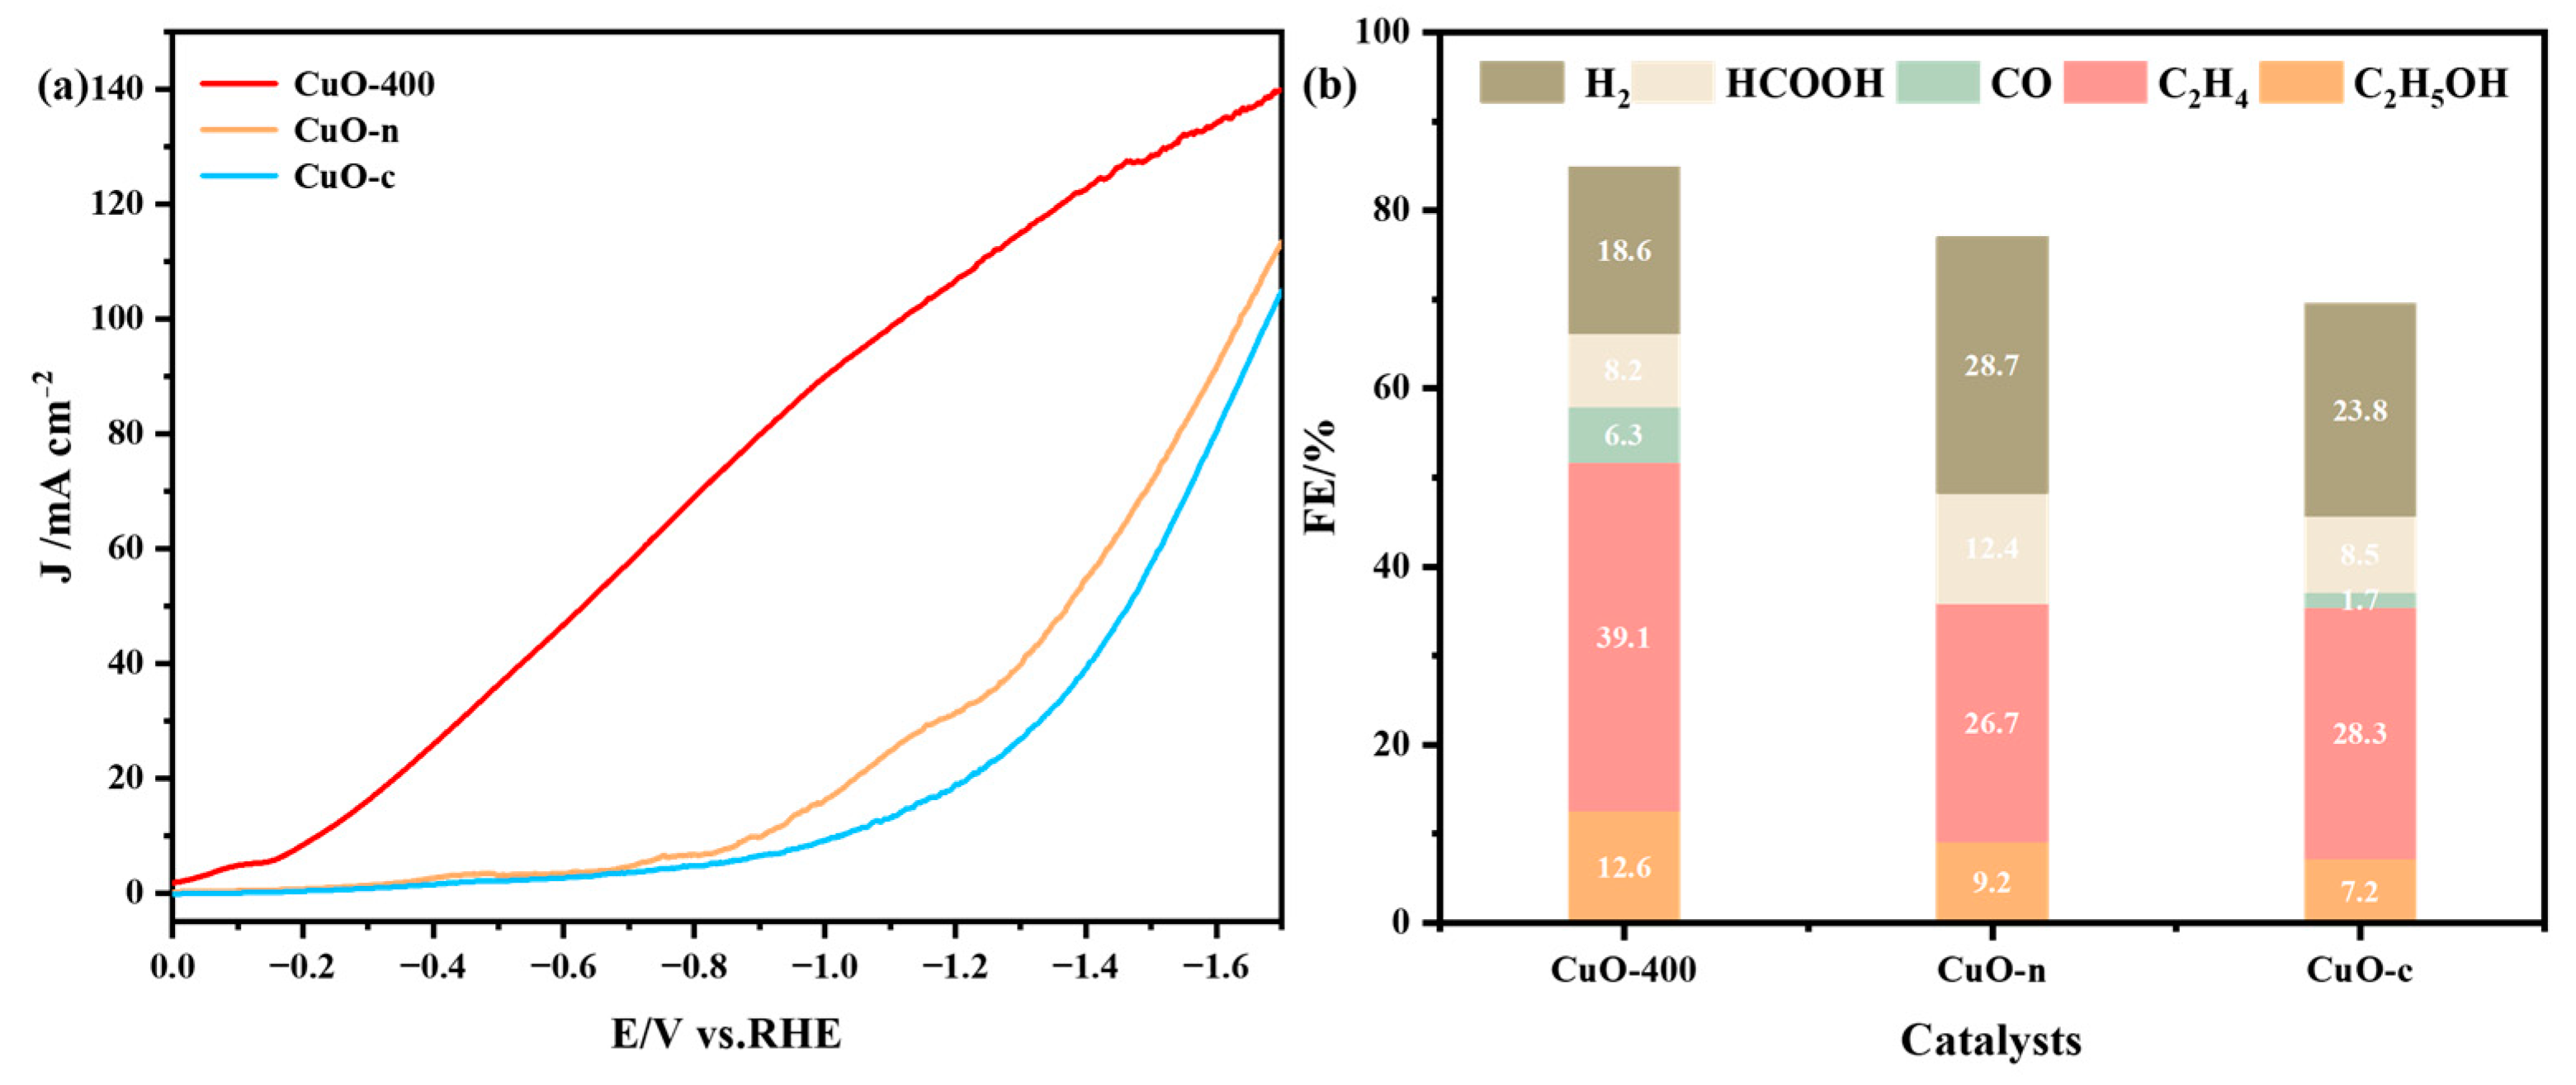
2.1. Electrochemical Performance of Cu-MOF-74 and CuO-400

According to reference [29], Cu-MOF-74 was synthesized using Cu(NO3)2·3H2O as the copper precursor and H4DOBDC as the organic linker, via a hydrothermal method. Subsequently, CuO-400 was obtained by calcination in air at 400 °C. To investigate the electrocatalytic performance of the MOF materials before and after calcination, linear sweep voltammetry (LSV) tests were conducted on both Cu-MOF-74 and CuO-400. Compared to the values in the N2 environment, both Cu-MOF-74 (Figure 1a) and CuO-400 (Figure 1b) exhibited higher current densities in the CO2 environment, indicating that both materials are conducive to CO2 reduction. Moreover, CuO-400 showed an even higher current density, which indicates a faster electron transfer rate and a better electrocatalytic performance.
According to the LSV results, constant potential electrolysis of CO2 on Cu-MOF-74 and CuO-400 materials was conducted within the potential range of −0.95 to −1.35 V vs. RHE. Gas and liquid products were detected using GC and 1H NMR after electrolysis. When Cu-MOF-74 was used as the catalyst, the main product detected was HCOOH, with a maximum FE of 44.6% at −1.05 V vs. RHE (Figure 1c). However, the hydrogen evolution reaction of this catalyst was very severe, resulting in an overall low FE for CO2RR. On the other hand, when CuO-400 was used as the catalyst, economically more favorable C2 species (C2H4 and C2H5OH) were the main products (Figure 1d). With the electrolysis potential shifting from −0.95 V to −1.35 V vs. RHE, there was an initial increase followed by a decrease in the FE of C2 products. At −1.15 V vs. RHE, the FEC2 on CuO-400 reached a maximum of 51.7%, with 39.1% for C2H4 and 12.6% for C2H5OH; the hydrogen evolution reaction was partially suppressed, with an FEH2 of only 18.6%. Comparatively, both the FEC2 and partial current density of C2 products on CuO-400 were significantly higher than those on Cu-MOF-74 (Figure S1). Comparison of the electrolysis results of the materials before and after calcination shows that the CO2 electrocatalytic performance of the calcined material is enhanced and the overall FE is improved, along with the increase in the FE of the C2 product and a significant reduction in the generation of H2. Therefore, this derivatization strategy proves to be effective for modifying Cu-MOF-74.

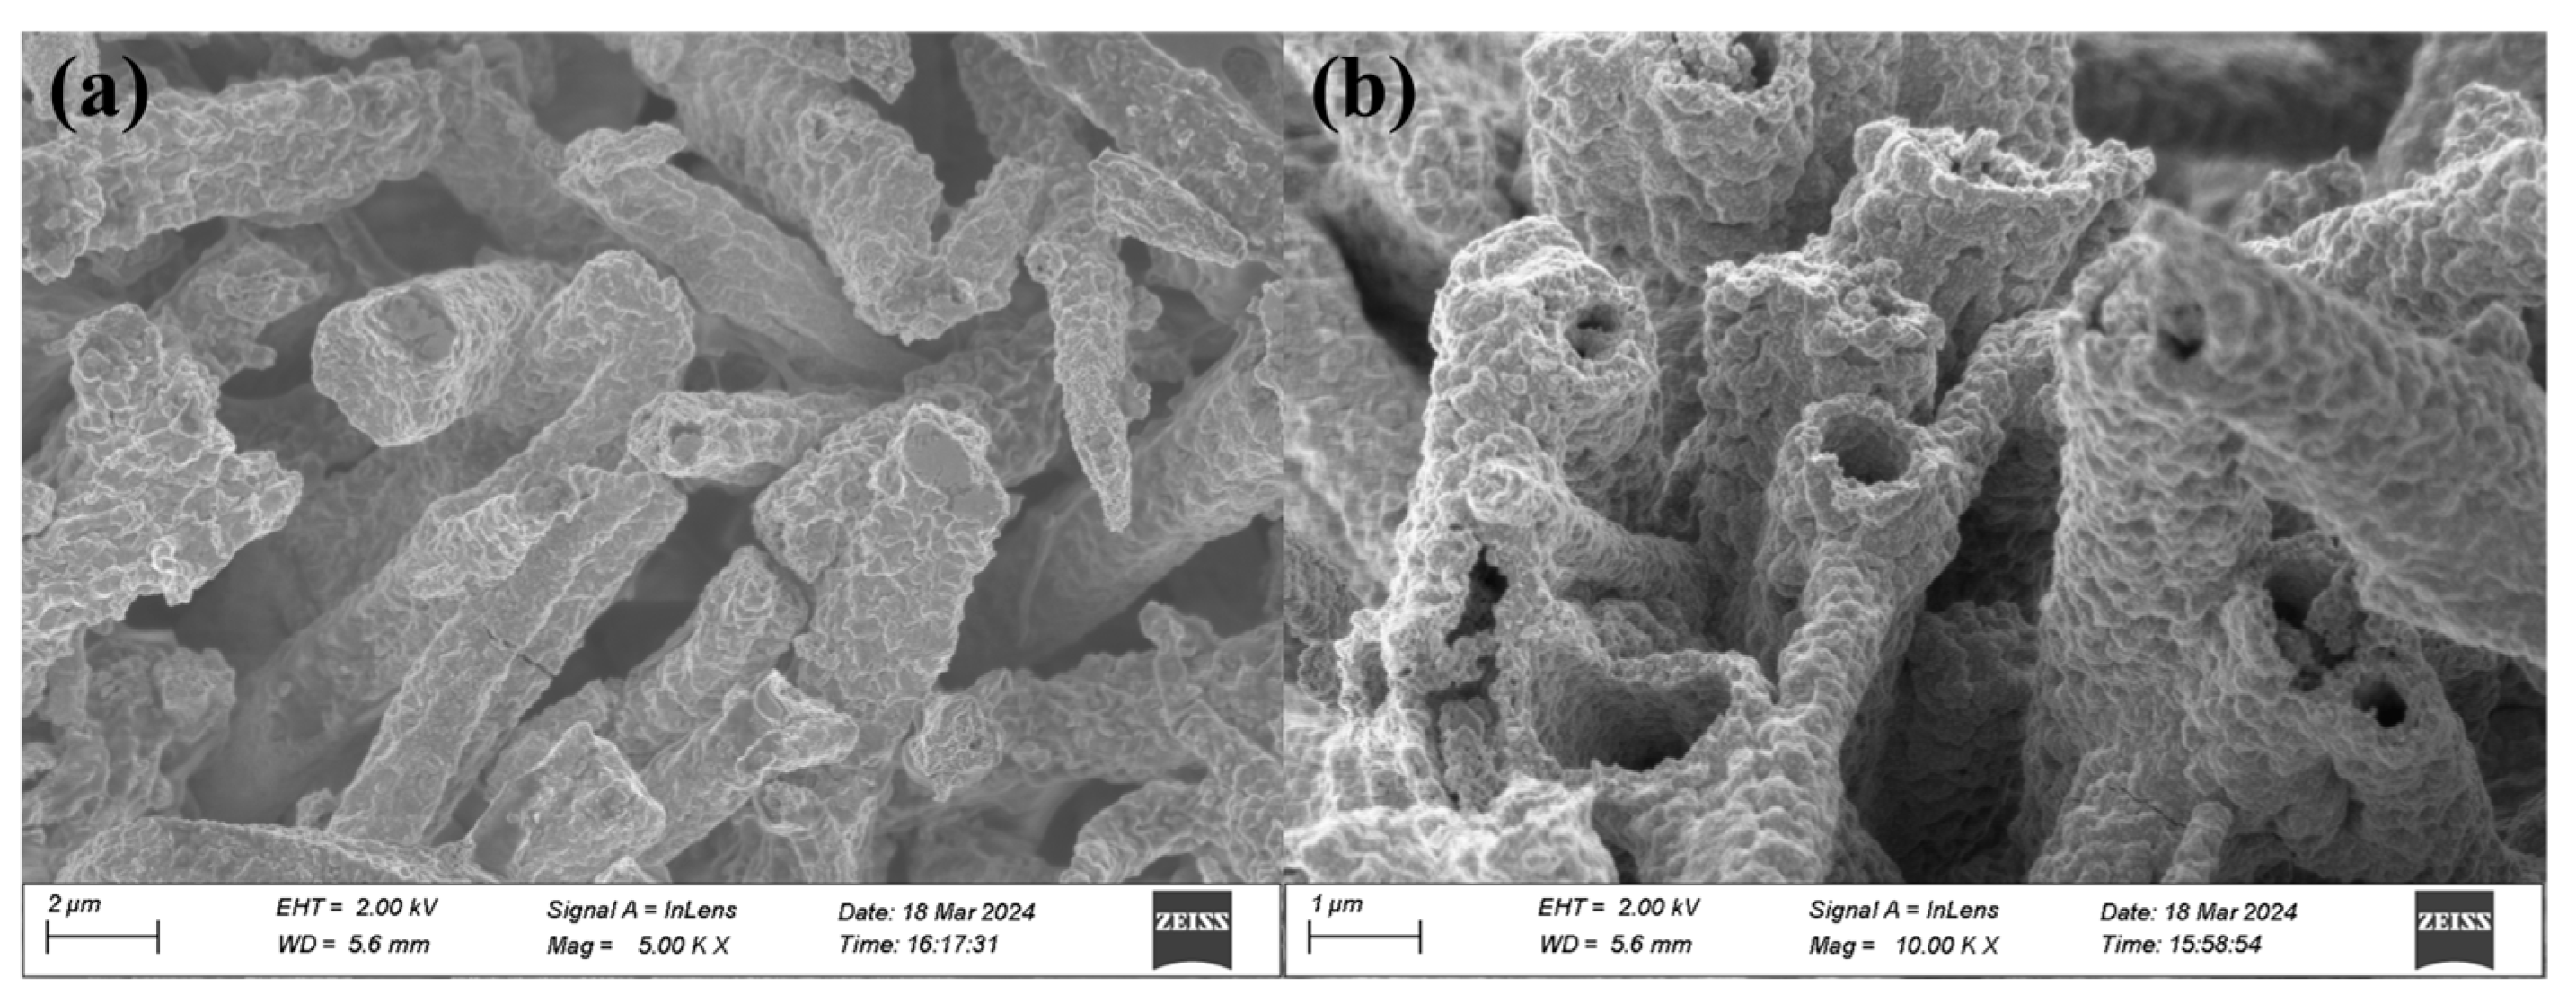
2.2. Morphological and Structural Characterization of Cu-MOF-74 and CuO-400

To investigate the morphological characteristics of Cu-MOF-74 and CuO-400, the morphology and structure of the catalysts were characterized using X-ray diffraction (XRD) and scanning electron microscopy (SEM). According to the XRD results, characteristic XRD peaks of Cu-MOF-74 were observed at 6.76° and 11.66°, which were in excellent agreement with the theoretical values of the MOF-74 structure [30]. Meanwhile, characteristic diffraction peaks of CuO-400 observed at 2θ values of 32.2°, 35.2°, 38.5°, 48.5°, 53.3°, 61.3°, and 65.9°matched well with the standard PDF card for CuO (PDF#44-0706) [31], corresponding to the (110), (002), (111), (202), (020), (113), and (311) planes of CuO (Figure 2).
From the SEM image, it can be observed that Cu-MOF-74 exhibits a rod-like structure with no apparent pores present (Figure 3a). After calcination, the resulting CuO-400 material maintains the rod-like structure of Cu-MOF-74, with CuO nanoparticles aggregated on the surface and the emergence of larger pores. The presence of these pores may provide more reaction sites during the electrocatalytic process, thereby enhancing the efficiency of electrocatalysis (Figure 3b).

2.3. Electrochemical Performance of CuO-400, CuO-n, and CuO-c

Through electrolysis and characterization analysis, it was found that the CuO material obtained from the derivatization strategy employed for Cu-MOF-74 indeed gave good catalytic results in the CO2RR reaction. However, how does its performance compare to CuO synthesized in other ways? To address this question, we selected CuO-n obtained using calcination, using Cu(NO3)2·3H2O as the precursor and commercial CuO-c for comparison.
Firstly, the electrochemical behavior of CuO-400, CuO-n, and CuO-c catalysts in the electrocatalytic reduction of carbon dioxide was tested using LSV. As shown in Figure 4a, compared to CuO-n and CuO-c samples, the CuO-400 catalyst exhibited the highest current density, indicating faster electron transfer kinetics and a better electrocatalytic performance in the CO2RR reaction. The LSV curves for the CuO-n and CuO-c samples under N2 and CO2 atmospheres are shown in Figure S2. Next, constant potential electrolysis on CuO-400, CuO-n, and CuO-c was conducted in a 0.2 M KI electrolyte solution within the potential of −1.15 V vs. RHE. The electrolytic products on CuO-n and CuO-c materials are similar to those on CuO-400, predominantly C2 products. However, the FEC2 for both CuO-n and CuO-c was significantly lower than that of CuO-400, with 35.9% and 35.5%, respectively (Figure 4b).

2.4. Morphological and Structural Characterization of CuO-400, CuO-n, and CuO-c

To determine whether there are morphological differences in CuO materials prepared using different methods, XRD, XPS, and SEM characterization were performed on CuO-400, CuO-n, and CuO-c. It can be seen from the figures that all three methods produced pure CuO substances without characteristic diffraction peaks of other materials (Figure S3a). XPS characterization (Figure S3b–d) reveals that the elemental Cu in CuO-400, CuO-n, and CuO-c are all in the Cu2+ oxidation state, consistent with the characterization results obtained from XRD. From the SEM images, it can be observed that CuO-n exhibits a rod-like aggregated morphology, and no obvious pores are observed (Figure 5a). CuO-c presents a block-like aggregated structure with a smooth surface and, similarly, no pores are observed (Figure 5b). In contrast, the excellent performance exhibited by the CuO-400 catalyst may be attributed to its retention of the rod-like structure of Cu-MOF-74 and its large pores (Figure 3b).
To obtain more specific pore size data, the pore size and BET surface area of CuO-400, CuO-n, and CuO-c were studied through N2 adsorption–desorption isotherms. As shown in Figure 5c, the CuO-400 sample exhibits an upwardly convex curve in the low P/P0 region, as well as a rapid increase in the isotherm at higher P/P0 due to the capillary condensation of the adsorbate. The occurrence of capillary condensation leads to hysteresis in this region, characteristic of Type IV isotherms. On the other hand, the CuO-n and CuO-c samples exhibit downwardly convex curves throughout the entire pressure range, without any inflection point in the low P/P0 region, indicating relatively weak interactions between the adsorbate and the adsorbent under these conditions [32]. The BET surface areas of the CuO-400, CuO-n, and CuO-c samples are 11.23, 5.04, and 9.06 m2 g−1, respectively, with average pore sizes of 4.2, 2.0, and 1.9 nm, and pore volumes of 0.025, 0.008, and 0.009 cm3 g−1, respectively (Figure 5c,d, Table S1). This indicates that CuO-400 obtained via calcination from the MOF precursor has a larger BET surface area, pore size, and pore volume compared to CuO-n and CuO-c, which have almost no pores, consistent with the analysis results from SEM images.
We also utilized double-layer capacitance testing to assess the electrochemical surface area of CuO-400, CuO-n, and CuO-c materials. The cyclic voltammetry curves for CuO-400, CuO-n, and CuO-c can be found in Figure S4. Linear fits of current versus scan rate were performed for the three materials, with the double-layer capacitance of CuO-400 (442 μF cm−2, Figure 5e) exceeding the values of CuO-n (225 μF cm−2) and CuO-c (232 μF cm−2). This suggests that CuO-400 possesses a larger electrochemical active surface area, which is advantageous for promoting CO2RR.
At the open circuit potential, impedance tests were conducted on CuO-400, CuO-n, and CuO-c to investigate the reaction kinetics of these materials. As shown in Figure S4d, it is apparent that CuO-400 exhibits a smaller diameter compared to CuO-n and CuO-c. This suggests that CuO-400 has a smaller charge transfer resistance and is more favorable for CO2 reduction reactions. Meanwhile, the Tafel slope of CuO-400 was found to be 191 mV dec−1 (Figure S4e), significantly lower than that of CuO-n (388 mV dec−1) and CuO-c (298 mV dec−1), indicating rapid CO2RR kinetics.

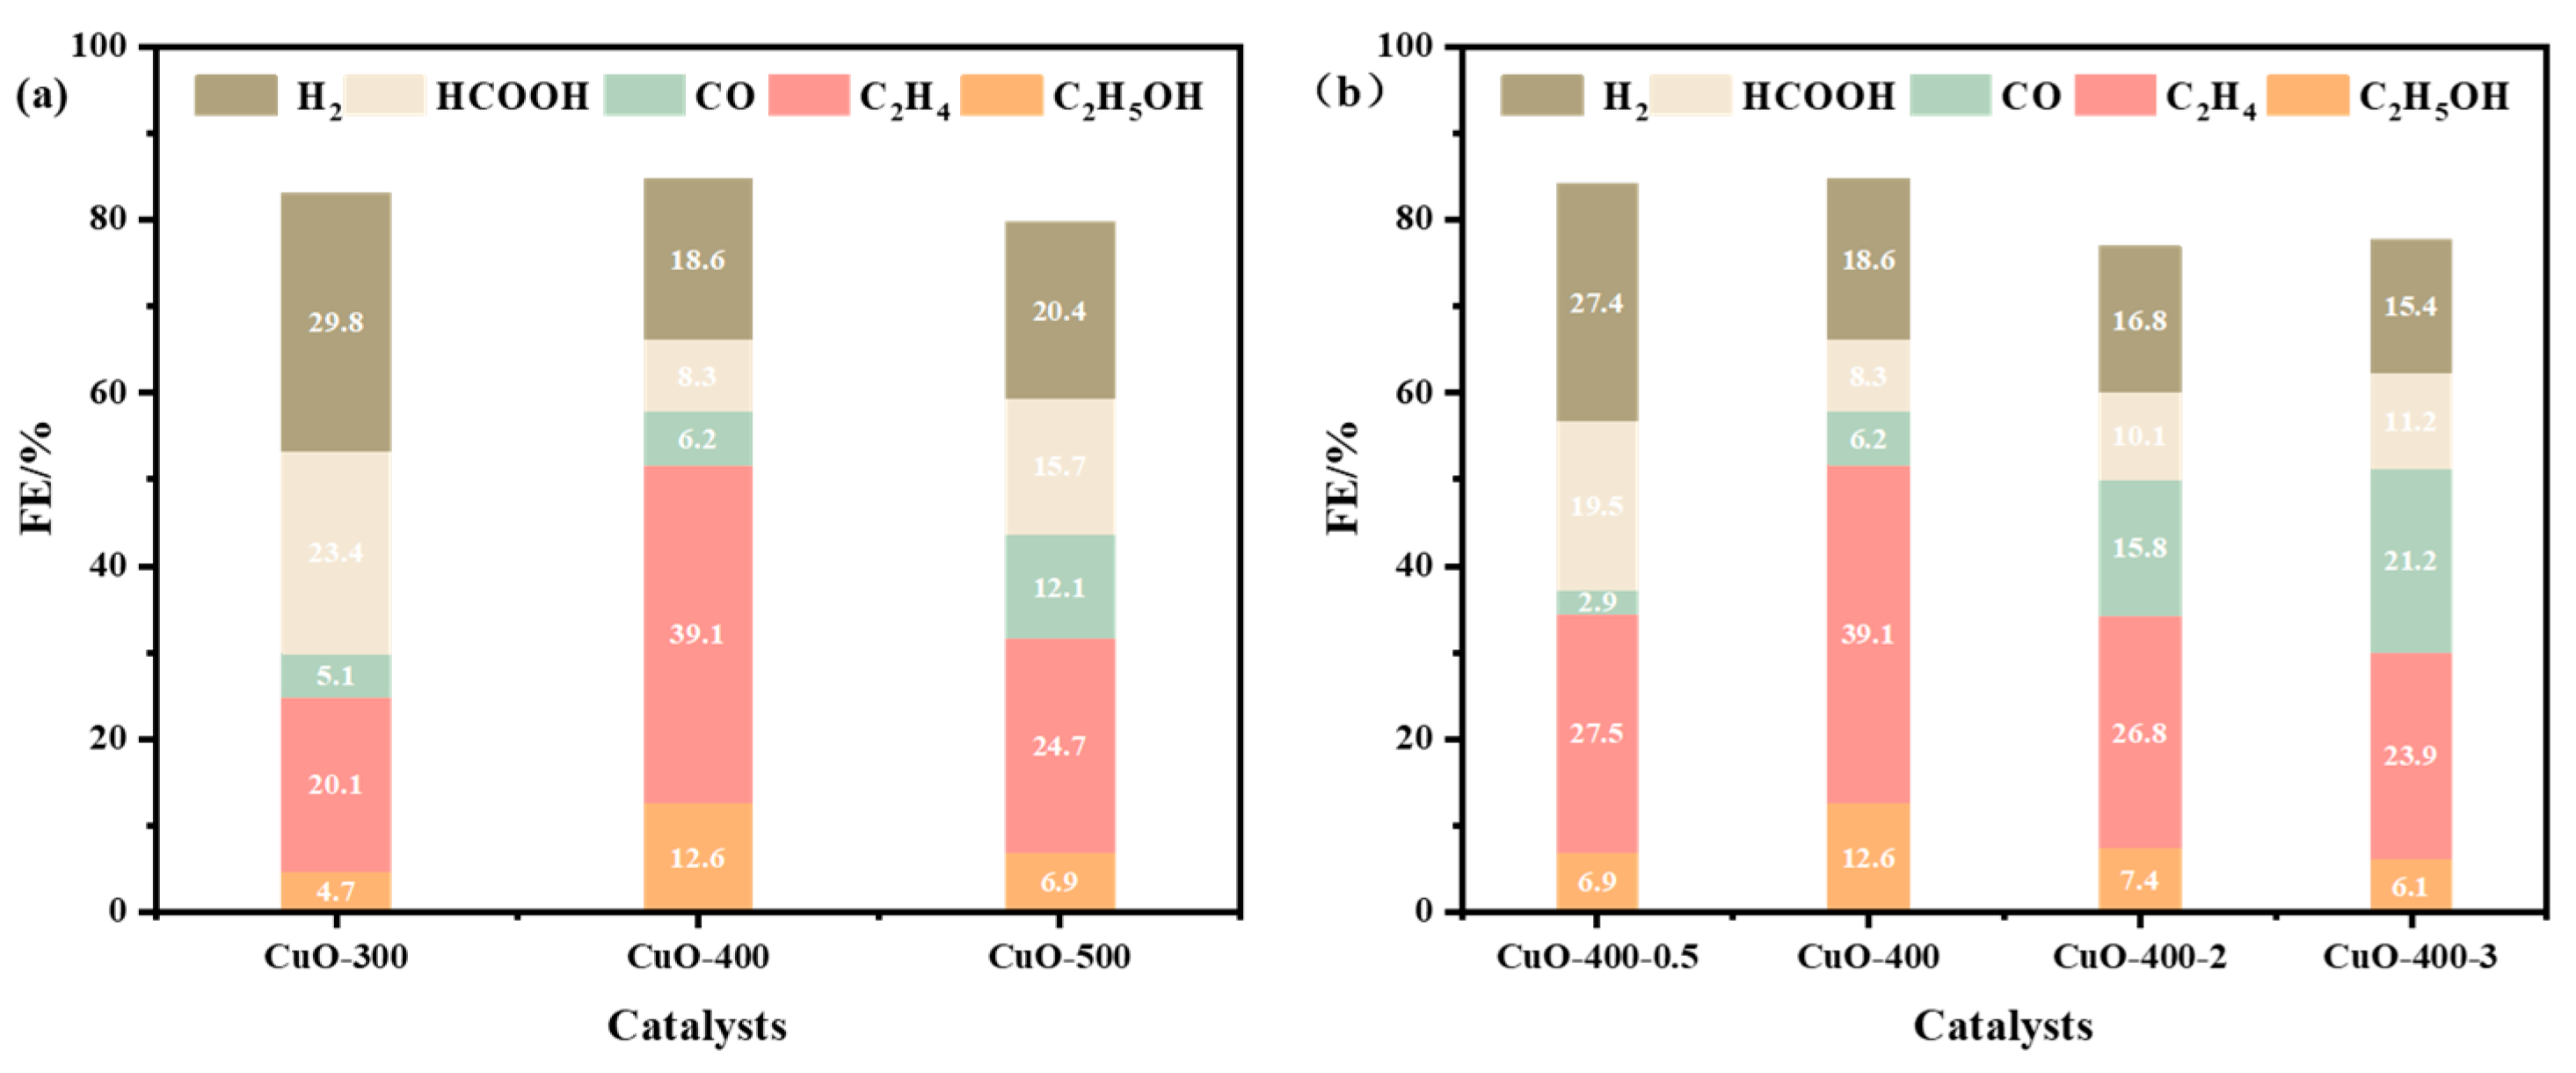
2.5. The Influence of Calcination Conditions on Material Properties

To investigate the effect of calcination temperature on catalyst performance, a series of catalysts with different calcination temperatures (300, 400, and 500 °C) was prepared. The corresponding materials were named CuO-300, CuO-400, and CuO-500, respectively. Electrolysis was conducted on CuO-300, CuO-400, and CuO-500 at a potential of −1.15 V vs. RHE. According to the electrolysis results, the primary products on both CuO-400 and CuO-500 are C2 products, with the highest FEC2 values of 51.7% and 31.6%, respectively (Figure 6a), whereas, on CuO-300, the major HCOOH and C2 products were produced with roughly equal FEs of 23.4% and 24.8%, respectively.
The electrolysis data suggest that CuO-400 obtained at a calcination temperature of 400 °C is the most favorable for CO2RR (Figure 6a). XRD and SEM characterization tests were conducted on the above materials. XRD analysis (Figure S5a) revealed that when calcined at 300 °C, the material exhibited characteristic diffraction peaks of Cu2O and CuO, indicating a mixture of both. However, upon increasing the calcination temperature to 400 °C and above, all transformed into CuO. A comparison of the SEM images of CuO-300, CuO-400, and CuO-500 revealed that at a calcination temperature of 300 °C, the material exhibited a rod-like structure similar to CuO-400, but no pores were observed on the surface (Figure S6a). When the calcination temperature reached 500 °C, the material structure began to collapse, showing a tendency to transform into CuO nanoparticles (Figure S6b). The BET surface areas of CuO-300, CuO-400, and CuO-500 samples are 11.86, 11.23, and 5.90 m2 g−1, respectively. The average pore diameters are 2.4, 4.2, and 2.7 nm, while the pore volumes are 0.026, 0.025, and 0.020 cm3 g−1, respectively (Figure S7a,b, Table S1). The surface area and pore volume of CuO-300 are similar to those of CuO-400, but CuO-400 has a larger pore diameter, while all three parameters of CuO-500 are lower than those of CuO-400. This may be what gives CuO-400 a better electrocatalytic performance.
To further investigate the effect of calcination time on catalyst performance, a series of catalysts with different calcination times (0.5, 1, 2, and 3 h) were prepared. The corresponding materials were named CuO-400-0.5, CuO-400, CuO-400-2, and CuO-400-3. Electrolysis was conducted on CuO-400-0.5, CuO-400, CuO-400-2, and CuO-400-3 at a potential of −1.15 V vs. RHE. According to the electrolysis results, the main product was C2, with maximum FEC2 values of 34.4%, 51.7%, 34.2%, and 30.0%, respectively (Figure 6b). Therefore, CuO-400 prepared with a 1 h calcination exhibited a significantly higher CO2 electrocatalytic performance in CO2 reduction compared to the other materials. XRD analysis revealed that the materials after calcination were all CuO (Figure S5b). SEM comparison between CuO-400-0.5, CuO-400, CuO-400-2, and CuO-400-3 showed that the material calcined for 0.5 h had a rod-like structure but no pores (Figure S6c); CuO nanoparticles calcined for 2 h had a rod-like structure (Figure S6d) and were smaller compared to CuO-400 calcinated for 1 h (Figure 3), and pores were observed on both the cross-section and surface for CuO-400; after 3 h of calcination, the rod-like structure began to collapse extensively (Figure S6e). The BET surface areas of the CuO-400-0.5, CuO-400, CuO-400-2, and CuO-400-3 samples are 8.05, 11.23, 5.38, and 8.89 m2 g−1, respectively. The average pore diameters are 1.7, 4.2, 2.4, and 1.1 nm, while the pore volumes are 0.024, 0.025, 0.018, and 0.023 cm3 g−1, respectively (Figure S7c,d, Table S1). CuO-400 exhibits the largest surface area, pore diameter, and pore volume among the four materials, which may contribute to its superior electrocatalytic performance.
Based on the electrolysis results and characterization analysis, we ultimately determined that calcination at 400 °C for 1 h in an air atmosphere was the optimal calcination condition for Cu-MOF-74. Under this calcination condition, Cu-MOF-74 could maintain its rod-like structure with abundant pores, resulting in the best FEC2.

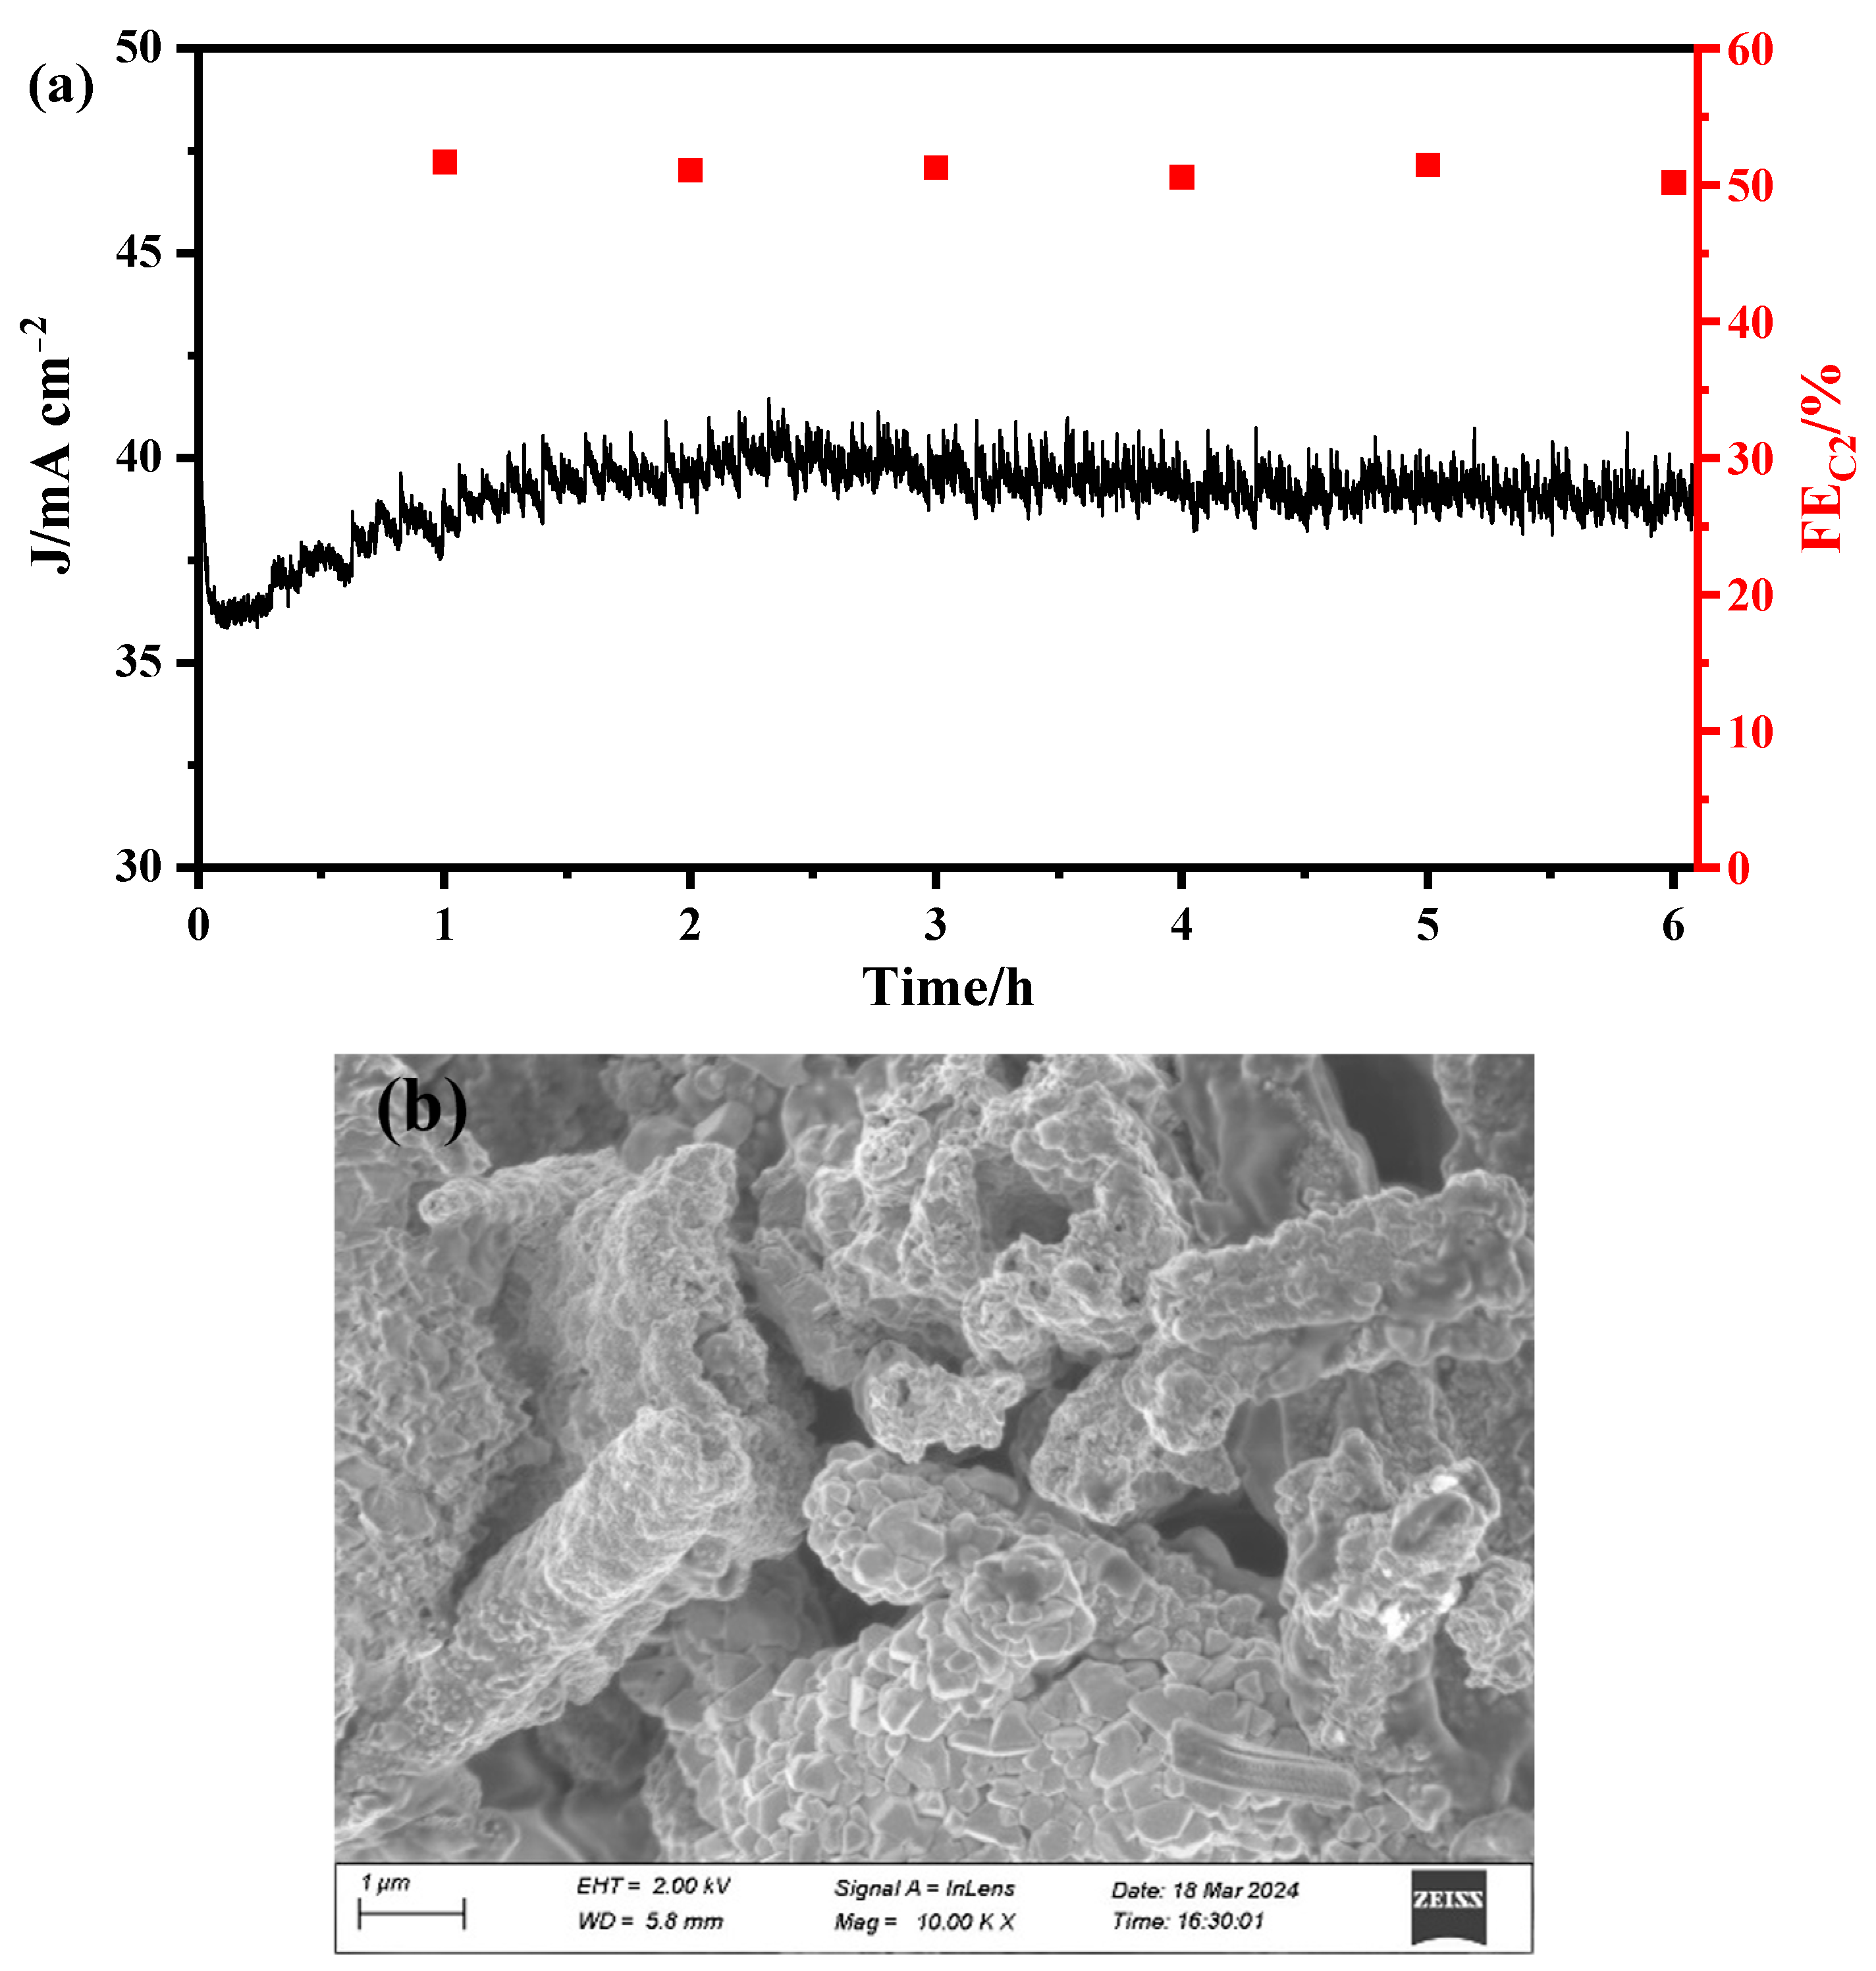
2.6. Electrode Stability in CO2 Electroreduction

To assess the stability of the CuO-400 electrocatalytic material, we subjected the CuO-400 material to prolonged electrolysis and performed SEM characterization. The corresponding total current density–time curve (i-t curve) is shown below. From Figure 7a, it can be observed that during prolonged electrolysis, the current density remains relatively stable, at approximately 39.7 mA cm−2. Within 6 h of electrolysis, the Faradaic efficiency of the C2 product remains at around 51%, indicating that the CuO-400 material exhibits an efficient and stable electrocatalytic CO2 reduction performance during this period.
From the SEM image (Figure 7b), it can be seen that the material maintains its rod-like structure without collapsing even after electrolysis, indicating that the CuO-400 material possesses an efficient and stable electrocatalytic CO2 reduction performance. As a comparison, SEM characterization was also conducted on CuO-n and CuO-c after electrolysis. The results show that CuO-n transformed entirely from its original solid nanorod-like structure to nano-spherical particles after electrolysis (Figure S8a). Although CuO-c remains as solid block-like particles after electrolysis, nano-spherical particles are also observed on its surface (Figure S8b). SEM analysis results indicate that the stability of CuO-n and CuO-c is comparably poorer than that of the CuO-400 material.

3. Materials and Methods

3.1. Materials

Copper nitrate trihydrate (Cu(NO3)2·3H2O, >99%) and potassium iodide (KI, 95%) were purchased from Sinopharm (Shanghai, China). Cupric oxide (CuO, 98%) and 2,5-dihydroxyterephthalic acid (H4DOBDC, 99%) were obtained from Innochem (Atlanta, GA, USA). Nafion solution (5 wt%) was supplied by Sigma-Aldrich Chemical Reagent Co., Ltd. (St. Louis, MO, USA). All chemicals were used without further purification.

3.2. Catalyst Synthesis and Electrode Preparation

3.2.1. Synthesis of Cu-MOF-74

Using the classical synthetic method [29], 2.2 g of 2,5-dihydroxyterephthalic acid (H4DOBDC) and 5.9 g of Cu(NO3)2·3H2O were dissolved in 238 mL of DMF and 12 mL of isopropanol. After stirring until these were dissolved, the mixed solution was transferred to a 250 mL conical flask and kept in an 80 °C oven for 18 h. After synthesis, the resulting solid–liquid mixture was cooled to room temperature, washed and filtered with DMF three times, then soaked in anhydrous methanol solution; the solution was changed every 24 h and this was repeated 4 times. The reddish-brown powder was then placed in a vacuum drying oven and was dried at 60 °C for 12 h.

3.2.2. Synthesis of CuO-T with Different Calcination Temperatures

The Cu-MOF-74 was placed in an air atmosphere; was heated at a rate of 1 °C/min to temperatures of 300, 400, and 500 °C, respectively; and was held for 1 h at each temperature. The resulting materials were named CuO-300, CuO-400, and CuO-500, respectively.

3.2.3. Synthesis of CuO-400-X with Different Calcination Times

The Cu-MOF-74 was placed in an air atmosphere and heated at a rate of 1 °C/min and was then maintained at 400 °C for 0.5, 1, 2, and 3 h, respectively. The resulting materials were named CuO-400-0.5, CuO-400, CuO-400-2, and CuO-400-3, respectively.

3.2.4. Synthesis of CuO-n

For comparison, CuO-n was obtained by grinding Cu(NO3)2·3H2O and placing it under an air atmosphere and keeping it at 400 °C for one hour at a heating rate of 1 °C/min.

3.2.5. Electrode Preparation

A total of 2 mg of catalyst was weighed and added to 20 µL of Nafion 117 solution and 100 µL of deionized water and was sonicated for 20 min to make a homogeneous mixture of the materials. The mixture was then uniformly applied to a 1 cm × 1 cm carbon paper and dried to obtain a working electrode. The method for preparing the working electrode described here is applicable to all materials prepared in this study. The prepared working electrode was utilized for linear sweep voltammetry, electrochemical surface area testing of the electrode, and constant potential electrolysis.

3.3. Material Characterization

The morphology and crystal structure of the samples were characterized by scanning electron microscopy (SEM) using a ZEISS Gemini 450 (Jena, Germany) operating at 2 kV and 100 mA. The crystal structure of the samples was characterized using X-ray diffraction (XRD), using an Ultima IV instrument (Rigaku, Akishima, Japan) with a Cu-Kα (λ = 1.5406 Å) X-ray source. Nitrogen adsorption–desorption isotherms were measured on a BELSORP-MAX instrument (BEL, Toyonaka, Japan). X-ray photoelectron spectroscopy (XPS) was performed using an AXIS Ultra DLD instrument (Shimadzu, Kyoto, Japan), with materials irradiated using an Al-Kα X-ray beam; the binding energy of C 1s at 284.8 eV was used as the standard.

3.4. Electrochemical Analysis

All electrochemical measurements were carried out using an electrochemical workstation (CHI660E, Shanghai, China). An H-type cell consisting of a working electrode, a platinum wire counter electrode, and a saturated calomel reference electrode was used. A 0.2 M potassium iodide (KI) electrolyte was chosen and carbon dioxide was introduced into the cell at a flow rate of 15 mL/min. Prior to each experiment, the working electrode was freshly prepared and linear sweep voltammetry (LSV) curves were used to evaluate the electrocatalytic performance of the prepared electrode. The measured potential (V vs. SCE) was converted to the RHE reference scale using the equation ERHE = ESCE + 0.0591 × pH + 0.241. The electrochemical active surface area was tested using the double-layer capacitance (Cdl) method, employing the same electrode system as in the Linear Sweep Voltammetry (LSV) electrode system. Prior to testing, the electrolysis cell was purged with N2 for 0.5 h. Different scan rates were applied from 0.83 V vs. RHE to 0.63 V vs. RHE to obtain cyclic voltammograms. The calculation method for Cdl is given using the following formula: Cdl = Ic/ᴠ, where Ic represents the working electrode current at a certain potential, and ᴠ denotes the scan rate.
Gaseous products such as C2H4, CO, and H2 were analyzed using a gas chromatograph (Agilent Technologies 7890A, Santa Clara, CA, USA) equipped with a thermal conductivity detector (TCD) and a flame ionization detector (FID). C2H4 was detected via FID (Figure S9), while H2 and CO were detected via TCD (Figures S10 and S11). Liquid products were collected and analyzed using a GC2014 gas chromatograph and 1H NMR technique, where the GC2014 gas chromatograph with HS-9A headspace injection was used to detect CH3OH and C2H5OH (Figure S12), and the 1H NMR technique was used to detect HCOOH (Figure S13).
The Faradaic efficiency for specific products was calculated using the following formula: FE = Z × n × F/Q, where n represents the amount of substance, Z represents the number of electrons transferred for product formation, F is the Faraday constant (96,485 C/mol), and Q represents the total charge passed during electrolysis. The partial current density for a specific product is equal to the total current density multiplied by the Faradaic efficiency of that product.

4. Conclusions

In summary, we propose a derivative strategy for Cu-MOF-74 and successfully synthesized a CuO-400 electrocatalyst by controlling the calcination temperature and time. This catalyst can be converted into CuO, while maintaining the rod-like porous structure of Cu-MOF-74 during calcination; the optimal calcination conditions are 400 °C for 1 h. When applied to CO2 electrochemical reduction reactions, CuO-400 exhibited a high electrocatalytic performance, with C2 as the main product and a maximum Faradaic efficiency for C2 of 51.7%. Compared to the uncalcined Cu-MOF-74, CuO-400 showed reduced hydrogen evolution ability, and its catalytic performance towards CO2RR surpassed those of CuO-n and CuO-c catalysts. Additionally, CuO-400 exhibited a higher stability compared to CuO-n and CuO-c, without significant collapse before and after electrolysis. This work presents a simple strategy to utilize morphology effects for improving the selectivity of copper-based catalysts in converting CO2 into C2 products, which can be widely applied to prepare other Cu-MOF-derived catalysts for highly selective CO2 reduction.

Supplementary Materials

The following supporting information can be downloaded at: https://www.mdpi.com/article/10.3390/catal14060361/s1, Figure S1: JC2 over CuO-400 and Cu-MOF-74 electrocatalysts at various applied potentials in CO2-saturated 0.2 M KI; Figure S2: LSV curves recorded at a scan rate of 50 mV s−1 in 0.2 M KI of (a) CuO-n and (b) CuO-C (N2, black line; CO2, red line); Figure S3: (a) XRD pattens of CuO-400, CuO-n, and CuO-c; (b) XPS spectra Cu 2p of CuO-400; (c) XPS spectra Cu 2p of CuO-n and (d) XPS spectra Cu 2p of CuO-c. Figure S4: Cyclic voltammetry curves of CuO-400 (a), CuO-n (b), and CuO-C (c); Nyquist plots (d) and Tafel plots (e) of CuO-400, CuO-n, and CuO-c; Figure S5: (a) XRD pattens of CuO-300, CuO-400, and CuO-500; (b) XRD pattens of CuO-400-0.5, CuO-400, CuO-400-2, and CuO-400-3; Figure S6: SEM image of CuO-300 (a), CuO-500 (b), CuO-400-0.5 (c), CuO-400-2 (d), and CuO-400-3 (e); Figure S7: (a) N2 adsorption–desorption isotherms of CuO-300, CuO-400, and CuO-500; (b) pore size distribution of CuO-300, CuO-400, and CuO-500; (c) N2 adsorption–desorption isotherms of CuO-400-0.5, CuO-400, CuO-400-2, and CuO-400-3; (d) pore size distribution of CuO-400-0.5, CuO-400, CuO-400-2, and CuO-400-3. Figure S8: SEM images of the CuO-n after electrolysis (a) and CuO-c after electrolysis (b); Table S1: Parameters of different catalysts; Figure S9: FID signals of C2H4; Figure S10: TCD signal of H2; Figure S11: TCD signal of CO; Figure S12: FID signals of CH3OH and C2H5OH; Figure S13: 1H NMR signal of HCOOH.

Author Contributions

Conceptualization, H.L. and Y.-L.W.; validation, H.L. and Y.-L.W.; formal analysis, H.L. and Y.-L.W.; investigation, L.-B.C. and M.-H.L.; writing—original draft preparation, H.L.; writing—review and editing, J.-X.L. and H.W.; visualization, L.-B.C. and M.-H.L.; supervision, J.-X.L. and H.W.; funding acquisition, J.-X.L. and H.W. All authors have read and agreed to the published version of the manuscript.

Funding

This research received funding from the National Key R&D Program of China (2020YFA0710200), the National Natural Science Foundation of China (22072046), and the Research Funds of Happiness Flower ECNU (2020ST2203).

Data Availability Statement

Data are contained within the article and the Supplementary Materials.

Conflicts of Interest

The authors declare no conflicts of interest.

References

  1. Friedlingstein, P.; O’Sullivan, M.; Jones, M.W.; Andrew, R.M.; Bakker, D.C.E.; Hauck, J.; Landschützer, P.; Le Quéré, C.; Luijkx, I.T.; Peters, G.P.; et al. Global Carbon Budget 2023. Earth Syst. Sci. Data 2023, 15, 5301–5369. [Google Scholar] [CrossRef]
  2. Seh, Z.W.; Kibsgaard, J.; Dickens, C.F.; Chorkendorff, I.; Nørskov, J.K.; Jaramillo, T.F. Combining theory and experiment in electrocatalysis: Insights into materials design. Science 2017, 355, eaad4998. [Google Scholar] [CrossRef]
  3. Liang, J.; Chen, D.; Yao, X.; Zhang, K.; Qu, F.; Qin, L.; Huang, Y.; Li, J. Recent Progress and Development in Inorganic Halide Perovskite Quantum Dots for Photoelectrochemical Applications. Small 2019, 16, 1903398. [Google Scholar] [CrossRef] [PubMed]
  4. Hori, Y.; Kikuchi, K.; Suzuki, S. Production of CO and CH4 in electrochemical reduction of CO2 at metal electrodes in aqueous hydrogencarbonate solution. Chem. Lett. 1985, 14, 1695–1698. [Google Scholar] [CrossRef]
  5. Chou, T.-C.; Chang, C.-C.; Yu, H.-L.; Yu, W.-Y.; Dong, C.-L.; Velasco-Vélez, J.-J.; Chuang, C.-H.; Chen, L.-C.; Lee, J.-F.; Chen, J.-M.; et al. Controlling the Oxidation State of the Cu Electrode and Reaction Intermediates for Electrochemical CO2 Reduction to Ethylene. J. Am. Chem. Soc. 2020, 142, 2857–2867. [Google Scholar] [CrossRef]
  6. Hoang, T.T.H.; Ma, S.; Gold, J.I.; Kenis, P.J.A.; Gewirth, A.A. Nanoporous Copper Films by Additive-Controlled Electrodeposition: CO2 Reduction Catalysis. ACS Catal. 2017, 7, 3313–3321. [Google Scholar] [CrossRef]
  7. Vasileff, A.; Zhi, X.; Xu, C.; Ge, L.; Jiao, Y.; Zheng, Y.; Qiao, S.-Z. Selectivity Control for Electrochemical CO2 Reduction by Charge Redistribution on the Surface of Copper Alloys. ACS Catal. 2019, 9, 9411–9417. [Google Scholar] [CrossRef]
  8. Morimoto, M.; Takatsuji, Y.; Iikubo, S.; Kawano, S.; Sakakura, T.; Haruyama, T. Experimental and Theoretical Elucidation of Electrochemical CO2 Reduction on an Electrodeposited Cu3Sn Alloy. J. Phys. Chem. C 2019, 123, 3004–3010. [Google Scholar] [CrossRef]
  9. Jia, F.; Yu, X.; Zhang, L. Enhanced selectivity for the electrochemical reduction of CO2 to alcohols in aqueous solution with nanostructured Cu–Au alloy as catalyst. J. Power Sources 2014, 252, 85–89. [Google Scholar] [CrossRef]
  10. Mun, Y.; Lee, S.; Cho, A.; Kim, S.; Han, J.W.; Lee, J. Cu-Pd alloy nanoparticles as highly selective catalysts for efficient electrochemical reduction of CO2 to CO. Appl. Catal. B Environ. 2019, 246, 82–88. [Google Scholar] [CrossRef]
  11. Feng, Y.; Li, Z.; Liu, H.; Dong, C.; Wang, J.; Kulinich, S.A.; Du, X. Laser-Prepared CuZn Alloy Catalyst for Selective Electrochemical Reduction of CO2 to Ethylene. Langmuir 2018, 34, 13544–13549. [Google Scholar] [CrossRef] [PubMed]
  12. Choi, H.; Lee, D.-K.; Han, M.-K.; Janani, G.; Surendran, S.; Kim, J.H.; Kim, J.K.; Cho, H.; Sim, U. Review—Non-Noble Metal-Based Single-Atom Catalysts for Efficient Electrochemical CO2 Reduction Reaction. J. Electrochem. Soc. 2020, 167, 164503. [Google Scholar] [CrossRef]
  13. Karapinar, D.; Huan, N.T.; Ranjbar Sahraie, N.; Li, J.; Wakerley, D.; Touati, N.; Zanna, S.; Taverna, D.; Galvão Tizei, L.H.; Zitolo, A.; et al. Electroreduction of CO2 on Single-Site Copper-Nitrogen-Doped Carbon Material: Selective Formation of Ethanol and Reversible Restructuration of the Metal Sites. Angew. Chem. Int. Ed. 2019, 58, 15098–15103. [Google Scholar] [CrossRef] [PubMed]
  14. Back, S.; Lim, J.; Kim, N.-Y.; Kim, Y.-H.; Jung, Y. Single-atom catalysts for CO2 electroreduction with significant activity and selectivity improvements. Chem. Sci. 2017, 8, 1090–1096. [Google Scholar] [CrossRef]
  15. Qin, T.; Qian, Y.; Zhang, F.; Lin, B.-L. Cloride-derived copper electrode for efficient electrochemical reduction of CO2 to ethylene. Chin. Chem. Lett. 2019, 30, 314–318. [Google Scholar] [CrossRef]
  16. Wang, X.; Wang, Z.; García de Arquer, F.P.; Dinh, C.-T.; Ozden, A.; Li, Y.C.; Nam, D.-H.; Li, J.; Liu, Y.-S.; Wicks, J.; et al. Efficient electrically powered CO2-to-ethanol via suppression of deoxygenation. Nat. Energy 2020, 5, 478–486. [Google Scholar] [CrossRef]
  17. Majidi, L.; Ahmadiparidari, A.; Shan, N.; Misal, S.N.; Kumar, K.; Huang, Z.; Rastegar, S.; Hemmat, Z.; Zou, X.; Zapol, P.; et al. 2D Copper Tetrahydroxyquinone Conductive Metal–Organic Framework for Selective CO2 Electrocatalysis at Low Overpotentials. Adv. Mater. 2021, 33, 2004393. [Google Scholar] [CrossRef]
  18. Zhu, Q.; Yang, D.; Liu, H.; Sun, X.; Chen, C.; Bi, J.; Liu, J.; Wu, H.; Han, B. Hollow Metal–Organic-Framework-Mediated In Situ Architecture of Copper Dendrites for Enhanced CO2 Electroreduction. Angew. Chem. Int. Ed. 2020, 59, 8896–8901. [Google Scholar] [CrossRef] [PubMed]
  19. Tan, X.; Yu, C.; Zhao, C.; Huang, H.; Yao, X.; Han, X.; Guo, W.; Cui, S.; Huang, H.; Qiu, J. Restructuring of Cu2O to Cu2O@Cu-Metal–Organic Frameworks for Selective Electrochemical Reduction of CO2. ACS Appl. Mater. Interfaces 2019, 11, 9904–9910. [Google Scholar] [CrossRef]
  20. Zhao, K.; Liu, Y.; Quan, X.; Chen, S.; Yu, H. CO2 Electroreduction at Low Overpotential on Oxide-Derived Cu/Carbons Fabricated from Metal Organic Framework. ACS Appl. Mater. Interfaces 2017, 9, 5302–5311. [Google Scholar] [CrossRef]
  21. Li, C.; Ji, Y.; Wang, Y.; Liu, C.; Chen, Z.; Tang, J.; Hong, Y.; Li, X.; Zheng, T.; Jiang, Q.; et al. Applications of Metal–Organic Frameworks and Their Derivatives in Electrochemical CO2 Reduction. Nano-Micro Lett. 2023, 15, 113. [Google Scholar] [CrossRef] [PubMed]
  22. Hai, G.; Xue, X.; Feng, S.; Ma, Y.; Huang, X. High-Throughput Computational Screening of Metal–Organic Frameworks as High-Performance Electrocatalysts for CO2RR. ACS Catal. 2022, 12, 15271–15281. [Google Scholar] [CrossRef]
  23. Qu, G.; Wei, K.; Pan, K.; Zhou, J. Metal-Organic Frameworks (MOFs) and Their Derivatives for Electrocatalytic Carbon Dioxide (CO2) Reduction to Value-added Chemicals: Recent Advances and New Challenges. Chem.—Asian J. 2023, 18, e202300291. [Google Scholar] [CrossRef] [PubMed]
  24. Nwosu, U.; Siahrostami, S. Copper-based metal–organic frameworks for CO2reduction: Selectivity trends, design paradigms, and perspectives. Catal. Sci. Technol. 2023, 13, 3740–3761. [Google Scholar] [CrossRef]
  25. Hou, M.; Shi, Y.x.; Li, J.j.; Gao, Z.; Zhang, Z. Cu-Based Organic-Inorganic Composite Materials for Electrochemical CO2Reduction. Chem.—Asian J. 2022, 17, e202200624. [Google Scholar] [CrossRef] [PubMed]
  26. Yang, Z.; Chen, Y.; Wen, X.; Guo, X.; Wei, R.; Gao, L.; Pan, X.; Zhang, J.; Xiao, G. Modulable Cu(0)/Cu(I)/Cu(II) sites of Cu/C catalysts derived from MOF for highly selective CO2 electroreduction to hydrocarbons. Vacuum 2023, 215, 112231. [Google Scholar] [CrossRef]
  27. Nam, D.-H.; Bushuyev, O.S.; Li, J.; De Luna, P.; Seifitokaldani, A.; Dinh, C.-T.; García de Arquer, F.P.; Wang, Y.; Liang, Z.; Proppe, A.H.; et al. Metal–Organic Frameworks Mediate Cu Coordination for Selective CO2 Electroreduction. J. Am. Chem. Soc. 2018, 140, 11378–11386. [Google Scholar] [CrossRef] [PubMed]
  28. Haldoupis, E.; Borycz, J.; Shi, H.; Vogiatzis, K.D.; Bai, P.; Queen, W.L.; Gagliardi, L.; Siepmann, J.I. Ab Initio Derived Force Fields for Predicting CO2 Adsorption and Accessibility of Metal Sites in the Metal–Organic Frameworks M-MOF-74 (M = Mn, Co, Ni, Cu). J. Phys. Chem. C 2015, 119, 16058–16071. [Google Scholar] [CrossRef]
  29. Calleja, G.; Sanz, R.; Orcajo, G.; Briones, D.; Leo, P.; Martínez, F. Copper-based MOF-74 material as effective acid catalyst in Friedel–Crafts acylation of anisole. Catal. Today 2014, 227, 130–137. [Google Scholar] [CrossRef]
  30. Andrew, R.; Millward, O.M.Y. Metal-Organic Frameworks with Exceptionally High Capacity for Storage ofCarbon Dioxide at Room Temperature. J. Am. Chem. Soc. 2005, 127, 17998–17999. [Google Scholar]
  31. Lu, Y.; Li, S.; Li, H.; Guo, C.; Yang, L. Facile fabrication of well-dispersed CuxO nanoneedle on porous carbonized nano sponge and its promising application in the thermal decomposition of ammonium perchlorate. Powder Technol. 2021, 391, 206–213. [Google Scholar] [CrossRef]
  32. Patra, A.K.; Das, S.K.; Bhaumik, A. Self-assembled mesoporous TiO2 spherical nanoparticles by a new templating pathway and its enhanced photoconductivity in the presence of an organic dye. J. Mater. Chem. 2011, 21, 3925–3930. [Google Scholar] [CrossRef]
Figure 1. LSV curves of for Cu-MOF-74 (a) and CuO-400 (b) in 0.2 M KI at a scan rate of 50 mV s−1 (N2, black line; CO2, red line); FE of CO2RR on Cu-MOF-74 (c) and CuO-400 (d) electrocatalysts at various applied potentials in CO2-saturated 0.2 M KI.
Catalysts 14 00361 g001
Figure 2. XRD pattens of Cu-MOF-74 and CuO-400.
Catalysts 14 00361 g002
Figure 3. SEM images of Cu-MOF-74 (a) and CuO-400 (b).
Catalysts 14 00361 g003
Figure 4. (a) LSV curves of CuO-400, CuO-n, and CuO-c electrocatalysts; (b) FE of CO2RR in 0.2 M KI on CuO-400, CuO-n, and CuO-c at –1.15 V vs. RHE.
Catalysts 14 00361 g004
Figure 5. SEM images of CuO-n (a) and CuO-c (b); (c) N2 adsorption–desorption isotherms of CuO-400, CuO-n, and CuO-c; (d) pore size distribution of CuO-400, CuO-n, and CuO-c; (e) the liner relationship between the current densities and scan rate for CuO-400, CuO-n, and CuO-c.
Catalysts 14 00361 g005
Figure 6. (a) FEC2 in 0.2 M KI on CuO-300, CuO-400, and CuO-500 at −1.15 V vs. RHE; (b) FEC2 in 0.2 M KI on CuO-400-0.5, CuO-400, CuO-400-2, and CuO-400-3 at −1.15 V vs. RHE.
Catalysts 14 00361 g006
Figure 7. (a) Long-term stability of CuO-400; (b) SEM image of CuO-400 after electrolysis.
Catalysts 14 00361 g007
Disclaimer/Publisher’s Note: The statements, opinions and data contained in all publications are solely those of the individual author(s) and contributor(s) and not of MDPI and/or the editor(s). MDPI and/or the editor(s) disclaim responsibility for any injury to people or property resulting from any ideas, methods, instructions or products referred to in the content.

