Article

Green Synthesis of Photocatalytically Active ZnO Nanoparticles Using Chia Seed Extract and Mechanistic Elucidation of the Photodegradation of Diclofenac and p-Nitrophenol

1
Catalysis and Materials for Environment and Processes Research Laboratory (LR19ES08), Faculty of Sciences of Gabes, University of Gabes, Gabes 6072, Tunisia
2
Heterogeneous Photocatalysis, Leibniz Institute for Catalysis (LIKAT), 18059 Rostock, Germany
3
Industrial Chemistry and Heterogeneous Catalysis, Technical University of München (TUM), 85748 Garching, Germany
*
Authors to whom correspondence should be addressed.
Catalysts 2025, 15(1), 4; https://doi.org/10.3390/catal15010004
Submission received: 1 December 2024 / Revised: 18 December 2024 / Accepted: 20 December 2024 / Published: 24 December 2024
(This article belongs to the Special Issue Advances in Photocatalytic Degradation)

Abstract

:
Zinc oxide nanoparticles (ZnO NPs) were synthesized using a simple and eco-friendly precipitation method, employing a capping agent derived from chia seeds (Salvia hispanica). X-ray diffraction (XRD) analysis confirmed the formation of ZnO with a hexagonal crystal structure and an average crystallite size of less than 30 nm. Scanning electron microscopy (SEM) revealed distinct quasi-spherical and nanorod-like morphologies, while energy-dispersive X-ray spectroscopy (EDX) verified the presence of zinc and oxygen. Diffuse reflectance spectroscopy (DRS) indicated significant activity in the UV region, with the nanoparticles exhibiting a band gap of 3.25 eV. The photocatalytic efficiency of the synthesized ZnO NPs was evaluated through their ability to degrade diclofenac sodium (DCF) and para-nitrophenol (4-nitrophenol, PNP) under UV-LED irradiation, achieving pollutant removal rates exceeding 98%. The degradation mechanism is clarified by a detailed characterization of the reaction intermediates. These findings highlight the potential of ZnO NPs synthesized from chia seed extract for effective environmental remediation of pharmaceutical and organic pollutants.

1. Introduction

Nanotechnology has profoundly revolutionized the fabrication of nanoscale materials. By unlocking the ability to engineer materials at the atomic level, this groundbreaking technology has been driving significant advances in various fields, mainly medicine, energy, and environment [1]. The global demand for nanomaterials is exceptionally high, reaching 1.6 million tons per year, which underscores their pivotal role in the future of science [2].
Conventional methods for synthesizing nanomaterials are hindered by several limitations, including the reliance on hazardous chemicals, significant energy consumption, and high costs. These drawbacks not only pose environmental and health risks but also make the processes less sustainable and economically viable, restricting their broader applications [3]. Consequently, pushing towards more efficient, cost-effective, and greener alternatives by embracing biosynthesis aims to alleviate the environmental challenges [4,5].
Furthermore, the synthesis of nanomaterials using natural surfactants represents a sustainable and environmentally friendly approach for producing biocompatible nanoparticles and nanoscale materials. This innovative methodology aligns with the principles of green chemistry, minimizing the use of hazardous chemicals and reducing environmental impact [6].
Natural surfactants can be derived from various sources, including biomolecules [7], microorganisms [8], and plant extracts [9,10,11]. This diversity offers flexibility in nanoparticle synthesis [12]. Proteins and polyphenols from plants have been effectively used to synthesize nanoparticles, such as gold [13], silver [14], and metal oxides [15]. The phytochemical components in these extracts act as efficient reducing and capping agents, facilitating controlled nanoparticle growth, and paving the way for applications in medicine, electronics, and environmental remediation [16].
Moreover, the sustainable synthesis of nanomaterials with natural surfactants has significant applications in photocatalysis, marking a shift towards environmentally conscious catalytic processes [17]. This synergy enhances the efficiency and longevity of photocatalytic reactions, enabling a wide range of applications in energy generation [18] and water purification [19], thus maximizing the potential of both photocatalysis and sustainable nanomaterial synthesis.
In the past few decades, a variety of organic compounds and pharmaceuticals have been increasingly detected in aquatic mediums such as wastewater treatment plants and drinking waters, which points up their resistance to degradation through conventional treatment methods [20]. The increasing prevalence of these persistent pollutants has raised significant environmental concerns due to their massive use and improper disposal [21]. Considering the widespread use of nonsteroidal anti-inflammatory drugs (NSAIDs) in both human and veterinary medicine, around 80 million prescriptions are filled annually, which accounts for approximately 4.5% of all drug prescriptions [22]. For instance, diclofenac sodium (DCF), a frequently consumed NSAID, has an estimated global consumption of 940 tons per year [23]. Research has shown high concentrations of DCF, reaching several hundred ng/L, in groundwater wells in Baden-Württemberg, Germany [24]. The incomplete elimination of these pharmaceuticals results in active ingredients and metabolites being released into the environment, causing serious ecological impacts [25,26]. Similarly, aromatic nitro compounds pose significant threats, with p-nitrophenol (PNP) classified as a carcinogen due to its nitro group [27] and listed as a priority pollutant by the U.S. Environmental Protection Agency (EPA) for its toxicity [28].
To address these challenges, metal oxide nanomaterials have gained attention for their ability to decompose and eliminate pollutants, leveraging their unique properties [29,30]. Among these, zinc oxide (ZnO) is particularly noted for its remarkable photocatalytic capabilities, especially in degrading dyes and pharmaceuticals [31,32]. There have been reports suggesting that it sometimes outperformed TiO2 in the photodecomposition of nitrophenols and several other pollutants [33,34,35]. Therefore, ZnO is considered to be a low-cost alternative in photocatalytic reactions even though its application is sometimes pH-dependent and has been restricted to the UV region [36].
Interest in synthesizing biologically-based nanoparticles has surged recently, given their potential for minimizing the environmental impact associated with conventional nanoscale production [37].
In this context, chia seed extract presents an innovative and eco-friendly option for the synthesis of ZnO nanoparticles due to its rich chemical composition, which aids in controlling nanoparticle growth [38,39]. This study focuses on utilizing these synthesized nanoparticles to effectively degrade DCF and PNP.
To the best of our knowledge, there are no existing reports in the literature on the photocatalytic degradation of these pollutants using chia-based ZnO.

2. Results and Discussion

2.1. Characterization of ZnO Nanoparticles

2.1.1. XRD Analysis

The X-ray diffraction pattern, shown in Figure 1, displays well-defined peaks at 2θ values of 31.7°, 34.4°, 36.2°, 47.5°, 56.6°, 62.8°, and 67.9°, corresponding to the lattice planes (100), (002), (101), (102), (110), (103), and (112) of ZnO (ICDD card number 84-6784), confirming the hexagonal wurtzite structure (space group P63mc, No. 186). The absence of additional peaks indicates high purity of the crystalline material. The average crystallite size was calculated using the Debye–Scherrer formula (Equation (1)):
D = k λ β cos θ
where D is the crystallite size, k = 0.9, λ is the X-ray wavelength, β is the full width at half maximum (FWHM), and θ is the angle of the highest peak [40]. The average size of the ZnO NPs was approximately 27 nm, consistent with previous reports on nanosized oxides [41,42]. The chia seed extract plays a crucial role in controlling nanoparticle size, as noted by Hernández et al., who demonstrated its effectiveness in stabilizing silver NPs [43].

2.1.2. Surface Area Determination (BET Analysis)

The specific surface area of the ZnO nanoparticles was quantified using multipoint BET analysis, revealing a surface area of 13.4 m2/g. Table 1 presents BET results of ZnO and its as-synthesized non-calcined form. Despite reducing the surface area, the calcination at elevated temperatures (e.g., around 400 °C) typically leads to improved crystallinity, enhanced light absorption, and the elimination of some surface contaminants. Additionally, it helps reduce the number of structural defects that can act as recombination sites for charge carriers. Hence, fewer recombination sites lead to a better charge carrier separation, which is beneficial for various applications. Accordingly, when the optimal balance between high crystallinity and adequate surface area is achieved, ZnO nanoparticles exhibit outstanding photocatalytic performance.

2.1.3. Elemental Analysis (EA)

The elemental composition of the chia seed extract was analyzed, yielding 54.5 wt% C, 5.0 wt% H, and 3.7 wt% N. The as-synthesized ZnO contained 4.1 wt% C, <0.5 wt% H, and <0.1 wt% N before calcination. The elemental analysis results after calcination (see Section 3.3) confirm purity of the final material.

2.1.4. Morphological Insights

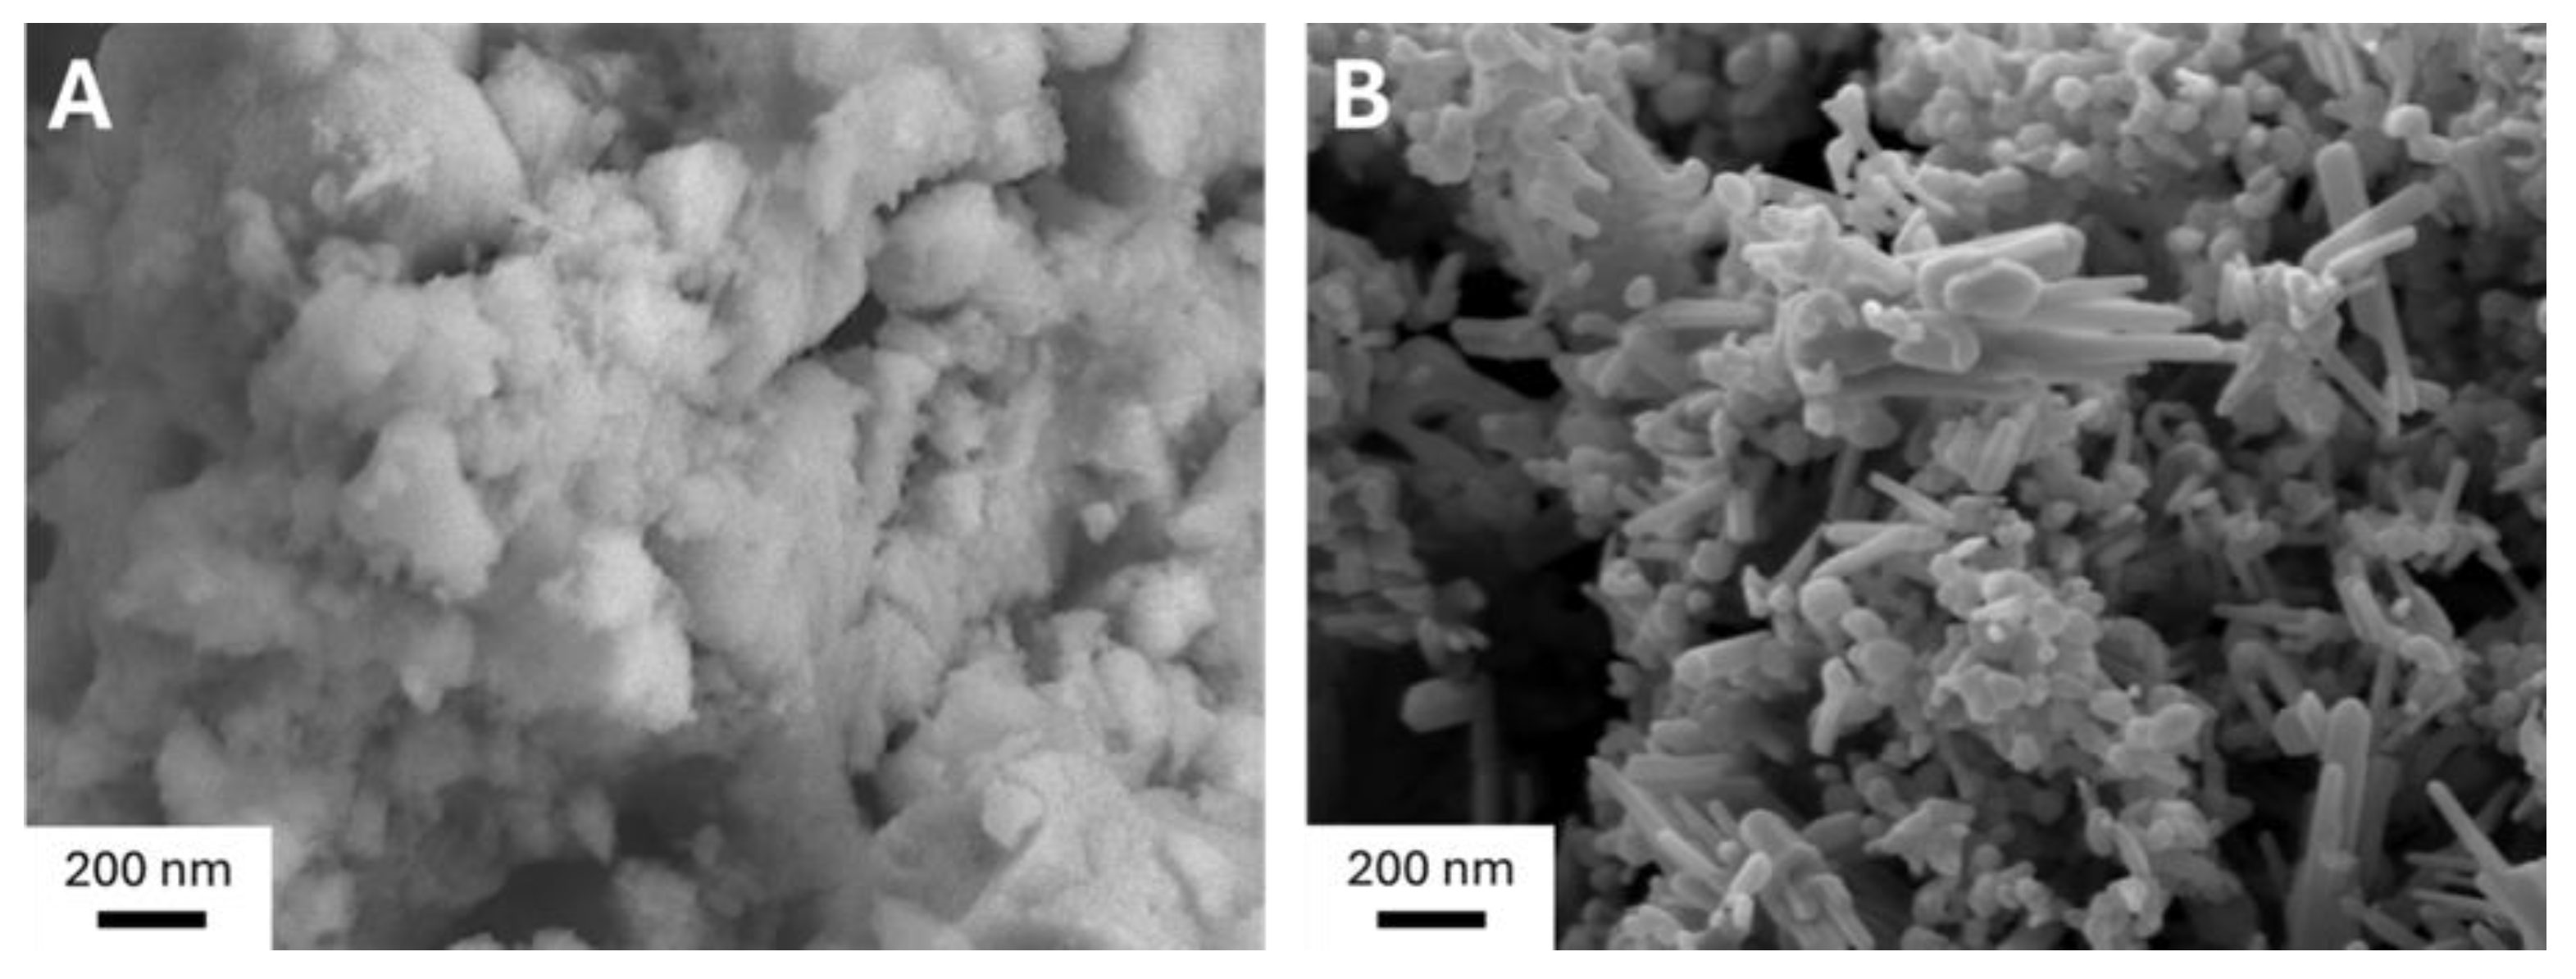
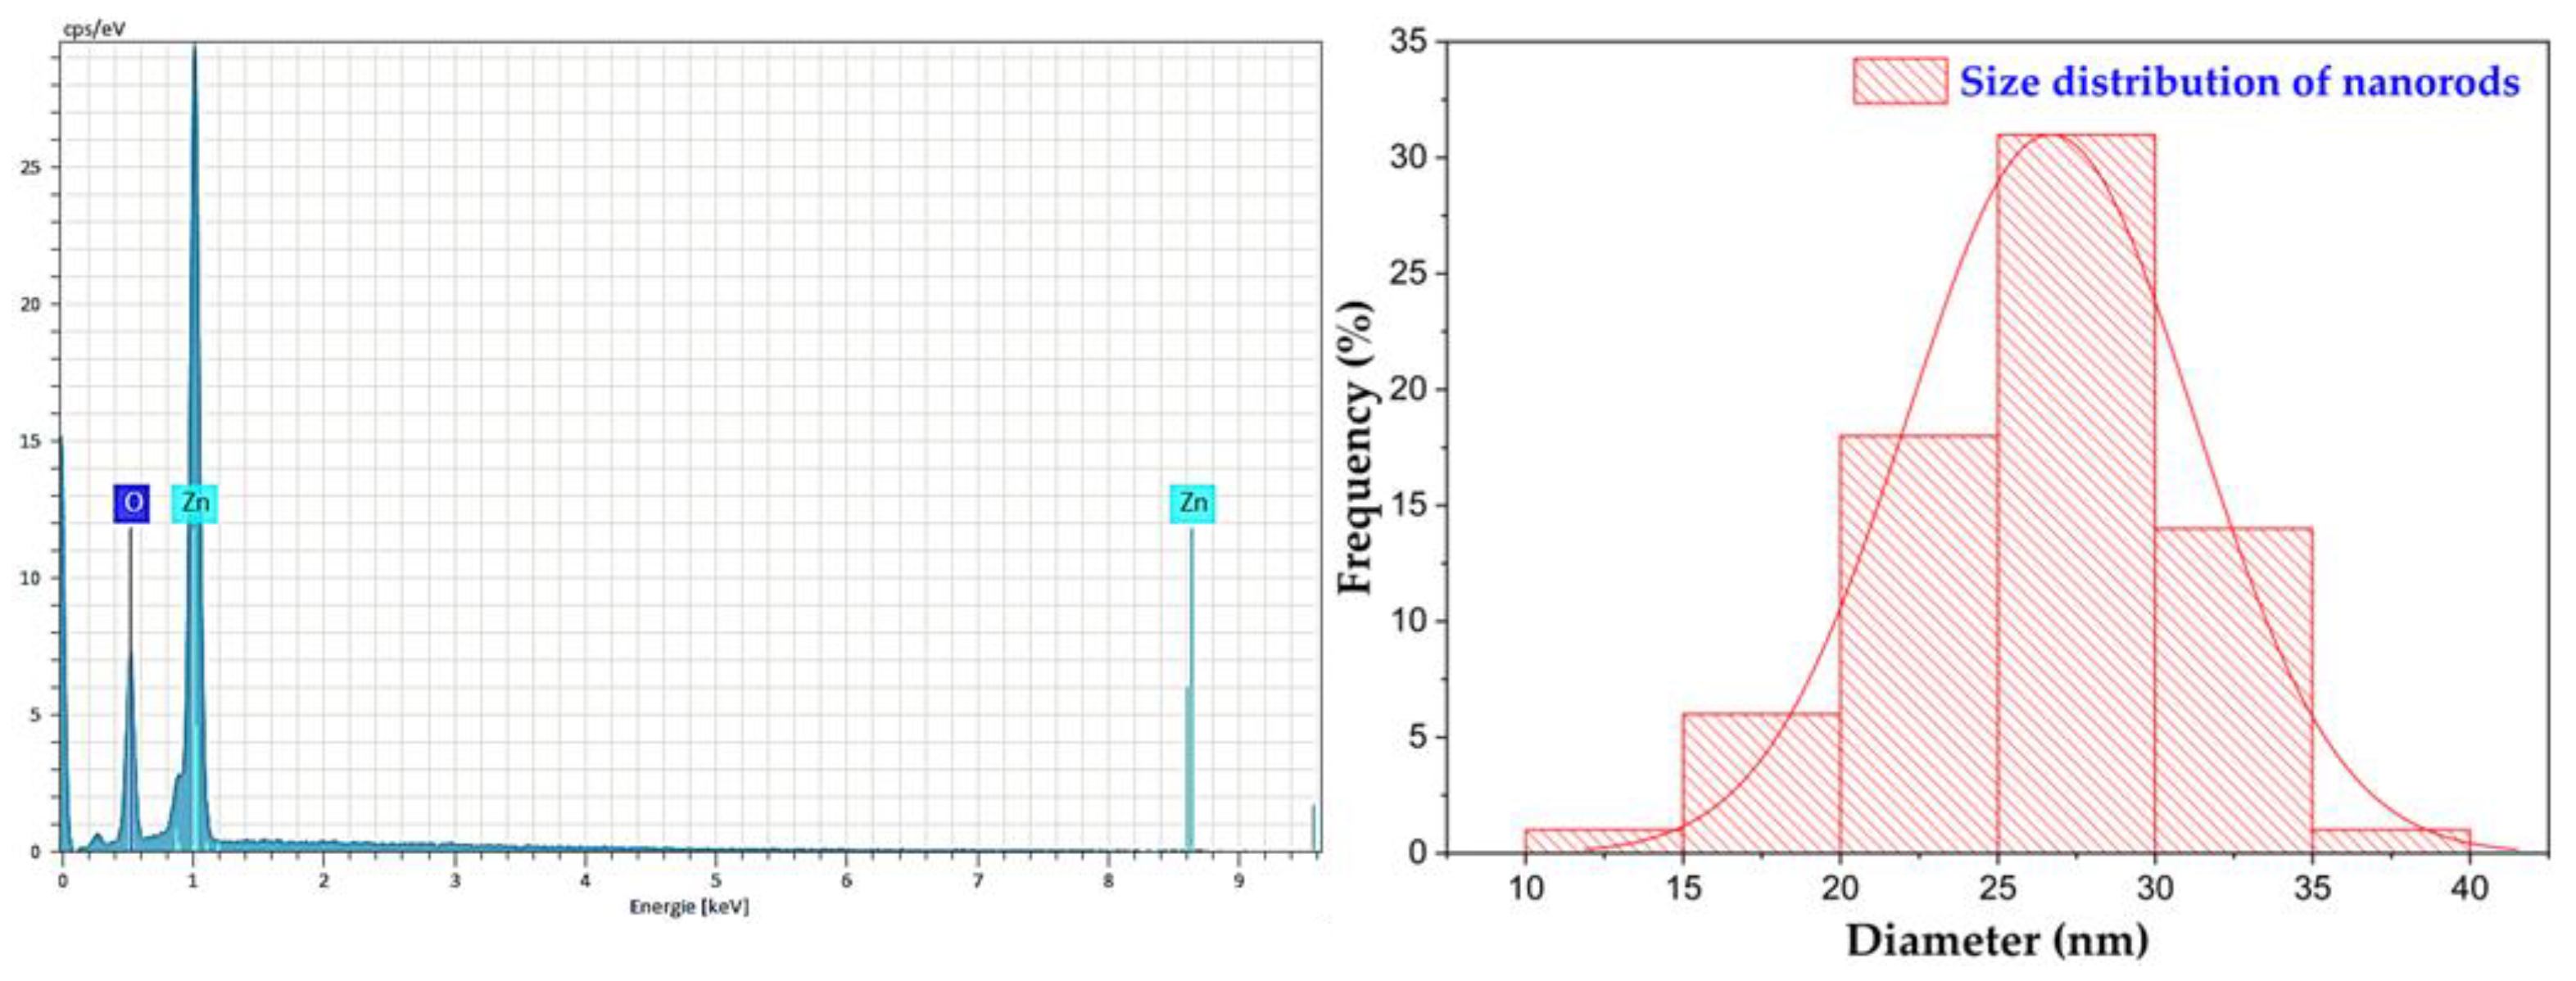
SEM images (Figure 2) reveal that the morphology of the as-synthesized ZnO (2A) transitions to a mixture of nanorods and quasi-spherical nanocrystals after calcination (2B). This thermal treatment is essential for the formation of nanometric ZnO NPs. EDX analysis (Figure 3, left) confirmed the exclusive presence of Zn and O, consistent with elemental analysis results. The size distribution of crystallites was corroborated using ImageJ 1.50d software (Figure 3, right), aligning with XRD data, showing all crystallites have diameters < 40 nm.

2.1.5. Optical Properties

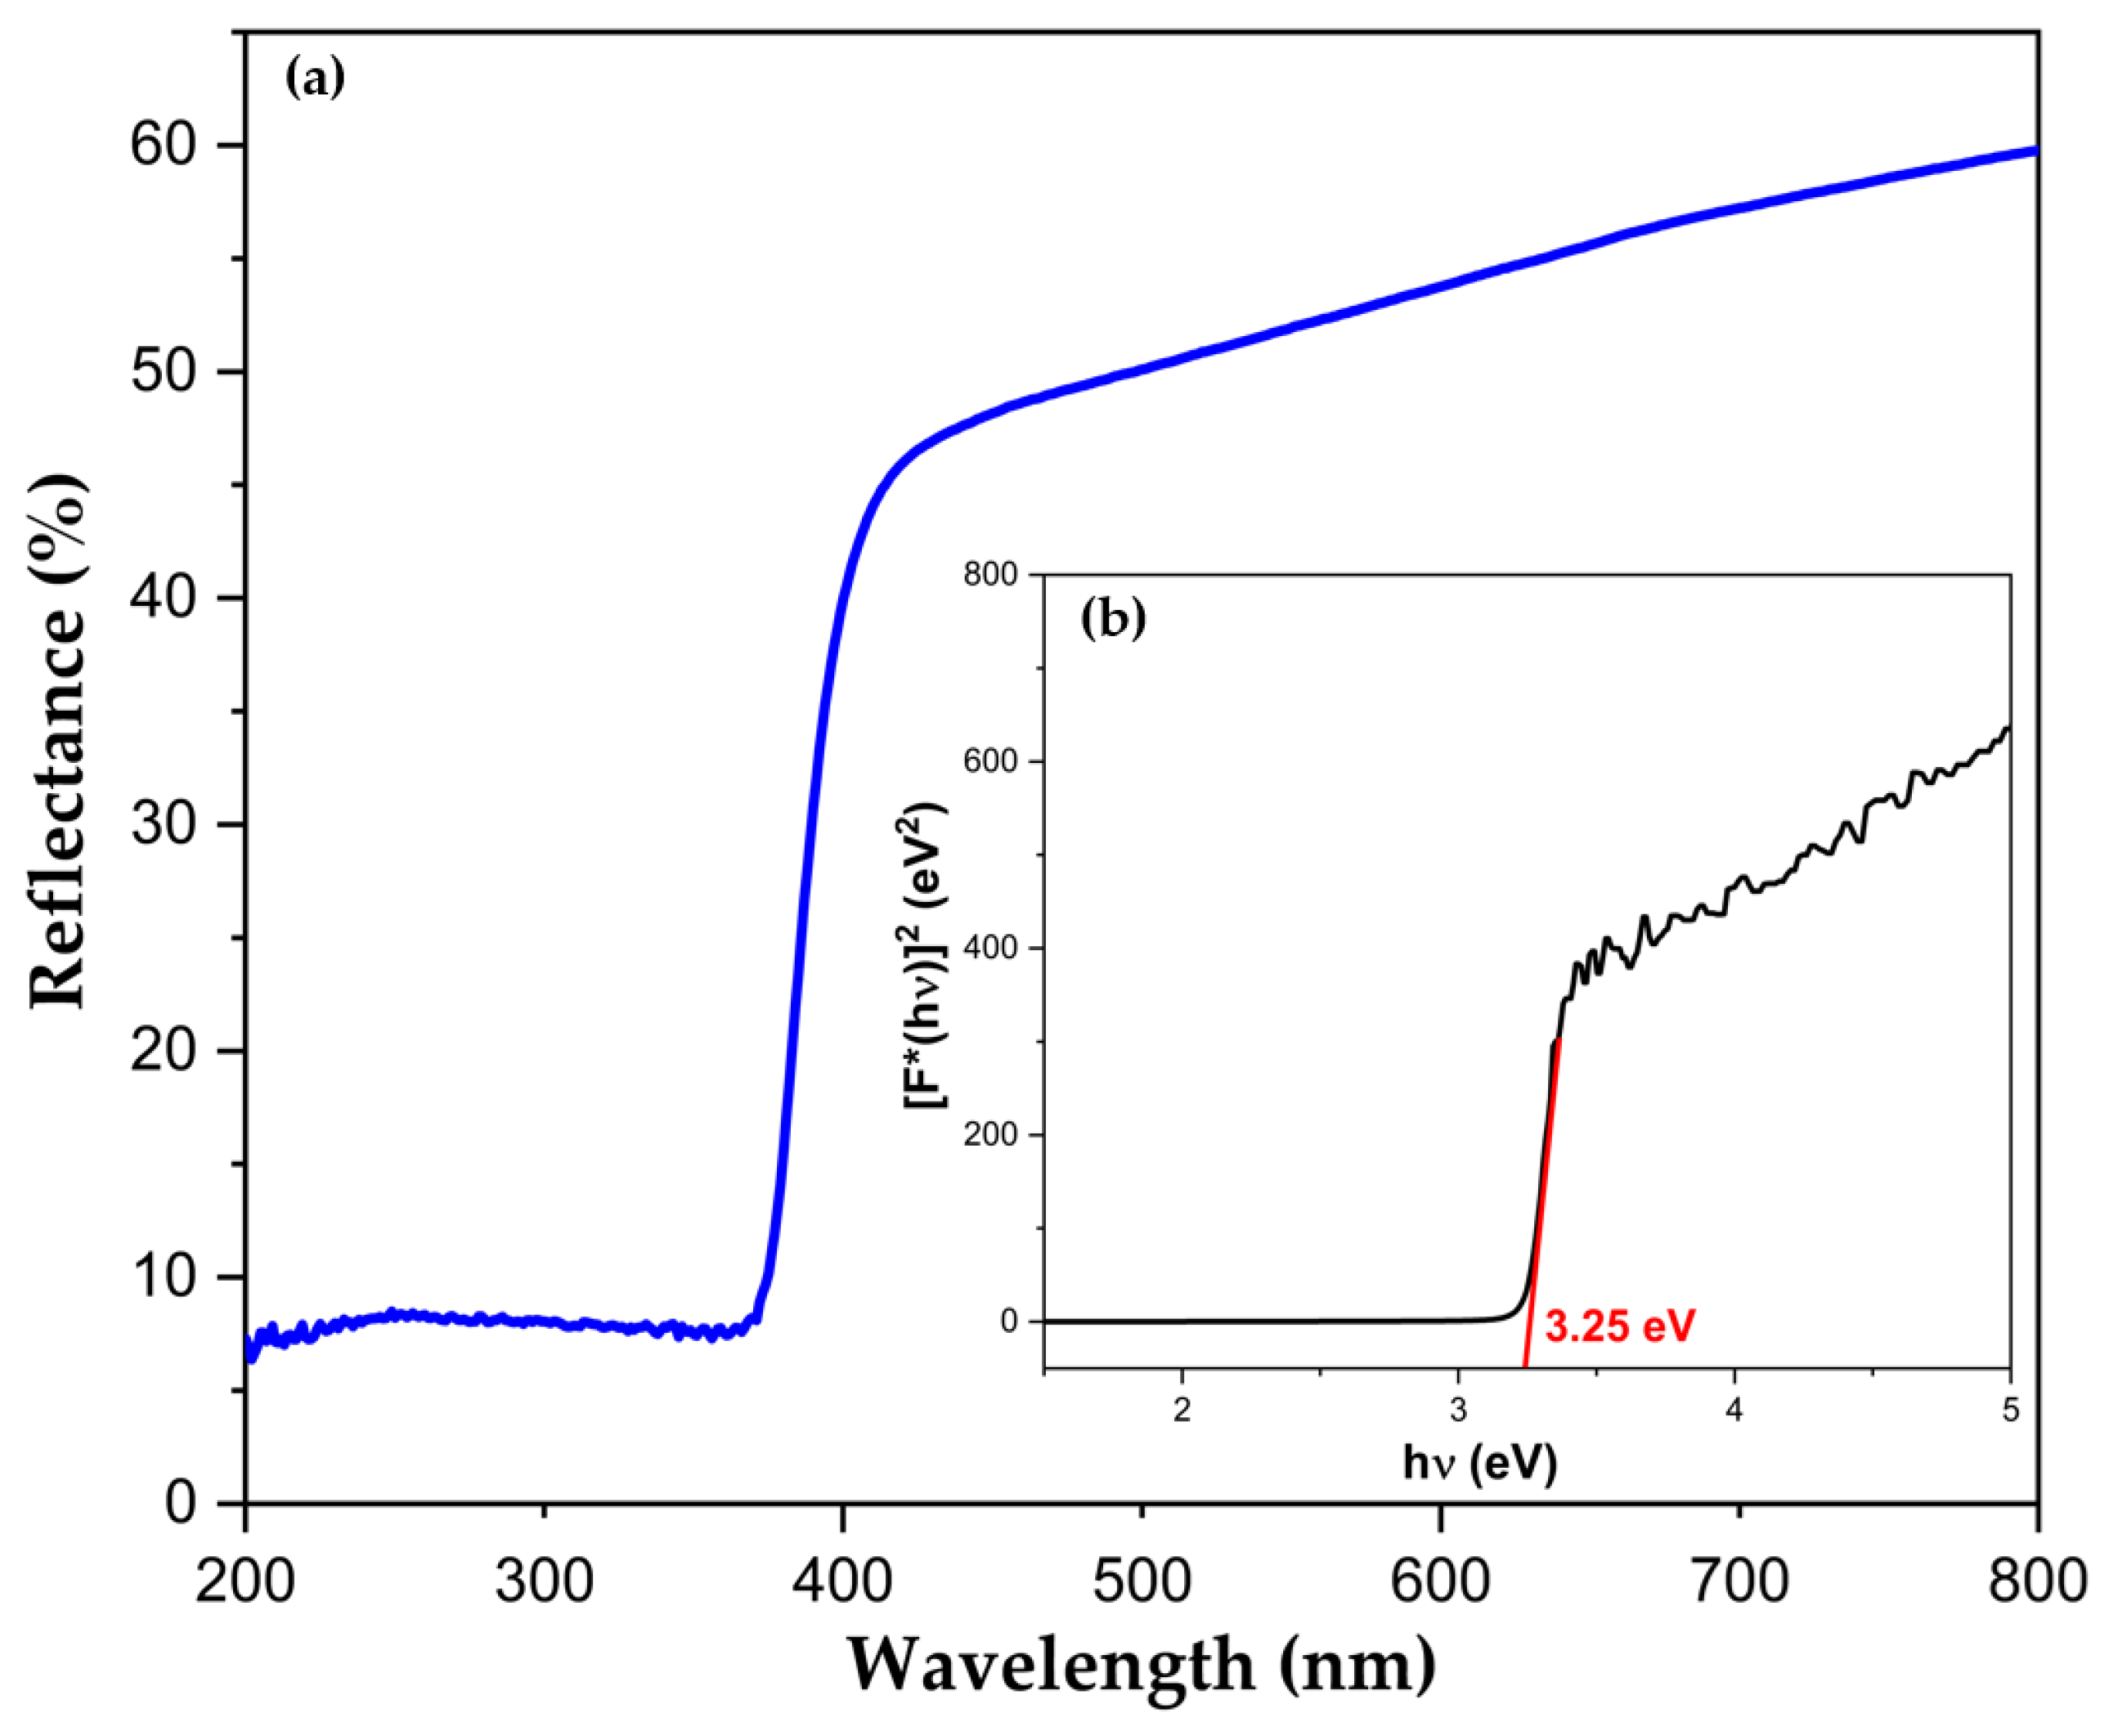
The UV–vis spectra presented in Figure 4a reveal a pronounced optical reflectance of the synthesized zinc oxide nanoparticles (ZnO NPs) within the spectral range of 200 to 400 nm. The notable UV absorption observed can be attributed to the band gap energy (Eg) of the semiconductor, which was calculated using the following equation:
F R · h ν = k h ν E g 1 n
In this equation, F(R) represents the Kubelka–Munk function, k is an energy-independent constant, and n takes values of 2 or 1/2 for direct or indirect allowed transitions, respectively. Since ZnO is a direct semiconductor, the band gap energy is determined by extrapolating the linear region of the plot F R · h ν 2 vs. h ν (inset in Figure 4) [44].
The estimated band gap of the synthesized ZnO nanoparticles was approximately 3.25 eV, which is consistent with previously reported values for nanometric ZnO [45]. This finding underscores the potential of ZnO NPs for applications in photonics and photocatalysis, where a suitable band gap is crucial for effective light absorption and energy conversion.

2.2. Photocatalytic Performance

2.2.1. Adsorption Kinetics of DCF

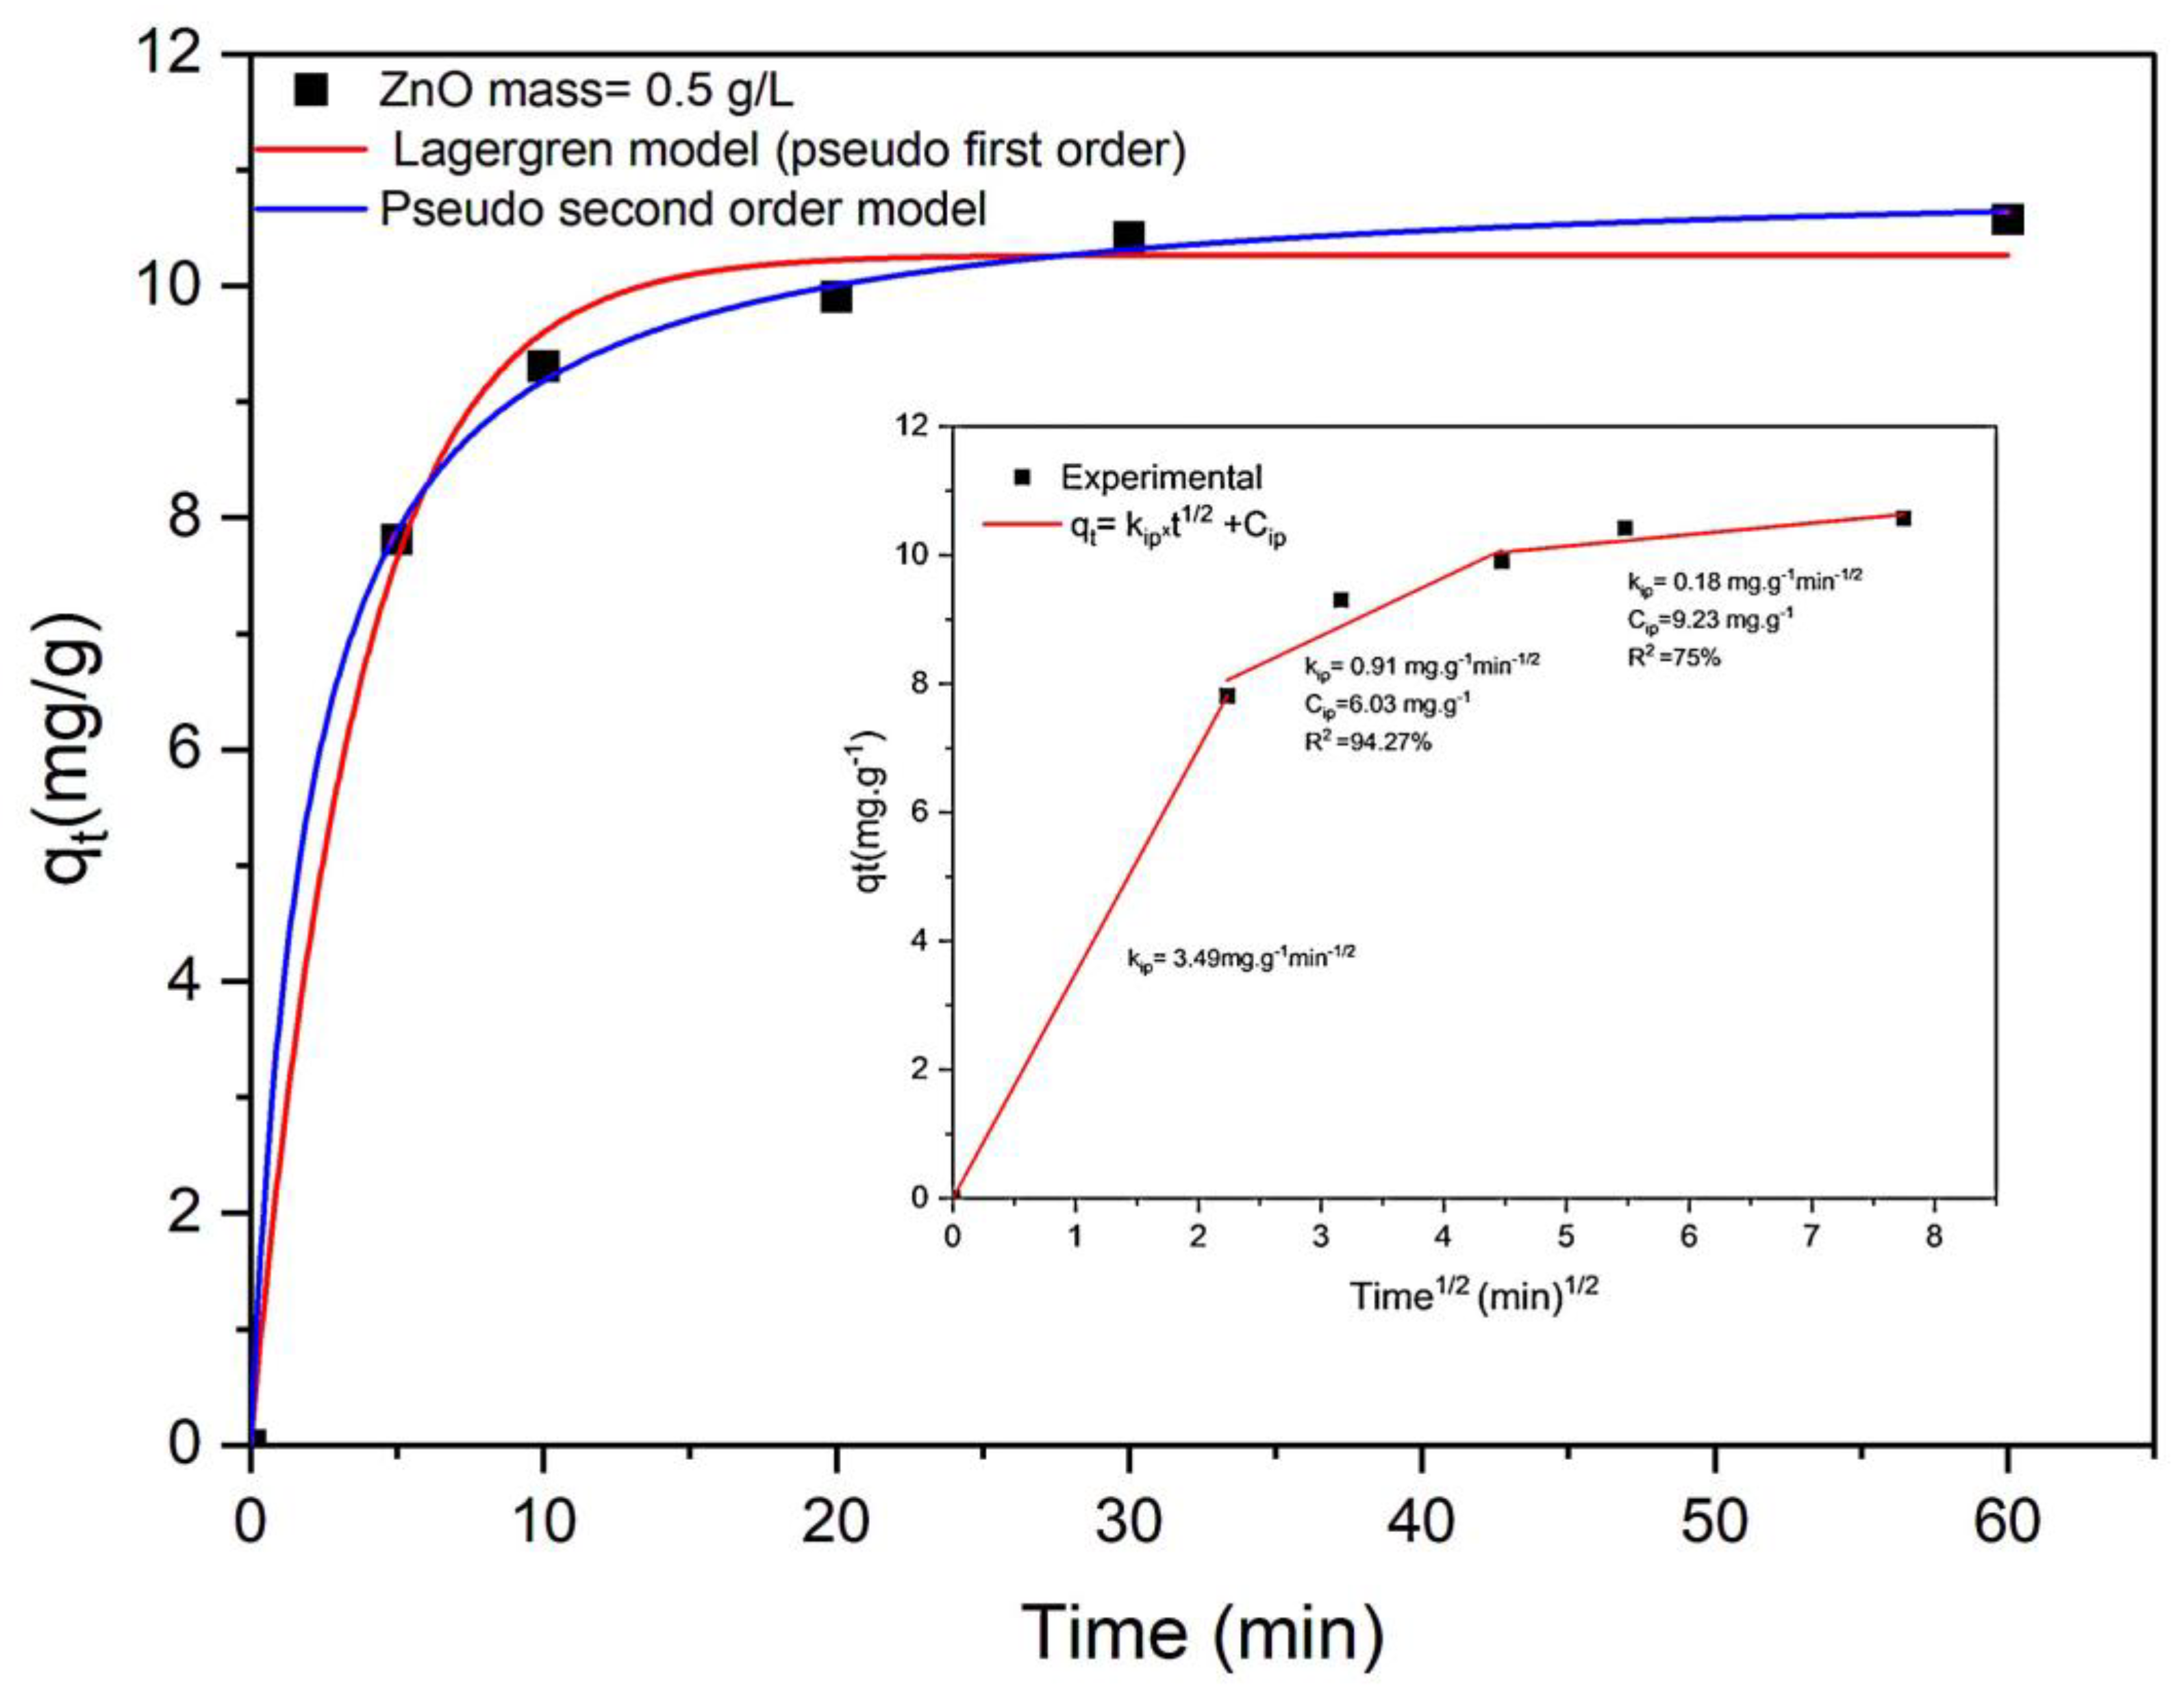
The kinetics of adsorption are commonly utilized to elucidate the temporal equilibrium of adsorption processes, the mechanisms driving these processes, and the rates at which pollutants bind to ZnO. In the case of diclofenac (DCF), its adsorption behavior has been analyzed using pseudo-first-order kinetics, pseudo-second-order kinetics, and intraparticle diffusion, as illustrated in Figure 5.
The data presented in Figure 5 and Table 1 indicate that the pseudo-second-order kinetic model exhibits a superior R2 value compared to the pseudo-first-order model, aligning more closely with the experimental adsorption quantities. This finding strongly supports the notion that the adsorption of DCF onto ZnO predominantly follows the pseudo-second-order kinetic model. The adsorption fitting plot for intraparticle diffusion shown in Figure 5 (inset) does not intersect the origin, revealing a nonlinear relationship between qt (the amount adsorbed at time t) and t1/2. This suggests that the intraparticle diffusion process is not the sole rate-determining step; rather, the overall adsorption rate may also be influenced by external diffusion processes [46,47].
The adsorption process can be delineated into three distinct stages:
  • Surface Adsorption: In this initial stage, DCF molecules occupy the active sites on the exterior surface of ZnO through mechanisms such as hydrophobic partitioning, covalent bonding, and van der Waals forces;
  • Intraparticle Diffusion: The second stage involves DCF experiencing mass transfer posed by the outer liquid barrier and diffusing toward the inner surface of the ZnO particles;
  • Quasi-Equilibrium Stage: The final stage represents a state where the adsorption rate stabilizes.
The diffusion rates across these three stages follow the order kip1 > kip2 > kip3 (kip refers to the intraparticle diffusion constant). This trend is further supported by the corresponding model depicted in Figure 5 (inset). The initial phase of the experiment shows the sharpest slope, indicating a rapid increase in the adsorption process. Over the next 10 min, the adsorption rate progressively slows down, reaching dynamic equilibrium around the 30 min mark, as evidenced by a negligeable slope [48].

2.2.2. Kinetics of Degradation of PNP and DCF

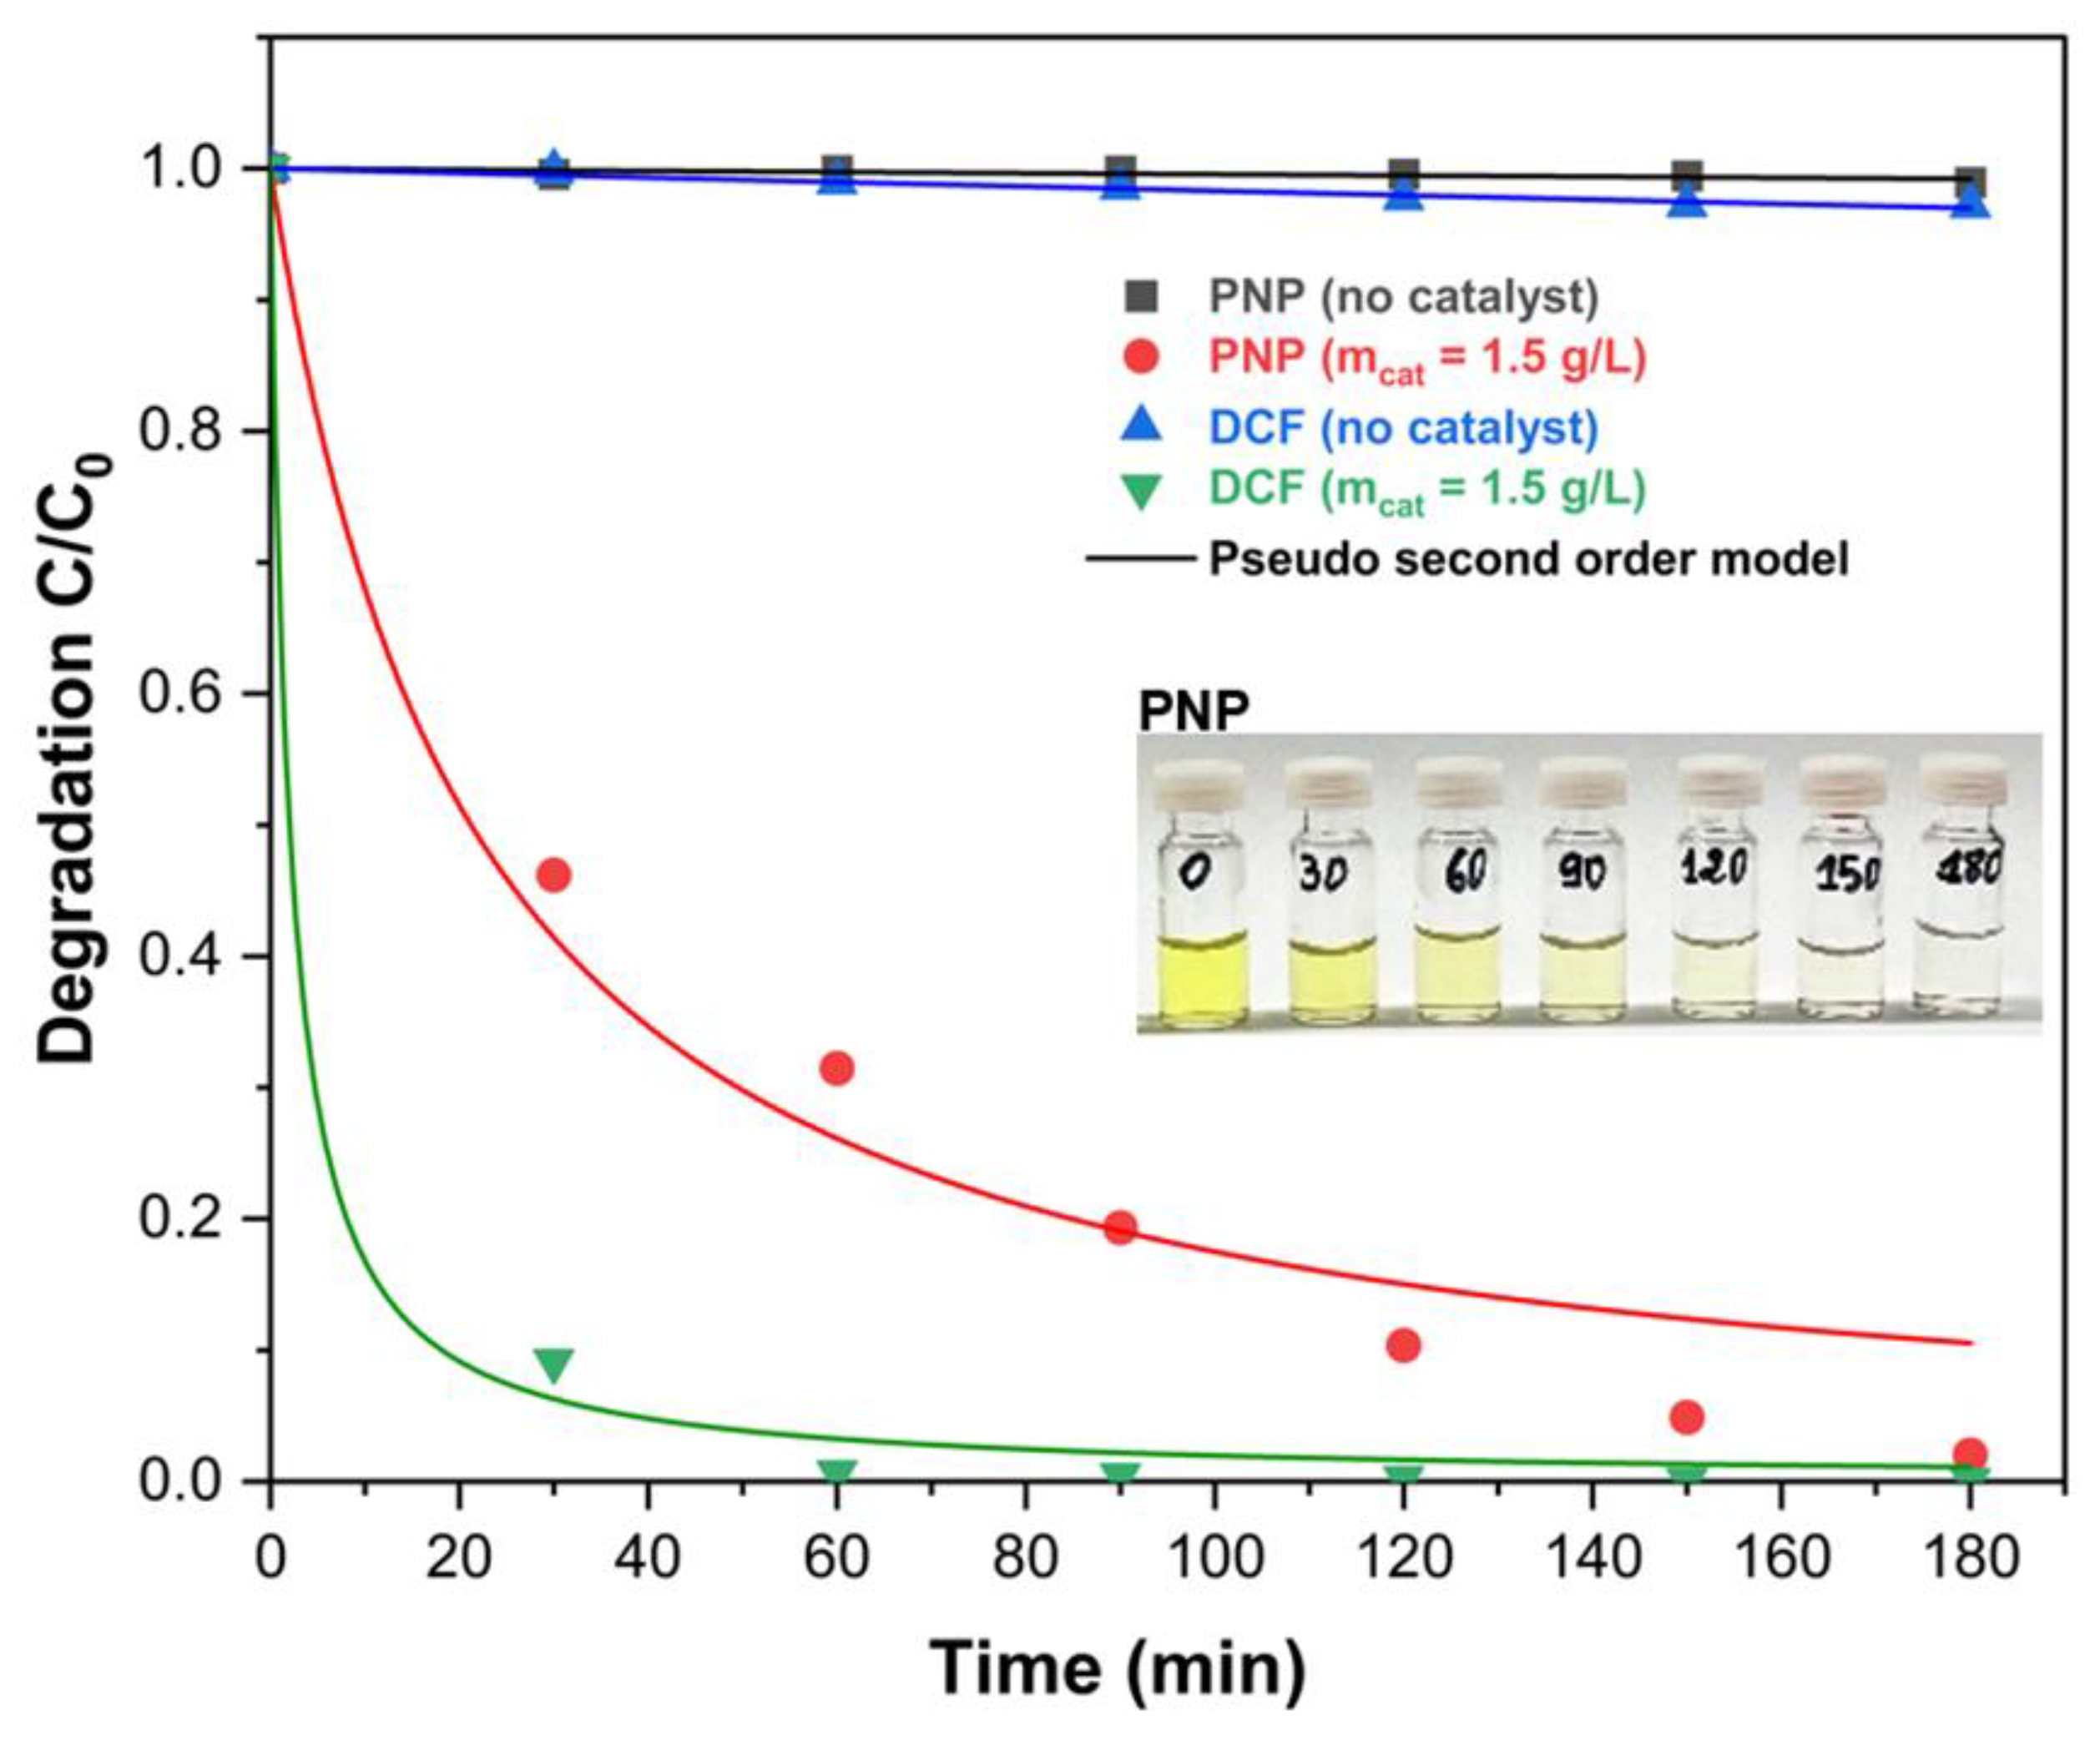
Figure 6 and Table 2 illustrate the photocatalytic degradation of PNP (p-nitrophenol) and DCF (diclofenac), both in the absence of a catalyst and in the presence of 1.5 g/L of catalyst, along with the corresponding pseudo-second-order kinetic constants and R2 values. PNP without a catalyst demonstrates a low kinetic constant of 4 × 10⁻⁵ L·mol−1·min−1, signifying minimal degradation efficiency. In contrast, DCF without a catalyst shows a slightly higher kinetic constant of 15 × 10−5 L·mol−1·min−1, suggesting that it is somewhat more likely to be degraded by light alone. Nevertheless, both compounds exhibit slow degradation under these conditions, consistent with previous studies highlighting low photolysis rates for both compounds [49,50]. On the other hand, in the presence of 1.5 g/L of catalyst, DCF degrades approximately 10 times faster than PNP under similar catalytic conditions, a phenomenon that can be attributed to several interrelated factors.
Firstly, the chemical structure of DCF, which features functional groups that enhance its reactivity, plays a crucial role; for instance, the carboxylic acid group in DCF may promote more effective interactions with catalysts compared to the nitro group in PNP, which tends to stabilize the molecule and diminish its reactivity. Additionally, the catalyst may demonstrate a preferential affinity for DCF, facilitating more effective interactions and resulting in faster degradation rates due to the specific availability and nature of active sites on the catalyst.
Furthermore, the reaction mechanisms for DCF and PNP may differ, with DCF likely following a more favorable pathway that leads to quicker breakdown. Environmental factors such as pH and temperature may also influence these degradation rates, further benefiting DCF’s degradation process over that of PNP. Ultimately, the significantly higher kinetic constant for DCF (46.03 × 10⁻² L·mol−1·min−1) compared to PNP (4.03 × 10⁻² L·mol−1·min−1) indicates its greater readiness to react under identical conditions, highlighting the importance of these various factors in optimizing degradation processes for organic pollutants.

2.2.3. Photodegradation Process Influencing Factors

The photodegradation process is influenced by several factors, including reactor design, light wavelength and intensity, reaction temperature, pH, pollutant concentration, catalyst dosage, and the presence of ions [51]. In our study, as illustrated in Scheme 3 (see Section 3.5), we maintained a consistent stirring rate, light intensity, and distance to the lamp to ensure uniform irradiation of the catalyst surface [52].
Regarding the physiochemical parameters, many authors have reported that room temperature and unadjusted suspension pH can lead to effective photodegradation, particularly considering the characteristics of wastewater. For example, in the case of PNP, substantial degradation was achieved without controlling the pH throughout the reaction [53]. The physiological relevance of a neutral pH is noteworthy, as most biochemical reactions in living systems occur in such an environment [54]. Additionally, it is important to point out that zinc oxide (ZnO) has a pH at point of zero charge (pH pzc) ranging from 8 to 10 [55]. Consequently, under acidic conditions (pH < pH pzc), the surface of the catalyst becomes positively charged. Given that DCF has a pKa of 4, it carries a negative charge at pH values above 4 [56]. Research indicates that optimal degradation occurs within a pH range of 5 to 7 [57]. Thus, at a solution pH around 6, the attraction between ZnO nanoparticles and DCF is enhanced, facilitating the degradation [58].
Moreover, with a pKa of approximately 7, PNP exists in both ionized and neutral forms in aqueous solutions, making its anions less prone to volatilization [59]. For pollutant concentration, we opted to work with a commercial DCF tablet to compare its degradation efficiency with that of the pure compound at higher doses, reflecting concentrations typically reported in wastewater. This approach allowed us to assess the efficacy of our lab-scale synthesized ZnO in degrading effluents, with a particular focus on varying the ZnO dosage.

2.2.4. Effect of Catalyst Loading on DCF Degradation

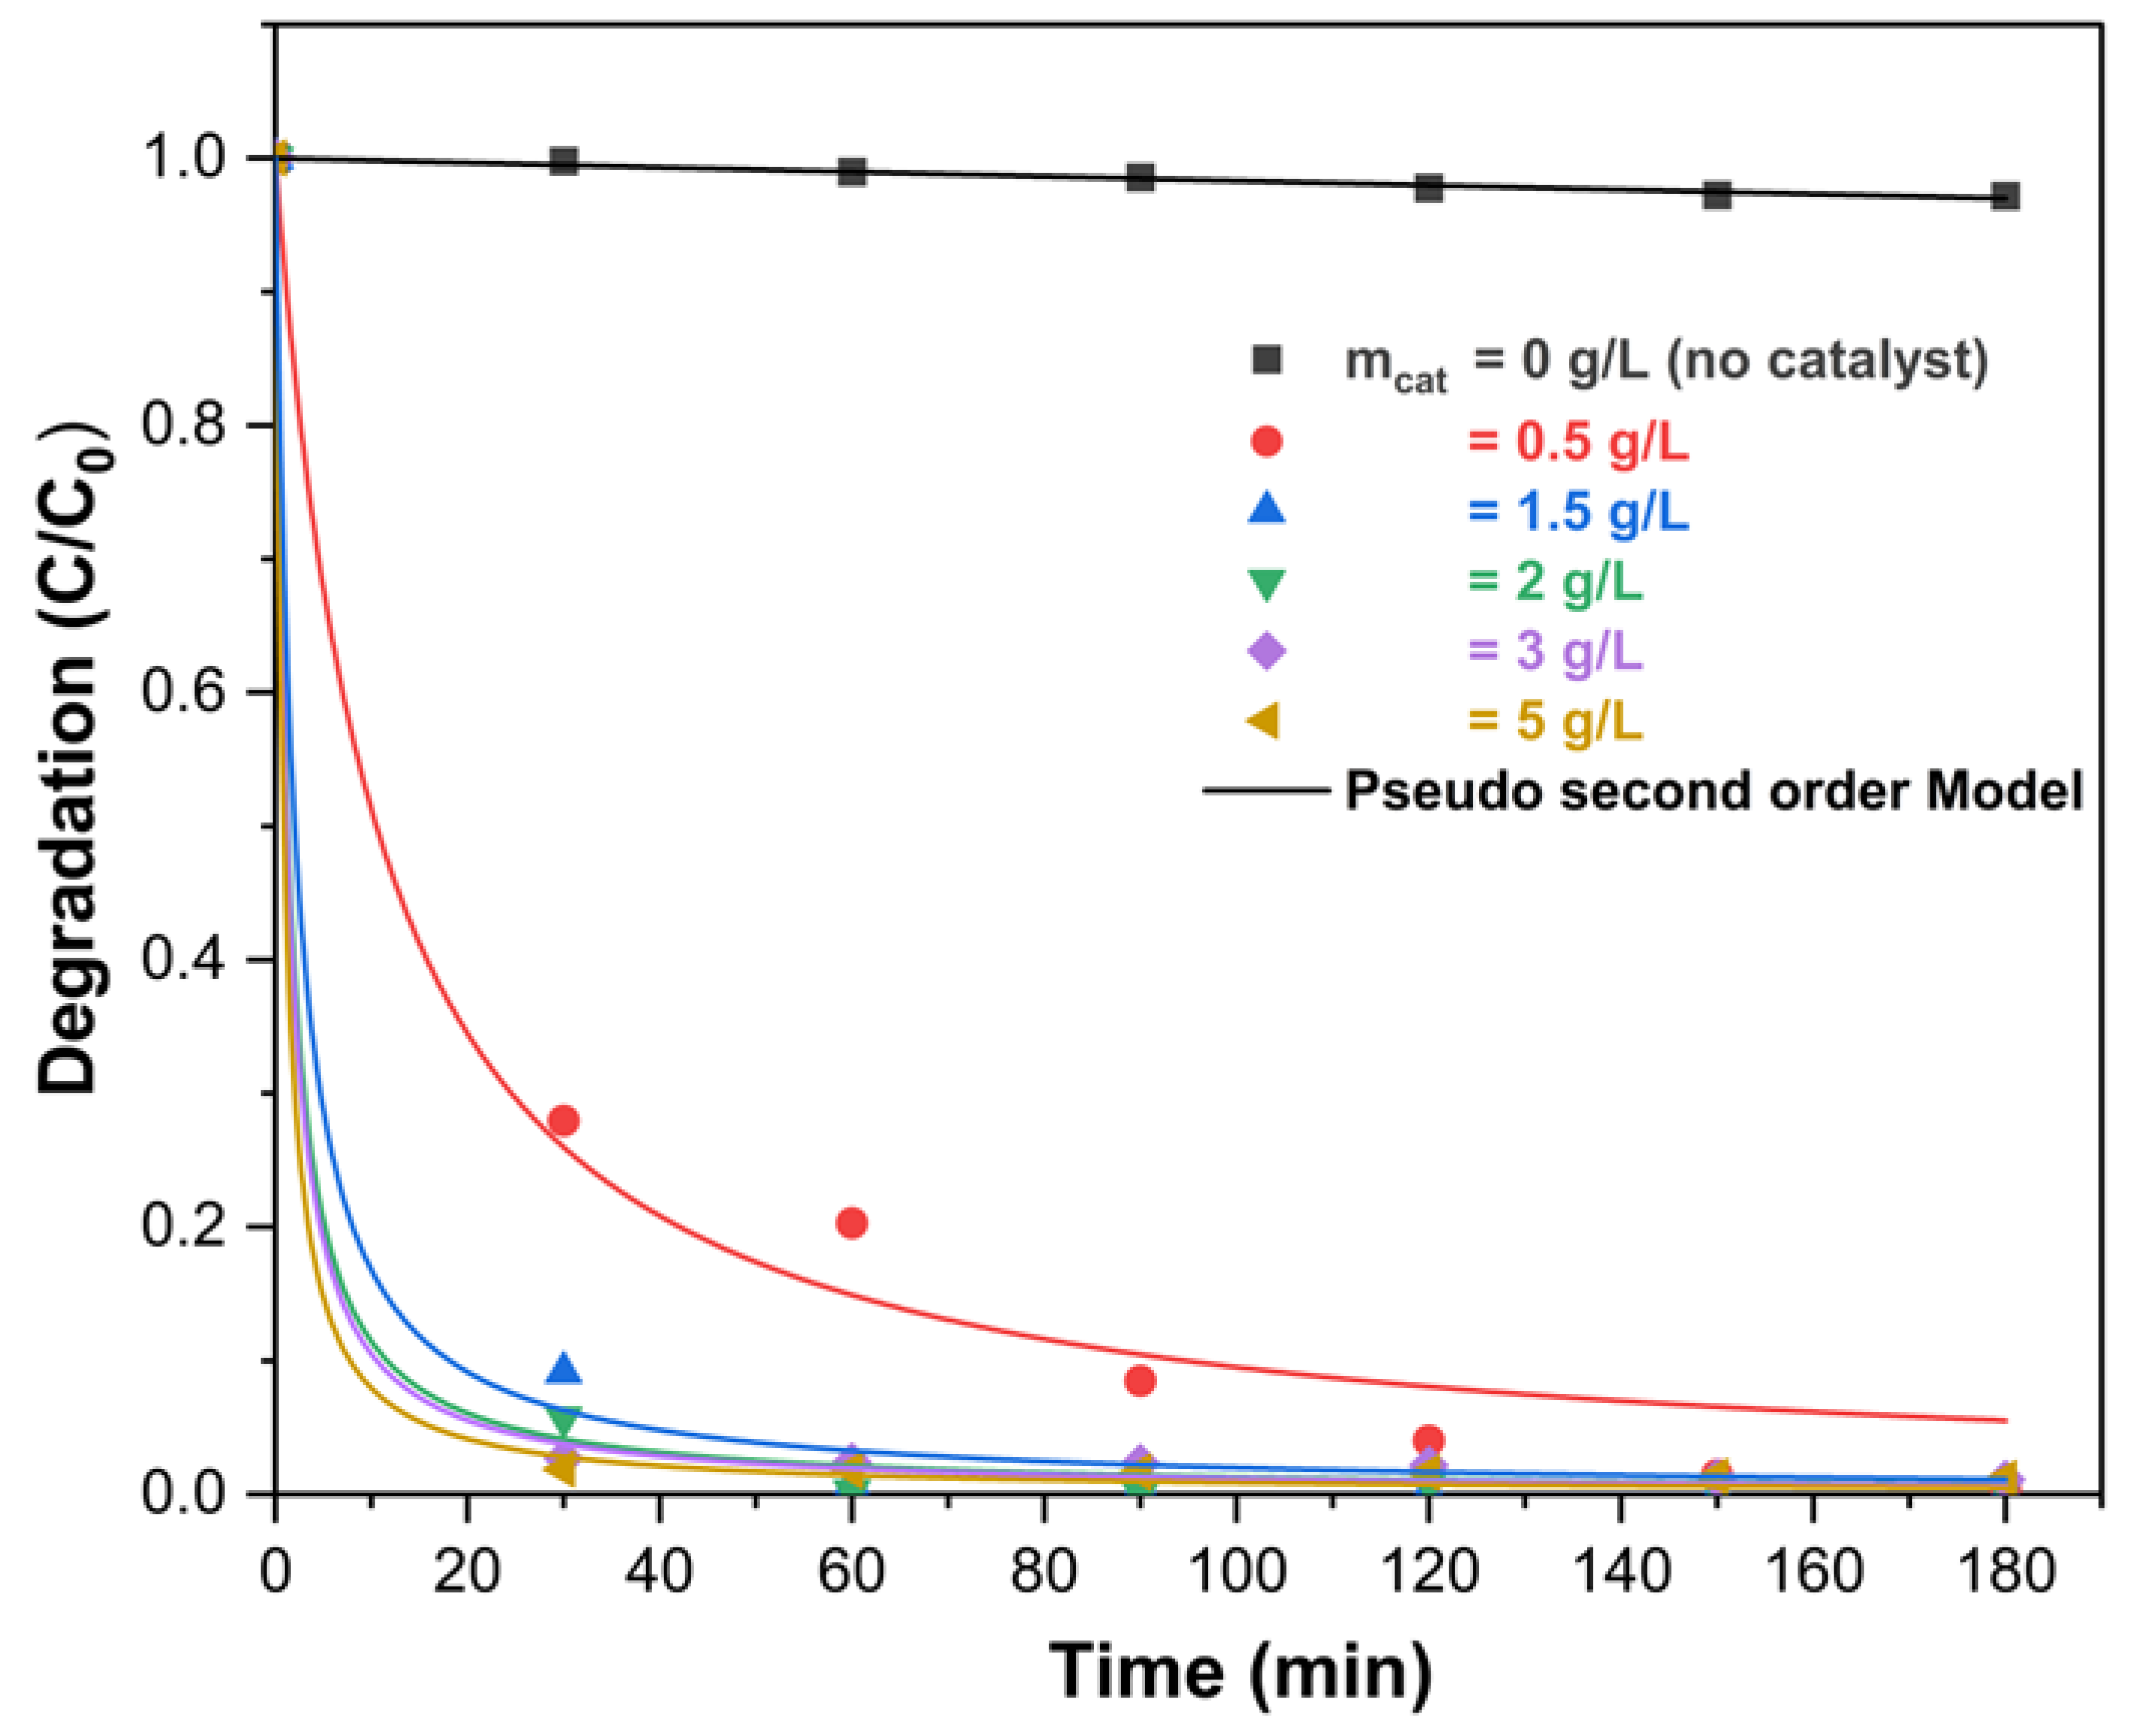
To evaluate the degradation efficiency of diclofenac (DCF), various concentrations of zinc oxide (ZnO) nanoparticles were tested, ranging from 0.5 to 5 g/L. The same experimental procedure was employed as previously described.
As shown in Figure 7, the concentration of reactant decreases more rapidly with higher catalyst masses, aligning with the principles of photocatalysis. This observation underscores the good fit of the data with the pseudo-second-order kinetic model, suggesting that the reaction rate is primarily influenced by the concentration of the limiting reactant in relation to the catalyst. For instance, as the catalyst mass increases, more active sites become available, allowing for greater interaction with DCF molecules, which enhances the rate of reaction. Previous studies have indicated that DCF has a half-life of approximately 39 min [60].
Figure 8 illustrates the relationship between catalyst mass (measured in grams) and the pseudo-second-order kinetic constant (expressed in L·mol−1·min−1). The plotted data points represent experimental results from various reactions, demonstrating how the kinetic constant varies with different amounts of catalyst.
The Catalyst Mass Saturation Kinetics Model (CMSKM) designed to describe how the kinetic constant k evolves with the mass of a catalyst m, particularly emphasizing the phenomenon of saturation of active sites, was used to simulate the experimental data obtained. As the mass of the catalyst increases, more active sites become available for reactant adsorption and reaction. However, there comes a point where simply adding more catalyst does not lead to a proportional increase in the reaction rate due to saturation effects. The model is expressed as follows:
k = a·m/(1 + b·m)
where
  • k (L·mol−1·min−1) is the kinetic constant of the reaction,
  • m (grams) is the mass of the catalyst,
  • a (L·mol−1·min−1·g−1) is the maximum kinetic constant achievable at low catalyst mass, and
  • b (g−1) is a parameter that controls the rate of saturation.
The Catalyst Mass Saturation Kinetics Model effectively captures the dynamics of catalytic reactions where the availability of active sites limits the reaction rate. This is particularly relevant in heterogeneous catalysis, where at low catalyst loads, the reaction rate increases efficiently with more catalyst, but at higher loads, the benefits diminish, and further increases in catalyst mass lead to minimal improvements in reaction kinetics. Ultimately, the Saturation Kinetics Model provides a useful framework for understanding the relationship between catalyst mass and reaction rate, highlighting the balance between increasing active sites and the saturation effect, which is critical for optimizing catalytic processes in various chemical reactions.
The red line in Figure 8 depicts the fitted CMSKM, effectively showing its ability to capture the relationship between catalyst mass and the kinetic constant.
The parameter a, valued at 44.42 L·mol−1·min−1 g−1, signifies the maximum intrinsic kinetic constant achievable at low catalyst mass, reflecting the catalyst’s efficiency. In contrast, the parameter b, set at 0.20 g−1, indicates that saturation occurs relatively quickly as catalyst mass increases; a higher value would suggest even faster saturation. The R2 value of 96.72% demonstrates an excellent fit of the model to the data, indicating that it accounts for a substantial portion of the variability observed in the experimental results.
The trend reveals that as catalyst mass increases, the pseudo-second-order kinetic constant also rises, but the rate of increase diminishes at higher masses. This behavior aligns with the principles of saturation kinetics, where the reaction rate improves with additional catalyst until it reaches a saturation point due to fully occupied active sites. Overall, the data and model suggest that while increasing the amount of catalyst enhances the reaction rate, there is a threshold beyond which additional catalyst yields diminishing returns. This insight is critical for optimizing catalyst use in industrial applications, aiming to maximize efficiency while minimizing costs.
The model expressed as
Efficiency = Emax⋅(1 − e−b⋅m)
was used to describe the relationship between the degradation efficiency and the mass of the catalyst shown in Figure 9. The goodness of fit is indicated by an R2 value of 1, demonstrating a perfect match between the experimental data and the model.
Key observations from the data reveal that at low catalyst masses (near 0 g), the degradation efficiency starts at 0% and increases rapidly. This rapid increase reflects the effective action of the catalyst in degrading pollutants, consistent with the exponential growth predicted by the model. However, as the mass of the catalyst increases, the efficiency rises but begins to level off, indicating a saturation point beyond which additional increases in catalyst mass yield diminishing returns in efficiency.
The parameter Emax is approximately 99.45%, suggesting that under optimal conditions, the catalyst can nearly completely degrade the pollutant. The value of b is around 3.09 g−1, which signifies the sensitivity of efficiency to the mass of the catalyst; a higher b indicates that small increases in mass lead to significant improvements in efficiency.
In practical terms, these results suggest that optimizing the catalyst mass is crucial for maximizing degradation efficiency. Since the efficiency approaches a high maximum, there exists a point at which adding more catalyst does not significantly enhance performance. In our case, we observe that the efficiency reaches 90% or more with a certain mass (0.75 g), and further increases (such as to 1 g or 1.5 g) only result in marginal gains (for instance, increasing from 90% to 98%); then, this mass can be considered the optimal value.

2.2.5. Photocatalytic Performance: Synthesized vs. Commercial ZnO on Diclofenac Degradation

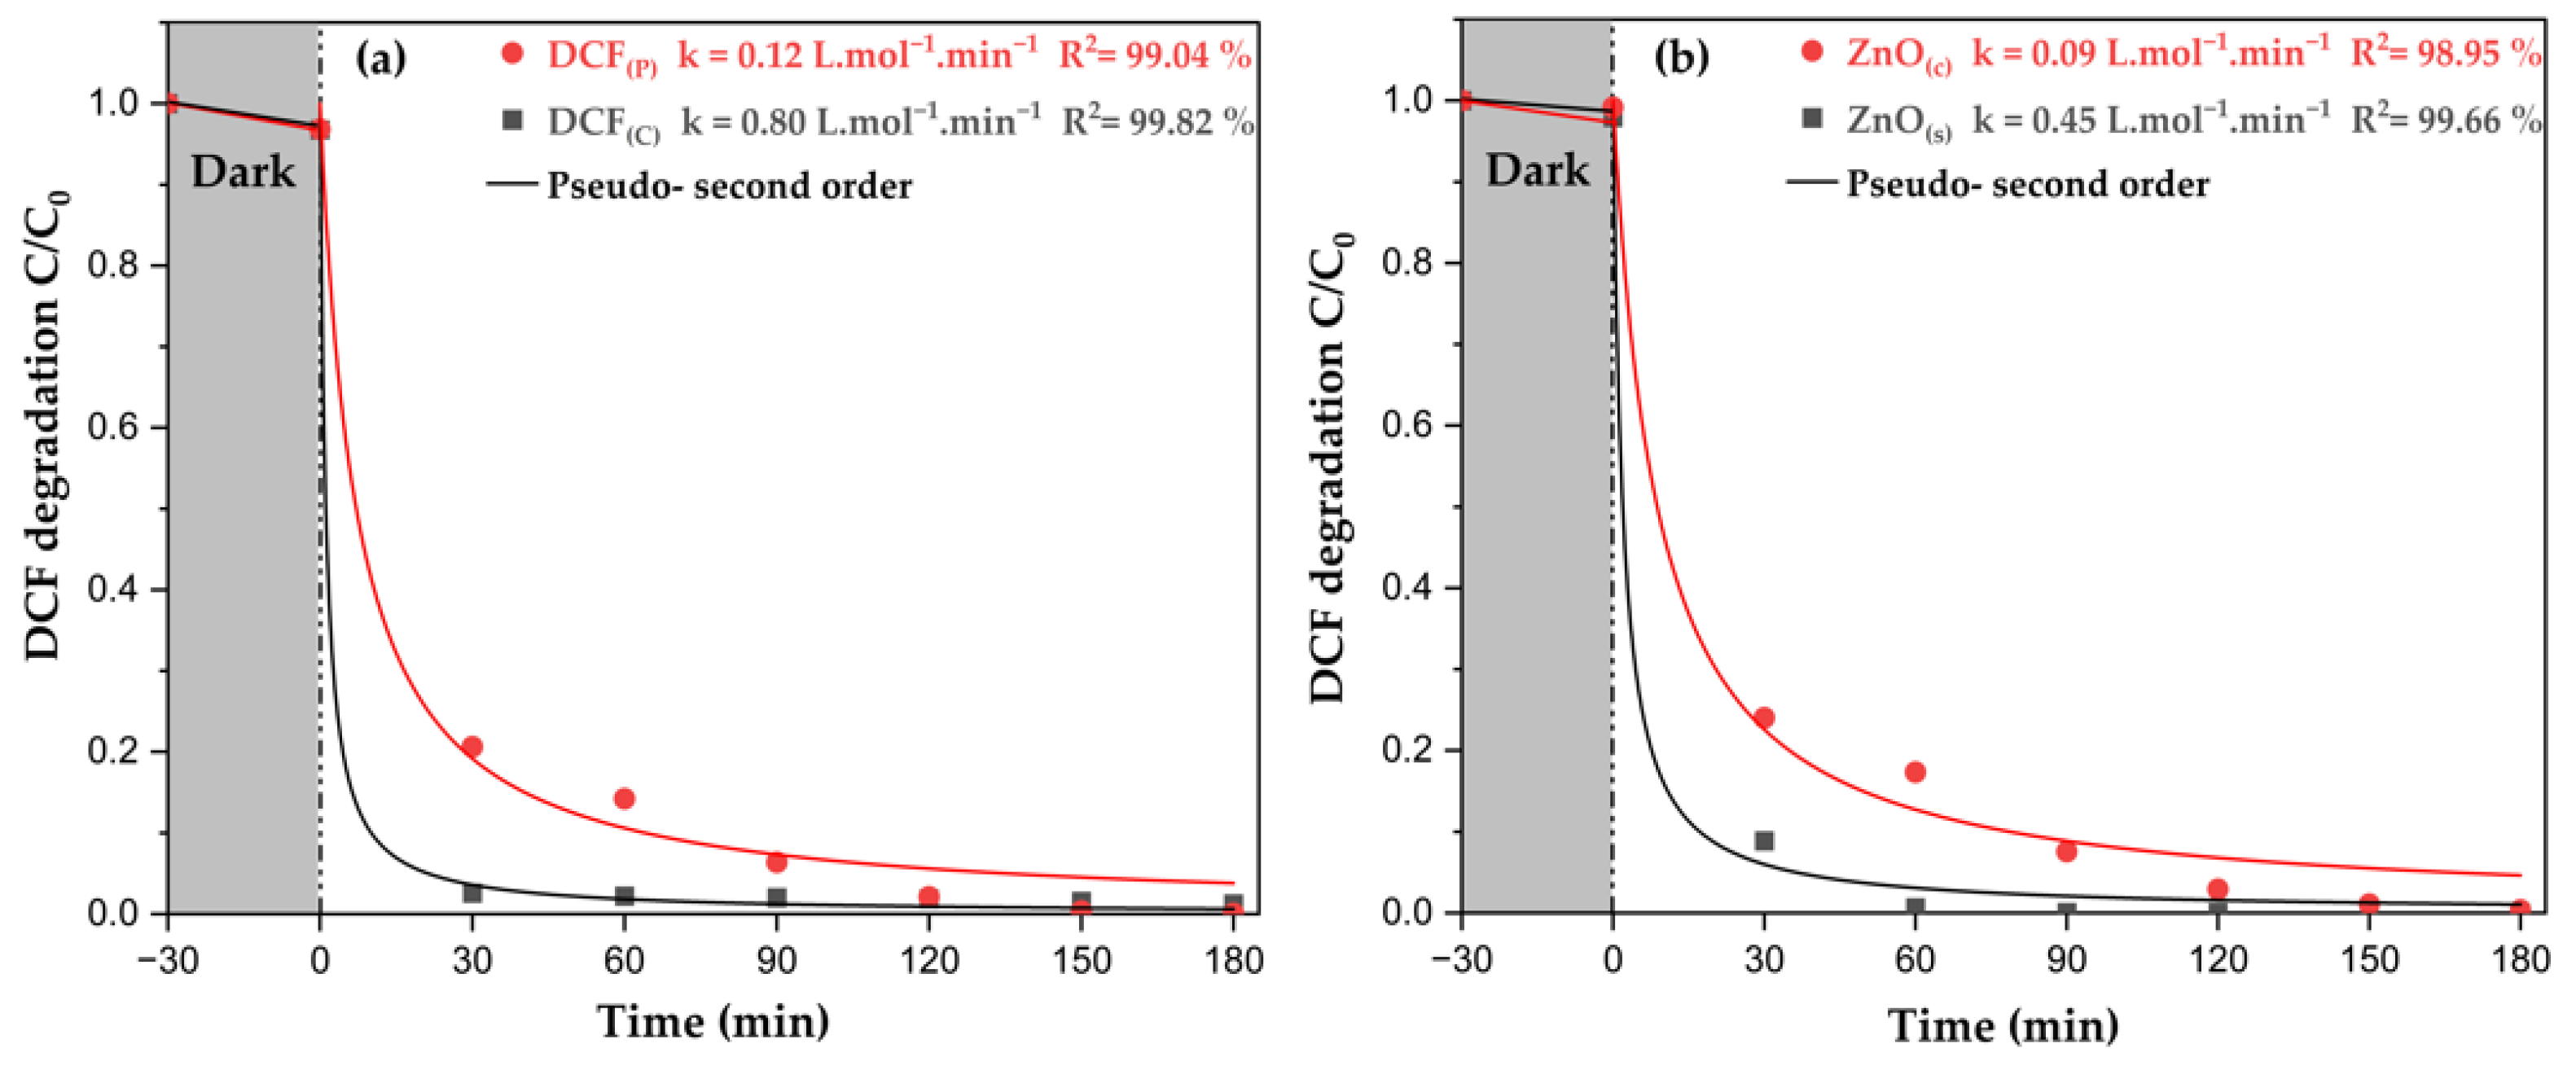
The synthesized ZnO nanoparticles (ZnO(s)) demonstrated remarkable efficacy in degrading both pure (DCF(p)) and commercial (DCF(c)) diclofenac. As shown in Figure 10a, ZnO(s) achieved rapid and substantial degradation, with DCF(c) concentration reduced to nearly zero within the first 30 min (k = 0.80 L·mol−1·min−1, R2 = 99.82%). The degradation of DCF(p) was slightly slower but still significant (k = 0.12 L·mol−1·min−1, R2 = 99.04%), reaching near-complete degradation by 120 min.
For comparison, commercial ZnO catalyst (ZnO(c)) was also evaluated, as shown in Figure 10b. Despite having a higher specific surface area (50 m2/g) compared to the synthesized ZnO, ZnO(c) exhibited lower degradation rates for both pure and commercial diclofenac (k = 0.09 L·mol−1·min−1, R2 = 98.95% for DCF(p) and k = 0.45 L·mol−1·min−1, R2 = 99.66% for DCF(c)).
Both figures illustrate a 30 min dark period before the photodegradation process began, during which minimal degradation occurred. The pseudo-second-order kinetic model fitted well with the experimental data for all cases, as evidenced by the high R2 values.
These results highlight the superior performance of the green-synthesized ZnO nanoparticles, offering promising potential for the efficient degradation of pharmaceutical compounds in wastewater treatment applications.

2.2.6. Determination of Total Organic Carbon (TOC)

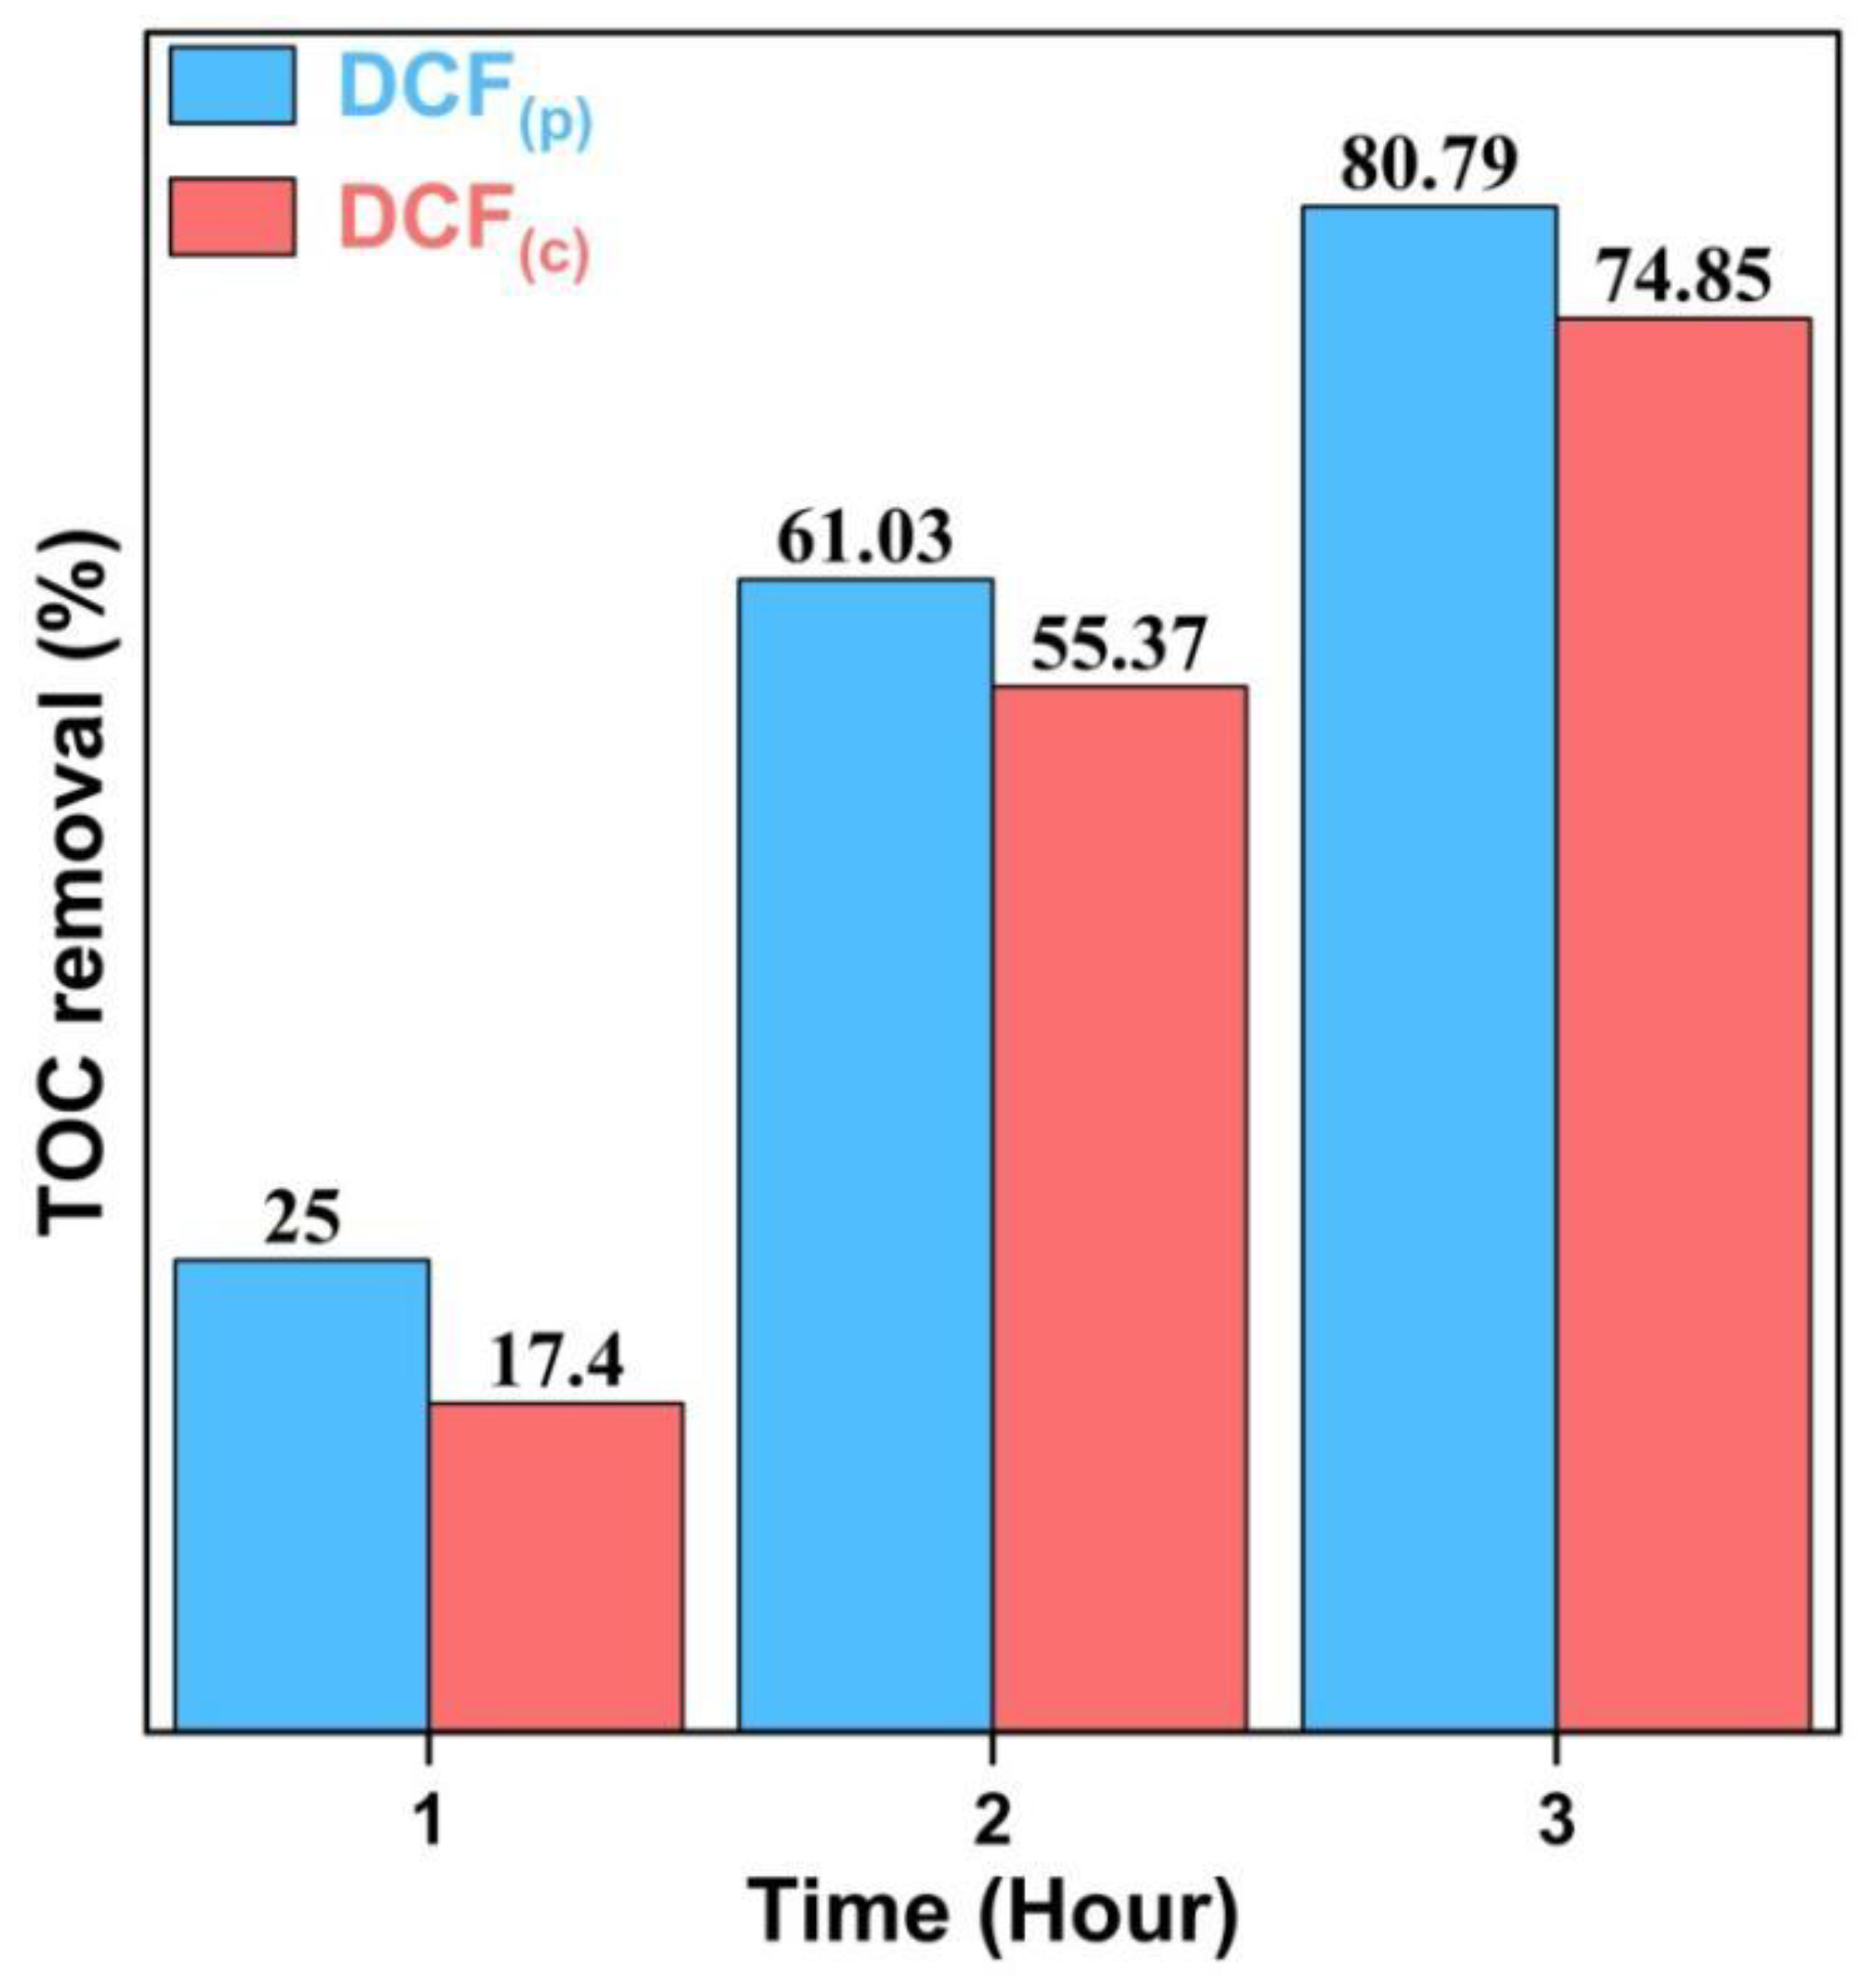
Mineralization results showed that degradation could not exceed 80% due to recalcitrant byproducts [61]. Previous studies noted an average DCF mineralization of around 70% [45]. The persistence of DCF and inactive ingredients in commercial tablets may explain the low TOC results after 3 h of irradiation [60,62]. For the same ZnO amounts, 74.85% mineralization was achieved for the commercial tablet (DCF(c)) compared to 80.79% for the pure compound (DCF(p)) (Figure 11).

2.3. Mechanistic Insights into Diclofenac Photodegradation: LC-MS Analysis and Proposed Degradation Pathways

Despite the complete breakdown of diclofenac (DCF), mineralization of its organic intermediates is not fully accomplished, as indicated by the TOC results. Hence, to determine the elemental composition of the formed degradation products (DP), selected samples of the photodegradation of the DCF sodium salt were analyzed with an ESI-TOF mass spectrometer in ESI +/− ion mode, which recorded the mass-to-charge ratio (m/z) data in high precision of four decimal numbers [63]. However, assessing the degradation process presents challenges not only because of the generation of unpredicted DP complicating their separation, but also the unavailability of commercial standards to confirm their identification [64].
Based on previous findings, we propose a mechanism for DCF degradation over ZnO. Through a thorough literature review, we identified a widely recognized and accepted degradation pathway, as summarized in Figure 12. In fact, the breakdown of DCF by light leads to various degradation products (DP), for which we established chemical formulas and structures. The molecular structures were inferred from accurate mass, fragmentation patterns, and isotopic distributions of 35Cl and 37Cl [65]. Most molecular ion peaks exhibited an isotopic distribution of M, M+2, and M+4 with relative intensities of 9:6:1 ratio, denoting the presence of chlorine atoms.
When the mass spectrometer operated in negative mode (ESI−), a molecular peak [M] of DCF anion was detected at m/z 294.0094. MS investigations in ESI+ mode, with addition of formic acid for analyte protonation, revealed the expected molecular ion [M+2H]+ for DCF at m/z 296.0250. In general, the photodegradation process of this drug is believed to be initiated by the hydroxylation of its aromatic moiety.
Although the exact substitution sites for hydroxylation have not been verified, a limitation noted in other studies [64,66], the high electron density from electron-donating groups with lone pairs (e.g., -OH or -NH2) suggests that •OH may preferentially attack the ortho and para positions of the aromatic rings [67]. For instance, three main hydroxylated derivatives (DP1) were identified, depending on the attack site: 4′-hydroxy-DCF (I), 5-hydroxy-DCF (II), and 3-hydroxy-DCF (III). The MS investigations confirmed the formation of DP1 with m/z at 310.0047, corresponding to the elemental composition [C14H10Cl2NO3] of the three isomers with an exact mass of 310.0043 Da. It is assumed that the formation of the isomer III is less favorable due to the steric hindrance [68]. The benzene ring with a carboxylate group is more electron-rich, compared to the one substituted by two chlorine atoms, making it more susceptible to electrophilic attack by hydroxyl radicals [65]. In fact, a halogen stabilizes the carbocation through resonance, with a more significant effect at the ortho and para positions [69]. However, the inductive effect (-I) is stronger than the resonance effect in this case, leading to overall electron withdrawal and thus net deactivation [70]. In simpler terms, chlorine acts as an electron-withdrawing group (EWG), diminishing the electron density of the aromatic ring and thereby reducing its vulnerability to electrophilic attacks [71]. Based on the electron-donating properties of the -CH2-CO2- group, the aromatic ring with this substituent is more prone to •OH attack [72]. Thus, the isomer II is the most likely hydroxylated metabolite. Its protonated, analogous compound was detected in ESI+ mode at m/z 312.0189.
Additionally, DP1 can transform into 2,5-iminoquinone-DCF (DP2). In this respect, a found accurate mass at m/z 310.0038 is in good agreement with the exact mass of DP2 (310.0032 Da) as [M+2H]+ molecular ion. Detailed MS investigations revealed a compound with accurate m/z of 266.0149 (DP3) exhibiting a mass loss of 43.9898 Da compared to DP1, precisely reflecting the loss of CO2. Subsequent dechlorination and intramolecular cyclization yield a peak at m/z 230.0375 (DP4) which matches the calculated mass of 230.0378 Da with the elemental composition of [C13H10ClNO], as outlined in previous publications [73,74,75].
It is critical to note that the rapid pace of photodegradation makes it challenging to identify some byproducts during the reaction. For instance, the molecular ion at m/z 278.0144 (DP5) diminishes quickly [76]. This intermediate is often linked to DCF synthesis [77] and is associated with dehydration (loss of 18.0106 Da) of the protonated molecular ion [M+2H]+ of DCF (m/z 296.0250) via an alternative pathway, as determined in ESI+ mode (Figure 12, blue pathway). However, DP5 was not detected in ESI− mode under our experimental MS conditions, possibly due to its low negative ionization response. Nevertheless, it has been reported as a degradation product in various studies [57,78,79].
While ESI typically results in mild ionization, significant in-source fragmentation of the parent compound (DCF) produced fragments at m/z 250.0194 and m/z 214.0424 in the spectrum [20]. The third pathway involves the molecular ion peak [M+2H]+ at m/z 242.0820 (DP8), which was assigned to the chlorine-free elemental composition [C14H11NO3]+ with an exact mass of 242.0812 Da. It is assumed that DP8 may arise from the loss of two chloride ions from DCF, followed by hydroxylation and cyclization. This has also been documented in several studies [64,65,80,81].
The irradiation of DCF resulted in the release of chloride anions, evaluated via ion chromatography. It was observed that two moles of Cl were produced for each mole of DCF [61]. The calculated theoretical amount of chloride released, based on the initial DCF concentration, supports the conclusion that the drug was completely dehalogenated, corroborating the presence of dechlorinated intermediates (DP8).
Figure 12 illustrates the proposed chemical structures of the DCF degradation products, highlighting the three pathways and fragmentation process (in red).
Table 3 provides a detailed summary of the identified compounds resulting from DCF photodegradation, including the predicted molecular ion formulas, measured and theoretical m/z values, and mass errors (the difference between calculated and measured values).

2.4. Assessment of Photocatalyst Stability and Reusability Through Multiple Cycles

Assessing the stability and reusability of the photocatalyst is crucial for evaluating its performance. Tests were conducted multiple times under identical conditions (DCF concentration = 100 ppm; catalyst loading = 1.5 g/L) to ensure reproducibility and to accumulate sufficient powder for subsequent cycles. After each experimental run, ZnO was collected, washed with distilled water, dried at 60 °C, and reused.
As shown in Figure 13a, there was no significant decline in the photocatalytic performance of the synthesized ZnO after four cycles, demonstrating its robust stability and reusability. A slight decrease of 3% in degradation efficiency after the fourth cycle may be attributed to the accumulation of intermediates on the photocatalyst surface after each run [46]. Nonetheless, the synthesized ZnO maintained up to 96% of its effectiveness over four cycles. To further substantiate the catalyst’s stability, XRD analysis was performed on the powder after each run, with results displayed in Figure 13b showing unchanged patterns compared to fresh ZnO.

2.5. Photocatalytic Reduction of p-Nitrophenol: Spectral Changes and Degradation Insights

Upon the addition of ZnO, the pale-yellow solution (pH = 5.8) instantly turned to an intense yellow (pH = 7.3). The characteristic peak of p-nitrophenol (PNP) shifted from 317 nm to 400 nm, indicating the conversion of PNP into the p-nitrophenolate ion (PNP) (Figure 14, inset) [82].
A rapid photocatalytic reduction process was observed, as indicated by the consistent decline in the absorption peak at 400 nm (refer to Figure 14). Over the course of three hours of continuous light irradiation, the intensity of this peak diminished markedly, ultimately resulting in a colorless solution. This change confirms the successful degradation of PNP, demonstrating the effectiveness of ZnO as a photocatalyst in this reaction.

2.6. Influence of Trapping Agents on p-Nitrophenol Degradation

When ZnO is exposed to UV light that exceeds its band gap energy, it absorbs photons, promoting electrons from the valence band to the conduction band and generating electron–hole pairs [83]. These pairs migrate to the catalyst surface, where they participate in redox reactions that produce reactive oxygen species, which are crucial for the degradation of p-nitrophenol (PNP). This process can be summarized by the following equations [84]:
ZnO + hν → e + h⁺
e + O2 → •O2
h⁺ + H2O → •OH + H⁺
h⁺ + OH → •OH
•O2 + H⁺ → HO2
2HO2• → H2O2 + O2
H2O2 + e → OH + •OH
The photogenerated electrons interact with molecular oxygen on the surface to produce superoxide radicals (•O2) (Equation (8)) [85]. Simultaneously, holes (h⁺) act as potent oxidizing agents, reacting with adsorbed water molecules (Equation (9)) and hydroxyl ions (Equation (10)) to generate hydroxyl radicals (•OH) [86]. Additionally, H⁺ and •O2 in the solution can recombine to form more hydroxyl radicals (Equations (11)–(13)). These oxidizing agents facilitate the breakdown of PNP molecules into simpler intermediates, ultimately converting them into CO2 and H2O [87].
To identify the active species involved in the PNP degradation process, various trapping agents were utilized, including sodium sulfite (Na2SO3), silver nitrate (AgNO3), tertiary butyl alcohol (TBA), and benzoquinone (BQ). These agents serve as scavengers for h⁺, e, •OH, and •O2, respectively.
As illustrated in Figure 15, the degradation efficiency of PNP sharply declined with the use of TBA, while the first two scavengers had minimal impact. Notably, the introduction of BQ significantly inhibited PNP decomposition, suggesting that hydroxyl radicals (•OH) are the dominant reactive species in the photocatalytic process, with superoxide (•O2) playing a lesser role.
Despite the differences in the experimental conditions, which made it challenging to compare the results, we were able to align our findings with the published studies. When applying the same mass ratio of catalyst and pollutant, our synthesized ZnO showed the best photocatalytic performance compared to the previously reported materials, as shown in Table 4.

3. Experimental

3.1. Materials and Reagents

Zinc acetate dihydrate (Zn(CH3CO2)2•2H2O, LobaChemie, Mumbai, India, ≥98%) was utilized without prior purification. Chia seeds were sourced from a local market in Gabès, Tunisia. Distilled water was employed throughout the experimentation process.

3.2. Preparation of the Natural Surfactant Extract

The extraction method was based on a previously reported procedure with slight modifications (Scheme 1) [38]. Chia seeds were thoroughly washed with distilled water and sun-dried for several days. After drying, they were ground in a kitchen blender for a few minutes. One gram of the seeds was mixed with 100 mL of distilled water and stirred vigorously for 2 h at 60 °C. The resulting brownish extract (pH = 6) was refined and stored at 4 °C overnight.

3.3. Synthesis of ZnO Nanoparticles

The synthesis procedure is depicted in Scheme 2. A solution of Zn(CH3CO2)2•2H2O (1 M, 60 mL) was prepared as solution 1. Solution 2, consisting of 50 mL of the prepared chia seed extract, was gradually added while stirring vigorously for 9 h at 80 °C. The resultant brownish-gray paste was dried overnight at 80 °C to remove residual moisture, followed by calcination at 400 °C for 2 h, yielding 4.4 g (92%) of ZnO as an off-white powder (EA: 76 wt% Zn; C and H < 0.5 wt%).

3.4. Characterization Techniques

The crystal phase of the synthesized ZnO nanoparticles was verified using X-ray diffraction (XRD) analysis on a Bruker D8 Advance instrument (Billerica, MA, USA). The instrument operated with a Cu Kα anode at 40 kV and 40 mA, with a wavelength of λ = 0.15406 nm.
Morphological and elemental composition analyses of the nanopowder were conducted using a Zeiss Merlin VP compact scanning electron microscope (SEM) (Zeiss, Oberkochen, Germany) equipped with energy-dispersive X-ray spectroscopy (EDX).
The UV–vis spectrum was obtained through diffuse reflectance spectroscopy on a Lambda 365 UV/vis instrument (PerkinElmer, Waltham, MA, USA), covering a spectral range of 200 to 800 nm, with BaSO₄ used as a reference material.
Surface characteristics of the zinc oxide nanoparticles were determined via Brunauer–Emmett–Teller (BET) analysis using a NOVAtouch LX4 instrument (Quantachrome Instruments, Boynton Beach, FL, USA), with specific surface area calculated using the multipoint method. Before conducting the measurements, the as-synthesized and calcined samples were degassed at 50 °C for 2 h and 350 °C for 5 h, respectively. The determination of carbon, hydrogen, nitrogen, and sulfur content in both the as-synthesized and calcined products, as well as in the chia seed extract, was performed using a TruSpec Micro elemental analyzer (Leco, St. Joseph, MO, USA). Zinc quantification was carried out using Atomic Absorption Spectroscopy (AAS) with an Analytik Jena contrAA 800D (Analytik Jena, Jena, Germany).

3.5. Photocatalytic Activity Assessment
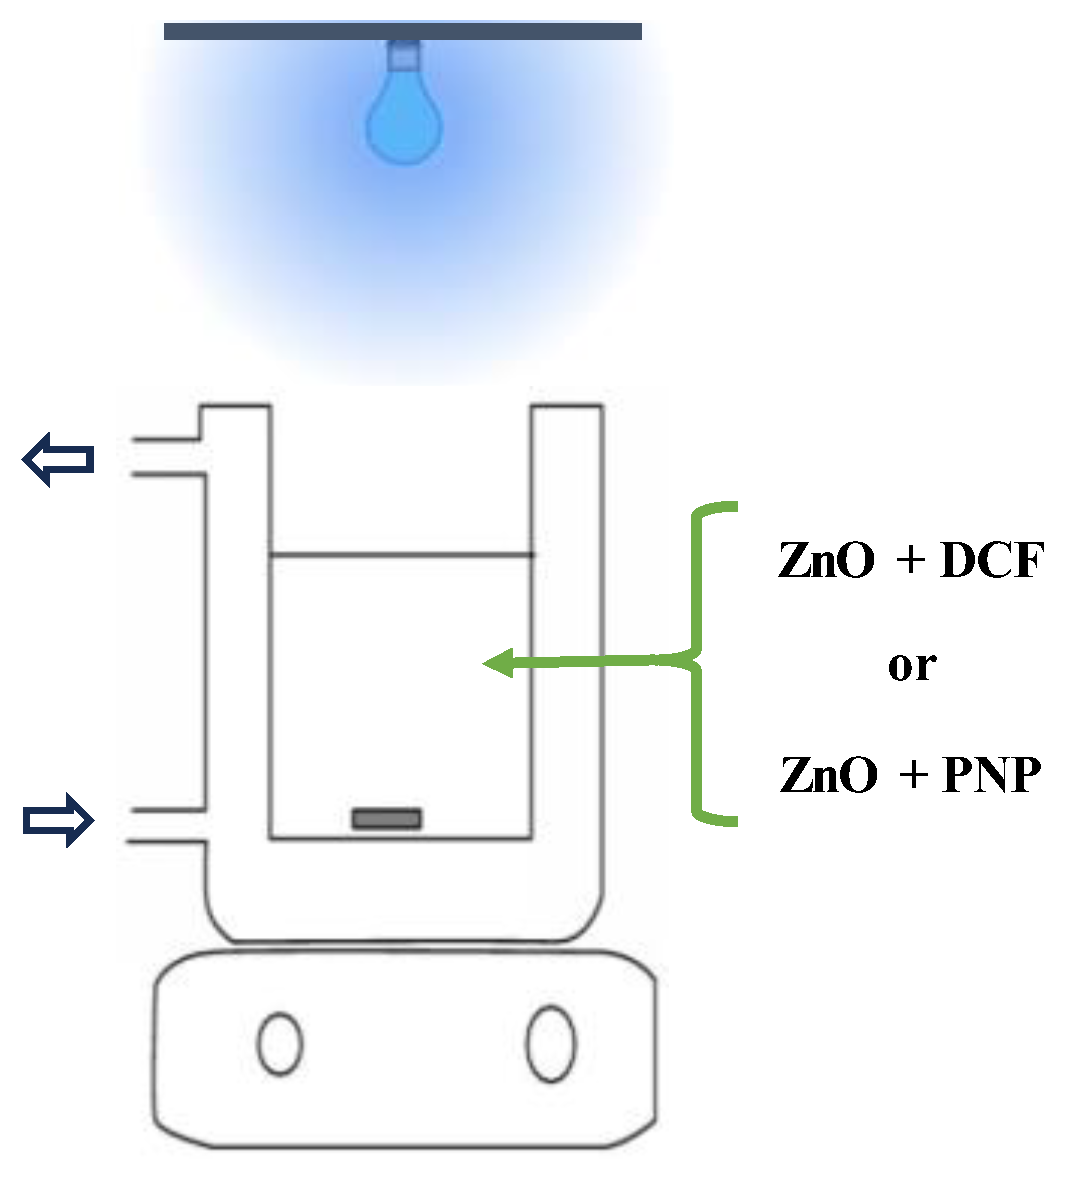
The photocatalytic efficiency of the ZnO nanopowder was assessed through the degradation of DCF and PNP under UV-LED irradiation. For DCF degradation, 10 mg of ZnO NPs was dispersed in a 20 mL aqueous solution of commercial DCF (100 ppm) within a double-jacketed glass reactor equipped with a cooling system. The mixture was stirred at 500 rpm in darkness for 30 min to establish adsorption–desorption equilibrium. Following this, the reactor was exposed to UV-LED light (λ = 365 nm, 40 mW/cm2) at a distance of 5 cm for 3 h (Scheme 3). Aliquots of 0.6 mL were extracted every 30 min, filtered through a 0.22 µm syringe filter, and analyzed using high-performance liquid chromatography (HPLC) on an Agilent Technologies 1260 Infinity Series instrument. The mobile phase consisted of a mixture of water and acetonitrile with 0.05% trifluoroacetic acid (60:40, v/v) at 40 °C and a flow rate of 0.6 mL/min. Degradation efficiency (%) was calculated using the following formula:
D e g r a d a t i o n   e f f i c i e n c y   ( % ) = C 0 C C 0 × 100
The mineralization percentage of the effluent’s photodegradation was evaluated by measuring the total organic carbon (TOC) concentration after 3 h using a multi N/C 3100 analyzer (Analytik Jena, Jena, Germany). TOC conversion was calculated as follows:
TOC   % = TOC 0 TOC TOC 0   ×   100
To further evaluate the photocatalytic performance of ZnO NPs, kinetic studies were conducted by varying the catalyst concentration between 0.5 and 5 g/L and measuring the degradation rate after a set contact time with DCF. Freshly prepared drug solutions were used for each experiment to avoid any chemical or photochemical changes.
The byproducts and intermediates of the degradation mechanism were analyzed using an Agilent 1260/6130 Quadrupole LC-MS with electrospray ionization (ESI) in both positive (ESI (+)) and negative (ESI (−)) modes. The sampling cone voltage was adjusted from 30 to 150 V to optimize the m/z abundance for accurate mass measurements of deprotonated molecules and fragment ions. Detection of products was conducted using a Time-of-Flight (ToF) high-resolution mass analyzer. Measurements were repeated multiple times to ensure accuracy. Additionally, chloride ions released from DCF during the reaction were quantified using anion exchange chromatography with a LaChrom system from Merck–Hitachi, equipped with a PRP-X100 column (Hamilton, Reno, NV, USA).
The procedure for DCF degradation was similarly applied to PNP degradation with slight modifications. For PNP degradation, 20 mg of ZnO NPs was added to a 25 mL aqueous solution of PNP (20 ppm), resulting in a color change from light to intense yellow. Final quantification of degradation was monitored via UV–vis spectroscopy (PerkinElmer, Waltham, MA, USA) by recording the absorbance of PNP at λ = 400 nm. A trapping experiment was conducted using four different scavengers to identify the key reactive oxygen species involved in the photodegradation of PNP.
Scheme 3. Photocatalytic experiment.
Catalysts 15 00004 sch003

4. Conclusions

The synthesis of zinc oxide nanoparticles (ZnO NPs) through a straightforward precipitation method, utilizing a green surfactant derived from chia seeds, successfully produced nanoparticles with both quasi-spherical and rod-like morphologies. Characterization techniques revealed an average crystallite size of approximately 27 nm, indicating the formation of nanoscale materials that are advantageous for various applications, particularly in photocatalysis.
The photocatalytic efficacy of the synthesized ZnO NPs was demonstrated through the degradation of diclofenac (DCF) and p-nitrophenol (PNP), achieving remarkable removal rates of 99.52% and 98%, respectively, within a 3 h exposure period. These results highlight the potential of the synthesized ZnO NPs as an effective catalyst for the degradation of toxic organic compounds and pharmaceutical pollutants, contributing to environmental remediation efforts.
Importantly, the synthesis process employed fewer chemicals, aligning with green chemistry principles, and promoting sustainability. The use of a natural surfactant not only enhances the eco-friendliness of the method but also contributes to the overall efficiency of the nanoparticle production. This work underscores the promising application of green-synthesized ZnO nanoparticles in wastewater treatment and environmental protection, paving the way for future research into optimizing their photocatalytic performance and investigating their long-term stability and reusability in practical applications.

Author Contributions

Conceptualization, Y.O.D., T.P., and A.H.; methodology, Y.O.D.; validation, Y.O.D., M.S., and T.P.; formal analysis, Y.O.D., M.S., and A.H.; investigation, Y.O.D., M.S., T.P., and A.H.; writing—original draft preparation, Y.O.D., T.P., and A.H.; writing—review and editing, Y.O.D., T.P., M.S., A.H., and J.S.; supervision, A.H., T.P., and J.S.; project administration, A.H. and T.P.; funding acquisition, A.H. and J.S. All authors have read and agreed to the published version of the manuscript.

Funding

This research was funded by a mobility scholarship from the University of Gabès, Tunisia.

Data Availability Statement

All data are present within the manuscript.

Acknowledgments

The analytical department of LIKAT is gratefully acknowledged. The authors thank Armin Springer (EMZ Rostock) for SEM investigations, Marcus Klahn (LIKAT) and Norbert Steinfeldt (LIKAT) for their appreciated help.

Conflicts of Interest

The authors declare no conflicts of interest.

References

  1. Zhang, Y.; Poon, K.; Masonsong, G.S.P.; Ramaswamy, Y.; Singh, G. Sustainable Nanomaterials for Biomedical Applications. Pharmaceutics 2023, 15, 922. [Google Scholar] [CrossRef]
  2. Singh, H.; Desimone, M.F.; Pandya, S.; Jasani, S.; George, N.; Adnan, M.; Aldarhami, A.; Bazaid, A.S.; Alderhami, S.A. Revisiting the Green Synthesis of Nanoparticles: Uncovering Influences of Plant Extracts as Reducing Agents for Enhanced Synthesis Efficiency and Its Biomedical Applications. Int. J. Nanomed. 2023, 18, 4727–4750. [Google Scholar] [CrossRef] [PubMed]
  3. Kulkarni, D.; Sherkar, R.; Shirsathe, C.; Sonwane, R.; Varpe, N.; Shelke, S.; More, M.P.; Pardeshi, S.R.; Dhaneshwar, G.; Junnuthula, V.; et al. Biofabrication of nanoparticles: Sources, synthesis, and biomedical applications. Front. Bioeng. Biotechnol. 2023, 11, 1159193. [Google Scholar] [CrossRef]
  4. Abuzeid, H.M.; Julien, C.M.; Zhu, L.; Hashem, A.M. Green Synthesis of Nanoparticles and Their Energy Storage, Environmental, and Biomedical Applications. Crystals 2023, 13, 1576. [Google Scholar] [CrossRef]
  5. Osman, A.I.; Zhang, Y.; Farghali, M.; Rashwan, A.K.; Eltaweil, A.S.; Abd El-Monaem, E.M.; Mohamed, I.M.A.; Badr, M.M.; Ihara, I.; Rooney, D.W.; et al. Synthesis of green nanoparticles for energy, biomedical, environmental, agricultural, and food applications: A review. Environ. Chem. Lett. 2024, 22, 841–887. [Google Scholar] [CrossRef]
  6. Raveendran, P.; Fu, J.; Wallen, S.L. Completely “Green” Synthesis and Stabilization of Metal Nanoparticles. J. Am. Chem. Soc. 2003, 125, 13940–13941. [Google Scholar] [CrossRef] [PubMed]
  7. Venkatpurwar, V.; Pokharkar, V. Green synthesis of silver nanoparticles using marine polysaccharide: Study of in-vitro antibacterial activity. Mat. Lett. 2011, 65, 999–1002. [Google Scholar] [CrossRef]
  8. Campos, J.M.; Montenegro Stamford, T.L.; Sarubbo, L.A.; de Luna, J.M.; Rufino, R.D.; Banat, I.M. Microbial biosurfactants as additives for food industries. Biotech. Prog. 2013, 29, 1097–1108. [Google Scholar] [CrossRef]
  9. Ramesh, M.; Anbuvannan, M.; Viruthagiri, G. Green synthesis of ZnO nanoparticles using Solanum nigrum leaf extract and their antibacterial activity. Spectrochim. Acta Part A Mol. Biomol. Spectrosc. 2015, 136, 864–870. [Google Scholar] [CrossRef] [PubMed]
  10. Ambika, S.; Sundrarajan, M. Green biosynthesis of ZnO nanoparticles using Vitex negundo L. extract: Spectroscopic investigation of interaction between ZnO nanoparticles and human serum albumin. J. Photochem. Photobio. B Bio. 2015, 149, 143–148. [Google Scholar] [CrossRef] [PubMed]
  11. Siripireddy, B.; Mandal, B.K. Facile green synthesis of zinc oxide nanoparticles by Eucalyptus globulus and their photocatalytic and antioxidant activity. Adv. Powder Technol. 2017, 28, 785–797. [Google Scholar] [CrossRef]
  12. Dobrucka, R.; Długaszewska, J. Biosynthesis and antibacterial activity of ZnO nanoparticles using Trifolium pratense flower extract. Saudi J. Biol. Sci. 2016, 23, 517–523. [Google Scholar] [CrossRef]
  13. Dehghani, F.; Mosleh-Shirazi, S.; Shafiee, M.; Kasaee, S.R.; Amani, A.M. Antiviral and antioxidant properties of green synthesized gold nanoparticles using Glaucium flavum leaf extract. Appl. Nanosci. 2023, 13, 4395–4405. [Google Scholar] [CrossRef] [PubMed]
  14. Wasilewska, A.; Klekotka, U.; Zambrzycka, M.; Zambrowski, G.; Święcicka, I.; Kalska-Szostko, B. Physico-chemical properties and antimicrobial activity of silver nanoparticles fabricated by green synthesis. Food Chem. 2023, 400, 133960. [Google Scholar] [CrossRef] [PubMed]
  15. Abed, M.A.; Jassim, S.M.; Hameed, I.A.; Mohammed, S.B. Physical properties and antibacterial activity of green-iron oxide nanoparticles synthesize with chia seeds. Chem. Data Col. 2023, 44, 101013. [Google Scholar] [CrossRef]
  16. Akintelu, S.A.; Folorunso, A.S. A Review on Green Synthesis of Zinc Oxide Nanoparticles Using Plant Extracts and Its Biomedical Applications. BioNanoScience 2020, 10, 848–863. [Google Scholar] [CrossRef]
  17. Aleman-Ramirez, J.L.; Moreira, J.; Torres-Arellano, S.; Longoria, A.; Okoye, P.U.; Sebastian, P.J. Preparation of a heterogeneous catalyst from moringa leaves as a sustainable precursor for biodiesel production. Fuel 2021, 284, 118983. [Google Scholar] [CrossRef]
  18. Becerra-Paniagua, D.K.; Torres-Arellano, S.; Martinez-Alonso, C.; Luévano-Hipólito, E.; Sebastian, P.J. Facile and green synthesis of Cu/Cu2O composite for photocatalytic H2 generation. Mat. Sci. Semicond. Proc. 2023, 162, 107485. [Google Scholar] [CrossRef]
  19. Ramesh, P.; Rajendran, A. Photocatalytic dye degradation activities of green synthesis of cuprous oxide nanoparticles from Sargassum wightii extract. Chem. Phys. Impact 2023, 6, 100208. [Google Scholar] [CrossRef]
  20. Kovacic, M.; Juretic Perisic, D.; Biosic, M.; Kusic, H.; Babic, S.; Loncaric Bozic, A. UV photolysis of diclofenac in water; kinetics, degradation pathway and environmental aspects. Environ. Sci. Pollut. Res. 2016, 23, 14908–14917. [Google Scholar] [CrossRef] [PubMed]
  21. Lu, F.; Astruc, D. Nanocatalysts and other nanomaterials for water remediation from organic pollutants. Coord. Chem. Rev. 2020, 408, 213180. [Google Scholar] [CrossRef]
  22. Tanveer, M.; Tezcanli, G.; Sadiq, M.T.; Kazmi, S.M.; Noshad, N.; Abbas, G.; Ali, A. Degradation of Diclofenac under Irradiation of UV Lamp and Solar Light Using ZnO Photo Catalyst. Eng. Proc. 2021, 12, 76. [Google Scholar]
  23. Wojcieszyńska, D.; Łagoda, K.; Guzik, U. Diclofenac Biodegradation by Microorganisms and with Immobilised Systems—A Review. Catalysts 2023, 13, 412. [Google Scholar] [CrossRef]
  24. Sacher, F.; Lange, F.T.; Brauch, H.-J.; Blankenhorn, I. Pharmaceuticals in groundwaters: Analytical methods and results of a monitoring program in Baden-Württemberg, Germany. J. Chromatogr. A 2001, 938, 199–210. [Google Scholar] [CrossRef] [PubMed]
  25. Arnold, K.E.; Brown, A.R.; Ankley, G.T.; Sumpter, J.P. Medicating the environment: Assessing risks of pharmaceuticals to wildlife and ecosystems. Phil. Trans. Roy. Soc. B Bio. Sci. 2014, 369, 20130569. [Google Scholar] [CrossRef]
  26. Triebskorn, R.; Casper, H.; Heyd, A.; Eikemper, R.; Köhler, H.R.; Schwaiger, J. Toxic effects of the non-steroidal anti-inflammatory drug diclofenac: Part II. Cytological effects in liver, kidney, gills and intestine of rainbow trout (Oncorhynchus mykiss). Aquat. Toxicol. 2004, 68, 151–166. [Google Scholar] [CrossRef]
  27. Das, T.K.; Das, N.C. Advances on catalytic reduction of 4-nitrophenol by nanostructured materials as benchmark reaction. Int. Nano Lett. 2022, 12, 223–242. [Google Scholar] [CrossRef]
  28. Kassem, A.A.; Abdelhamid, H.N.; Fouad, D.M.; Ibrahim, S.A. Catalytic reduction of 4-nitrophenol using copper terephthalate frameworks and CuO@C composite. J. Environ. Chem. Eng. 2021, 9, 104401. [Google Scholar] [CrossRef]
  29. Velempini, T.; Prabakaran, E.; Pillay, K. Recent developments in the use of metal oxides for photocatalytic degradation of pharmaceutical pollutants in water—A review. Mat. Today Chem. 2021, 19, 100380. [Google Scholar] [CrossRef]
  30. Karthikeyan, C.; Arunachalam, P.; Ramachandran, K.; Al-Mayouf, A.M.; Karuppuchamy, S. Recent advances in semiconductor metal oxides with enhanced methods for solar photocatalytic applications. J. Alloys Compd. 2020, 828, 154281. [Google Scholar] [CrossRef]
  31. Rasool, A.; Kiran, S.; Gulzar, T.; Abrar, S.; Ghaffar, A.; Shahid, M.; Nosheen, S.; Naz, S. Biogenic synthesis and characterization of ZnO nanoparticles for degradation of synthetic dyes: A sustainable environmental cleaner approach. J. Clean. Prod. 2023, 398, 136616. [Google Scholar] [CrossRef]
  32. Sanjeev, N.O.; Valsan, A.E. Photocatalytic and antibacterial activity of green synthesized and immobilized zinc oxide nanoparticles for the removal of sulfadiazine and acetaminophen: Effect of operational parameters and degradation pathway. J. Environ. Chem. Eng. 2024, 12, 112649. [Google Scholar] [CrossRef]
  33. Marcì, G.; Augugliaro, V.; López-Muñoz, M.J.; Martín, C.; Palmisano, L.; Rives, V.; Schiavello, M.; Tilley, R.J.D.; Venezia, A.M. Preparation Characterization and Photocatalytic Activity of Polycrystalline ZnO/TiO2 Systems. 2. Surface, Bulk Characterization, and 4-Nitrophenol Photodegradation in Liquid−Solid Regime. J. Phys. Chem. B 2001, 105, 1033–1040. [Google Scholar] [CrossRef]
  34. Lizama, C.; Freer, J.; Baeza, J.; Mansilla, H.D. Optimized photodegradation of Reactive Blue 19 on TiO2 and ZnO suspensions. Catal. Today 2002, 76, 235–246. [Google Scholar] [CrossRef]
  35. Lathasree, S.; Rao, A.N.; SivaSankar, B.; Sadasivam, V.; Rengaraj, K. Heterogeneous photocatalytic mineralisation of phenols in aqueous solutions. J. Mol. Catal. A Chem. 2004, 223, 101–105. [Google Scholar] [CrossRef]
  36. Dindar, B.; Içli, S. Unusual photoreactivity of zinc oxide irradiated by concentrated sunlight. J. Photochem. Photobiol. A Chem. 2001, 140, 263–268. [Google Scholar] [CrossRef]
  37. Zeghoud, S.; Hemmami, H.; Ben Seghir, B.; Ben Amor, I.; Kouadri, I.; Rebiai, A.; Messaoudi, M.; Ahmed, S.; Pohl, P.; Simal-Gandara, J. A review on biogenic green synthesis of ZnO nanoparticles by plant biomass and their applications. Mater. Today Commun. 2022, 33, 104747. [Google Scholar] [CrossRef]
  38. Sabouri, Z.; Rangrazi, A.; Amiri, M.S.; Khatami, M.; Darroudi, M. Green synthesis of nickel oxide nanoparticles using Salvia hispanica L. (chia) seeds extract and studies of their photocatalytic activity and cytotoxicity effects. Bioprocess Biosyst. Eng. 2021, 44, 2407–2415. [Google Scholar] [CrossRef] [PubMed]
  39. Anjali; Anita; Thakur, V.; Narula, D.; Sharma, A.; Kaur, M.; Sharma, P. Investigation on green synthesized nanocomposites of magnetite using Salvia hispanica for antibacterial activity. Mat. Tod. Proc. 2023. [Google Scholar] [CrossRef]
  40. Chérif, I.; Dkhil, Y.O.; Smaoui, S.; Elhadef, K.; Ferhi, M.; Ammar, S. X-Ray Diffraction Analysis by Modified Scherrer, Williamson–Hall and Size–Strain Plot Methods of ZnO Nanocrystals Synthesized by Oxalate Route: A Potential Antimicrobial Candidate Against Foodborne Pathogens. J. Clust. Sci. 2023, 34, 623–638. [Google Scholar] [CrossRef]
  41. Jurablu, S.; Farahmandjou, M.; Firoozabadi, T.P. Sol-Gel Synthesis of Zinc Oxide (ZnO) Nanoparticles: Study of Structural and Optical Properties. J. Sci. Islam. Repub. Iran 2015, 26, 281–285. [Google Scholar]
  42. Verma, M.; Mitan, M.; Kim, H.; Vaya, D. Efficient photocatalytic degradation of Malachite green dye using facilely synthesized cobalt oxide nanomaterials using citric acid and oleic acid. J. Phys. Chem. Solids 2021, 155, 110125. [Google Scholar] [CrossRef]
  43. Hernández-Morales, L.; Espinoza-Gómez, H.; Flores-López, L.Z.; Sotelo-Barrera, E.L.; Núñez-Rivera, A.; Cadena-Nava, R.D.; Alonso-Núñez, G.; Espinoza, K.A. Study of the green synthesis of silver nanoparticles using a natural extract of dark or white Salvia hispanica L. seeds and their antibacterial application. Appl. Surf. Sci. 2019, 489, 952–961. [Google Scholar] [CrossRef]
  44. Aydın, C.; Abd El-sadek, M.S.; Zheng, K.; Yahia, I.S.; Yakuphanoglu, F. Synthesis, diffused reflectance and electrical properties of nanocrystalline Fe-doped ZnO via sol–gel calcination technique. Opt. Las. Technol. 2013, 48, 447–452. [Google Scholar] [CrossRef]
  45. Estrada-Urbina, J.; Cruz-Alonso, A.; Santander-González, M.; Méndez-Albores, A.; Vázquez-Durán, A. Nanoscale Zinc Oxide Particles for Improving the Physiological and Sanitary Quality of a Mexican Landrace of Red Maize. Nanomaterials 2018, 8, 247. [Google Scholar] [CrossRef]
  46. Al-Harby, N.F.; Albahly, E.F.; Mohamed, N.A. Kinetics, Isotherm and Thermodynamic Studies for Efficient Adsorption of Congo Red Dye from Aqueous Solution onto Novel Cyanoguanidine-Modified Chitosan Adsorbent. Polymers 2021, 13, 4446. [Google Scholar] [CrossRef] [PubMed]
  47. Ojedokun, A.T.; Bello, O.S. Kinetic modeling of liquid-phase adsorption of Congo red dye using guava leaf-based activated carbon. Appl. Water Sci. 2017, 7, 1965–1977. [Google Scholar] [CrossRef]
  48. Liang, S.; Wang, K.; Wang, K.; Wang, T.; Guo, C.; Wang, W.; Wang, J. Adsorption Behavior of Diclofenac on Polystyrene and Poly(butylene adipate-co-terephthalate) Microplastics: Influencing Factors and Adsorption Mechanism. Langmuir 2023, 39, 12216–12225. [Google Scholar] [CrossRef]
  49. Awang, H.; Peppel, T.; Strunk, J. Photocatalytic Degradation of Diclofenac by Nitrogen-Doped Carbon Quantum Dot-Graphitic Carbon Nitride (CNQD). Catalysts 2023, 13, 735. [Google Scholar] [CrossRef]
  50. Wang, Y.; Yang, C.; Liu, Y.; Fan, Y.; Dang, F.; Qiu, Y.; Zhou, H.; Wang, W.; Liu, Y. Solvothermal Synthesis of ZnO Nanoparticles for Photocatalytic Degradation of Methyl Orange and p-Nitrophenol. Water 2021, 13, 3224. [Google Scholar] [CrossRef]
  51. Mozia, S. Photocatalytic membrane reactors (PMRs) in water and wastewater treatment. A review. Sep. Purif. Technol. 2010, 73, 71–91. [Google Scholar] [CrossRef]
  52. Gogate, P.R.; Pandit, A.B. A review of imperative technologies for wastewater treatment I: Oxidation technologies at ambient conditions. Adv. Environ. Res. 2004, 8, 501–551. [Google Scholar] [CrossRef]
  53. Kadam, V.V.; Shanmugam, S.D.; Ettiyappan, J.P.; Balakrishnan, R.M. Photocatalytic degradation of p-nitrophenol using biologically synthesized ZnO nanoparticles. Environ. Sci. Pollut. Res. 2021, 28, 12119–12130. [Google Scholar] [CrossRef] [PubMed]
  54. Tewari, B.B.; Boodhoo, M. Removal of p-aminophenol and p-nitrophenol from aqueous solution through adsorption on antimony, cadmium, and zirconium ferrocyanides. J. Colloid Interface Sci. 2005, 289, 328–332. [Google Scholar] [CrossRef] [PubMed]
  55. Marsalek, R. Particle Size and Zeta Potential of ZnO. APCBEE Procedia 2014, 9, 13–17. [Google Scholar] [CrossRef]
  56. Badawy, M.I.; Souaya, E.M.R.; Gad-Allah, T.A.; Abdel-Wahed, M.S.; Ulbricht, M. Fabrication of Ag/TiO2 photocatalyst for the treatment of simulated hospital wastewater under sunlight. Environ. Prog. Sus. Energy 2014, 33, 886–894. [Google Scholar] [CrossRef]
  57. Qutob, M.; Alshehri, S.; Shakeel, F.; Alam, P.; Rafatullah, M. Insight into Photodegradation of Diclofenac: Mechanism, Efficiency, Role of Parameters, Toxicity Assessment and Catalyst Stability. Rev. Environ. Contam. Toxicol. 2023, 261, 27. [Google Scholar] [CrossRef]
  58. Mugunthan, E.; Saidutta, M.B.; Jagadeeshbabu, P.E. Photocatalytic activity of ZnO-WO3 for diclofenac degradation under visible light irradiation. J. Photochem. Photobio. A Chem. 2019, 383, 111993. [Google Scholar] [CrossRef]
  59. Bhalkaran, S.; Tewari, B.B. Interacción of 2-aminophenol, 4-aminophenol, 2-nitrophenol and 4-nitrophenol with manganese and nickel hexacyanoferrate (II) complexes. Rev. Boliv. Química 2016, 33, 164–173. [Google Scholar]
  60. Packer, J.L.; Werner, J.J.; Latch, D.E.; McNeill, K.; Arnold, W.A. Photochemical fate of pharmaceuticals in the environment: Naproxen, diclofenac, clofibric acid, and ibuprofen. Aquat. Sci. 2003, 65, 342–351. [Google Scholar] [CrossRef]
  61. Cordero-García, A.; Turnes Palomino, G.; Hinojosa-Reyes, L.; Guzmán-Mar, J.L.; Maya-Teviño, L.; Hernández-Ramírez, A. Photocatalytic behaviour of WO3/TiO2-N for diclofenac degradation using simulated solar radiation as an activation source. Environ. Sci. Pollut. Res. 2017, 24, 4613–4624. [Google Scholar] [CrossRef] [PubMed]
  62. Aurora-Prado, M.; Steppe, M.; Tavares, M.; Kedor-Hackmann, E.; Santoro, M. Comparison between capillary electrophoresis and liquid chromatography for the determination of diclofenac sodium in a pharmaceutical tablet. J. AOAC Int. 2002, 85, 333–340. [Google Scholar] [PubMed]
  63. Coelho, A.D.; Sans, C.; Agüera, A.; Gómez, M.J.; Esplugas, S.; Dezotti, M. Effects of ozone pre-treatment on diclofenac: Intermediates, biodegradability and toxicity assessment. Sci. Total Environ. 2009, 407, 3572–3578. [Google Scholar] [CrossRef]
  64. Agüera, A.; Pérez Estrada, L.A.; Ferrer, I.; Thurman, E.M.; Malato, S.; Fernández-Alba, A.R. Application of time-of-flight mass spectrometry to the analysis of phototransformation products of diclofenac in water under natural sunlight. J. Mass Spect. 2005, 40, 908–915. [Google Scholar] [CrossRef] [PubMed]
  65. Rao, Y.; Zhang, Y.; Han, F.; Guo, H.; Huang, Y.; Li, R.; Qi, F.; Ma, J. Heterogeneous activation of peroxymonosulfate by LaFeO3 for diclofenac degradation: DFT-assisted mechanistic study and degradation pathways. Chem. Eng. J. 2018, 352, 601–611. [Google Scholar] [CrossRef]
  66. Ledakowicz, S.; Drozdek, E.; Boruta, T.; Foszpańczyk, M.; Olak-Kucharczyk, M.; Żyłła, R.; Gmurek, M. Impact of Hydrogen Peroxide on the UVC Photolysis of Diclofenac and Toxicity of the Phototransformation Products. Int. J. Photo. 2019, 2019, 1–11. [Google Scholar] [CrossRef]
  67. Iovino, P.; Lavorgna, M.; Orlo, E.; Russo, C.; De Felice, B.; Campolattano, N.; Muscariello, L.; Fenti, A.; Chianese, S.; Isidori, M.; et al. An integrated approach for the assessment of the electrochemical oxidation of diclofenac: By-product identification, microbiological and eco-genotoxicological evaluation. Sci. Total Environ. 2024, 909, 168511. [Google Scholar] [CrossRef] [PubMed]
  68. Calza, P.; Sakkas, V.A.; Medana, C.; Baiocchi, C.; Dimou, A.; Pelizzetti, E.; Albanis, T. Photocatalytic degradation study of diclofenac over aqueous TiO2 suspensions. Appl. Cat. B Environ. 2006, 67, 197–205. [Google Scholar] [CrossRef]
  69. Homlok, R.; Mile, V.; Takács, E.; Járvás, G.; Góger, S.; Wojnárovits, L. Comparison of hydrogen atom and hydroxyl radical reactions with simple aromatic molecules in aqueous solution. Chem. Phys. 2020, 534, 110754. [Google Scholar] [CrossRef]
  70. Dey, S.; Manogaran, D.; Manogaran, S.; Schaefer, H.F., III. Substituent effects on the aromaticity of benzene—An approach based on interaction coordinates. J. Chem. Phys. 2019, 150, 214108. [Google Scholar] [CrossRef]
  71. Krygowski, T.M.; Dobrowolski, M.A.; Zborowski, K.; Cyrański, M.K. Relation between the substituent effect and aromaticity. Part II. The case of meta- and para-homodisubstituted benzene derivatives. J. Phys. Org. Chem. 2006, 19, 889–895. [Google Scholar] [CrossRef]
  72. Anbar, M.; Meyerstein, D.; Neta, P. The Reactivity of Aromatic Compounds toward Hydroxyl Radicals. J. Phys. Chem. 1966, 70, 2660–2662. [Google Scholar] [CrossRef]
  73. Moore, D.E.; Roberts-Thomson, S.; Zhen, D.; Duke, C.C. Photochemical studies on the antiinflammatory drug diclofenac. Photochem. Photobio. 1990, 52, 685–690. [Google Scholar] [CrossRef] [PubMed]
  74. Keen, O.S.; Thurman, E.M.; Ferrer, I.; Dotson, A.D.; Linden, K.G. Dimer formation during UV photolysis of diclofenac. Chemosphere 2013, 93, 1948–1956. [Google Scholar] [CrossRef] [PubMed]
  75. Eriksson, J.; Svanfelt, J.; Kronberg, L. A Photochemical Study of Diclofenac and Its Major Transformation Products. Photochem. Photobio. 2010, 86, 528–532. [Google Scholar] [CrossRef]
  76. Ziylan, A.; Dogan, S.; Agopcan, S.; Kidak, R.; Aviyente, V.; Ince, N.H. Sonochemical degradation of diclofenac: Byproduct assessment, reaction mechanisms and environmental considerations. Environ. Sci. Pollut. Res. 2014, 21, 5929–5939. [Google Scholar] [CrossRef] [PubMed]
  77. Galmier, M.-J.; Bouchon, B.; Madelmont, J.-C.; Mercier, F.; Pilotaz, F.; Lartigue, C. Identification of degradation products of diclofenac by electrospray ion trap mass spectrometry. J. Pharm. Biomed. Anal. 2005, 38, 790–796. [Google Scholar] [CrossRef]
  78. Elangovan, M.; Bharathaiyengar, S.M.; PonnanEttiyappan, J. Photocatalytic degradation of diclofenac using TiO2-CdS heterojunction catalysts under visible light irradiation. Environ. Sci. Pollut. Res. 2021, 28, 18186–18200. [Google Scholar] [CrossRef] [PubMed]
  79. Gaudiano, M.C.; Valvo, L.; Bertocchi, P.; Manna, L. RP-HPLC study of the degradation of diclofenac and piroxicam in the presence of hydroxyl radicals. J. Pharm. Biomed. Anal. 2003, 32, 151–158. [Google Scholar] [CrossRef]
  80. Martínez, C.; Fernández, M.I.; Santaballa, J.A.; Faria, J. Aqueous degradation of diclofenac by heterogeneous photocatalysis using nanostructured materials. Appl. Cat. B Environ. 2011, 107, 110–118. [Google Scholar] [CrossRef]
  81. Poirier-Larabie, S.; Segura, P.A.; Gagnon, C. Degradation of the pharmaceuticals diclofenac and sulfamethoxazole and their transformation products under controlled environmental conditions. Sci. Total Environ. 2016, 557–558, 257–267. [Google Scholar] [CrossRef]
  82. Wang, K.; Chen, R.; Zhu, X.; Liao, Q.; Ye, D.; Chen, G.; Liu, M. Simple Method for Directly Synthesizing Ag Nanoparticles with Silver Ammonia and Polydopamine in a Microreactor toward the Conversion of 4-NP to 4-AP. Ind. Eng. Chem. Res. 2020, 59, 16205–16216. [Google Scholar] [CrossRef]
  83. Herrmann, J.-M. Fundamentals and misconceptions in photocatalysis. J. Photochem. Photobio. A Chem. 2010, 216, 85–93. [Google Scholar] [CrossRef]
  84. Azam, A.; Babkair, S.S. Low-temperature growth of well-aligned zinc oxide nanorod arrays on silicon substrate and their photocatalytic application. Int. J. Nanomed. 2014, 9, 2109–2115. [Google Scholar] [CrossRef] [PubMed]
  85. Aadnan, I.; Zegaoui, O.; Daou, I.; Esteves da Silva, J.C.G. Synthesis and physicochemical characterization of a ZnO-Chitosan hybrid-biocomposite used as an environmentally friendly photocatalyst under UV-A and visible light irradiations. J. Environ. Chem. Eng. 2020, 8, 104260. [Google Scholar] [CrossRef]
  86. Guo, H.; Yang, H.; Huang, J.; Tong, J.; Liu, X.; Wang, Y.; Qiao, W.; Han, J. Theoretical and experimental insight into plasma-catalytic degradation of aqueous p-nitrophenol with graphene-ZnO nanoparticles. Sep. Purif. Technol. 2022, 295, 121362. [Google Scholar] [CrossRef]
  87. Hasan, I.; Shekhar, C.; Bin Sharfan, I.I.; Khan, R.A.; Alsalme, A. Ecofriendly Green Synthesis of the ZnO-Doped CuO@Alg Bionanocomposite for Efficient Oxidative Degradation of p-Nitrophenol. ACS Omega 2020, 5, 32011–32022. [Google Scholar] [CrossRef]
  88. Rodrigues, A.S.; Silveira, J.E.; Carbajo, J.; Zazo, J.A.; Casas, J.A.; Fernandes, A.; Pacheco, M.J.; Ciríaco, L.; Lopes, A. Diclofenac photodegradation with the Perovskites BaFeyTi1-yO3 as catalysts. Environ. Sci. Poll. Res. 2021, 28, 23822–23832. [Google Scholar] [CrossRef]
  89. Zhang, H.; Zhang, P.; Ji, Y.; Tian, J.; Du, Z. Photocatalytic degradation of four non-steroidal anti-inflammatory drugs in water under visible light by P25-TiO2/tetraethyl orthosilicate film and determination via ultra performance liquid chromatography electrospray tandem mass spectrometry. Chem. Eng. J. 2015, 262, 1108–1115. [Google Scholar] [CrossRef]
  90. Smýkalová, A.; Sokolová, B.; Foniok, K.; Matějka, V.; Praus, P. Photocatalytic Degradation of Selected Pharmaceuticals Using g-C3N4 and TiO2 Nanomaterials. Nanomaterials 2019, 9, 1194. [Google Scholar] [CrossRef]
  91. Suhag, M.H.; Khatun, A.; Tateishi, I.; Furukawa, M.; Katsumata, H.; Kaneco, S. Visible Light Induced Photocatalytic Degradation of Diclofenac in Aqueous Solution Using Fabricated ZnO/g-C3N4 by Facile Calcination Technique. ACS Omega 2024, 9, 45090–45103. [Google Scholar] [CrossRef] [PubMed]
  92. Yang, L.; Luo, S.; Li, Y.; Xiao, Y.; Kang, Q.; Cai, Q. High Efficient Photocatalytic Degradation of p-Nitrophenol on a Unique Cu2O/TiO2 p-n Heterojunction Network Catalyst. Environ. Sci. Technol. 2010, 44, 7641–7646. [Google Scholar] [CrossRef] [PubMed]
  93. Lu, Y.; Xu, Y.; Wu, Q.; Yu, H.; Zhao, Y.; Qu, J.; Huo, M.; Yuan, X. Synthesis of Cu2O nanocrystals/TiO2 photonic crystal composite for efficient p-nitrophenol removal. Col. Surf. A Physicochem. Eng. Asp. 2018, 539, 291–300. [Google Scholar] [CrossRef]
  94. Hou, Y.; Wang, Y.; Yuan, H.; Chen, H.; Chen, G.; Shen, J.; Li, L. The enhanced catalytic degradation of SiO2/Fe3O4/C@TiO2 photo-Fenton system on p-nitrophenol. J. Nano. Res. 2016, 18, 343. [Google Scholar] [CrossRef]
  95. Chen, Y.; Sun, F.; Huang, Z.; Chen, H.; Zhuang, Z.; Pan, Z.; Long, J.; Gu, F. Photochemical fabrication of SnO2 dense layers on reduced graphene oxide sheets for application in photocatalytic degradation of p-Nitrophenol. Appl. Cat. B Environ. 2017, 215, 8–17. [Google Scholar] [CrossRef]
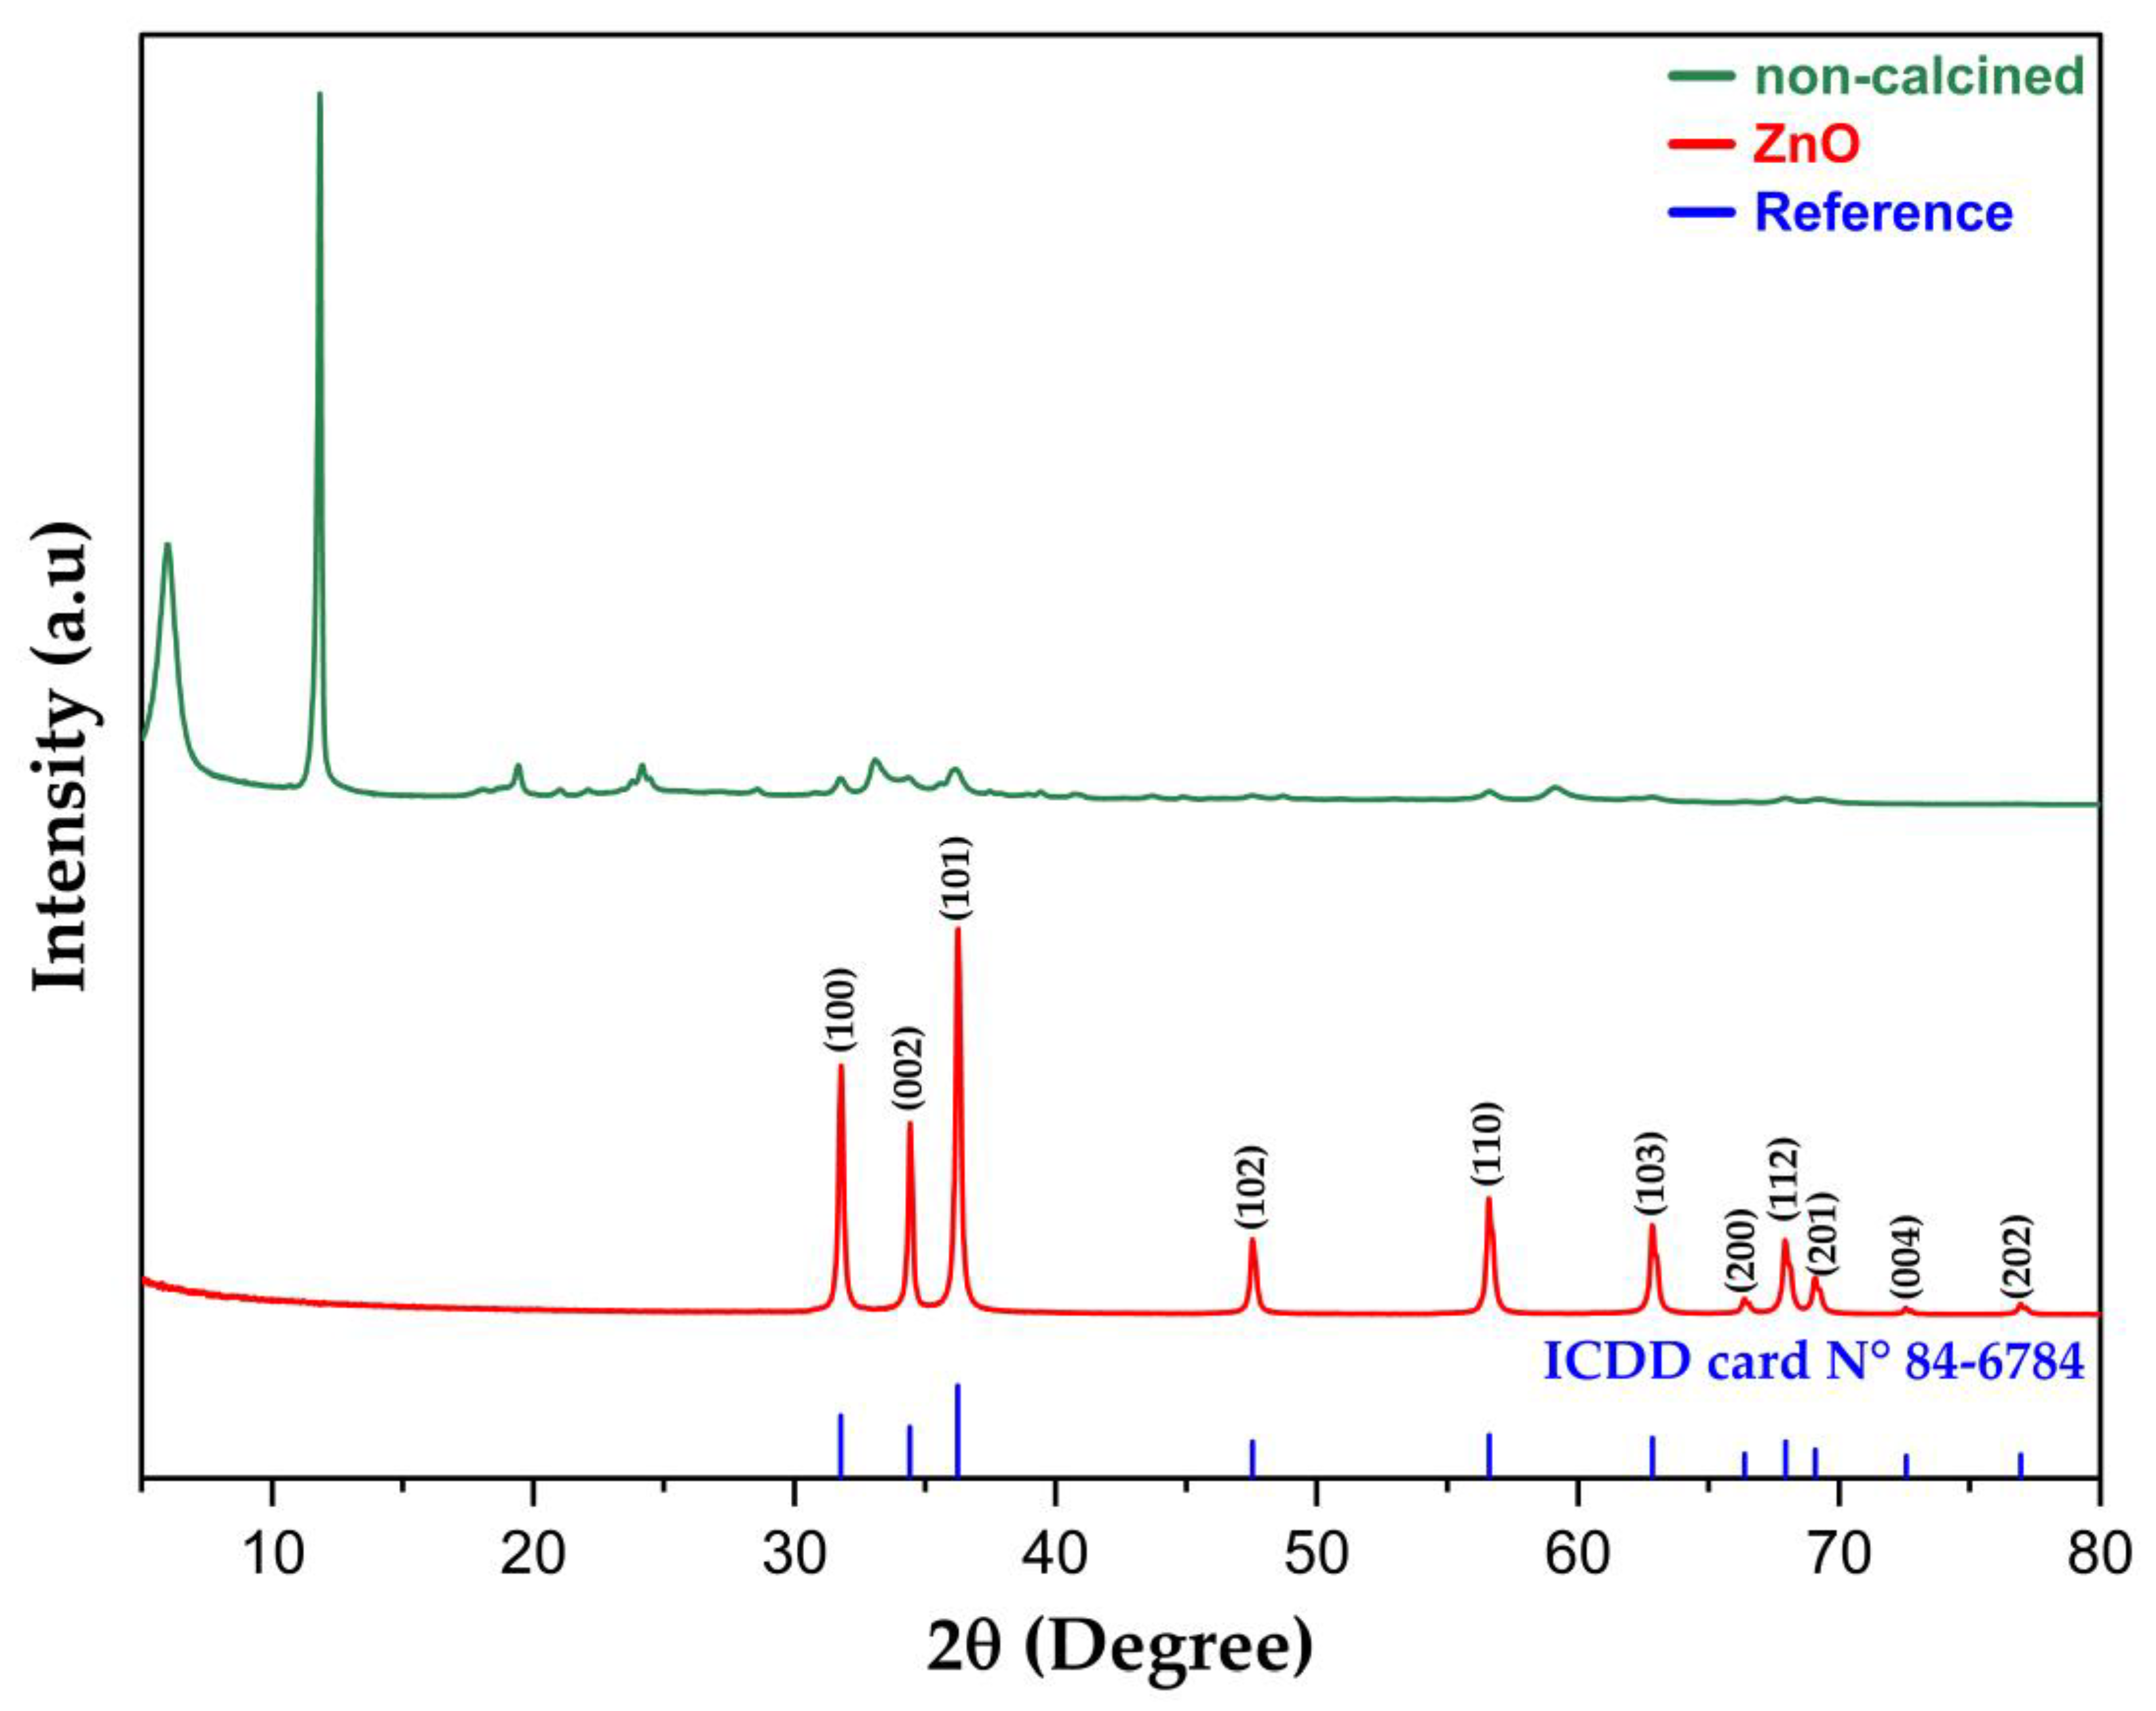
Figure 1. XRD pattern of the as-synthesized and calcined ZnO nanopowder.
Catalysts 15 00004 g001
Figure 2. SEM images of the as-synthesized (A) and calcined final product of ZnO NPs (B).
Catalysts 15 00004 g002
Figure 3. EDX analysis (left) and size distribution of calcined ZnO NPs (right).
Catalysts 15 00004 g003
Figure 4. (a) UV–vis spectra, and (b) bandgap determination of ZnO NPs.
Catalysts 15 00004 g004
Figure 5. Pseudo-first-order kinetics and pseudo-second-order kinetics of DCF adsorption on ZnO and (inset) intraparticle diffusion model.
Catalysts 15 00004 g005
Figure 6. Photocatalytic degradation of PNP and DCF: effects of catalyst presence under UV-LED irradiation.
Catalysts 15 00004 g006
Figure 7. Photocatalytic degradation of DCF: effects of catalyst mass.
Catalysts 15 00004 g007
Figure 8. Evolution of the pseudo-second-order kinetic constant with catalyst mass and modeling using the Catalyst Mass Saturation Kinetics Model (CMSKM).
Catalysts 15 00004 g008
Figure 9. Effect of catalyst mass on DCF degradation efficiency.
Catalysts 15 00004 g009
Figure 10. (a) Photocatalytic degradation of pure and commercial diclofenac using synthesized ZnO nanoparticles and (b) of commercial diclofenac using commercial and synthesized ZnO catalysts.
Catalysts 15 00004 g010
Figure 11. Comparative mineralization rates of pure and commercial diclofenac during photocatalytic degradation.
Catalysts 15 00004 g011
Figure 12. Proposed pathways and structures of DCF degradation products.
Catalysts 15 00004 g012
Figure 13. (a) Photocatalyst reusability; (b) XRD analysis of ZnO post four consecutive cycles.
Catalysts 15 00004 g013
Figure 14. UV–Vis Spectra of p-nitrophenol and p-nitrophenolate ion, highlighting degradation progression.
Catalysts 15 00004 g014
Figure 15. Effect of various scavengers on p-nitrophenol photodegradation efficiency.
Catalysts 15 00004 g015
Scheme 1. Preparation of chia seed extract.
Catalysts 15 00004 sch001
Scheme 2. Green synthesis of ZnO NPs from aqueous zinc acetate (1) and chia seed extract (2) solutions.
Catalysts 15 00004 sch002
Table 1. Specific surface areas and pores measurements of the as-synthesized and final ZnO products.
MaterialSSA (m2/g)Total Pore Volume (cc/g)Average Pore Radius (nm)
Non-calcined37.70.210
Calcined ZnO13.40.117
Table 2. Adsorption and degradation kinetic constants and model fit for PNP and DCF.
Adsorption and Diffusion of DCF (mcat = 0.5 g/L)
Pseudo-first-orderk (10−2 min−1)27.29
R2 (%)99.60
Pseudo-second-orderk (10−2 L·mol−1·min−1)4.60
R2 (%)99.94
Diffusionkip1; kip2; kip3
(mg.g−1min−1/2)
3.490.910.18
R2 (%)10094.2775
Degradation of PNP and DCF
PNP
(no catalyst)
PNP
(mcat = 1.5 g/L)
DCF
(no catalyst)
DCF
(mcat = 1.5 g/L)
k (10−2 L·mol−1·min−1)0.0044.030.01546.03
R2 (%)66.7497.1496.9399.73
Table 3. List of identified compounds deriving from DCF photodegradation.
CompoundPredicted FormulaMeasured m/zTheoretical m/zError
(ppm)
DCF[C14H11Cl2NO2]294.0094294.00940
DP1[C14H11Cl2NO3]310.0047310.00431.3
DP2[C14H9Cl2NO3]+310.0038310.00321.9
DP3[C13H11Cl2NO]266.0149266.01451.5
DP4[C13H10ClNO]230.0375230.0378−1.3
DP5[C14H11Cl2NO]+278.0144278.0134−3.5
DP6[C13H11Cl2N]+250.0194250.01853.5
DP7[C13H10ClN]+214.0424214.04182.8
DP8[C14H11NO3]+242.0820242.08123.3
Table 4. Comparison of degradation efficiency of DCF and PNP.
PollutantPhotocatalystType of IrradiationRemoval Efficiency (%)References
DCFTiO2 (P25)Xe lamp, 750 W/m290.4[68]
BaTiO3LED, 1100 W/m261[88]
P25/TEOSVisible, 79 W/m265[89]
C3N4Visible, 85 W/m277[90]
ZnO/g-C3N4Visible, 100 W97[91]
PNPTiO2 NTsXe lamp, 500 W36.5[92]
Cu2O NCs/TiO2 PCXe lamp, 300 W60[93]
SiO2/Fe3O4/C@TiO2Xe lamp, 500 W93[94]
SnO2-rGOUV, 8 W95.6[95]
Disclaimer/Publisher’s Note: The statements, opinions and data contained in all publications are solely those of the individual author(s) and contributor(s) and not of MDPI and/or the editor(s). MDPI and/or the editor(s) disclaim responsibility for any injury to people or property resulting from any ideas, methods, instructions or products referred to in the content.