Article

Zeolitized Clays and Their Use for the Capture and Photo-Fenton Degradation of Methylene Blue

by
Koffi Simeon Kouadio
1,2,
Ekou Tchirioua
2 and
Jérémy Dhainaut
1,*
1
Univ. Lille, CNRS, Centrale Lille, Univ. Artois, UMR 8181–UCCS-Unité de Catalyse et Chimie du Solide, F-59000 Lille, France
2
Laboratoire de Thermodynamique et de Physico-Chimie du Milieu (LTPCM), Université Nangui Abrogoua, 02 BP 801 Abidjan 02, Côte d’Ivoire
*
Author to whom correspondence should be addressed.
Catalysts 2025, 15(2), 188; https://doi.org/10.3390/catal15020188
Submission received: 19 December 2024 / Revised: 14 February 2025 / Accepted: 14 February 2025 / Published: 18 February 2025
(This article belongs to the Special Issue Porous Catalysts: Synthesis and Catalytic Performance)

Abstract

:
Water pollution by dyes is a major environmental problem, particularly in the textile, food, and pharmaceutical industries. These dyes are often complex chemical compounds that are difficult to remediate due to their chemical stability, their solubility in water, and their resistance to conventional treatment processes such as filtration, coagulation, or decantation. Thus, to date, there is still a need to make water treatment processes more performant and cost-efficient. The main aim of this research is to prepare photocatalytically active MFI-type zeolites from natural clays and support iron oxide nanoparticles. These catalysts were characterized and evaluated for the capture and the photo-Fenton degradation of methylene blue (MB) in aqueous solution. After 10 min under photo-Fenton conditions, Fe/MTK-MFI presented almost complete removal of MB for up to four consecutive cycles.

1. Introduction

Each year, about 700.000 tons of organic dyes are produced and mostly used in the printing and textile industries [1]. However, it has been estimated that up to 12% of these dyes end up in the hydrologic cycle [1]. Moreover, most dye molecules are recalcitrant toward classical water treatment processes due to their chemical nature, in addition to being toxic and carcinogenic, posing serious threats to the environment and human beings [2]. Methylene blue (MB), a cationic molecule, is one of the most used dyes in industry. Of note, MB is also used as a probe to define the adsorption capacity of water filters due to the similarities with the adsorption of pesticides [1]. Thus, the removal of MB in water has been especially investigated, including approaches based on adsorption, membrane filtration, and physico-chemical degradation processes [1].
On the one hand, adsorption is based on the physisorption (or, in certain cases, chemisorption) of the undesired molecules on the surface of a solid called an adsorbent. The effectiveness of adsorption depends on a number of factors, including the nature of the pollutant and the adsorbent, the specific surface area of the adsorbent, and environmental conditions such as pH and temperature. Activated carbons [1], zeolites [3], clays [4], and layered double hydroxides (LDHs) [5] are among the most used materials due to their porous structure and the presence of functional groups on their surface. This process is appreciated for its simplicity, relatively low cost, and effectiveness in treating water contaminated by low concentrations of pollutants, including heavy metals, dyes, pharmaceutical and personal care products, pesticides, etc. [6,7].
In particular, zeolites are crystalline aluminosilicates with a microporous structure and tailored hydrophilicity, giving them remarkable adsorption properties in water. Certain zeolites, such as zeolite NaX (FAU topology), have been extensively studied for their ability to remove dyes from wastewater [7]. Within 90 min, the MB adsorption capacity of NaX can reach 28 mg/g (initial concentration of MB = 100 mg/L) [8]. Conventional zeolite ZSM-5 crystals (MFI topology) show about four times higher MB adsorption capacity, reaching 105.8 mg/g [2]. The use of ZSM-5 nanosheets instead of conventional zeolite crystals further increases their adsorption capacity up to 476 mg/g, which has been attributed to the increased accessibility of adsorption sites [2]. Still, one drawback of using adsorbents is their limited adsorption capacity, requiring frequent replacement or reactivation. For longer use, the degradation of captured organic pollutants into less hazardous substances is a promising strategy.
Advanced oxidation processes (AOPs) are often based on the generation of ozone (O3) or hydroxyl radicals (•OH), which are extremely powerful oxidizing agents that may mineralize organic molecules into CO2 and water [9]. For instance, the Fenton process is one of the most studied AOPs based on a combination of acidic pH (around 3) and an iron-based catalyst to produce hydroxyl radicals from hydrogen peroxide [1]. The strict working pH range (pH < 3) and high peroxide demand remain challenges to overcome to improve the efficiency and economic viability of the process [10]. Also, conventional homogeneous Fenton catalysts are based on ferrous or ferric salts; however, their use increases iron concentration in the final effluent and results in additional removal treatments and the creation of iron-containing sludge. These salts may be replaced by magnetite (Fe3O4) or hematite (Fe2O3), used under the bulk form, or supported as nanoparticles. One especially attractive approach is to support magnetite nanoparticles on an adsorbent that is stable in acidic conditions to rapidly capture traces of organic pollutants and then oxidize them over time: these materials are often called integrated photocatalyst adsorbents (IPCAs) [11]. For instance, a Fe3O4/4A zeolite (LTA topology) catalyst was prepared by impregnation–precipitation and applied to methylene blue degradation under Fenton conditions, almost giving the total decolorization of the solution within 35 min (MB initial concentration = 50 mg/L) [12]. By applying UV-C irradiation (6 W UV-C lamp), the time can be shortened to only 5 min. Moreover, the catalyst could be recycled up to four times with similar degradation activity [12]. Fe3O4/ZSM-5 zeolite catalysts have also been prepared and applied to MB degradation. Within 60 min, a decolorization of 98% was obtained (MB initial concentration = 20 mg/L) without UV irradiation [13]. In another study, a series of Fe2O3/ZSM-5 zeolite catalysts were applied to the photo-Fenton degradation of Reactive Red, another dye [14]. While the purely microporous catalyst showed 80% decolorization efficiency after 60 min, 100% was achieved within the same time when inner mesopores were present, showing the advantage of hierarchical pore networks for the diffusion of bulky molecules. Biochar, reduced graphene oxide, and porous silica have also been used as supports for Fe3O4 or Fe2O3 and successfully applied to MB degradation [15,16,17,18]. Furthermore, some recent studies have been pushing toward the degradation of methylene blue at near neutral pH, using bimetallic Cu-Mn or Fe-Mn catalyst formulations [19,20]. While many effective AOP strategies have been proposed over the past decades, the main driving factor toward real-life implementation for water treatment remains the cost of such additional processes.
In this work, ZSM-5 zeolite has been prepared following direct synthesis or by zeolitization of natural clays, and their comparative adsorption capacity of MB in relation to their differences in measured physico-chemical properties is discussed. In a second step, magnetite nanoparticles have been deposited via the uncommon and solvent-free melt impregnation approach, and their efficiency to fully remove methylene blue under photo-Fenton process conditions has been investigated. Finally, cycling experiments were performed using the best IPCA.

2. Results and Discussion

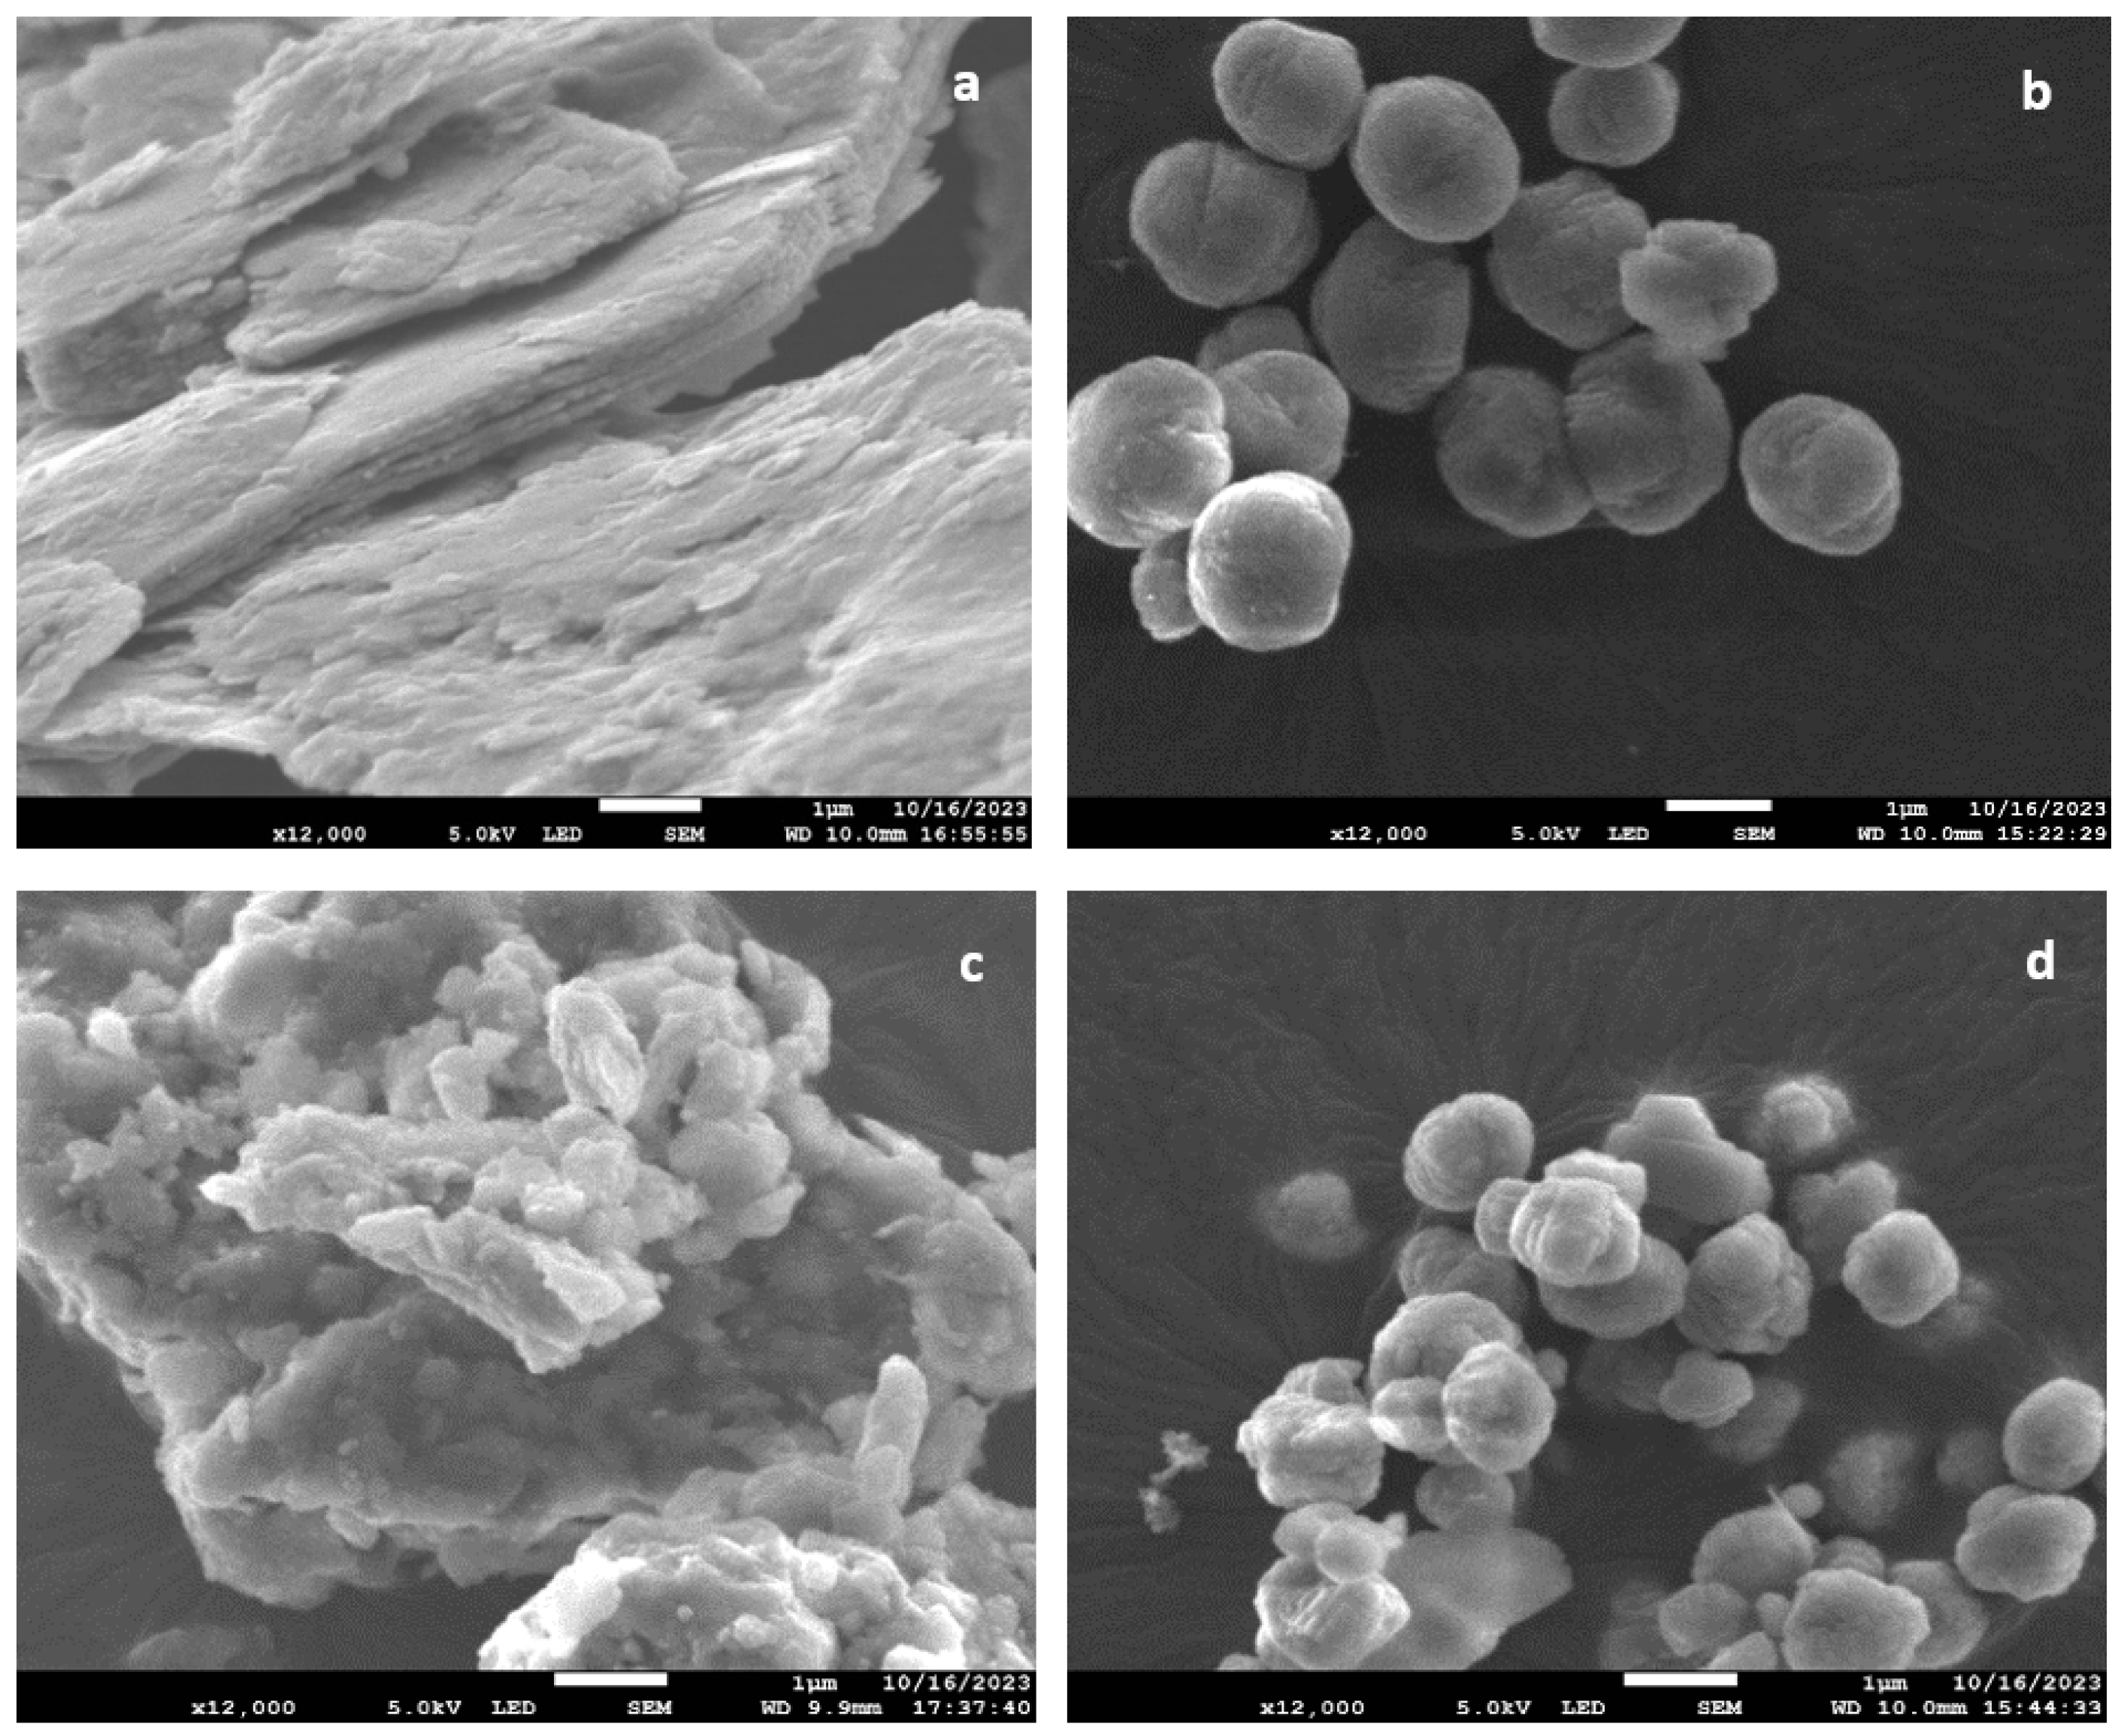
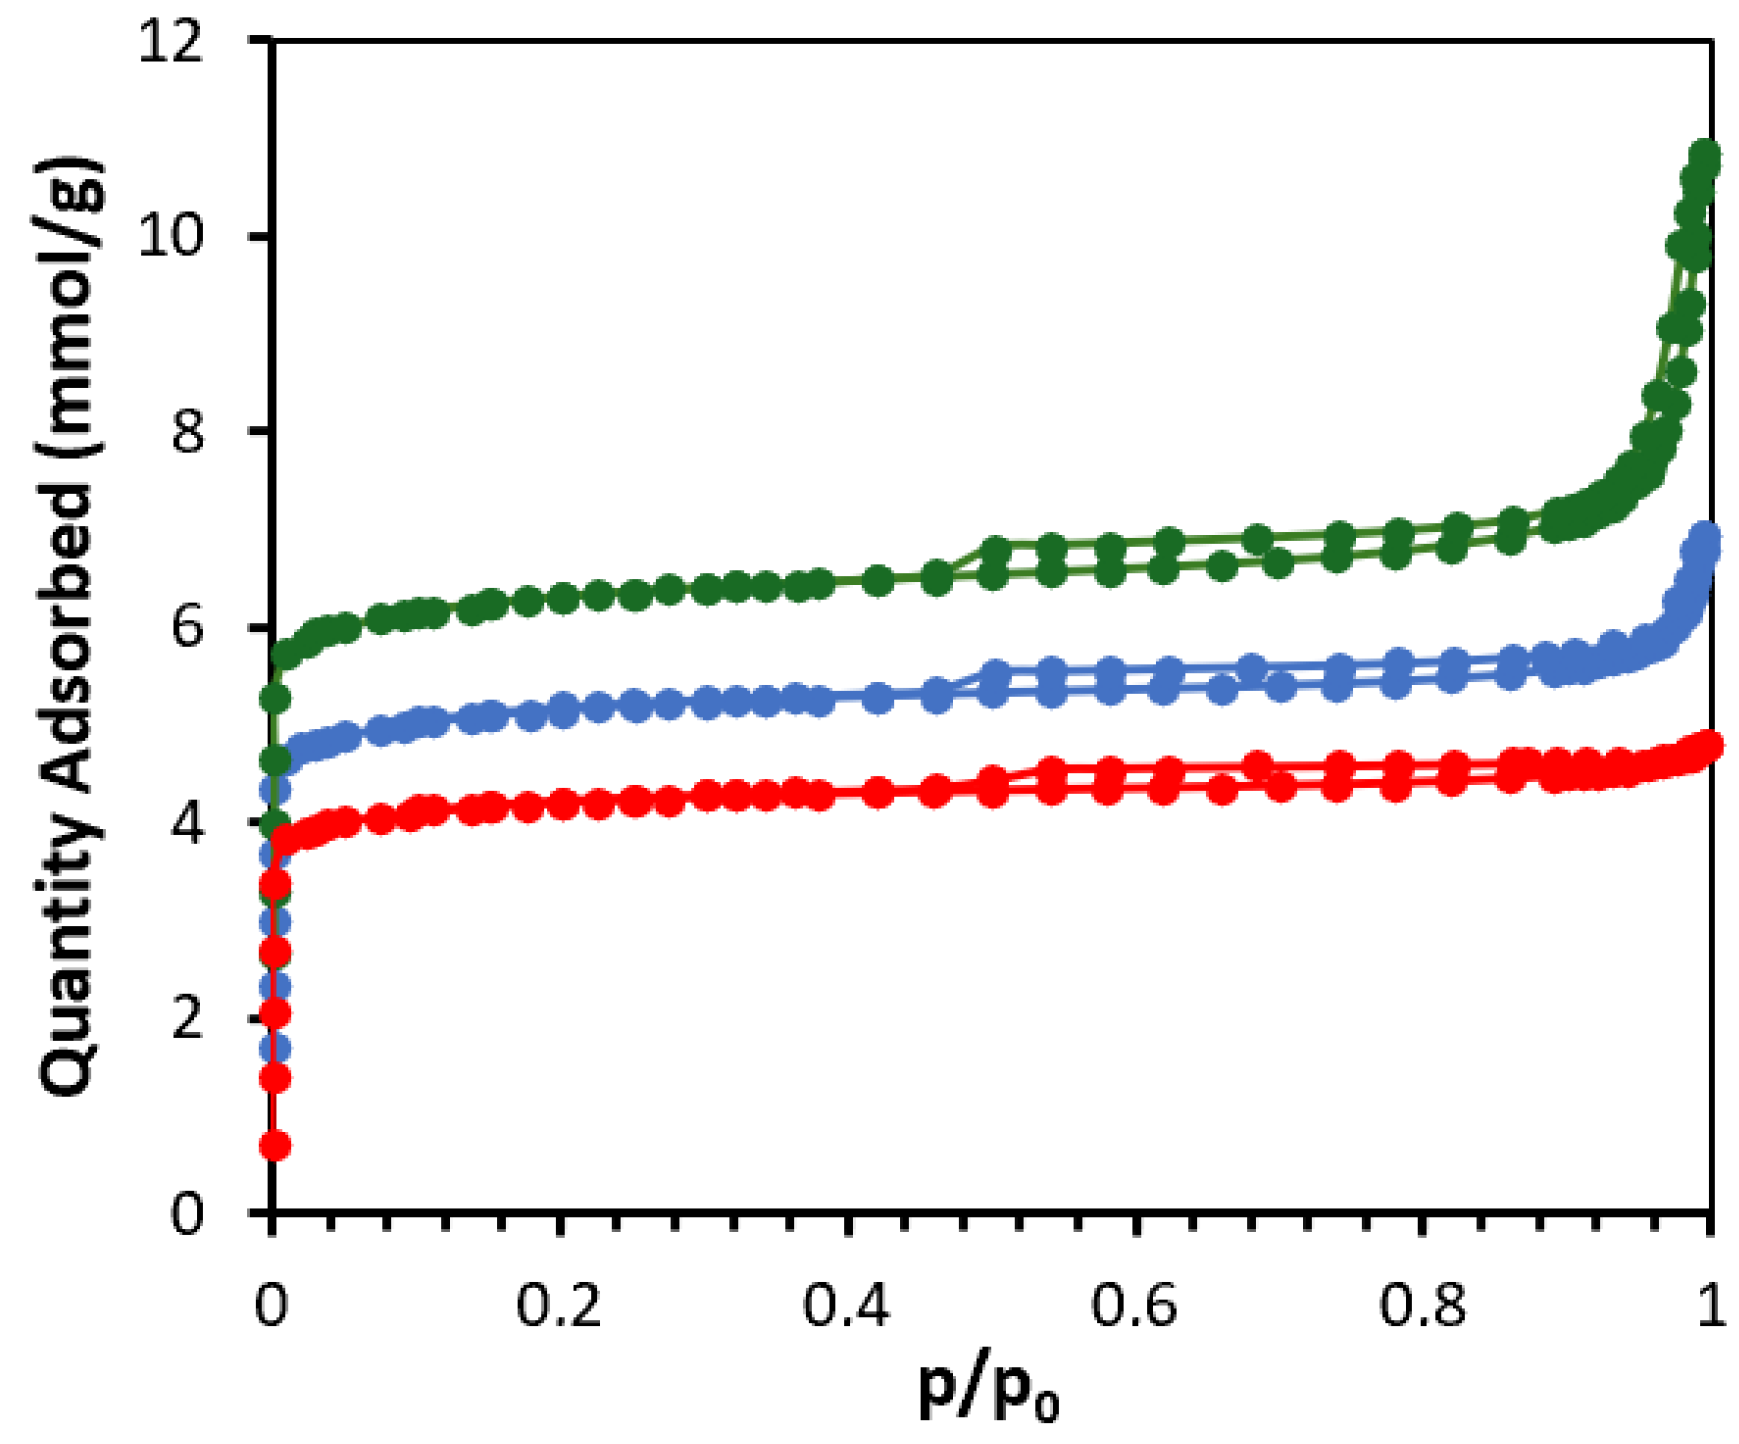
2.1. Zeolites Characterization

X-ray diffractograms of clays prior to zeolitization can be found in Figure S1. The kaolinite phase disappears after thermal treatment, while quartz (SiO2) and muscovite (a phyllosilicate) phases are decreased following acid washing of metakaolin (MTK) and montmorillonite (MONT), respectively. Following zeolitization, the XRD patterns of MTK-MFI and MONT-MFI are shown in Figure 1 in comparison with classical ZSM-5 zeolite (SYNT-MFI). All catalysts have characteristic diffraction peaks at 2θ = 7.98°, 8.88°, 14.85°, 23.96° and 24.38°, which are indexed to the typical ZSM-5 zeolite (MFI). Thus, the mostly amorphous aluminosilicate clays were dissolved under applied basic conditions, and the aluminum and silicium monomers were recrystallized into the MFI topology in the presence of the appropriate structure-directing agent (SDA), namely tetrapropylammonium cation (TPA+). Of note, it is not possible to completely reject the presence of quartz coming from the clays after their zeolitization, as the characteristic peaks could be superimposed with MFI peaks.
Direct visualization is another way to prove the successful zeolitization of clays. As observed in Figure 2a, the kaolin clay is composed of large (several tenths of micrometers) plate-like stacking of nanoplatelets. The thickness of the stacking is about 800 nm in the case of the kaolin clay. On the other hand, the commercial montmorillonite seems to have undergone a milling process (Figure 2c), giving randomly organized platelets. In any case, after zeolitization, pseudo-spherical particles of about 1 μm, composed of agglomerated nanocrystallites, are observed in Figure 2b,d. Starting from classical precursors, the obtained SYNT-MFI shows bigger agglomerates (about 2 μm) and ZSM-5 crystals with sharper morphology (Figure S2), which is attributed to a faster crystallization-growth process. This may be due to the presence of impurities within the clays and the need to dissolve the clays before the formation of ZSM-5 zeolite can take place. The nature of these impurities was further underlined by chemical analysis (ICP-OES, see Table S1): about 2 wt.% of iron and 0.3 wt.% of titanium are present in MTK, in addition to the aluminosilicate with a Si/Al molar ratio of 2.1. After zeolitization and following the addition of a silica precursor, this Si/Al molar ratio is increased up to 13.3, which is classical for ZSM-5 zeolites. The proper incorporation of aluminum species was further quantified using solid-state 27Al NMR. As shown in Figure S3, in the case of SYNT-MFI, all aluminum species are framework-incorporated Al(IV), evidenced by a sole peak centered at 55 ppm. However, in the case of MTK-MFI, another peak of low intensity is observable at 0 ppm and is attributed to the presence of about 4.5 at.% of extra-framework Al(VI) species.
Figure 3, Figure S4 and Table 1 report the textural properties of the materials as probed by N2 physisorption. Firstly, the effect of acid washing can clearly be observed, the resulting SBET of MTK being an order of magnitude higher than metakaolin. Thus, MTK is expected to be more reactive, facilitating its zeolitization. Isotherms of the two clays after treatment are type IV with H3 hysteresis loops, which is characteristic of micro-/mesoporous lamellar materials. Notably, acid-washed MONT presents a higher specific surface area (SBET) and total pore volume than MTK. Following their zeolitization, a significant increase in SBET and micropore volume is observed at the expense of lower mesopore volumes, further highlighting the obtention of a microporous material with textural properties similar to classical MFI-type ZSM-5 zeolites (SYNT-MFI). However, it should be noted that a significant N2 uptake remains at relative pressures above 0.8, characterizing the presence of large mesopores from clay precursors.
Another typical characteristic of zeolites is their tunable acidity, making them the most used heterogeneous catalysts in industry. NH3-TPD has been conducted and the results, extracted from Figure S5, are reported in Table 1. The temperature of maximal desorption for the three zeolites is between 302 °C (MTK-MFI) and 320 °C (SYNT-MFI), underlining the presence of similar weak acid sites and terminal silanol groups [22]. This is expected as the zeolites herein are under sodic form, and another step of cationic exchange is necessary to obtain the protonic highly acidic form. Nevertheless, the three zeolites can be classified according to their total acidity as SYNT-MFI > MONT-MFI > MTK-MFI. Thus, the characterization results allow us to conclude that MFI-type ZSM-5 zeolites have been comparatively obtained using either conventional soluble reactants or by using clays as aluminum and silicium precursors.

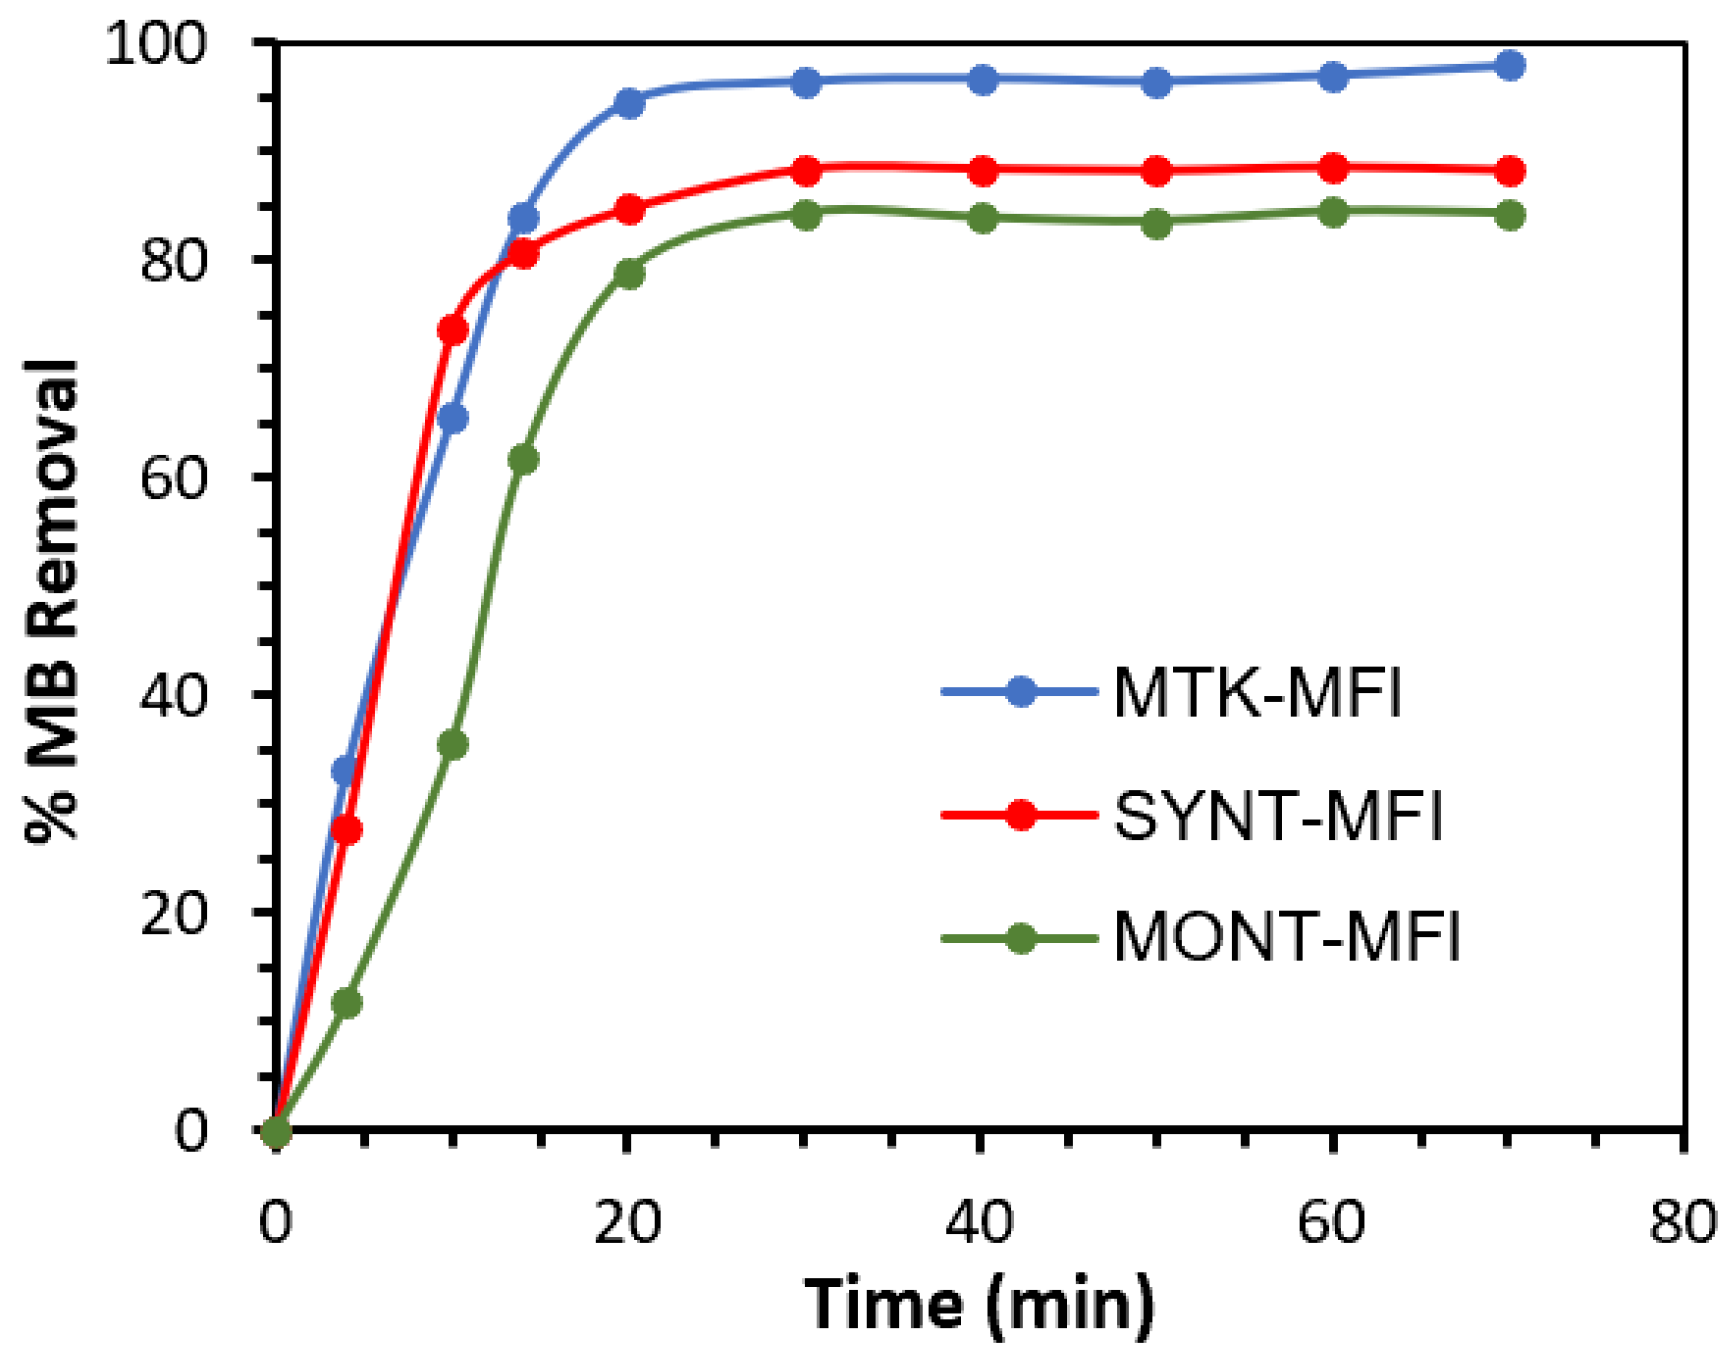
2.2. MB Adsorption Tests

The adsorption of MB on the as-prepared zeolites was followed as a function of the contact time to determine their maximal uptake and equilibrium time and reported in Figure 4. Physical adsorption, also named physisorption, is a rapid phenomenon with high initial adsorption rates [16,17]. However, when equilibrium is approached, adsorption becomes significantly hindered due to the saturation of adsorption sites and repulsion between the adsorbed MB molecules, which is reflected experimentally by the formation of almost horizontal plateaus from 30 min. While MONT-MFI is the worst adsorbent of the series both in terms of maximal MB uptake (4.28 mg/g of zeolite) and initial adsorption rate (see Table 2), MTK-MFI shows a slightly slower initial adsorption rate as the conventional SYNT-MFI but higher maximal MB uptake (4.98 mg/g of zeolite instead of 4.50 mg/g of zeolite) [23]. This could be due to the presence of large mesopores, as observed by N2 physisorption, improving the accessibility of adsorption sites.
Adsorption kinetic curves, shown in Figure S6, were described according to the pseudo-first-order model applied to the initial linear part of adsorption [16,19], and the data are given in Table 2. The theoretical maximal adsorption capacity of SYNT-MFI seems overestimated due to the higher initial adsorption rate. Based on these results, MTK-MFI seems to be the most promising adsorbent toward MB out of the three ZSM-5 zeolites.

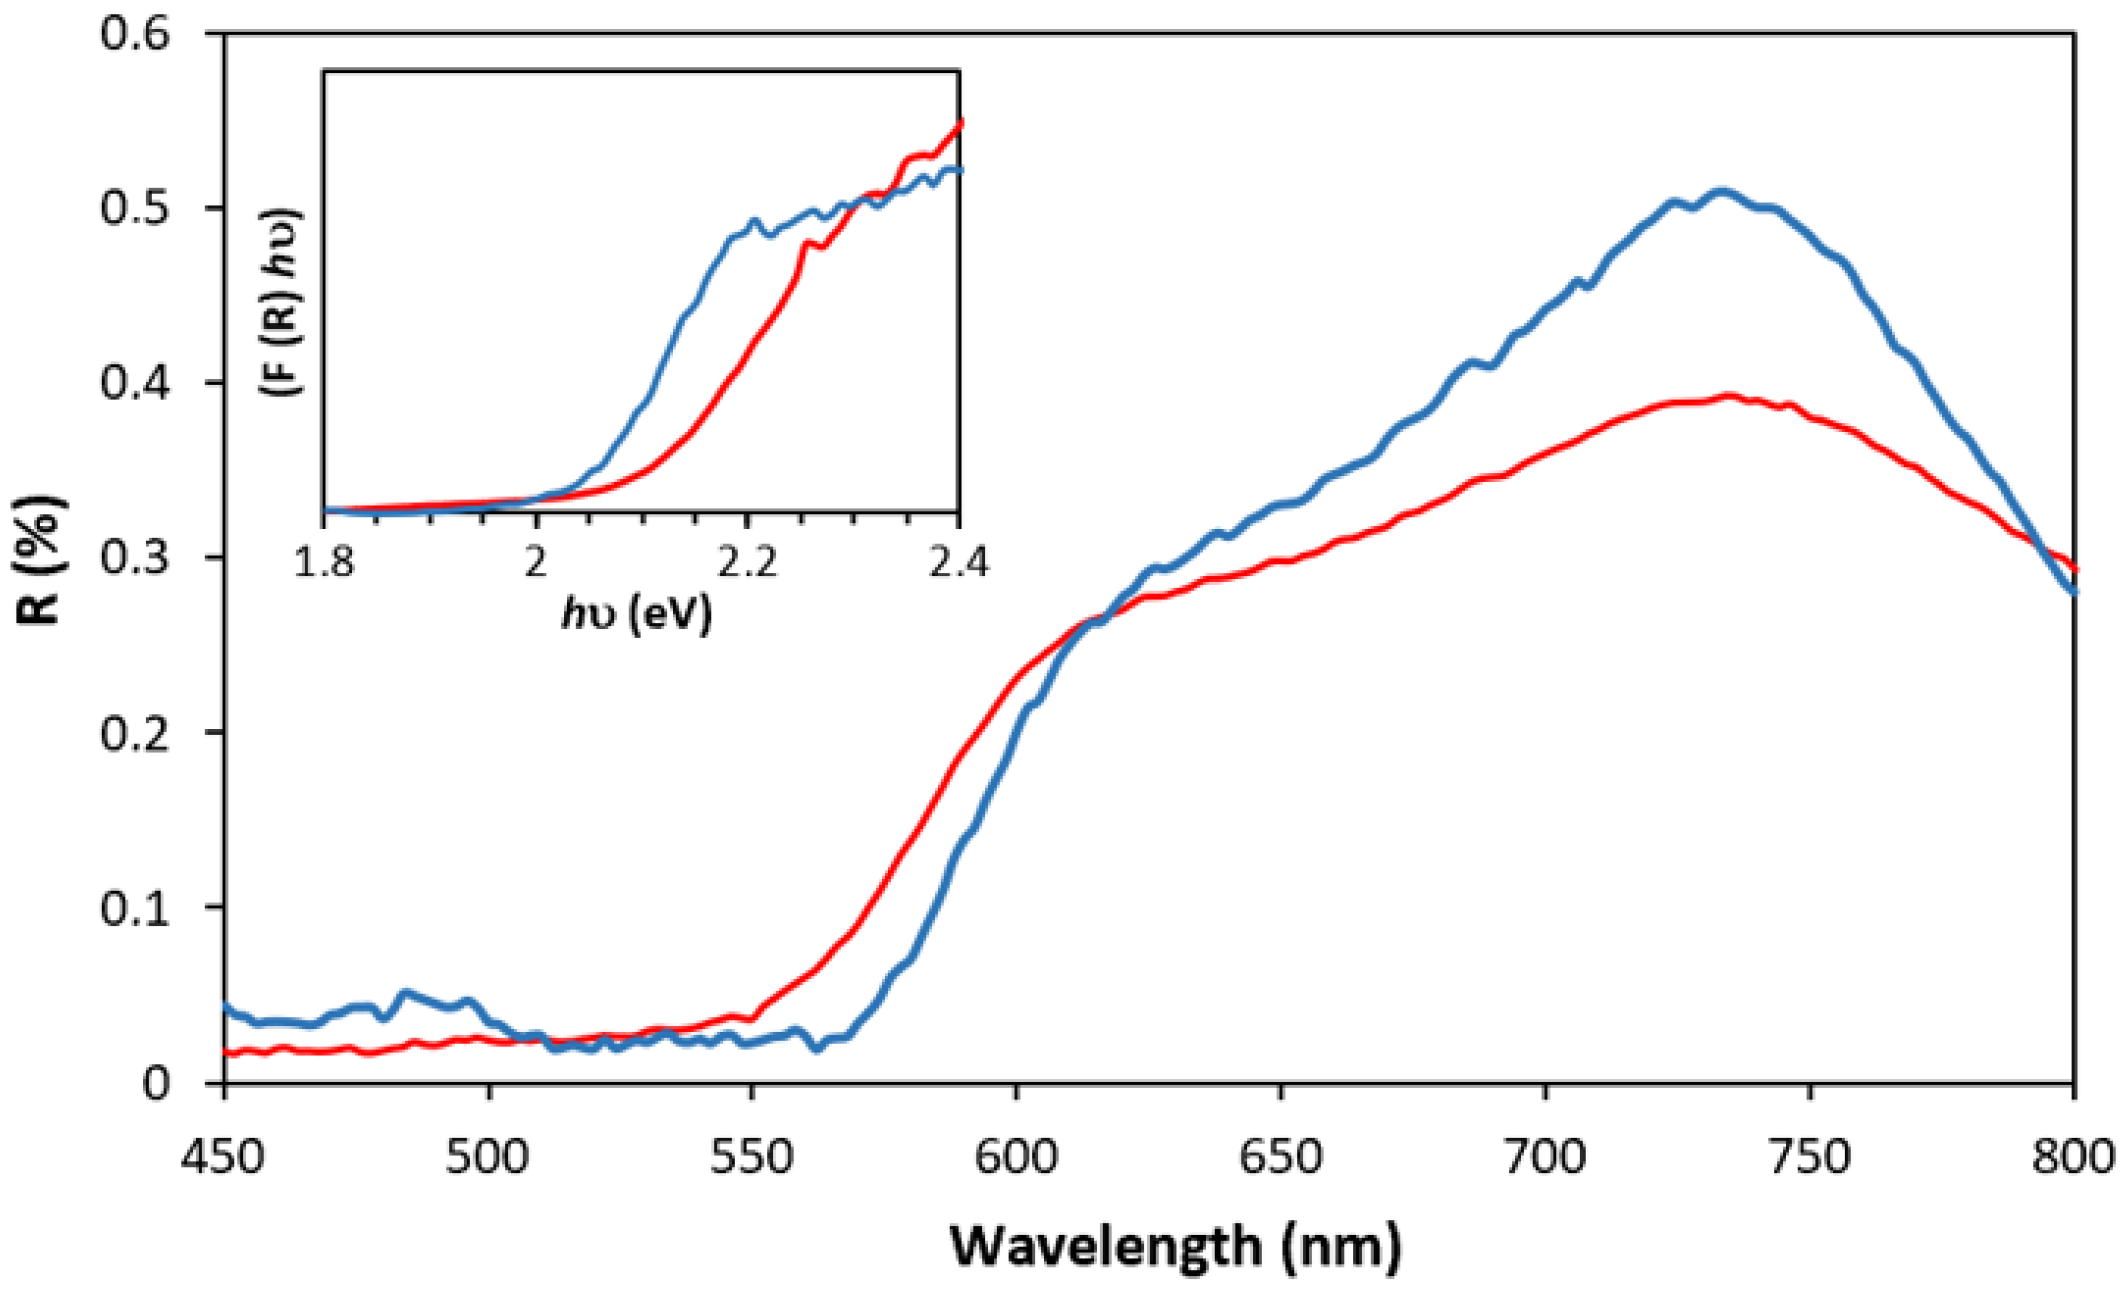
2.3. Degradation of MB by the Heterogeneous Photo-Fenton Process

The same materials used for MB adsorption were impregnated with iron oxide particles by the solvent-free melt infiltration method. XRD patterns (Figure S7) show additional diffraction peaks at 33.2 and 35.6°, indicating the presence of Fe2O3 nanoparticles (NPs). According to the Scherrer equation, the average sizes of these NPs were about 29 nm (Fe/MTK-MFI), 32 nm (Fe/SYNT-MFI), and 31 nm (Fe/MONT-MFI). These nanoparticles, much larger than ZSM-5 channel sizes (5.4–5.6 Å), are thus located at the surface of the zeolite crystals. EDS mapping provided in Figure S8 shows that iron species are homogeneously distributed over MTK-MFI and MONT-MFI, while some bigger aggregates appear on SYNT-MFI. The total iron loading varies significantly from 2.0 to 9.6 wt.% according to ICP-OES (Table 3). More interestingly, the iron surface loading was evaluated by XPS (Figure S9), and it varies from 1.5 to 2.2 wt.%, as shown in Table 3, much below the total iron loadings. This can be interpreted as a preferential location of iron NPs within the microporous framework of the zeolites, and thus a majority of NPs with sizes below 0.6 nm, which are not observed by XRD.
Adsorption tests after Fe2O3 NPs deposition were conducted again. It appears that their presence alters the adsorption capacity of the zeolites: as seen in Figure S10, it takes 40 min to Fe/MTK-MFI to fully adsorb the MB (instead of 20 min with MTK-MFI), while only up to 63% of the MB could be adsorbed by Fe/SYNT-MFI (instead of 88% with SYNT-MFI). These iron-based catalysts were then applied under photo-Fenton conditions. Herein, the initial pH of the solution was adjusted to 3, hydrogen peroxide was added, and UV light irradiation was applied after 1 h of equilibrium time in the dark. The results are displayed in Figure 5a, showing that the activity of the catalysts toward MB removal—thus solution decolorization—was in the order Fe/MTK-MFI (97.6%) > Fe/SYNT-MFI (90.5%) > Fe/MONT-MFI (80.8%). Interestingly, the equilibrium was reached within 10 min with any catalyst. In comparison, MTK-MFI was also used under the same conditions, showing only 77% of MB removal after 60 min (Figure S11). This order may be correlated to the total iron loadings of the catalysts and their dispersion, enhancing H2O2 consumption efficiency and limiting its disproportionation into H2O and O2. Moreover, it emphasizes that the iron oxide NPs within the zeolite frameworks play a role—even limited—over the formation of •OH radicals.
The MB removal results using Fe/MTK-MFI are further compared to the literature in Table S6. While direct comparison is not straightforward due to notable differences in photo-Fenton process conditions, similar removal efficiencies have been reached with this catalyst at the lowest reported irradiation intensity but also at the expense of generally higher catalyst and H2O2 dosages. The optimization of these dosages should be performed in the near future.
The kinetic rate constants of MB removal (photodegradation and adsorption) have been determined from Figure S12 and are given in Table S5. They further underline the fastest removal of MB by Fe/MTK-MFI compared to Fe/SYNT-MFI made from classical ZSM-5 zeolite. Especially after 70 min in the presence of Fe/MTK-MFI, only about 38% of organic compounds remain in solution (Table S6). As will be further observed during the cyclability experiments, the curve superimposition hints that MB does not stay adsorbed on the catalyst. These results indicate that while some (38%) of the initial MB molecules have been partially degraded into colorless by-products, the majority has been mineralized into CO2, highlighting the efficiency of the photo-Fenton process.
As commonly acknowledged in the literature [10,11,24], the photo-Fenton process is based on two parallel and rapid mechanisms. First, electron-hole pairs are created following the photo-excitation of Fe(III) species under appropriate wavelength (typically, in the UV domain). These e/h+ pairs either recombine or further form reactive oxygen species (ROS) and especially hydroxyl radicals (•OH) from hydroxide anions (OH). Meanwhile, Fe(II) species are re-oxidized by H2O2, leading to the production of both hydroxyl radicals and hydroxide anions. The equations below sum up this catalytic process, as follows:
Fe(III)/ZSM-5 + OH + hv → Fe(II)/ZSM-5 + •OH
Fe(II)/ZSM-5 + H2O2 → Fe(III)/ZSM-5 •OH + OH
To better understand the differences in photocatalytic activity, TEM observation was carried out on Fe/SYNT-MFI and Fe/MTK-MFI to determine the size and dispersion of the iron oxide nanoparticles. Samples were observed as 50-nm thin foils to precisely observe the location of Fe2O3 NPs. It appears that for Fe/SYNT-MFI, all observable Fe2O3 NPs are located at the surface of zeolite crystals (Figure 6a,b). Their corresponding sizes are about 15–45 nm. In the case of Fe/MTK-MFI, some NPs may be found within the microporous network of the zeolite (Figure 6c). Moreover, while a majority of NPs are also located at the surface of the crystals, their size is smaller (5–25 nm). Smaller NPs develop higher surface areas and thus more active sites contributing to the photocatalytic activity. Of note, a few aluminum-rich areas can be observed (Figure 6d) and are attributed to residual MTK.
One characteristic shared by photocatalysts is their capacity to absorb light radiation according to their band gap. The reported band gaps of Fe2O3 nanoparticles are typically between 2.0 and 2.2 eV [25]. Herein, band gaps have been deduced from UV–visible diffuse reflectance spectra, presented in Figure 7. Accordingly, Fe/MTK-MFI and Fe/SYNT-MFI present band gaps of 2.04 and 2.09, respectively. As reported elsewhere, in the case of Fe2O3 nanoparticles, the band gap decreases with the NP size [26]. Thus, the lower band gap measured with Fe/MTK-MFI is coherent with the smaller NP sizes observed by TEM.
Figure 5b shows the recyclability of the best catalyst of this series, Fe/MTK-MFI. Its catalytic activity remains identical for up to five consecutive uses, with 99.6% of MB removed after the fourth recycling experiment. The leaching of iron was also evaluated by ICP-OES and XPS to evaluate the potential contribution of homogeneous photo-Fenton catalysis over global activity. The total iron loading decreased from 9.6 to 8.5 wt.% (−11%), while the surface iron loading increased from 1.5 to 3.5 wt.% (+133%), highlighting mobility of iron oxide species from the zeolite microporosity toward its surface as well as limited leaching under the applied conditions. An additional photo-Fenton test, shown in Figure S13, was performed in the presence of iron sulfate in similar amounts as leached. Near-complete (96%) MB removal was obtained after 70 min, while similar MB removal performance was obtained with Fe/MTK-MFI within 10 min. This highlights the major role of supported iron oxide species in the photo-Fenton process.
The structural and textural properties of the used Fe/MTK-MFI have been probed again after the cyclability test. According to XRD (Figure S14), in the applied conditions, the zeolite structure is stable, as all reflections attributed to the MFI framework could be observed with similar relative intensities. Reflections related to Fe2O3 NPs are also observed after the test, supporting the retained catalytic activity over the cycles. N2 physisorption (Figure S15) shows slightly lower SBET (276.6 m2/g vs. 307.4 m2/g). Of note, the low-pressure hysteresis observed at p/p0 = 0.1–0.3 (also likely present before test but not measured) is commonly reported in the literature and has been attributed to the presence of framework defects modifying the interaction strength of adsorbate–adsorbent [27]. Importantly, some framework aluminum species from the zeolite framework are also leached (Table S2), as the Si/Al molar ratio increases up to 22.9 (instead of 13.9). This dealumination is even more pronounced at the surface of the zeolite (Table S3), where a Si/Al molar ratio of 40.6 is measured. While it is known that zeolites undergo dealumination in hot water, the MFI topology is reputed to be more stable even at such low Si/Al ratios—albeit at neutral pH [28]. While hydroxyl radicals (•OH) have been reported to accelerate the crystallization of zeolites [29], their influence over zeolite dealumination has not been reported so far and should be addressed in the near future.

3. Materials and Methods

The following chemicals were used as received: montmorillonite clay (Sigma-Aldrich, Darmstadt, Germany), sodium hydroxide (NaOH 97 wt.%—VWR Chemicals, Rosny-sous-Bois, France), sodium silicate (Na2O 14.4 wt.% and SiO2 26.5 wt.%—Honeywell, Charlotte, NC, USA), Ludox HS 40 (SiO2 40 wt.%—Sigma-Aldrich, Darmstadt, Germany), tetrapropylammonium hydroxyde (TPAOH 25 wt.% in water—Thermo Scientific Chemicals, Geel, Belgium), iron nitrate (III) nonahydrate (Fe(NO3)3·9H2O > 98 wt.%—Thermo Scientific Chemicals, Kandel, Germany), methylene blue (MB—Thermo Scientific Chemicals, Geel, Belgium), nitric acid (HNO3 67%—Thermo Scientific Chemicals, Kandel, Germany), hydrochloric acid (HCl 3M—Thermo Scientific Chemicals, Geel, Belgium), and hydrogen peroxide (H2O2 30%—Thermo Scientific Chemicals, Geel, Belgium). Kaolin clay was extracted in the Agboville region—Ivorian Coast.

3.1. Clay Pre-Treatment

First, the kaolin clay was dispersed in water and centrifuged at 3000 rpm for 15 min before being thermally treated at 750 °C under air for 2 h (8 °C/min) to produce more reactive metakaolin with grain sizes below 2 μm. The XRD of the initial kaolin clay and the metakaolin are given in Figure S1. This metakaolin and commercial montmorillonite were further washed using hydrochloric acid (clay:HCl weight ratio 1:17) under reflux for 150 min to eliminate impurities including muscovite (see Figure S1) as well as to increase their reactivity. After cooling down, the powders were recovered by filtration and washed with distilled water until the pH was close to 7, then dried at 80 °C overnight [29]. XRD of the clays after acid washing (MTK and MONT for metakaolin and montmorillonite, respectively) are given in Figure S1.

3.2. Zeolitization of Clays

The zeolitization of clays into ZSM-5 zeolite is based on previous works [30]. Typically, 1 g of pre-treated clay (MTK or MONT), 1 g of NaOH, 1.3 g of sodium silicate, 13 g of distilled water, and 4 g of TPAOH were added together and the reaction mixture was stirred until it became homogeneous. Afterward, 11 mL of Ludox HS 40 were added dropwise into the mixture and left to stir for 1 h. The resulting gel was transferred to a 100 mL stainless-steel autoclave and heated at 170 °C for 2 days. The precipitate was recovered by filtration, washed several times with distilled water until neutral pH, then dried at 80 °C overnight. Finally, the dried powder was calcined at 550 °C for 8 h (5 °C/min). The resulting calcined powders are labelled MTK-MFI and MONT-MFI in relation to the clay source. For comparison, a classical ZSM-5 zeolite was prepared according to the literature [31], and named SYNT-MFI.

3.3. Photo-Fenton Catalyst Preparation

The melt infiltration (MI) method was used to prepare FeOx/ZSM-5 catalysts. The iron precursor, Fe(NO3)3·9H2O, was mixed with the uncalcined dried zeolite by gentle grinding at room temperature for 30 min [32]. The mass of precursor was chosen in order to have a final Fe loading of 10 wt.% after calcination. The ground powder was thermally treated in a closed PTFE flask at the melting point of the precursor (49 °C) for 4 days and the resulting solid was calcined at 550 °C for 8 h (5 °C/min). The resulting catalysts are labelled Fe/MTK-MFI, Fe/MONT-MFI, and Fe/SYNT-MFI.

3.4. Characterization

X-ray diffraction (XRD) analyses were performed using a D8 Advanced diffractometer from Bruker (Billerica, MA, USA) equipped with a Cu Kα1 monochromatic radiation source and operated at 40 kV and 30 mA. X-ray diffractograms were observed in the 5–60 ° region and were recorded with a pitch of 0.05 ° (step time = 1 s). The crystallites average size was estimated using the Scherrer equation, as follows:
d   ( Å ) = 0.9 λ β c o s θ
where d is the average crystallites size; λ is the X-ray wavelength (1, 5418 Å); and β and θ are the peaks width at half the maximum intensity and Bragg angle in radians, respectively.
Adsorption–desorption isotherms of N2 were measured at 77 K on a TriStar II Plus device from Micromeritics (Norcross, GA, USA). The samples were degassed under primary vacuum at 300 °C overnight to remove water molecules. The specific surface area was evaluated by the Brunauer–Emmet–Teller (BET) method, the total pore volume was estimated at p/p0 = 0.95, and the micropore volume was determined by the Dubinin–Astakhov equation. Scanning electron microscopy (SEM) pictures were taken using a JSM-7800F microscope from JEOL Ltd. (Tokyo, Japan) operated at a voltage of 5.00 kV. Prior to observation, the samples were coated with 200 nm of carbon. Temperature-programmed ammonia desorption experiments (NH3-TPD) were performed on a Autochem II 2920 analyzer instrument from Micromeritics (Norcross, GA, USA). The ammonia concentration in the output mixture was monitored using an OmnistarTM mass spectrometer from Pfeiffer (Asslar, Germany). Before desorption, samples were first degassed under helium at 200 °C for 60 min (10 °C/min), then saturated using a flow of 10% NH3 in He (30 mL/min) at 130 °C for 30 min. X-ray photoelectron spectroscopy (XPS) analyses were performed on an Axis UltraDLD spectrometer from Kratos (Manchester, UK) operated under ultrahigh vacuum conditions, using a twin Al X-ray source (1486.6 eV) at a pass energy of 40 eV. All binding energies were calibrated with the C 1s core level at B.E. of 285 eV. 27Al MAS-NMR experiments were performed at 208.5 MHz on a Bruker AVANCE III 18.8T spectrometer from Bruker (Billerica, MA, USA) equipped with a 3.2 mm probe head operating at spinning frequencies of 20–22 kHz. Al quantification was directly obtained by signal integration. ICP-OES analyses were performed on a 700 Series inductively coupled plasma-optical emission spectrometer from Agilent Technologies (Santa Clara, CA, USA). The materials were dissolved in a concentrated HCl/HNO3 mixture before analysis. High angle annular dark field (HAADF) imaging and scanning transmission electron microscopy–energy dispersive X-ray spectroscopy (STEM–EDX) were conducted using a Titan Themis from FEI (Hillsboro, OR, USA) operated at 300 kV. Samples were observed as thin foils (50 nm), which were prepared using an Ultracut S ultramicrotome from Leica Microsystems (Wetzlar, Germany), after dispersion of the samples within an epoxy resin and curing. Diffuse Reflectance UV−vis Spectroscopy was performed on a Cary 5000 spectrometer from Agilent Technologies (Santa Clara, CA, USA), with a Praying Mantis accessory for powder samples. Spectra were recorded from 200−800 nm (1 nm resolution) and analyzed using the Kubelka−Munk function. The band gap energy (Eg) was determined by plotting [(F(R)hν)] against photon energy (), where F(R) is derived from reflectance (R).

3.5. Adsorption Tests

The adsorption of MB was carried out at room temperature (20 ± 0.1 °C) in a round bottom flask containing 38 mL of MB solution at a concentration of 10.01 mg/L (higher limit for dosage by UV–visible spectrophotometry) and 75 mg of material, stirred at 300 rpm. Aliquots (1 mL) were regularly sampled to follow the solution decolorization using a Cary 5000 spectrometer from Agilent Technologies (Santa Clara, CA, USA). Of note, the peak of maximal absorption of MB is at 665 nm. The adsorption rate (R) and adsorption capacity (Qt) were determined using the following equations below:
R   ( % ) = ( 1 C t C 0 ) × 100
q t   ( mg / g ) = C 0 C t m × V
where C0 is the initial concentration (mg/L); Ct is the concentration after t time of adsorption (mg/L); V is the volume of the solution (L); and m is the mass of adsorbent (g).
Adsorption kinetics were described using the pseudo first-order kinetic equation, as follows [19]:
d q t d t = k 1 ( q e q t )
where   q e and q t (mg/g) represent the quantities of MB adsorbed at equilibrium and at time t (min), respectively; and k1 represents the pseudo-first-order kinetic constant. After integrating the equation and using the initial conditions q t = 0 at t = 0, the integrated form of equation becomes
l n q e q t = ln q e k 1

3.6. Photocatalytic Tests

Unless stated otherwise, similar conditions as for the adsorption tests were used (20 °C, 38 mL of 10.01 mg/L MB solution, 75 mg of material, 300 rpm). The pH of the solution was adjusted using 1M HNO3. After 1 h of equilibrium in the dark, 0.3 mL of H2O2 were added and a 370 nm LED photoreaction lighting (PR160L from Kessil (Richmond, CA, USA) was switched on. The average intensity is 137 mW/cm2. Aliquots (1 mL) were regularly sampled from 5 min to follow the solution decolorization using a UV–visible spectrophotometer, and R and Qt were determined using the equations provided above. After 1 h of irradiation, the temperature of the solution was increased to 40 °C. For the cyclability tests, the catalyst was recovered by centrifugation, washed with water, and directly reused as such.

4. Conclusions

The main objective was to develop an economical synthesis process to produce ZSM-5 zeolites starting from acid-activated metakaolin and montmorillonite clays as an alternative source of Si and Al. After zeolitization (dissolution–recrystallization), all characterization results show that the zeolites prepared from clays were similar to their conventional counterpart. The presence of impurities does not seem to affect much their physico-chemical properties nor their methylene blue adsorption ability. Moreover, the best adsorbent out of the prepared series was the zeolite prepared from metakaolin, owing to its high BET surface area and presence of mesopores. Furthermore, up to 10 wt.% of iron oxide nanoparticles were loaded onto the zeolites and the as-prepared catalysts were applied under photo-Fenton conditions, leading to a removal of 80 to 98% of MB after only 10 min. The most active catalyst, again made from metakaolin, was reused up to four times with no reduction in activity. It was shown that, following the melt impregnation procedure, smaller NPs were obtained on the zeolite made from metakaolin. Therefore, such material could be considered as a cheaper and more efficient alternative for advanced oxidation processes. A future study should focus on optimizing the Si/Al ratio of the zeolites and studying the effect of •OH radicals over zeolites dealumination, which could impact the long-term stability of the catalysts.

Supplementary Materials

The following supporting information can be downloaded at https://www.mdpi.com/article/10.3390/catal15020188/s1, Figure S1. XRD diffractograms of (blue) natural kaolinite clay, (orange) metakaolin prior and (gray) after acid treatment (MTK), (yellow) commercial montmorillonite prior and (green) after acid washing (MONT); Figure S2. SEM images of (a) MTK-MFI, (b) MONT-MFI, and (c, d) SYNT-MFI; Table S1. Chemical composition of MTK and the MTK-MFI zeolite as given by ICP-OES; Figure S3. 27Al MAS NMR spectra of MTK-MFI (blue) and SYNT-MFI (red); Figure S4. N2 physisorption isotherms of (a) montmorillonite and (b) kaolin clay before and after treatment; Figure S5. NH3-TPD of as-prepared zeolites: (blue) MTK-MFI, (red) SYNT-MFI, and (green) MONT-MFI; Figure S6. Adsorption kinetic curves following the pseudo-first order model: (a) MTK-MFI, (b) SYNT-MFI, and (c) MONT-MFI. qe and qt (mg/g) represent the quantities of MB adsorbed at equilibrium and at time t (min), respectively; Figure S7. XRD patterns of (black) reference Fe2O3 [1], (red) Fe/SYNTH-MFI, (blue) Fe/MTK- MFI, and (green) Fe/MONT-MFI; Figure S8. SEM images and related EDS mapping (Fe Kα1) of (a) Fe/MTK-MFI, (b) Fe/MONT-MFI, and (c) Fe/SYNT-MFI. Scale bars = 5 μm (a, c), 10 μm (b); Table S2. Chemical composition of the photo-Fenton catalysts as given by ICP-OES; Figure S9. High-resolution Fe 2p XPS surveys of (a) Fe/MTK-MFI, (b) Fe/MONT-MFI, (c) Fe/SYNT-MFI, and (d) Fe/MTK-MFI after test; Table S3. Chemical composition of the photo-Fenton catalysts as given by XPS analysis; Figure S10. MB adsorption curves using (a) Fe/SYNT-MFI and (b) Fe/MTK-MFI. Initial MB concentration = 10.01 mg/L, zeolite concentration = 1.97 g/L, room temperature; Figure S11. MB removal under photo-Fenton conditions using MTK-MFI. Initial MB concentration = 10.01 mg/L, MTK-MFI concentration = 1.97 g/L, initial H2O2 concentration = 2.61 g/L; Figure S12. MB photodegradation kinetic curves following the pseudo-first-order model: (a) MTK-MFI, (b) SYNTH-MFI, and (c) MONT-MFI; Table S4. Data from the photodegradation kinetic curves following the pseudo-first-order model; Table S5. Data from the photodegradation kinetic curves following the pseudo-first order model; Table S6. Total organic content (TOC) determined following the non-purgeable organic carbon method (NPOC); Figure S13. MB removal under photo-Fenton conditions. Initial MB concentration = 10.01 mg/L, FeSO4·5H2O concentration = 77 mg/L, initial H2O2 concentration = 2.61 g/L; Figure S14. XRD diffractograms of (a) reference Fe2O3, (b) MTK-MFI before, and (c) after catalytic stability tests; Figure S15. N2 physisorption isotherms of Fe/MTK-MFI before (blue) and after the cyclability test (orange). References [33,34,35,36,37,38] are cited in the Supplementary Materials.

Author Contributions

Conceptualization, K.S.K. and J.D.; methodology, J.D.; investigation, K.S.K.; resources, J.D.; writing—original draft preparation, K.S.K.; writing—review and editing, J.D.; visualization, K.S.K. and J.D.; supervision, E.T. and J.D.; project administration, E.T. and J.D.; funding acquisition, K.S.K. and J.D. All authors have read and agreed to the published version of the manuscript.

Funding

This research was funded by the Ministry of Higher Education and Scientific Research of Ivory Coast (PhD mobility fellowship K.S. Kouadio).

Data Availability Statement

Data available upon request.

Acknowledgments

The CNRS, the Chevreul Institute (FR 2638), the Ministère de l’Enseignement Supérieur et de la Recherche, the Région Hauts-de-France, and the FEDER are acknowledged for supporting this work through the Archi-CM 3.2 UPCAT project. K.S. Kouadio is grateful to the Ministry of Higher Education and Scientific Research of Ivory Coast for financial support.

Conflicts of Interest

The authors declare no conflicts of interest.

Abbreviations

The following abbreviations are used in this manuscript:
IPCAIntegrated photocatalyst adsorbent
MBMethylene blue
AOPAdvanced oxidation process
NPsNanoparticles
MTKMetakaolin after acid washing
MONTMontmorillonite after acid washing

References

  1. Al-Tohamy, R.; Ali, S.S.; Li, F.; Okasha, K.M.; Mahmoud, Y.A.-G.; Elsamahy, T.; Jiao, H.; Fu, Y.; Sun, J. A critical review on the treatment of dye-containing wastewater: Ecotoxicological and health concerns of textile dyes and possible remediation approaches for environmental safety. Ecotoxicol. Environ. Saf. 2022, 231, 113160. [Google Scholar] [CrossRef] [PubMed]
  2. Ji, Y.; Xu, F.; Wei, W.; Gao, H.; Zhang, K.; Zhang, G.; Xu, Y.; Zhang, P. Efficient and fast adsorption of methylene blue dye onto a nanosheet MFI zeolite. J. Solid State Chem. 2021, 295, 121917. [Google Scholar] [CrossRef]
  3. Azha, S.F.; Shamsudin, M.S.; Shahadat, M.; Ismail, S. Low cost zwitterionic adsorbent coating for treatment of anionic and cationic dyes. J. Ind. Eng. Chem. 2018, 67, 187–198. [Google Scholar] [CrossRef]
  4. Zhang, P.; O’Connor, D.; Wang, Y.; Jiang, L.; Xia, T.; Wang, L.; Tsang, D.C.W.; Sik Ok, Y.; Hou, D. A green biochar/iron oxide composite for methylene blue removal. J. Hazard. Mater. 2020, 384, 121286. [Google Scholar] [CrossRef]
  5. Lundehøj, L.; Jensen, H.C.; Wybrandt, L.; Nielsen, U.G.; Christensen, M.L.; Quist-Jensen, C.A. Layered double hydroxides for phosphorus recovery from acidified and non-acidified dewatered sludge. Water Res. 2019, 153, 208–216. [Google Scholar] [CrossRef]
  6. Kumar, N.; Nieminen, V.; Demirkan, K.; Salmi, T.; Murzin, D.Y.; Laine, E. Effect of synthesis time and mode of stirring on physico-chemical and catalytic properties of ZSM-5 zeolite catalysts. Appl. Catal. A Gen. 2002, 235, 113–123. [Google Scholar] [CrossRef]
  7. Richards, M.D.; Pope, C.G. Adsorption of Methylene Blue from aqueous solutions by amorphous aluminosilicate gels and zeolite X. J. Chem. Soc.—Faraday Trans. 1996, 92, 317–323. [Google Scholar] [CrossRef]
  8. Hadda Aya, H.; Djamel, N.; Samira, A.; Otero, M.; Ali Khan, M. Optimizing methylene blue adsorption conditions on hydrothermally synthesized NaX zeolite through a full two-level factorial design. RSC Adv. 2024, 14, 23816–23827. [Google Scholar] [CrossRef]
  9. Melgoza, D.; Hernández-Ramírez, A.; Peralta-Hernández, J.M. Comparative efficiencies of the decolourisation of Methylene Blue using Fenton’s and photo-Fenton’s reactions. Photochem. Photobiol. Sci. 2009, 8, 596–599. [Google Scholar] [CrossRef]
  10. Zhu, Y.; Zhu, R.; Xi, Y.; Zhu, J.; Zhu, G.; He, H. Strategies for enhancing the heterogeneous fenton catalytic reactivity: A review. Appl. Catal. B Environ. 2019, 255, 117739. [Google Scholar] [CrossRef]
  11. Shangguan, Z.; Yuan, X.; Jiang, L.; Zhao, Y.; Qin, L.; Zhou, X.; Wu, Y.; Chew, J.W.; Wang, H. Zeolite-based Fenton-like catalysis for pollutant removal and reclamation from wastewater. Chin. Chem. Lett. 2022, 33, 4719–4731. [Google Scholar] [CrossRef]
  12. Quynh, H.G.; Thanh, H.V.; Phuong, N.T.T.; Duy, N.P.T.; Hung, L.H.; Dung, N.V.; Duong, N.T.H.; Long, N.Q. Rapid removal of methylene blue by a heterogeneous photo-Fenton process using economical and simple-synthesized magnetite–zeolite composite. Environ. Technol. Innov. 2023, 31, 103155. [Google Scholar] [CrossRef]
  13. Ning, M.; Li, L.; Xu, X. Degradation of Methylene Blue Using Fe-ZSM-5 Zeolite as a Heterogeneous Fenton Catalyst. J. Phys. Conf. Ser. 2023, 2463, 012055. [Google Scholar] [CrossRef]
  14. Schumacher de Oliveira, J.; Mazutti, M.A.; Urquieta-González, E.A.; Foletto, E.L. Preparation of Mesoporous Fe2O3-Supported ZSM-5 Zeolites by Carbon-Templating and their Evaluation as Photo-Fenton Catalysts to Degrade Organic Pollutant. Mater. Res. 2016, 19, 1399–1406. [Google Scholar] [CrossRef]
  15. Park, J.H.; Wang, J.J.; Park, K.H.; Seo, D.C. Heterogeneous fenton oxidation of methylene blue with Fe-impregnated biochar catalyst. Biochar 2020, 2, 165–176. [Google Scholar] [CrossRef]
  16. Wu, Z.; Zhu, W.; Zhang, M.; Lin, Y.; Xu, N.; Chen, F.; Wang, D.; Chen, Z. Adsorption and Synergetic Fenton-like Degradation of Methylene Blue by a Novel Mesoporous α-Fe2O3/SiO2 at Neutral pH. Ind. Eng. Chem. Res. 2018, 57, 5539–5549. [Google Scholar] [CrossRef]
  17. Šuligoj, A.; Ristić, A.; Dražić, G.; Pintar, A.; Logar, N.Z.; Tušar, N.N. Bimetal Cu-Mn porous silica-supported catalyst for Fenton-like degradation of organic dyes in wastewater at neutral pH. Catal. Today 2020, 358, 270–277. [Google Scholar] [CrossRef]
  18. Liu, Y.; Jin, W.; Zhao, Y.; Zhang, G.; Zhang, W. Enhanced catalytic degradation of methylene blue by α-Fe2O3/graphene oxide via heterogeneous photo-Fenton reactions. Appl. Catal. B Environ. 2017, 206, 642–652. [Google Scholar] [CrossRef]
  19. Geng, T.; Yan, J.; Li, B.; Yan, H.; Guo, L.; Sun, Q.; Guan, Z.; Zhao, C.; Xu, J.; Wang, W. Efficient degradation of methylene blue at near neutral pH based on heterogeneous Fenton-like system catalyzed by Fe2O3/MnO2. Results Chem. 2024, 11, 101795. [Google Scholar] [CrossRef]
  20. Aguilar-Mamani, W.; García, G.; Hedlund, J.; Mouzon, J. Comparison between leached metakaolin and leached diatomaceous earth as raw materials for the synthesis of ZSM-5. SpringerPlus 2014, 3, 292. [Google Scholar] [CrossRef]
  21. Schmidt, W.; Wilczok, U.; Weidenthaler, C.; Medenbach, O.; Goddard, R.; Buth, G.; Cepak, A. Preparation and morphology of pyramidal MFI single-crystal segments. J. Phys. Chem. B 2007, 111, 13538–13543. [Google Scholar] [CrossRef] [PubMed]
  22. Taufiqurrahmi, N.; Mohamed, A.R.; Bhatia, S. Nanocrystalline zeolite beta and zeolite y as catalysts in used palm oil cracking for the production of biofuel. J. Nanopart. Res. 2011, 13, 3177–3189. [Google Scholar] [CrossRef]
  23. Iryani, A.; Nur, H.; Santoso, M.; Hartanto, D. Adsorption study of rhodamine B and methylene blue dyes with ZSM-5 directly synthesized from Bangka Kaolin without organic template. Indones. J. Chem. 2020, 20, 130–140. [Google Scholar] [CrossRef]
  24. Litter, M.I.; Slodowicz, M. An overview on heterogeneous Fenton and photoFenton reactions using zerovalent iron materials. J. Adv. Oxid. Technol. 2017, 20, 20160164. [Google Scholar] [CrossRef]
  25. Piccinin, S. The band structure and optical absorption of hematite (α-Fe2O3): A first-principles GW-BSE study. Phys. Chem. Chem. Phys. 2019, 21, 2957–2967. [Google Scholar] [CrossRef] [PubMed]
  26. Deotale, A.J.; Nandedkar, R.V. Correlation between Particle Size, Strain and Band Gap of Iron Oxide Nanoparticles. Mater. Today Proc. 2016, 3, 2069–2076. [Google Scholar] [CrossRef]
  27. Kyriakou, G.; Theocharis, C.R. The Anomalous Sorptive Behaviour of Zsm-5 And Silicalite-I: Observation of Low-Pressure Hysteresis in Nitrogen Adsorption. Stud. Surf. Sci. Catal. 2002, 144, 709–716. [Google Scholar] [CrossRef]
  28. Ravenelle, R.M.; Schüβler, F.; D’Amico, A.; Danilina, N.; van Bokhoven, J.A.; Lercher, J.A.; Jones, C.W.; Sievers, C. Stability of Zeolites in Hot Liquid Water. J. Phys. Chem. C 2010, 114, 19582–19595. [Google Scholar] [CrossRef]
  29. Feng, G.; Cheng, P.; Yan, W.; Boronat, M.; Li, X.; Su, J.-H.; Wang, J.; Li, Y.; Corma, A.; Xu, R.; et al. Accelerated crystallization of zeolites via hydroxyl free radicals. Science 2016, 351, 1188–1191. [Google Scholar] [CrossRef]
  30. Aguilar-Mamani, W.; Akhtar, F.; Hedlund, J.; Mouzon, J. Solution-mediated growth of NBA-ZSM-5 crystals retarded by gel entrapment. J. Cryst. Growth 2018, 487, 57–64. [Google Scholar] [CrossRef]
  31. Comboni, D.; Pagliaro, F.; Lotti, P.; Gatta, G.D.; Merlini, M.; Milani, S.; Migliori, M.; Giordano, G.; Catizzone, E.; Collings, I.E.; et al. The elastic behavior of zeolitic frameworks: The case of MFI type zeolite under high pressure methanol intrusion. Catal. Today 2020, 345, 88–96. [Google Scholar] [CrossRef]
  32. Deplazes, R.; Teles, C.A.; Ciotonea, C.; Sfeir, A.; Canilho, N.; Richard, F.; Royer, S. Melt infiltration for the preparation of finely dispersed Ni-FeOx nanoparticles on SBA-15 for the hydrodeoxygenation of m-cresol. Catal. Today 2024, 430, 114514. [Google Scholar] [CrossRef]
  33. Jiang, X.; Li, L.; Cui, Y.; Cui, F. New branch on old tree: Green-synthesized RGO/Fe3O4 composite as a photo-Fenton catalyst for rapid decomposition of methylene blue. Ceram. Int. 2017, 43, 14361–14368. [Google Scholar] [CrossRef]
  34. Almojil, S.F.; Ning, J.; Almohana, A.I. Photo-Fenton process for degradation of methylene blue using copper ferrite@sepiolite clay. Inorg. Chem. Commun. 2024, 166, 112623. [Google Scholar] [CrossRef]
  35. Zhang, J.; Hu, F.T.; Liu, Q.Q.; Zhao, X.; Liu, S.Q. Application of heterogenous catalyst of tris(1,10)-phenanthroline iron(II) loaded on zeolite for the photo-Fenton degradation of methylene blue. React. Kinet. Mech. Catal. 2011, 103, 299–310. [Google Scholar] [CrossRef]
  36. Ashraf, G.A.; Rasool, R.T.; Hassan, M.; Zhang, L.; Guo, H. Heterogeneous catalytic activation of BaCu-based M-hexaferrite nanoparticles for methylene blue degradation under photo-Fenton-like system. Mol. Catal. 2021, 505, 111501. [Google Scholar] [CrossRef]
  37. Quynh, H.G.; Kiet, N.A.; Van Thanh, H.; Tue, T.M.; Phuong, N.T.T.; Long, N.Q. Removal of aqueous organic pollutant by photo-Fenton process using low-cost Fe3O4/zeolite A. IOP Conf. Ser. Earth Environ. Sci. 2021, 947, 012013. [Google Scholar] [CrossRef]
  38. Finger, L.W.; Hazen, R.M. Crystal Structure and Isothermal Compression of Fe2O3, Cr2O3, and V2O3 to 50 Kbars. J. Appl. Phys. 1980, 51, 5362–5367. [Google Scholar] [CrossRef]
Figure 1. XRD diffractograms of (a) reference ZSM-5 zeolite [21], (b) SYNT-MFI, (c) MTK-MFI, and (d) MONT-MFI.
Catalysts 15 00188 g001
Figure 2. SEM images of (a) kaolin clay, (b) MTK-MFI, (c) commercial montmorillonite, and (d) MONT-MFI. Scale bars = 1 μm.
Catalysts 15 00188 g002
Figure 3. N2 physisorption isotherms of MTK-MFI (blue), MONT-MFI (green), and SYNT-MFI (red). Isotherms have been vertically shifted by 1 mmol/g from one another.
Catalysts 15 00188 g003
Figure 4. MB adsorption curves using the as-prepared ZSM-5 zeolites. Initial MB concentration = 10.01 mg/L, zeolite concentration = 1.97 g/L, room temperature.
Catalysts 15 00188 g004
Figure 5. (a) MB removal curves using Fe/MFI catalysts under photo-Fenton conditions. Initial MB concentration = 10.01 mg/L, zeolite concentration = 1.97 g/L, initial H2O2 concentration = 2.61 g/L; (b) Cyclability of Fe/MTK-MFI under photo-Fenton conditions.
Catalysts 15 00188 g005
Figure 6. HR HAADF images of (a,b) Fe/SYNT-MFI and (c,d) Fe/MTK-MFI, and corresponding STEM–EDX maps of Fe (red), Al (green), and Si (blue).
Catalysts 15 00188 g006
Figure 7. UV–visible diffuse reflectance spectra of (red) SYNT-MFI and (blue) MTK-MFI. Insert: their relative energy band gap profiles.
Catalysts 15 00188 g007
Table 1. Textural and acidic properties of the clays and as-prepared ZSM-5 zeolites.
MaterialsSBET
(m2/g)
Vtotal
(cm3/g)
Vmicro
(cm3/g)
Vmeso
(cm3/g)
Acidity
(mmol NH3/g)
Metakaolin12.680.040.000.04-
MTK188.30.120.070.05-
MONT224.60.360.090.27-
MTK-MFI324.00.180.120.060.63
MONT-MFI330.40.260.130.130.88
SYNT-MFI321.40.150.130.020.92
Table 2. Adsorption results at 25 °C and data from the adsorption kinetic curves following the pseudo-first-order model.
MaterialsExperimental DataAdsorption Kinetic Model
% Removalqe Exp.
(mg/g)
k1qe Theor.
(mg/g)
R2
MTK-MFI98.04.980.164.940.96
SYNT-MFI88.64.500.215.950.99
MONT-MFI84.54.280.114.230.91
Table 3. Main properties of the photo-Fenton Fe/MFI catalysts and their MB removal capacity.
CatalystsFe2O3 NPs (nm) aFe
(wt.%) b
Fe
(wt.%) c
MB Removal (%) d
Fe/MTK-MFI299.61.597.6
Fe/SYNT-MFI328.42.290.5
Fe/MONT-MFI312.0 *2.180.8
a determined from XRD using the Scherrer equation; b bulk iron loading based on ICP-OES; c surface iron loading based on XPS; * uncomplete dissolution supposed; d obtained after 10 min.
Disclaimer/Publisher’s Note: The statements, opinions and data contained in all publications are solely those of the individual author(s) and contributor(s) and not of MDPI and/or the editor(s). MDPI and/or the editor(s) disclaim responsibility for any injury to people or property resulting from any ideas, methods, instructions or products referred to in the content.

