Article

Fe3O4@SiO2@WO3 Multifunctional Composite Photocatalyst with Magnetic Core and Dual Shells

1
Department of Food Engineering, Chemistry, Harbin University, Harbin 150086, China
2
College of Chemistry and Chemical Engineering, Xi’an University of Science and Technology, Xi’an 710054, China
*
Author to whom correspondence should be addressed.
Catalysts 2025, 15(4), 314; https://doi.org/10.3390/catal15040314
Submission received: 3 February 2025 / Revised: 22 March 2025 / Accepted: 24 March 2025 / Published: 26 March 2025
(This article belongs to the Section Photocatalysis)

Abstract

:
WO3 has attracted great attention in the field of catalysts due to its excellent photocatalytic performance. However, the difficulty in recycling and low reuse percentage of nano WO3 limit its application. This paper used the hydrothermal method to prepare an Fe3O4@SiO2@WO3 core–shell nanocatalyst. Its composition and structure were characterized by various techniques including XRD, FT-IR, and Raman analyses, which confirmed the successful preparation of a core–shell-structured catalyst with a strong response to an external magnetic field. In the degradation experiment of rhodamine B solution (RhB), the composite catalyst with a WO3 doping amount of 0.8 g and catalyst dosage amount of 30 mg had the best catalytic degradation effect on 10 ppm RhB, with a degradation efficiency of 99.80%. Due to its high transparency and ion conductivity, SiO2 did not affect the performance of the composite catalyst, but could effectively reduce the corrosion of WO3 by the reaction solution. The presence of a SiO2 interlayer prevented any deterioration in the catalytic efficiency of WO3 nanocrystal shells and the chemical and thermal stability of Fe3O4 nuclei. By applying an external magnetic field, this nanocatalyst can be easily recovered from the solution. These features not only maximize the value of this new material, but also provide sustainable solutions for environmental protection, energy crises, and health issues.

Graphical Abstract

1. Introduction

The semiconductor material titanium dioxide, with its wide band gap and high photocatalytic activity, has received much attention from researchers [1]. However, the difficulty of catalyst recovery has limited its application as a photocatalyst. Fe3O4 has the features of both magnetic recovery and photocatalytic activity, but its application is still hindered by the following two aspects. The key problem is the low cycle efficiency of Fe2+/Fe3+, which affects the catalytic efficiency. Moreover, the relatively low decomposition and utilization efficiency of oxidants leads to their wastage. In order to increase the stability and functionalization of magnetic nano-Fe3O4, the surface treatment of Fe3O4 and its combination with other materials are particularly important. Commonly used materials for the modification of Fe3O4 include organic materials such as surfactants, polymers, and biomolecules, as well as inorganic materials including silica, carbon, metals, metal oxides, and sulfides [2,3,4,5].
Tungsten trioxide has potential applications in the fields of photocatalysts, gas sensors, and photochromic devices due to its non-toxicity, stable physical and chemical properties, good photosensitivity, excellent electron transfer performance, and high photocatalytic activity [6,7,8,9]. However, the low-energy conduction band of tungsten trioxide limits the effective separation of electrons and holes, resulting in its low photocatalytic performance [10,11,12].
Due to its high transparency and ion conductivity, SiO2 does not affect catalytic performance, but can effectively reduce the corrosion of WO3 by the reaction solution. Therefore, the presence of a SiO2 interlayer can prevent any deterioration in the catalytic efficiency of WO3 nanocrystal shells and the chemical and thermal stability of Fe3O4 nuclei. For example, Mahsakhoshnam [13] prepared Fe3O4/SiO2/α-Fe2O3 magnetic composite nanoparticles with core–shell structures by a sol–gel method, and applied them to the degradation of methylene blue (MB) dye under UV irradiation. In order to further improve the catalytic performance, Shagolsem [14] prepared Ag/Fe3O4/g-C3N4 composite photocatalyst with high dispersion by a selective photodeposition method. This material not only retained the original magnetism, but also significantly improved the photocatalytic activity and stability during tetracycline degradation. It is known that tungsten and iron oxides can inhibit the crystallization of each other, which is conducive to the uniform dispersion of tungsten and iron components and improvement of oxidation–reduction properties and visible light activity. Xinyu Jia [15] found that WO3/Fe3O4/DT composite showed good photocatalytic performance under both acidic and alkaline conditions for RhB-MO-MB dye mixture, indicating its broad application prospects.
The synthesis of WO3/Fe3O4 photocatalyst is relatively rare, and mainly involves high-temperature calcination [16,17,18]. In this paper, Fe3O4 was loaded with SiO2 and then WO3 was incorporated by the hydrothermal method. This method provided a series of Fe3O4@SiO2@WO3 composites with micro-nano-structures, realized the efficient separation of charges through energy level differences, inhibited the recombination of electrons and holes, and expanded the photoinduced excitation wavelength. Thus, the composite catalyst showed better stability and catalytic activity than single WO3. Moreover, there was strong compatibility between iron and tungsten, and magnetic Fe3O4 greatly improved the recovery efficiency of WO3.

2. Results and Discussion

2.1. XRD Characterization

X-ray diffraction patterns of FSW composites with different doping amounts of WO3 in Fe3O4@SiO2 are shown in Figure 1. The XRD pattern showed a peak around 35°, indicating the presence of Fe3O4 (PDF#75–1609) in the particles. A comparison of standard XRD patterns confirmed that the peak around 24° belonged to WO3 (PDF#33–1387) and the peaks at 26° and 30° corresponded to SiO2 (PDF#65–0466). TEM results also showed that the outermost layer was composed of WO3 nanocrystalline shell, which uniformly covered a thin silica layer.

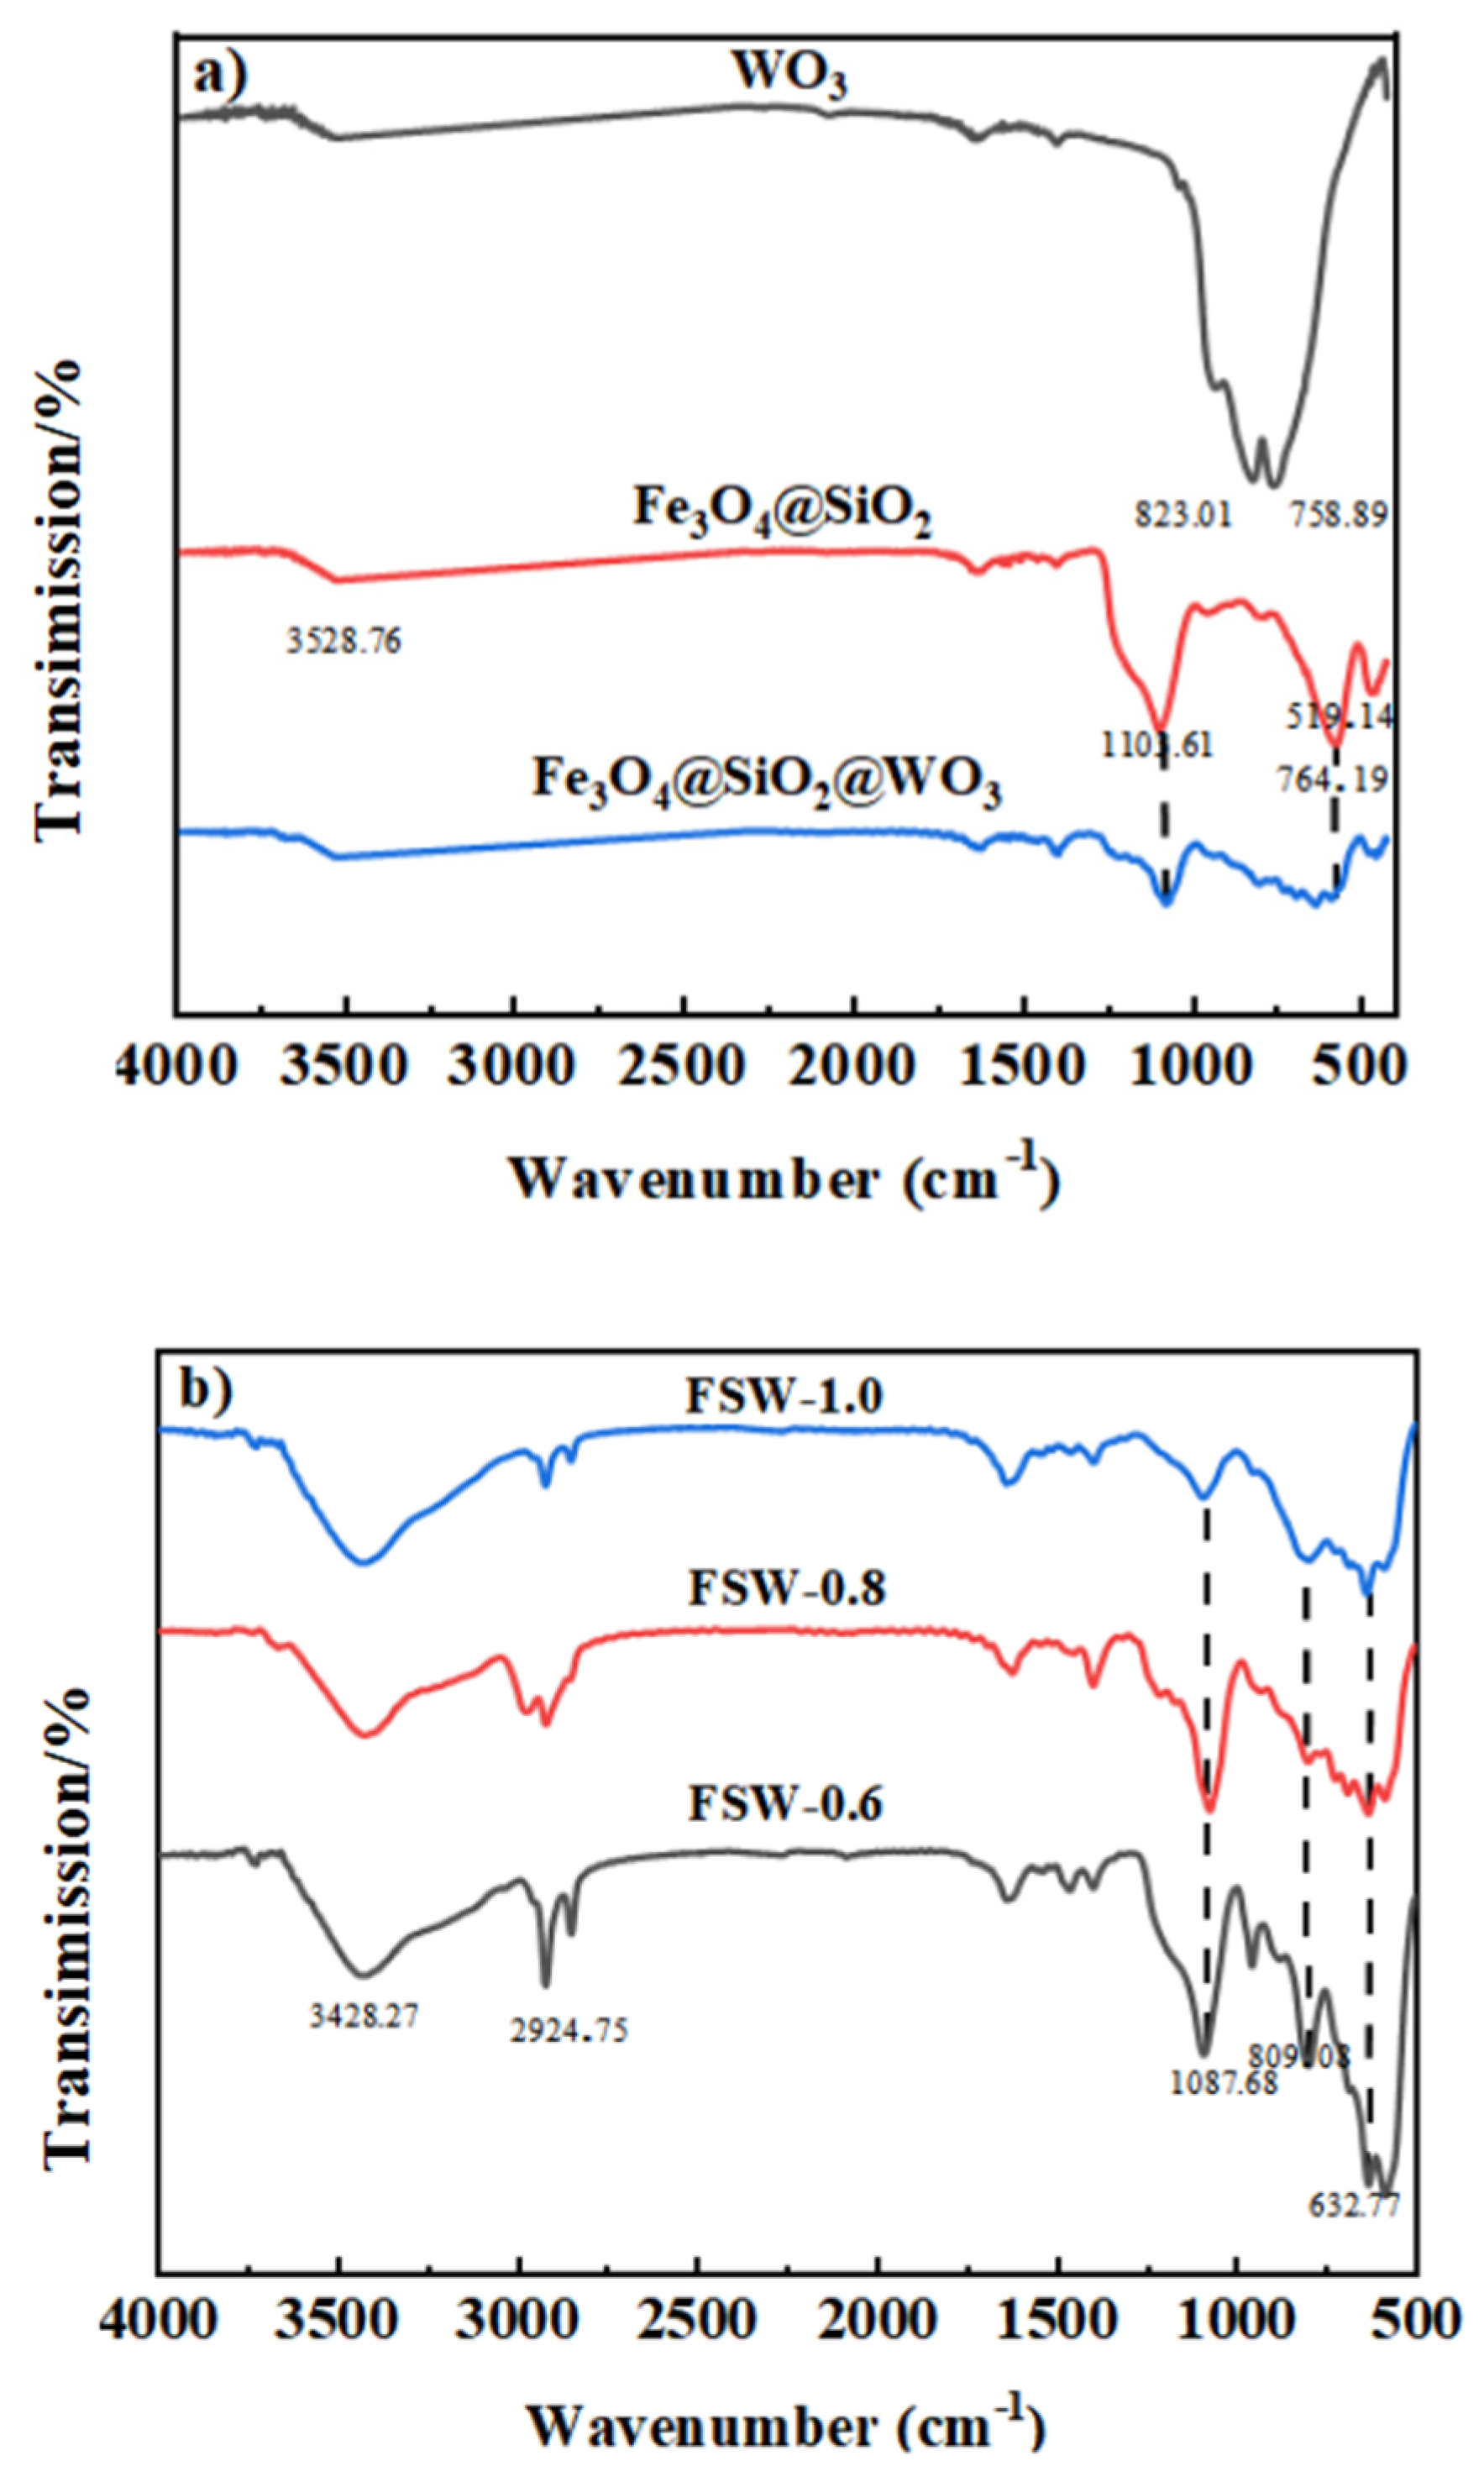
2.2. FT-IR Spectroscopy

In the FT-IR spectrum of FSW composites (Figure 2a), the absorption band at 3528.76 cm−1 belonged to the stretching vibration of surface hydroxyl or adsorbed water, which was due to the re-adsorbed water from the surrounding air [19]. The characteristic peaks at 823.01 cm−1 and 758.89 cm−1 corresponded to WO3, and were related to the O-W-O stretching vibration in the WO3 lattice [20]. Therefore, FT-IR results also confirmed the existence of crystalline WO3 phase in the composite. The strong absorption peak at 1103.61 cm−1 was caused by the anti-symmetric stretching vibration of the Si-O-Si bond. The absorption peak at 764.19 cm−1 was caused by the symmetric stretching vibration of Si-O-Si. The absorption peak at 519.14 cm−1 corresponded to the bending vibration of Si-O-Si and that at 991.27 cm−1 belonged to the symmetric stretching vibration of Si-O-Si. These results showed that Fe3O4 was encapsulated inside the SiO2 film, forming a SiO2-coated magnetic carrier, because no characteristic peak of Fe3O4 was detected. All the characteristic peaks of WO3 and Fe3O4@SiO2 were found in Fe3O4@SiO2@WO3. Hence, there was the same coordination between W and Si in WO3 and Fe3O4@SiO2.
IR spectra of Fe3O4@SiO2@WO3 samples with different WO3 doping amounts are shown in Figure 2b. The IR spectra showed four main peaks at 632.77, 1087.68, 2924.75, and 3428.27 cm−1. The tensile vibration of surface hydroxyl or adsorbed water appeared at 2924.75 and 3428.27cm−1, and the effect of different doping ratios was not obvious. With the increase in WO3 content on the core–shell surface, the Si-O-Si bond motion at 1087.68 cm−1 and 632.77 cm−1 gradually weakened, because the outer layer of WO3 gradually covered SiO2, which affected the signals of SiO2. The O-W-O stretching vibration at 809.08 cm−1 also changed with the increase in the content of WO3. The peak for WO3 was relatively mild for FSW-0.8, indicating that the amount of WO3 reached a good proportion. According to the above analysis, FSW-0.8 was the best.

2.3. Raman Spectroscopy

Raman spectra of nano WO3 (Figure 3a) showed four Raman peaks at 273.96, 327.69, 716.78, and 807.82 cm−1, which corresponded to O-W-O bonds. The sharp and symmetrical Raman peaks revealed that the WO3 nanostructures had a high crystal quality and chemical purity. The tensile and flexural vibrations of the WO3 nanomaterial were shifted to lower frequencies. This may be due to the small size of the material.
Raman spectra of Fe3O4@SiO2 with three different WO3 doping amounts are shown in Figure 3b. The prominent Raman peaks were mainly at 210.29 and 271.10 cm−1, which corresponded to Si-O-Si bonds. After doping WO3, the peak for O-W-O appeared at 804.69 cm−1. No Raman peaks belonging to Fe3O4 were detected in the four samples, indicating that all Fe3O4 microspheres in the samples were encapsulated within the core–shell structure of Fe3O4@SiO2@WO3. As the amount of WO3 was increased on the surface of FSW-1.0, the Raman signal intensity was weakened due to the large difference between the inner core–shell and Fe3O4 core. Comparing FSW-0.6 with FSW-0.8, it was found that the Raman signal intensity and the distribution were better, but the Si-O-Si bond distribution of FSW-0.8 was relatively flat. According to the above results, FSW-0.8 had a better structural distribution because the distribution of WO3 was relatively uniform.

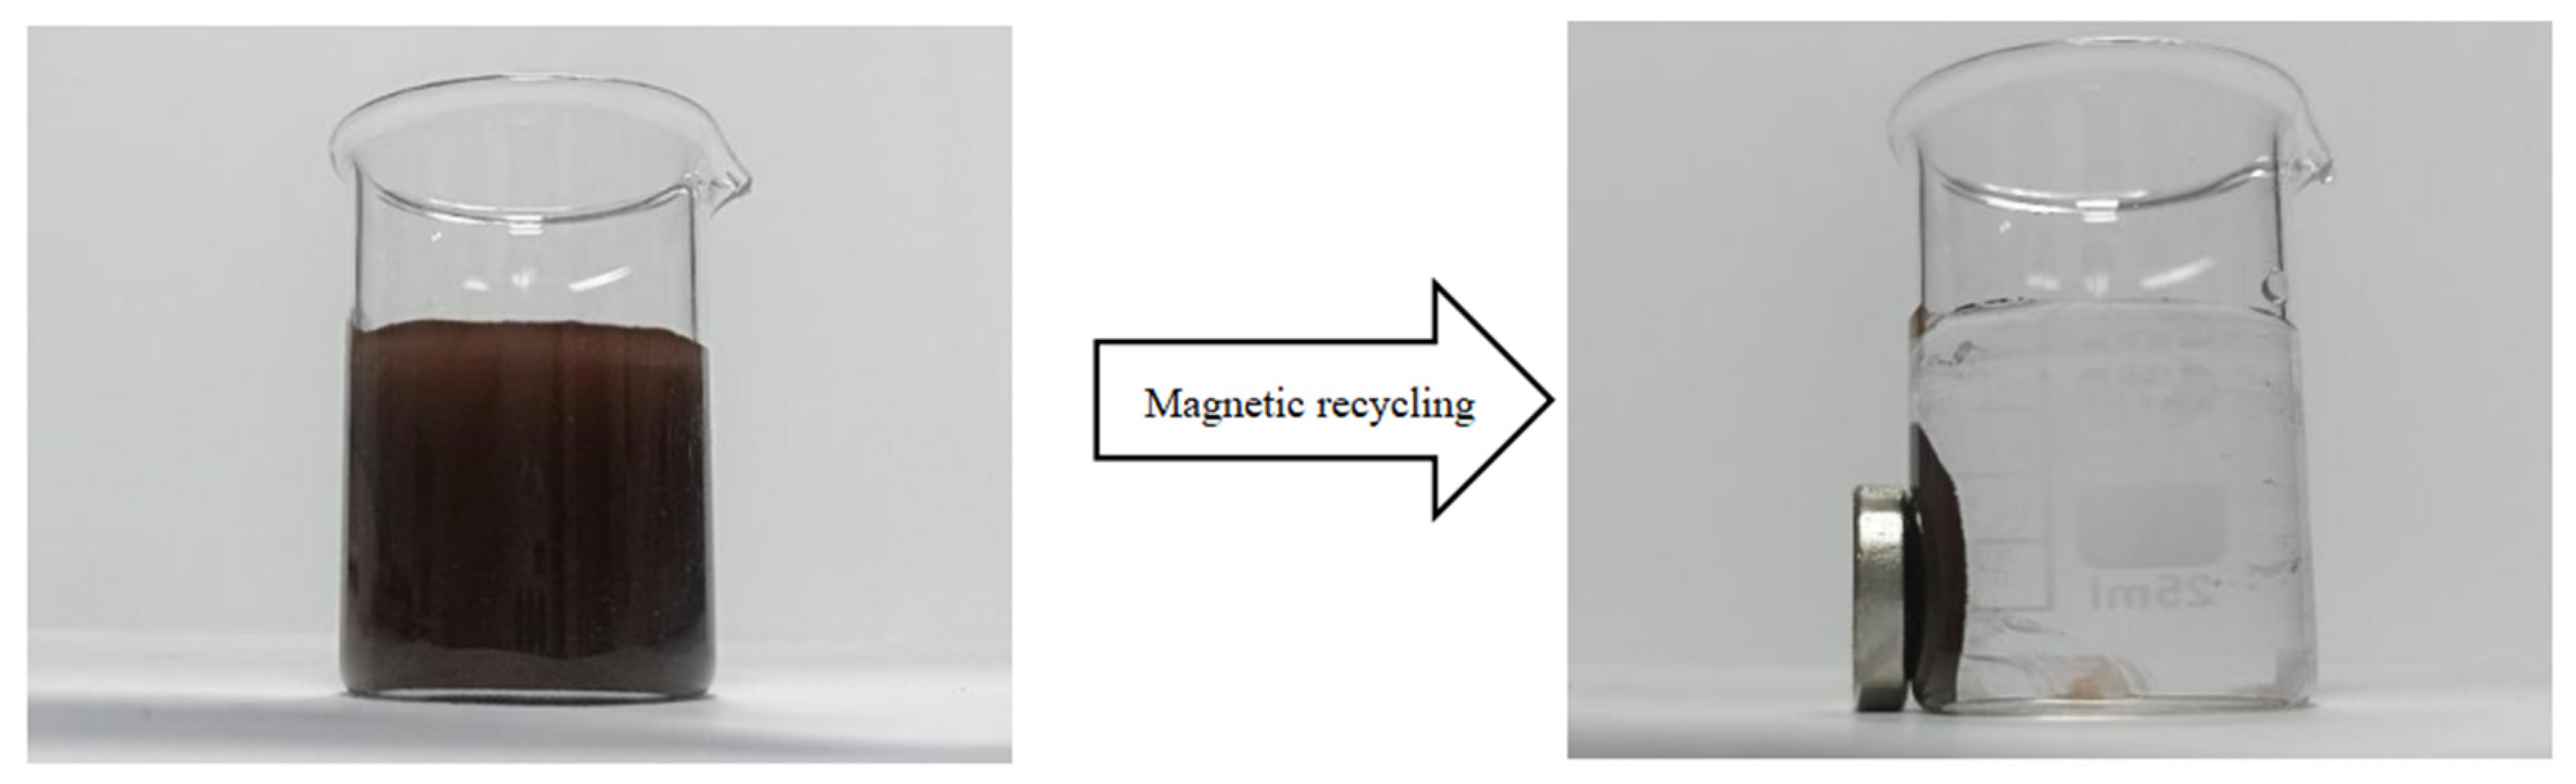
2.4. Magnetic Response Test

The magnet-responsive Fe3O4@SiO2@WO3 nanocatalyst had the advantages of separation and recovery. In this test, Fe3O4@SiO2@WO3 was treated in an ethanol ultrasonic bath for several hours to evaluate the turbidity of the suspension. After placing the magnet close to the sample cup, the solution quickly became transparent within 30 s, and all samples were recovered with slight stirring, as shown in Figure 4. The separation time observed with the doping composition was consistent with the variation in magnetization of the non-magnetic layer thickness. This rapid separation proved the magnetism of the synthesized nanoparticles.

2.5. Catalytic Activity Analysis

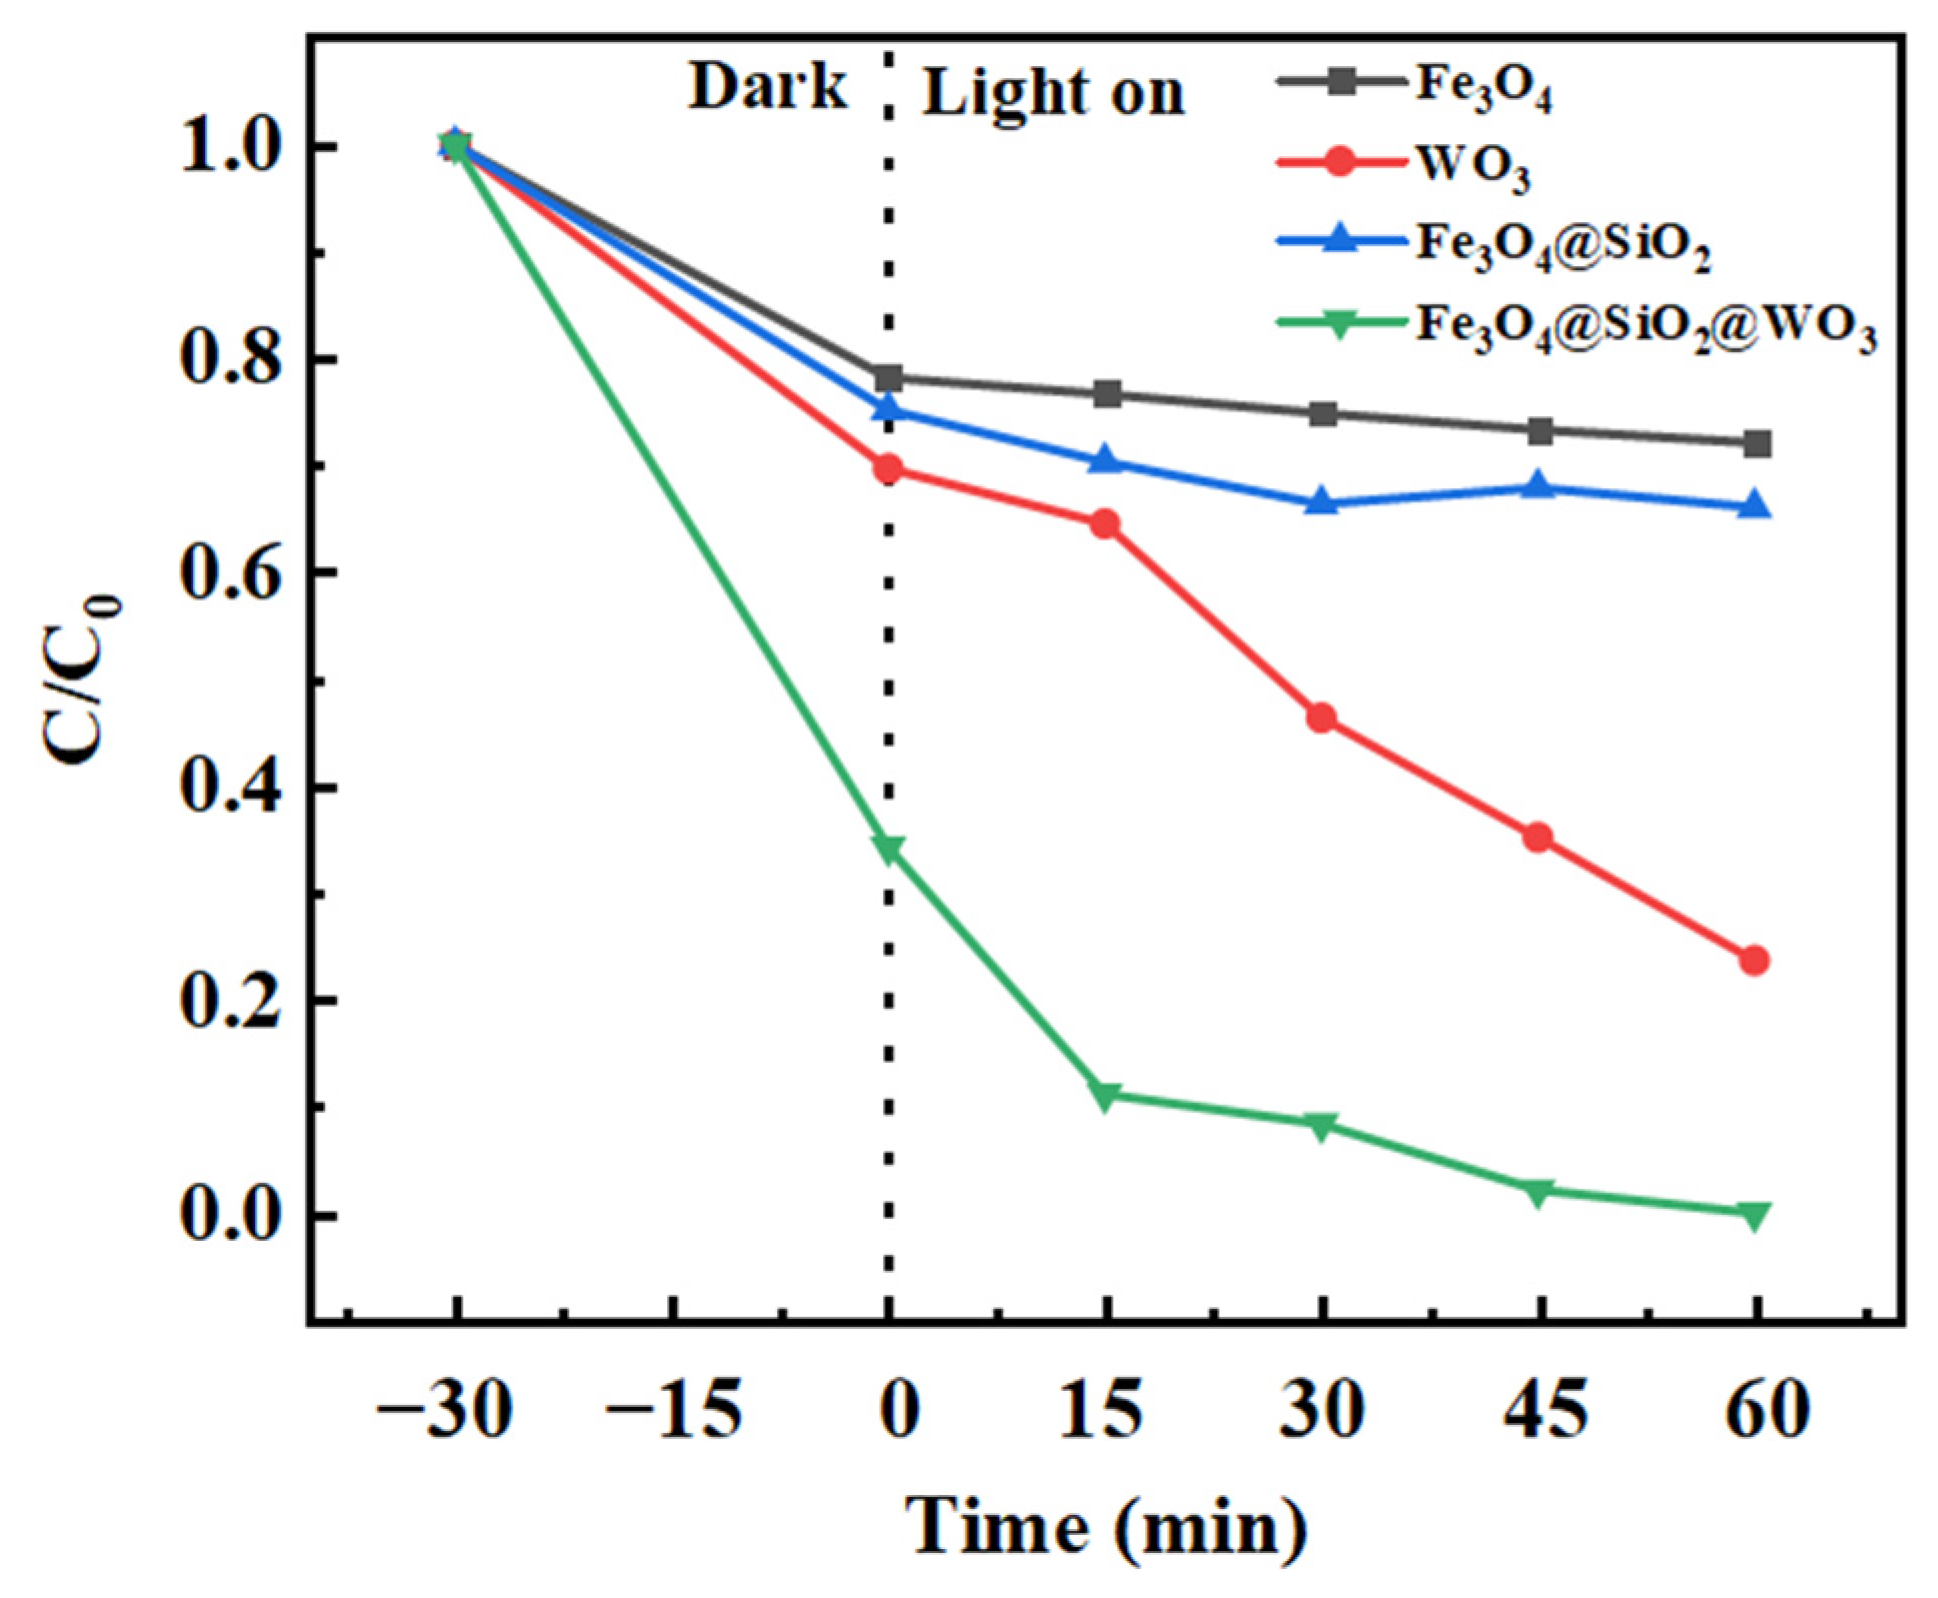
2.5.1. Catalyst Degradation

The catalytic degradation ability of RhB by Fe3O4, WO3, Fe3O4@SiO2, and FSW-0.8 catalyst samples (30 mg) was tested under xenon lamp irradiation, under the same experimental conditions. As seen from the absorbance changes (Figure 5), FSW-0.8 showed the best degradation ability for RhB with the most obvious change.
As seen from Table 1, the degradation of RhB was the worst when Fe3O4 was used alone, and there was no significant change after 60 min light irradiation. The degradation ability of Fe3O4@SiO2 was also not obvious, whereas WO3 showed a strong degradation ability for RhB. After loading Fe3O4@SiO2, the FSW-0.8 composite with a hierarchical core–shell structure showed stronger degradation ability. The results indicated that FSW-0.8 possessed significantly improved photocatalytic degradation efficiency compared to WO3.

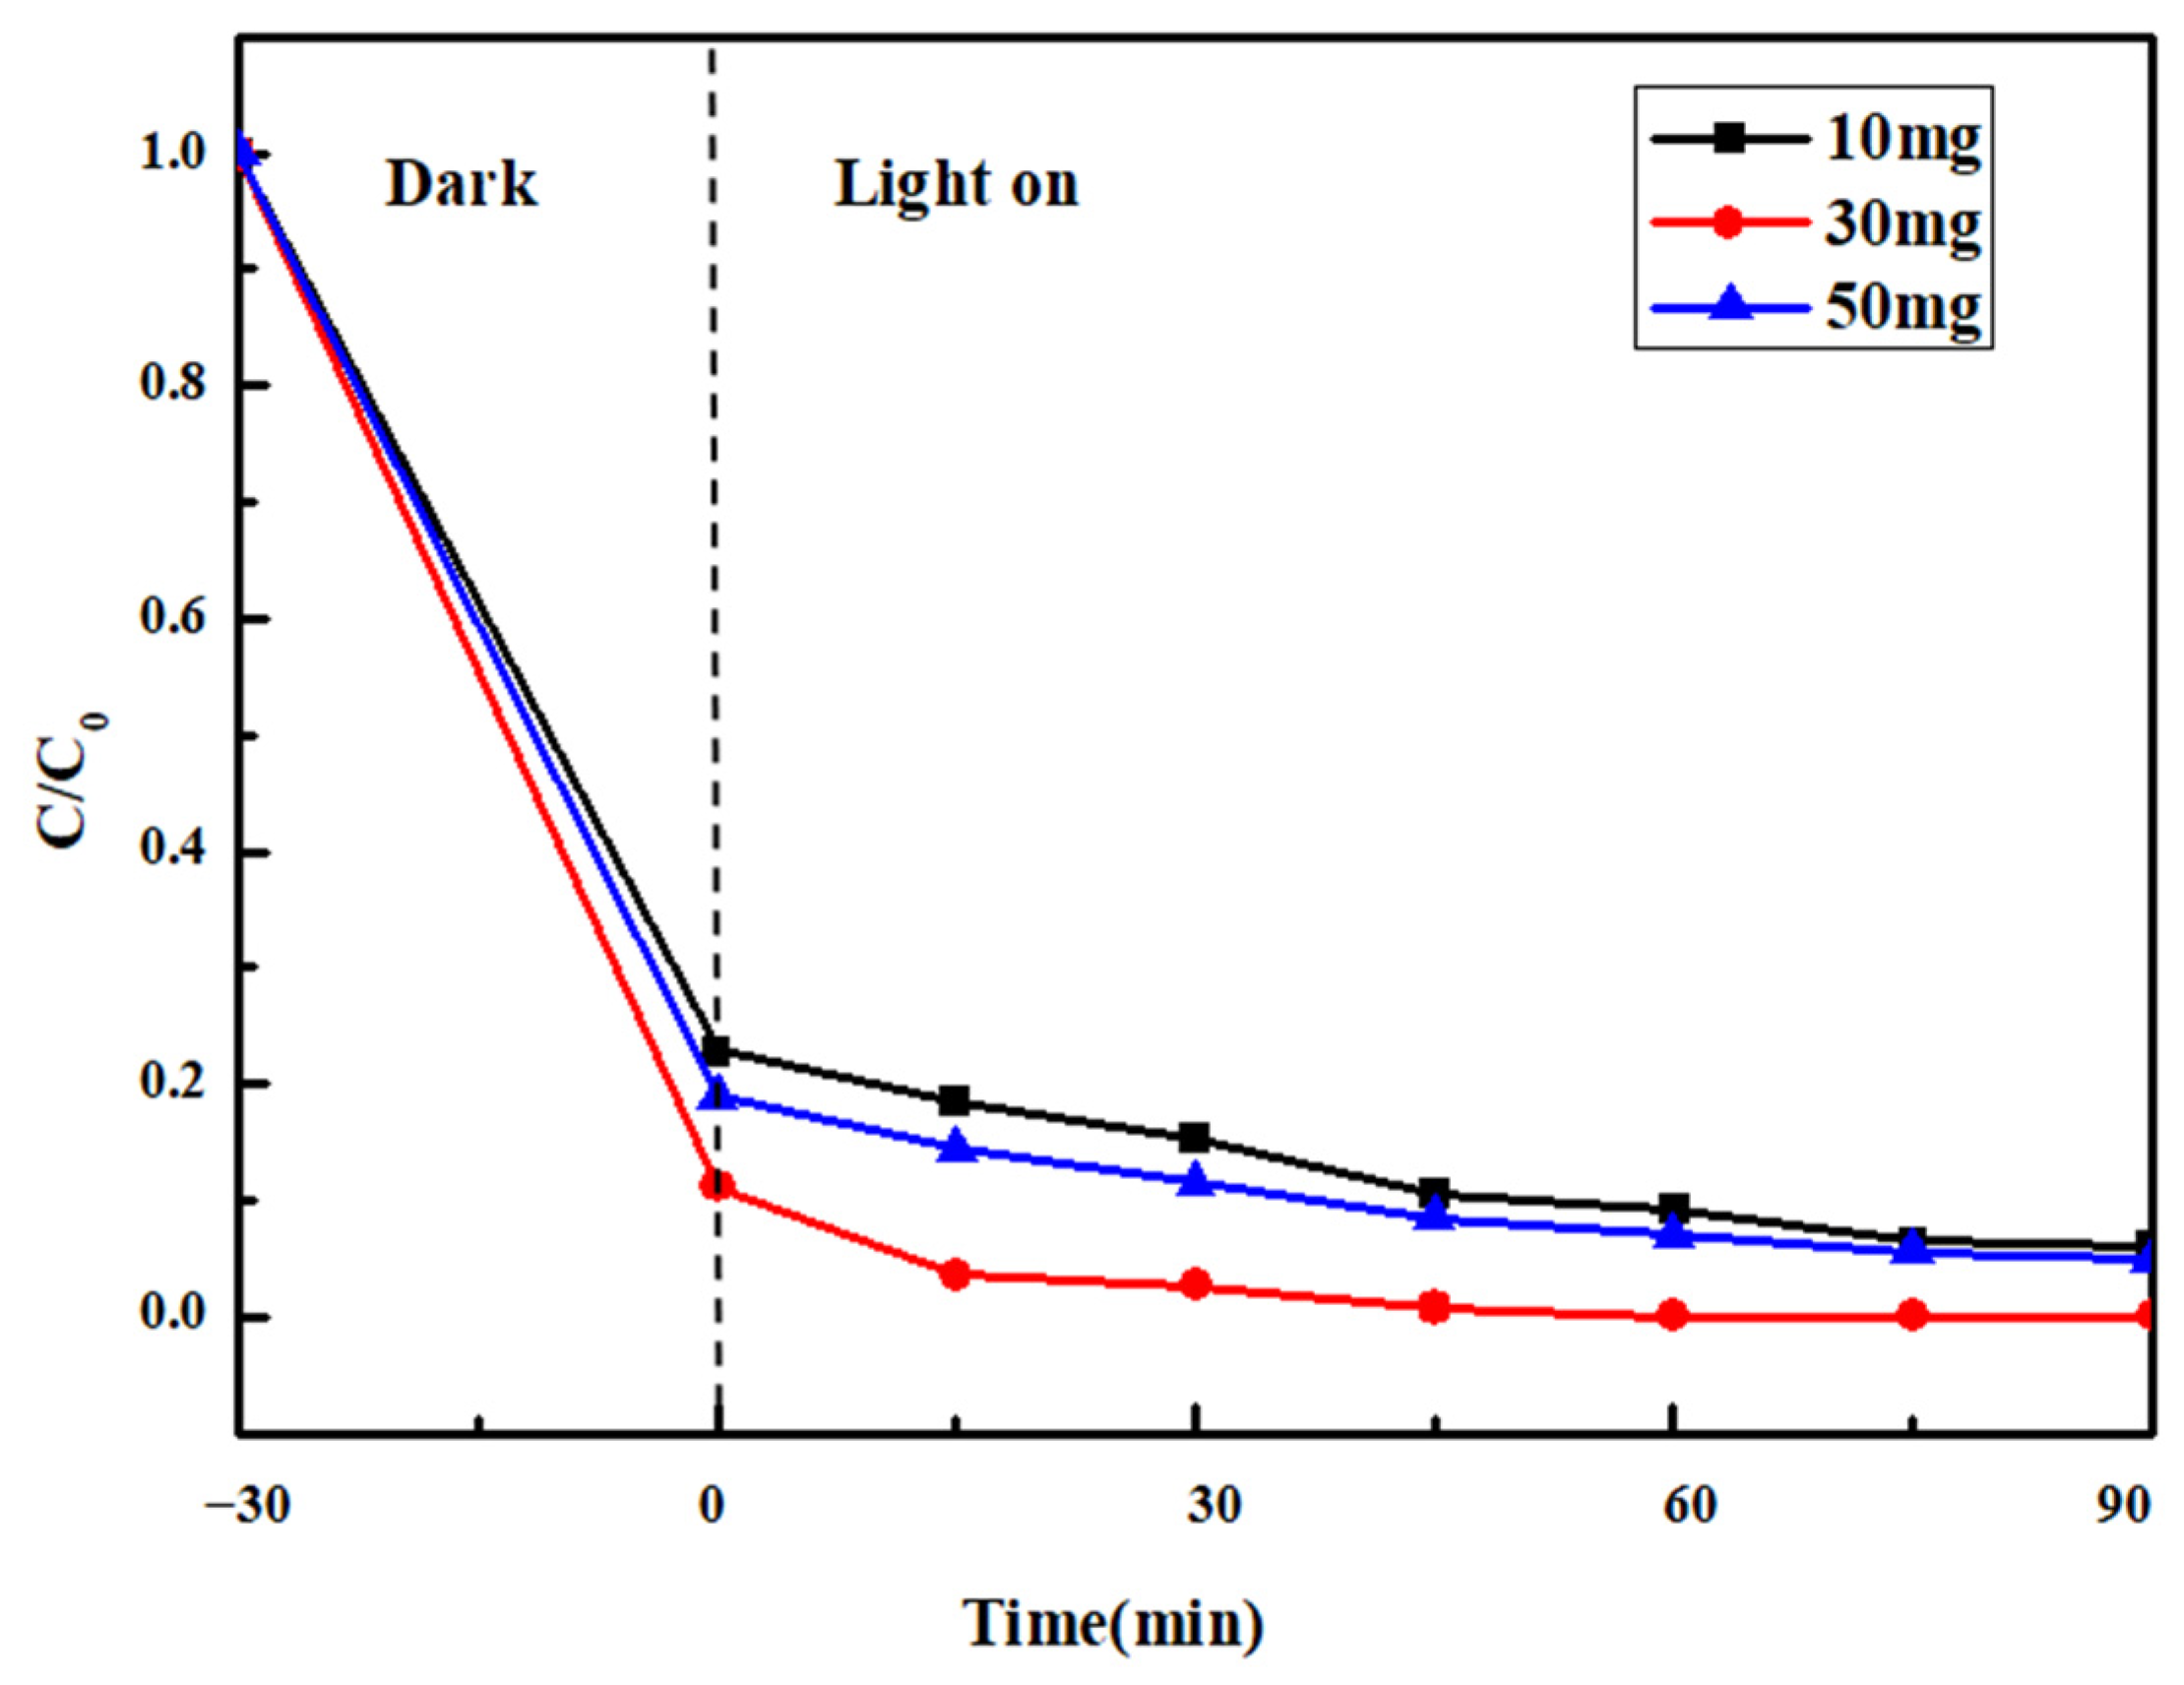
2.5.2. Comparison of Catalyst Amount

Different amounts (10 mg, 30 mg, and 50 mg) of FSW-0.8 samples were tested under xenon lamp irradiation to determine the optimum catalyst amount. The absorbance changes of samples and the degradation percentages under the same experimental conditions are shown in Figure 6 and Table 2.
As seen from the results, FSW-0.8 showed good degradation ability for RhB, and the degradation ability for RhB changed with the amount of catalyst. The degradation percentage was low (81.60%) with 10 mg of catalyst, either due to the small amount of catalyst or short interaction time between FSW-0.8 and RhB. The photocatalytic degradation efficiency increased to 87.17% when the FSW-0.8 dosage increased to 30 mg. However, the efficiency dropped to 84.46% when the catalyst was 50 mg, possibly because the catalyst concentration was too high, which caused the solution to become turbid and blocked UV–vis light. When fewer excited electrons in the valence band were transferred to conduction band, the generation of holes in conduction band was reduced, resulting in a decrease in the degradation percentage [17]. The results showed that the optimal degradation was achieved when the amount of FSW-0.8 catalyst was 30 mg.

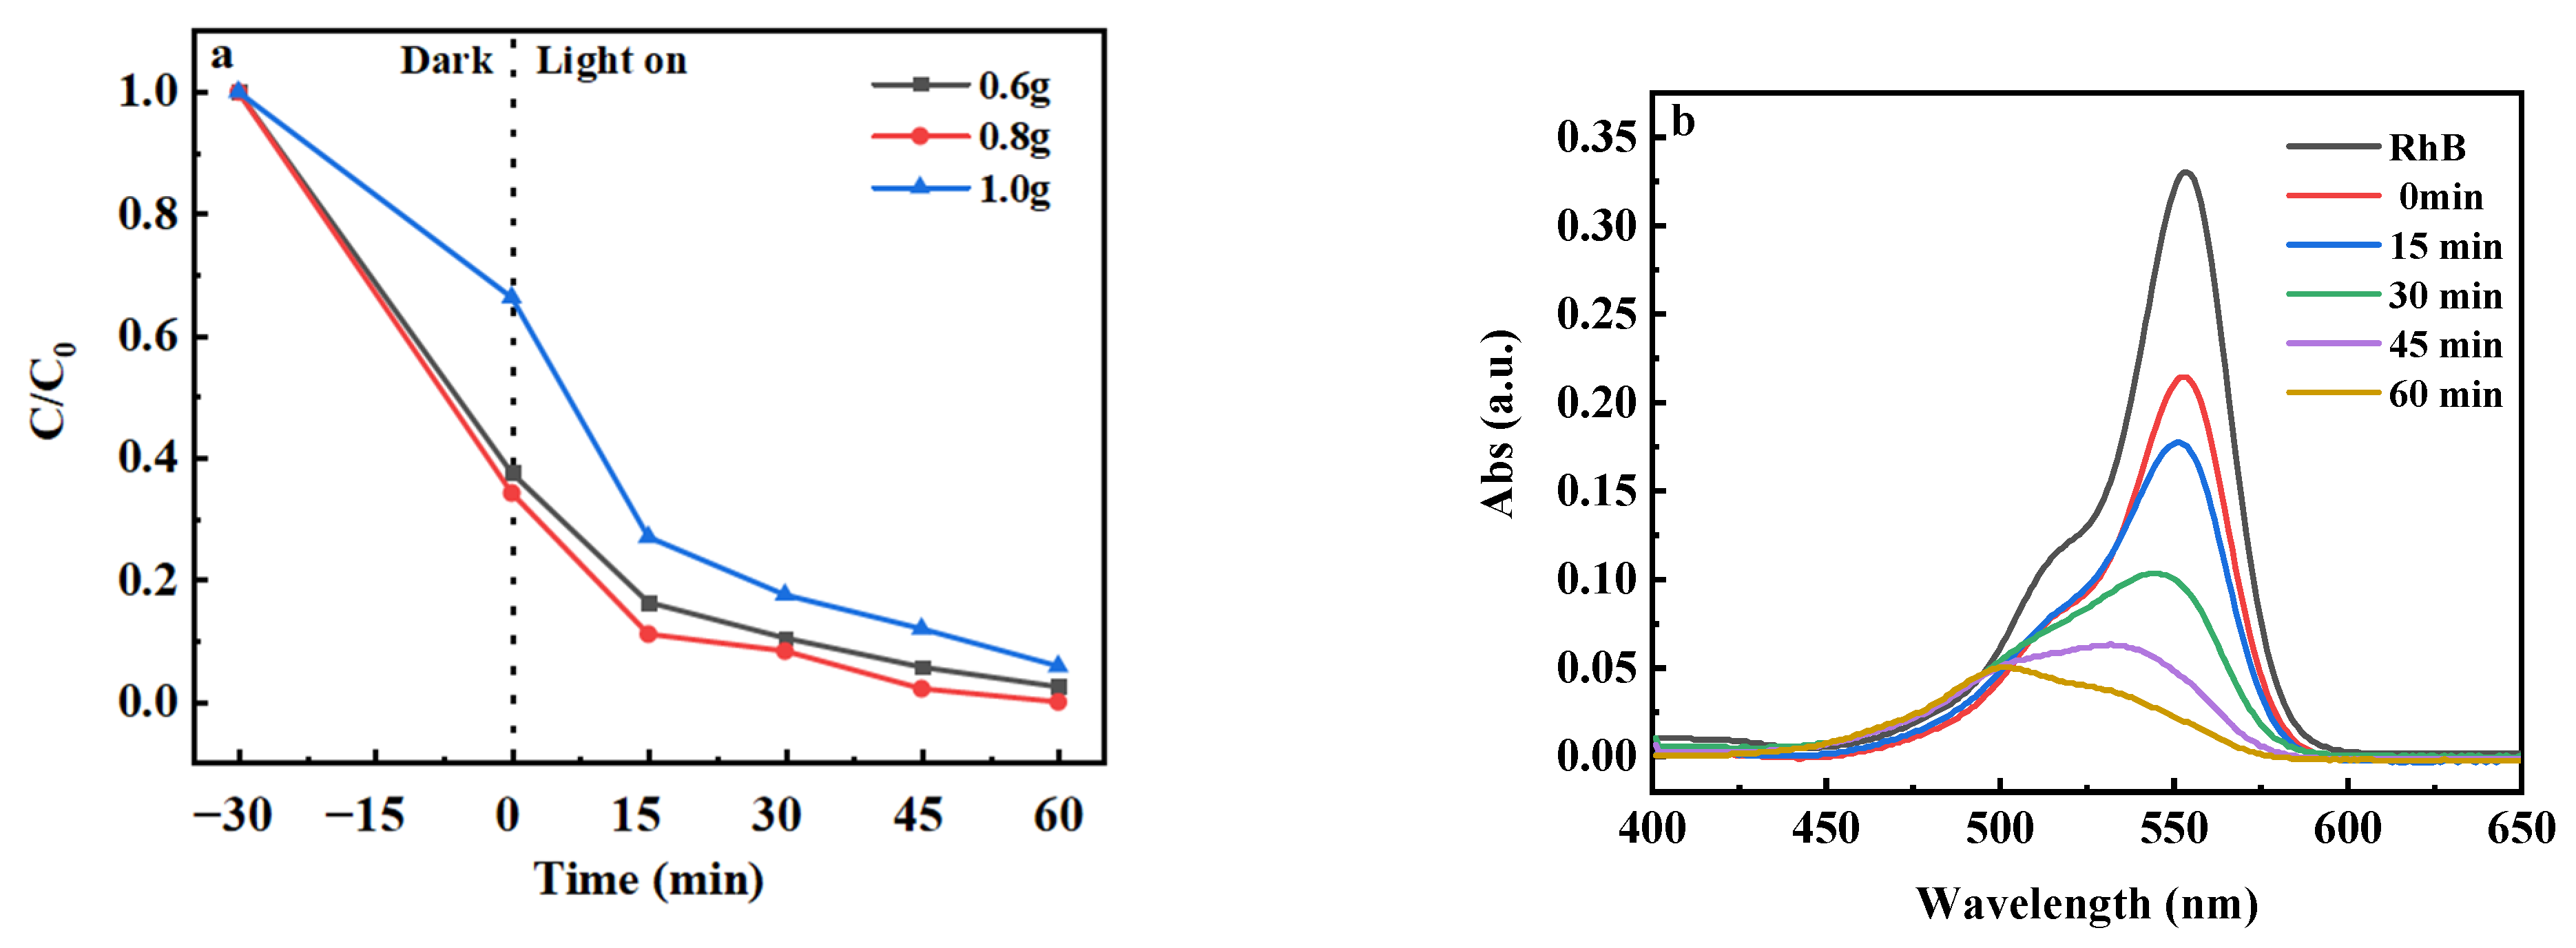
2.5.3. Influence of Catalyst Doping Ratio

The degradation efficiency of FSW-0.6, FSW-0.8, and FSW-1.0 samples (30 mg) was tested under xenon lamp irradiation to evaluate the optimum WO3 doping amount. The absorbance variation of the three samples with different doping ratios under the same experimental conditions is shown in Figure 7a. It was found that the catalytic materials with different WO3 doping amounts had different degradation abilities for RhB. The degradation effect of FSW-0.6 was poor, while that of FSW-0.8 was the best. As seen from Figure 7b, the characteristic peak at 554 nm gradually weakened during irradiation, indicating degradation of RhB. After stopping the 60 min light irradiation process, the main absorption peak disappeared, suggesting that the FSW-0.8 catalyst had completely degraded RhB.
As seen from Table 3, the adsorption capacity of RhB was different for samples with different WO3 doping amounts after 60 min light reaction. The results indicated that the photocatalytic degradation efficiency of the FSW composite was significantly improved compared to WO3. The final degradation percentage of FSW-0.6 reached 97.54%, while FSW-0.8 achieved 99.80% degradation under the same experimental conditions. Although the doping amount of the FSW-1.0 catalyst increased, the final degradation percentage decreased. Therefore, the results showed that the optimal WO3 doping amount in Fe3O4@SiO2@WO3 was 0.8 g. Compared with the literature in Table 4, the catalytic efficiency of the proposed core–shell structure catalyst increased from 78% to 87.17%, and the efficiency changed slightly after five cycles of reuse. Almost complete dye degradation was realized after 60 min.

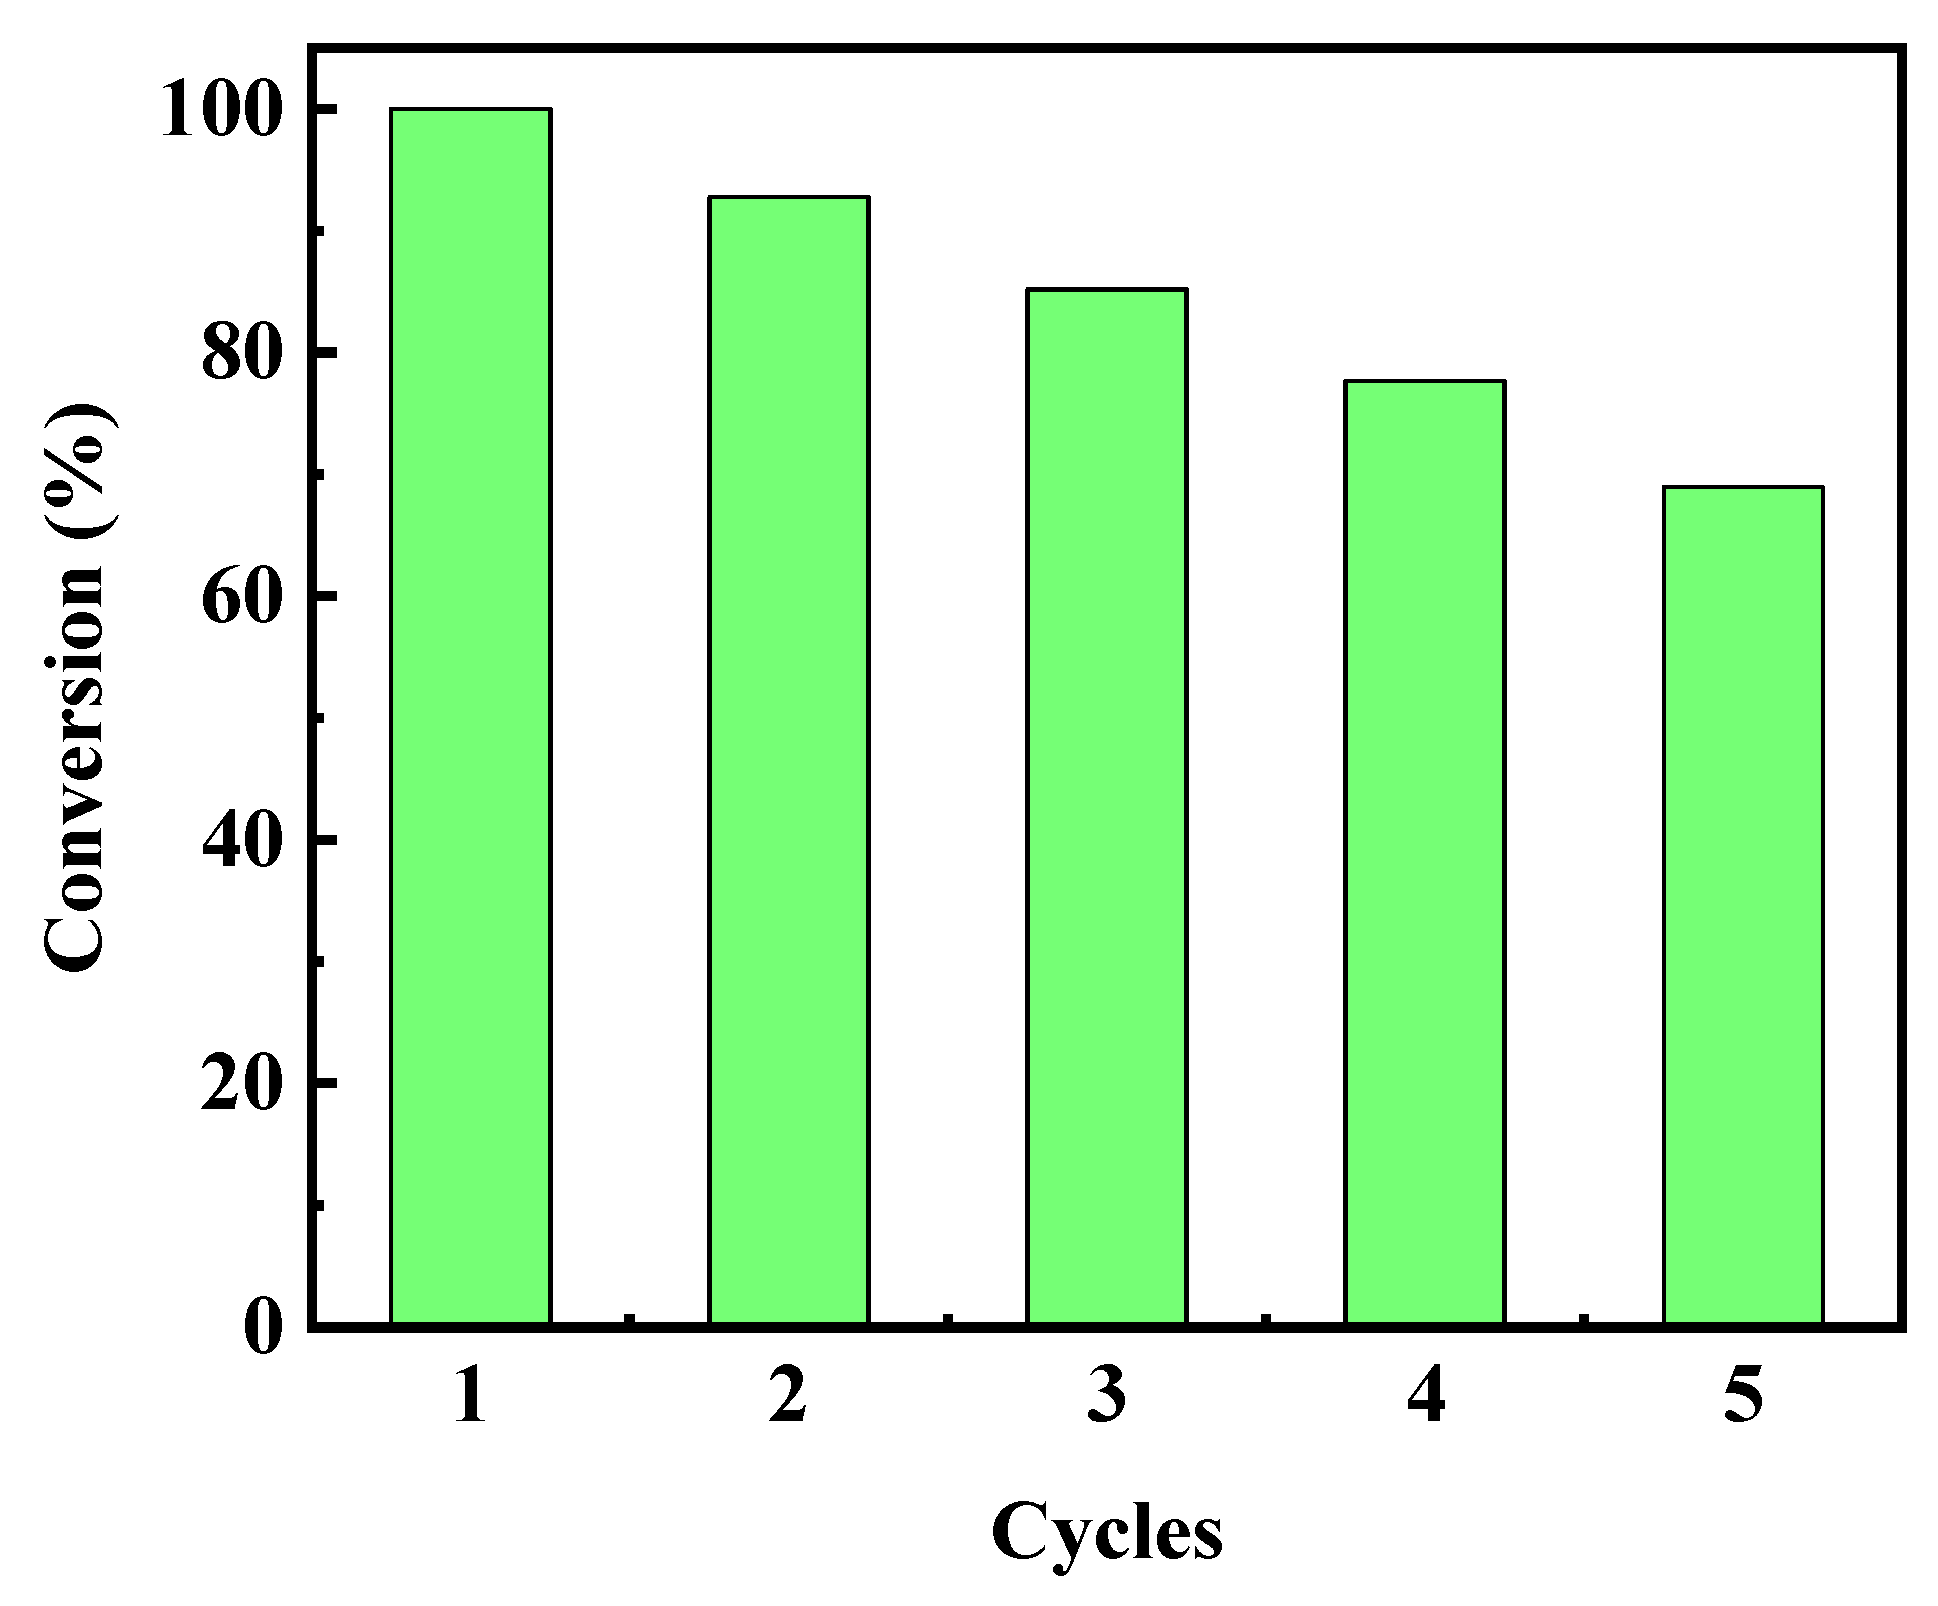
2.5.4. Catalyst Stability Test

In order to evaluate the reusability of the catalyst, the stability of the optimal catalyst FSW-0.8 was tested. The catalyst was separated from the centrifuged solution, washed, and placed into a fresh RhB solution for testing under the same conditions. The degradation performance of FSW-0.8 after recycling five times is shown in Figure 8. It was found that the degradation ability decreased step by step, but did not change much.
FSW-0.8 still maintained high catalytic activity after being reused five times (Table 5). The catalytic degradation performance for RhB decreased due to small mass loss and partial saturation of the catalyst during recovery. On the whole, FSW-0.8 still retained good catalytic degradation performance and showed good stability.

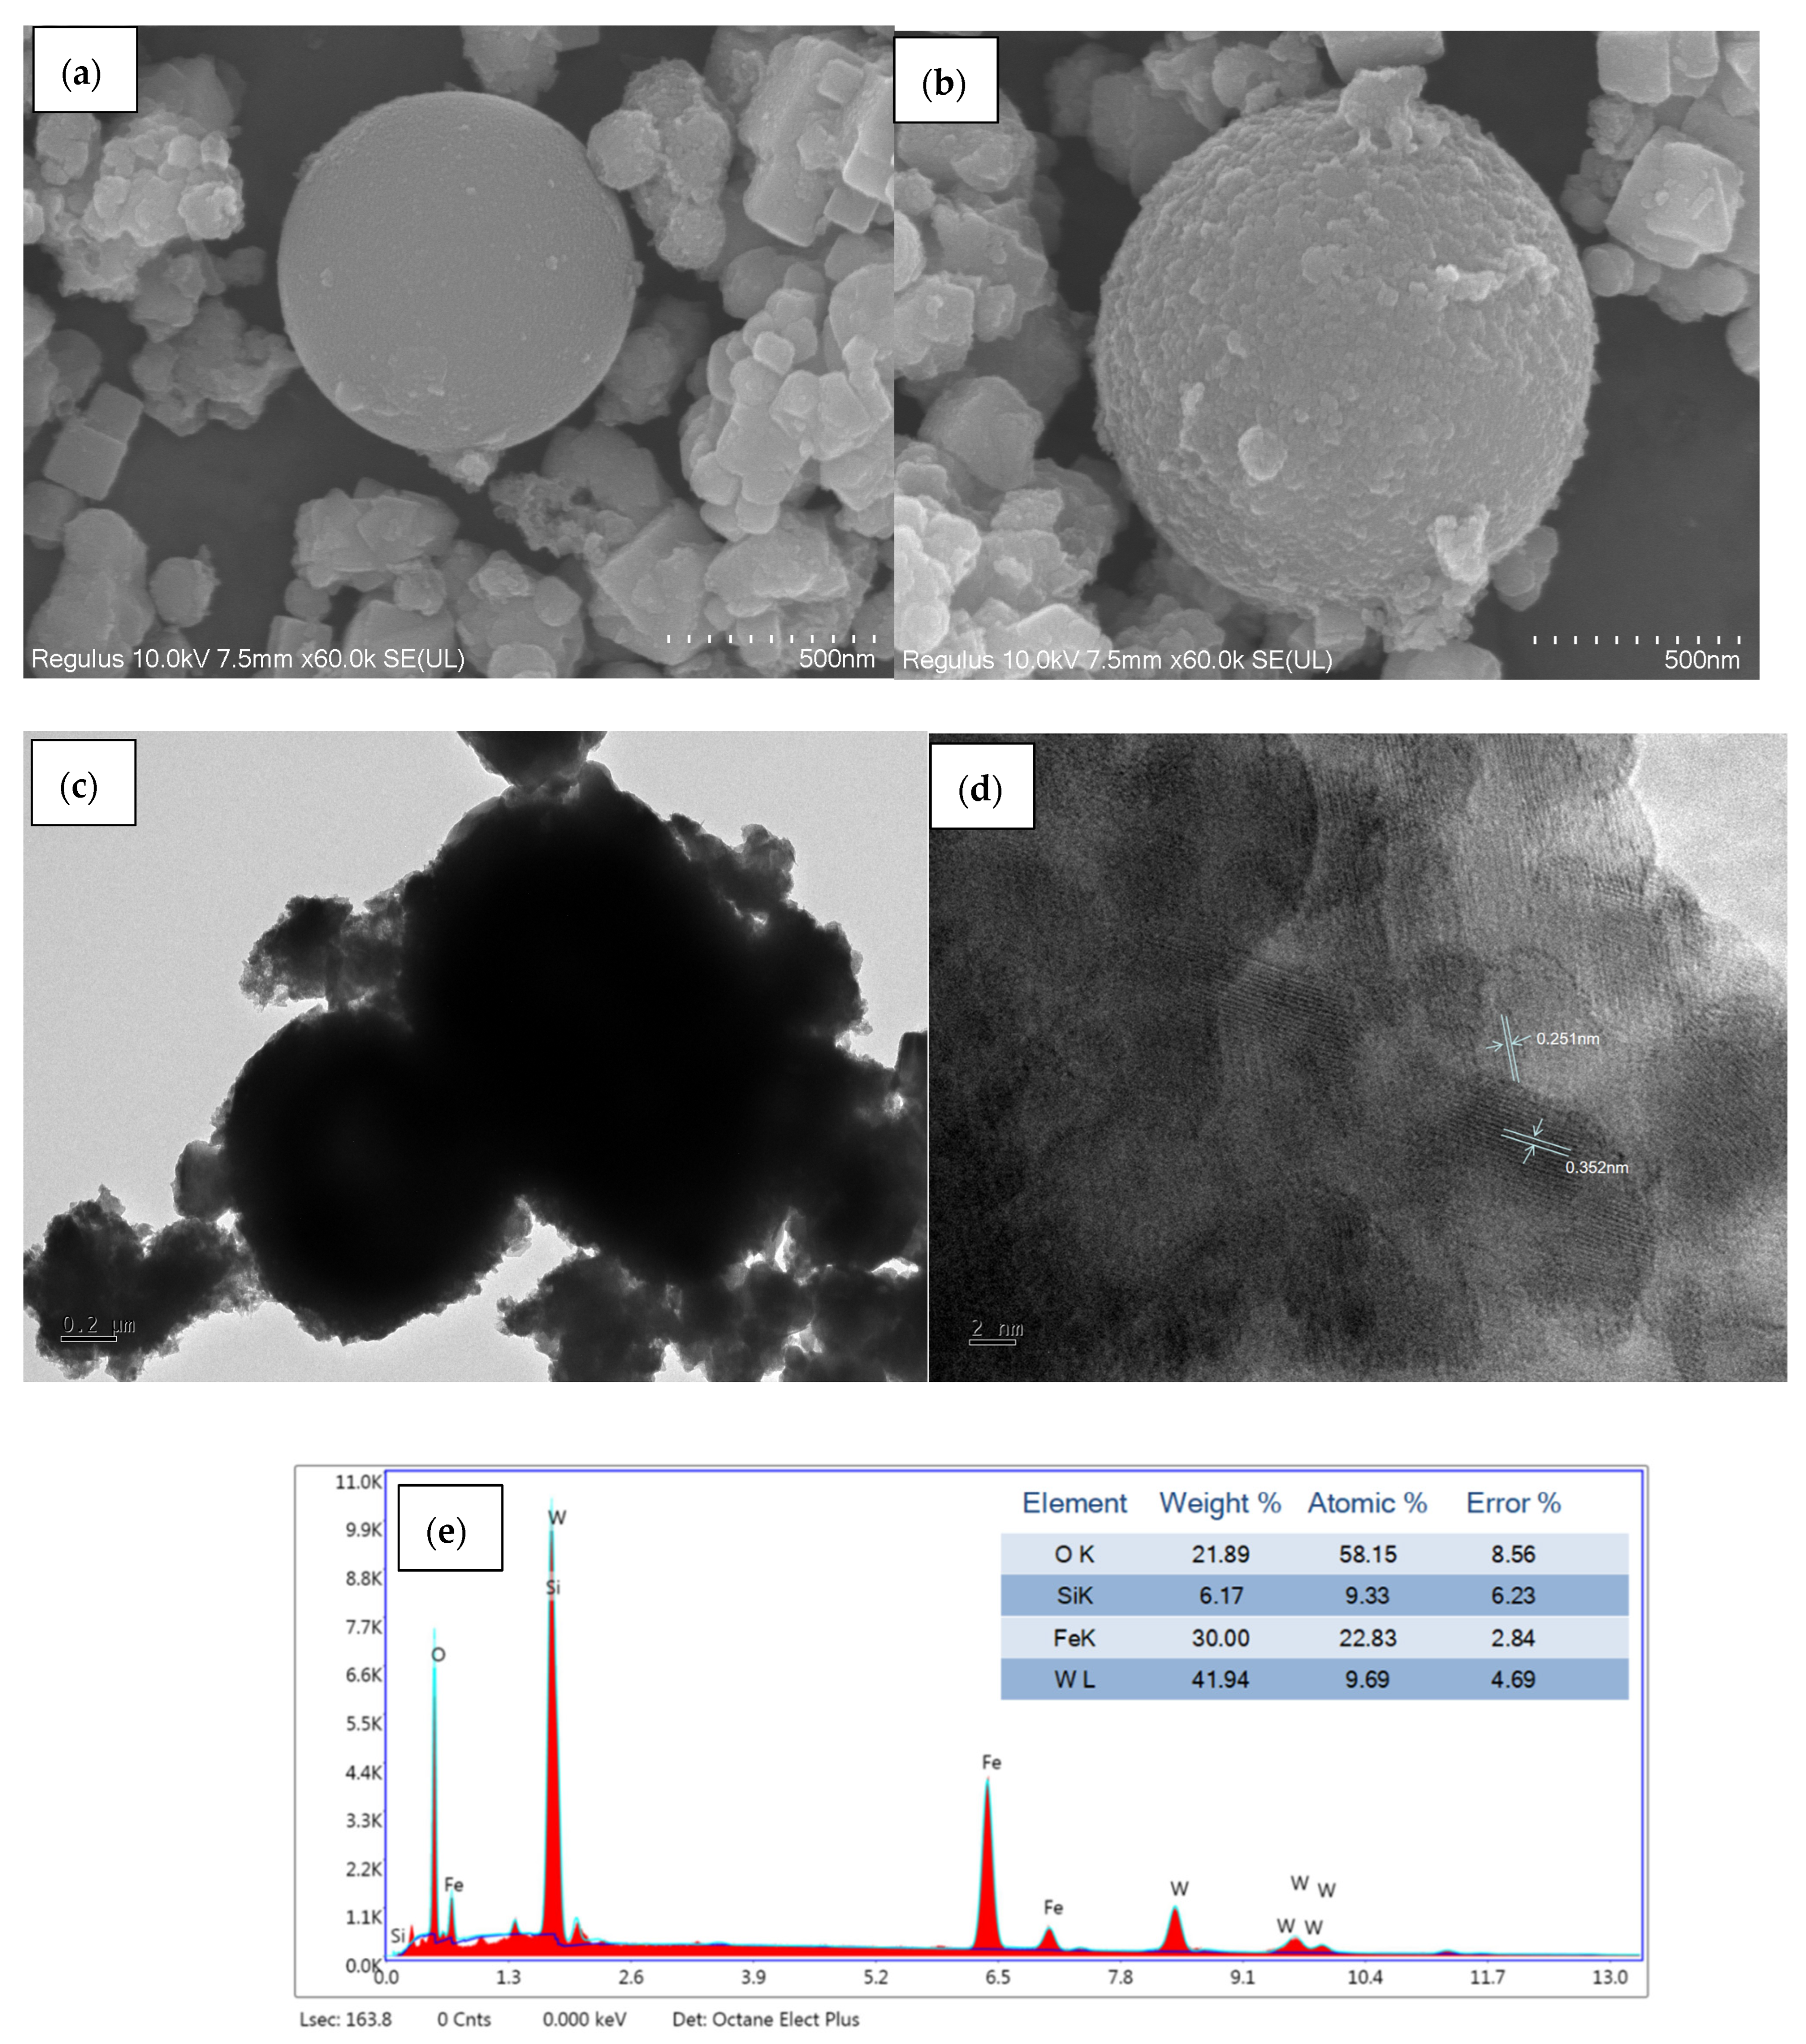
2.6. Catalyst Morphology

SEM images of the best-catalytic-activity sample FSW-0.8 are shown in Figure 9. The core–shell structure, formed by coating SiO2 on the surface of magnetic Fe3O4 aggregates prepared by the hydrothermal method, can be seen in Figure 9a. Fe3O4@SiO2 core–shell and WO3 nanorod fragments can be observed in the SEM image. The surface of Fe3O4@SiO2 was smooth and the average diameter was about 700 nm. After the coating layer was formed by surface deposition with WCl6, the surface of Fe3O4@SiO2 became rougher, and the sample size increased significantly due to the formation of a WO3 shell, as seen in Figure 9b. After deposition of WO3 nanoparticles on the surface of Fe3O4@SiO2 by the precipitation–deposition method, the surface of the sample changed significantly, indicating the formation of Fe3O4@SiO2@WO3 composite catalyst.
As shown in Figure 9c, the monodisperse nanomaterials obtained were uniform spheres with an average diameter of about 850 nm. The lattice fringe spacings of 0.352 nm and 0.251 nm were clearly observed by HRTEM (Figure 9d), corresponding to (101) polycrystalline plane of WO3 and (311) crystal plane of Fe3O4. The disordered lattice fringes around Fe3O4 corresponded to amorphous SiO2. These data confirmed that Fe3O4, SiO2, and WO3 nanoparticles were wrapped layer by layer, and FSW had a core–shell structure.
The element distribution diagram of the composite is shown in Figure 9e. The corresponding EDS spectrum showed that the composite contained the elements Fe, Si, W, and O, with atomic fractions of 22.83%, 9.33%, 9.69%, and 58.15%, respectively. Oxygen had the largest atomic fraction and was the main element in the composite, because oxygen was present in Fe3O4, SiO2, and WO3.

2.7. Catalyst Mechanism Model

The absorption band edge of the core–shell structure material showed a red shift, implying that its band gap energy was reduced (Figure 10). The charge transport barrier between particles was smaller, the separation efficiency of photogenerated charges was higher, and the photocatalytic ability was stronger. The band gap energy can be estimated using the Tauc plot method [21] (EgWO3 = 2.04 eV, EgFe3O4@SiO2 = 2.02 eV, EgFe3O4@SiO2@WO3 = 1.92 eV).
The model in Figure 11 was built according to a possible mechanism [15]. The formation of the core–shell structure forms an independent identified energy state (IES) band on the VB band of WO3. The appearance of the IES band can be a shallow potential trap for either electrons or holes. The captured photoelectric carriers can be easily released, which reduces the recombination probability of electrons and holes. This, in turn, prolongs the lifetime of photogenerated electron–hole pairs, increases the number of photons, and improves the visible light activity of the material. The doping concentration of WO3 generally has an optimal value. When the doping concentration is too low, the number of shallow potential wells capturing electrons or holes is not enough, and photogenerated electrons and holes cannot be effectively separated. On the other hand, when the doping concentration is too high, ions may become the electron–hole recombination center, increasing the probability of electron–hole recombination. Moreover, excessively high doping concentration may lead to the saturation of doped ions in the core–shell structure and the generation of new phases, which would reduce the effective surface area of the material and reduce the absorption of light, thus reducing the photoactivity. The calculation of the optical band gap and the study of photoelectron dynamics can further confirm the proposed mechanism.

3. Materials and Methods

All reagents used in the experiment were of analytical purity, and were obtained from Thermo Fisher Scientific Co., Ltd., Shanghai, China.

3.1. Preparation of Fe3O4

In a typical method, FeCl3·6H2O (4.32 g), CH3COONa (9 g), and Na3C6H5O7 (1.5 g) were dissolved in 160 mL ethylene glycol. The mixture was stirred for 30 min, and then transferred to a 200 mL hydrothermal kettle. It was heated to 200 °C and kept at that temperature for 10 h to obtain the product as a black powder. The powder was then washed with water and alcohol three times, and dried under vacuum at 70 °C.

3.2. Synthesis of Fe3O4@SiO2

First, Fe3O4 (1.0 g) core particles were dispersed in 50 mL deionized water for 2 h in an ultrasonic bath. Then, 0.1821 g tetraethoxysilane (TEOS) was dissolved in water with 2% ammonium aqueous solution (25 mL) [22]. After ultrasonic treatment for 2 h, the product was washed several times with deionized water, followed by magnetic recovery and drying at 70 °C.

3.3. Synthesis of Fe3O4@SiO2@WO3

The as-prepared Fe3O4@SiO2 (1.0 g) and a certain amount of WCl6 (0.6 g, 0.8 g, and 1.0 g) were dissolved in 50 mL water. Then, 0.1821 g cetyltrimethylammonium bromide (CTAB) was dissolved in 25 mL of 2% ammonium aqueous solution. The above two solutions were mixed and subjected to ultrasonic treatment for 2 h, and then treated with the hydrothermal method for 18 h at 120 °C. The product was washed several times with ethanol, and dried at 70 °C for 24 h. Finally, the Fe3O4@SiO2@WO3 samples were obtained and labeled as FSW-0.6, FSW-0.8, and FSW-1.0, respectively.

3.4. Characterization of Catalysts

X-ray diffraction analysis was performed using an X-ray diffractometer (XRD, D8 Advance A25, Bruker, Berlin, Germany) with Cu-Kα (1.54178 Å) as the target material. The scanning angle range was 20°~60°. Infrared spectroscopy was performed using a 60XR Fourier transform infrared spectrometer (FTIR, Nicolet iS50, Thermo Fisher, San Jose, CA, USA). The KBr tablet-pressing method was used for determination, and the scanning range was 400–4000 cm−1. For Raman spectroscopy, a laser confocal Raman spectrum analyzer (Invis reflex, Renishaw, Gloucestershire, UK) was used, and a He-Ne laser was used as the excitation light source. The Raman spectrum was measured under the excitation wavelength of 532 nm and excitation light intensity of 1%, and the scanning range was 200–1200 cm−1. Surface morphology was observed by scanning electron microscopy (SEM, Phenom/Pro6, Phenom Scientific, Eindhoven, Netherlands). Crystallite shapes were observed using a high-resolution transmission electron microscope (HR-TEM, JEM-2010 microscope, JEOL, Tokyo, Japan). UV–visible spectra were obtained using Hitachi U-4100 double-beam instrument, Tokyo, Japan.

3.5. Evaluation of Photocatalytic Degradation

A certain amount of photocatalyst was added to 50 mL of 10 mg/L RhB solution. Fe3O4@SiO2@WO3 samples were added at doses of 10 mg, 30 mg, 50 mg, and 100 mg. Samples were reacted under light-avoidance conditions for 30 min, then reacted under 30A xenon-lamp-simulated sunlight (AM1.5, 50 W) at 8000 r/min under room temperature. The absorbance at the maximum absorption wavelength at 554 nm was measured by a UV–vis spectrophotometer. Therefore, UV can be used to monitor the photocatalytic reaction, and the reaction conversion can be calculated from the reactant concentration every 15 min.

4. Conclusions

In this paper, a new Fe3O4@SiO2@WO3 nanocatalyst with a core–shell structure was successfully prepared by the hydrothermal method and characterized by XRD, SEM, TEM, FT-IR, and Raman analyses. Compared with WO3, the photocatalytic degradation efficiency and recovery of the Fe3O4@SiO2@WO3 composite catalyst were greatly improved. The results showed that the core–shell structure photocatalyst possessed significantly enhanced photocatalytic activity under visible light irradiation. A series of experiments were conducted to determine the optimum W doping amount and catalyst usage amounts, and it was found that the optimum catalyst was FSW-0.8 at 30 mg. The Fe3O4@SiO2@WO3 photocatalyst was magnetic and could be easily separated using a magnetic field, thus indicating its recoverability and reusability. These properties not only maximize the value of this new material, but also provide sustainable solutions for environmental protection, energy crises, and health problems. Thus, the proposed photocatalyst shows great potential for application compared to other multifunctional core–shell structural materials.

Author Contributions

X.W.: Conceived and designed the experiments; analyzed and interpreted the data; and wrote the paper. J.C.: Performed the experiments; and contributed the reagents, materials, analysis tools or data. All authors reviewed the manuscript. All authors have read and agreed to the published version of the manuscript.

Funding

This work was supported by the General Research Project on Teaching Reform of Higher Education in Heilongjiang Province (SJGY20210526), the College Students’ Innovation and Entrepreneurship Training Program (No.: 202310234006), and the Student Science and Technology Innovation Project of Harbin University (HXS20242212).

Data Availability Statement

Data included in the article are available in the article.

Conflicts of Interest

The authors declare no conflicts of interest.

References

  1. Fujishima, A.; Honda, K. Electrochemical photolysis of water at a semiconductor electrode. Nature 1972, 238, 37–38. [Google Scholar] [CrossRef] [PubMed]
  2. Li, W.; Guo, H.; Wang, C.; Zhang, Y.; Cheng, X.; Wang, J.; Yang, B.; Du, E. ROS reevaluation for degradation of 4-chloro-3,5-dimethylphenol (PCMX) by UV and UV/persulfate processes in the water: Kinetics, mechanism, DFT studies and toxicity evolution. Chem. Eng. J. 2020, 390, 124610. [Google Scholar] [CrossRef]
  3. Kohantorabi, M.; Moussavi, G.; Giannakis, S. A review of the innovations in metal- and carbon-based catalysts explored for heterogeneous peroxymonosulfate (PMS) activation, with focus on radical vs. non-radical degradation pathways of organic contaminants. Chem. Eng. J. 2021, 411, 127957. [Google Scholar] [CrossRef]
  4. Lu, J.; Zhou, Y.; Zhou, Y. Efficiently activate peroxymonosulfate by Fe3O4@MoS2 for rapid degradation of sulfonamides. Chem. Eng. J. 2021, 422, 130126. [Google Scholar] [CrossRef]
  5. Ding, Y.; Wang, X.; Fu, L.; Peng, X.; Pan, C.; Mao, Q.; Wang, C.; Yan, J. Nonradicals induced degradation of organic pollutants by peroxydisulfate (PDS) and peroxymonosulfate (PMS): Recent advances and perspective. Sci. Total Environ. 2021, 765, 142794. [Google Scholar] [CrossRef]
  6. Sadeghi, M.; Liu, W.; Zhang, T.; Stavropoulos, P.; Levy, B. Role of photoinduced charge carrier separation distance in heterogeneous photocatalysis: Oxidative degradation of CH3OH vapor in contact with Pt/TiO2 and cofumed TiO2−Fe2O3. J. Phys. Chem. 1996, 100, 19466–19474. [Google Scholar] [CrossRef]
  7. Faust, B.C.; Hoffmann, M.R.; Bahnemann, D.W. Photocatalytic oxidation of sulfur dioxide in aqueous suspensions of. alpha.-iron oxide (Fe2O3). J. Phys. Chem. 1989, 93, 6371–6381. [Google Scholar] [CrossRef]
  8. Yamazaki, Y.; Maruyama, R.; Kumagai, H.; Maeda, K.; Notes, T.T.A. Hybrid photocatalyst constructed using polymerized metal complexes and semiconductor powders for photocatalytic carbon dioxide reduction. Chem. Lett. 2024, 5, upae085. [Google Scholar] [CrossRef]
  9. Li, P.; Li, Q.; Wang, G.; Lu, Y.; Duan, L.; Bai, J.; Sarina, S.; Liu, J. Metal-free polymeric and molecular disorder/order semiconductor heterojunctions for the visible-light photocatalytic Minisci reaction. J. Mater. Chem. A Mater. Energy Sustain. 2024, 12, 13760–13769. [Google Scholar] [CrossRef]
  10. Stambouli, A.B.; Traversa, E. Solid oxide fuel cells (SOFCs): A review of an environmentally clean and efficient source of energy. Renew. Sustain. Energy Rev. 2002, 6, 433–455. [Google Scholar] [CrossRef]
  11. Chen, W.H.; You, F. Sustainable energy management and control for Decarbonization of complex multi-zone buildings with renewable solar and geothermal energies using machine learning, robust optimization, and predictive control. Appl. Energy 2024, 372, 123802. [Google Scholar] [CrossRef]
  12. Zhao, C.; Yang, L.; Liu, Y.; Zhang, Z.; Yao, S.; Huang, X.; Yin, Y.; Sun, K.; Yang, T.; Zou, B.; et al. An innovative eco-friendly organic semiconductor-biochar photocatalytic adsorbent for efficient and stable removal mechanism of oxytetracycline hydrochloride under light illumination. Sep. Purif. Technol. 2025, 357, 130054. [Google Scholar] [CrossRef]
  13. Khoshnam, M.; Jazi, H.S. Synthesis and characterization of magnetic-photocatalytic Fe3O4/SiO2/α-Fe2O3 nano core-shell. J. Surfin. 2021, 7, 101322. [Google Scholar] [CrossRef]
  14. Shagolsem, B.S.; Singh, N.M. An environmentally friendly photocatalyst for the breakdown of RhB, MB, 2,4-DCP, and TCAA: Reusable Fe3O4/Ag doped g-C3N4. J. Mol. Liq. 2024, 413, 125913. [Google Scholar] [CrossRef]
  15. Jia, X.; Zhang, X.; Zhong, J.; Xiong, C.; Zhu, H.; Ding, Y.; Jin, Z.; Guo, W.; Chen, J.; Li, J.; et al. Highly Efficient Photodegradation of RHB-MO-MB Mixture Dye Wastewater by WO3/Fe3O4/Diatomite under Different Condition. ECS J. Solid State Sci. Technol. 2023, 12, 093009. [Google Scholar] [CrossRef]
  16. Zheng, H.; Ou, J.Z.; Strano, M.S.; Kaner, R.B.; Mitchell, A.; Kalantar-zadeh, K. Nanostructured tungsten oxide–properties, synthesis, and applications. Adv. Funct. Mater. 2011, 21, 2175–2196. [Google Scholar] [CrossRef]
  17. Lee, J.; Son, N.; Shin, H.; Kim, J.; Park, N.-K.; Kim, U.S.; Kang, M. An eco-efficient dual-function technology: Magnetically recoverable rGO-WO3/Fe3O4 ternary heterojunction catalytic system simultaneously performing malachite green photolysis and Cr(VI) reduction. J. Clean. Prod. 2024, 459, 142533. [Google Scholar] [CrossRef]
  18. Chinchillas-Chinchillas, M.J.; Garrafa-Gálvez, H.E.; Castro-Beltran, A. Turnera diffusa and its novel application in the synthesis of ZnO semiconductor nanoparticles with high photocatalytic power. Appl. Phys. A Mater. Sci. Process. 2024, 130, 710. [Google Scholar] [CrossRef]
  19. Yadav, P.; Vignesh, D.; Patnaik, M.; Priyadarshani, M.; Rout, E. Investigation of structural and optoelectronic integrity of Sm3+ doped CaWO4 for LED applications. Ceram. Int. 2024, 50, 35203–35213. [Google Scholar] [CrossRef]
  20. Gandon, A.; Nguyen, C.; Kaliaguine, S. Synthesis of magnetic core@dual shell Fe3O4@SiO2@WO3 nanocatalysts for olefin double bond oxidative cleavage. Can. J. Chem. Eng. 2021, 9, 2003–2013. [Google Scholar] [CrossRef]
  21. Maham, R.; Ijaz, A.B.; Nimra, N. Synthesis and photocatalytic degradation of rhodamine B using ternary zeolite/WO3/Fe3O4 composite. Nanotechnology 2021, 32, 345705. [Google Scholar]
  22. Morel, A.L.; Sergei, I. Sonochemical approach to the synthesis of Fe3O4@SiO2 core-shell nanoparticles with tunable properties. ACS Nano. 2008, 5, 847–856. [Google Scholar] [CrossRef] [PubMed]
Figure 1. X-ray diffraction pattern of catalyst.
Catalysts 15 00314 g001
Figure 2. Infrared spectrum of catalyst: (a) different materials, and (b) different doping ratios.
Catalysts 15 00314 g002
Figure 3. Raman spectrum of catalyst: (a) WO3, and (b) composite catalyst.
Catalysts 15 00314 g003
Figure 4. Fe3O4@SiO2@WO3 magnetic response test.
Catalysts 15 00314 g004
Figure 5. Different catalytic materials.
Catalysts 15 00314 g005
Figure 6. Different FSW-0.8 catalyst amounts.
Catalysts 15 00314 g006
Figure 7. (a) Doping amount of composite, (b) FSW-0.8.
Catalysts 15 00314 g007
Figure 8. Reuse of FSW-0.8 catalyst.
Catalysts 15 00314 g008
Figure 9. Morphology: (a) SEM image of FS catalyst; (b) SEM (c) TEM (d) HR-TEM images of FSW-0.8 catalyst; and (e) EDS spectrum of FSW-0.8.
Catalysts 15 00314 g009
Figure 10. Band gap energy calculation for powder catalysts.
Catalysts 15 00314 g010
Figure 11. Schematic energy diagrams showing proposed electron and energy transfer mechanisms (VB = valence band; CB = conduction band).
Catalysts 15 00314 g011
Table 1. Degradation percentage of different catalysts.
CatalystDegradation Percentage (%)
Fe3O422.12
Fe3O4@SiO233.65
WO366.06
Fe3O4@SiO2@WO3100.00
Table 2. Degradation rate of FSW-0.8.
Catalyst Amount (mg)Degradation Percentage (%)
1081.60
3087.17
5084.46
Table 3. Degradation percentage of FSW-0.8 with different doping amounts.
Doping Amount (g)Degradation Percentage (%)
0.697.54
0.899.80
1.094.15
Table 4. The literature summary on the degradation of RhB with WO3/Fe3O4-based photocatalysts.
CatalystDegradation Percentage (%)References
WO3/Fe3O4/Diatomite78%[15]
Zeolite/WO3/Fe3O497%[21]
Fe3O4@SiO2@WO399.80%This study
Table 5. Degradation percentage of FSW-0.8 with different recycling times.
Number of CyclesDegradation Percentage (%)
1100.00
292.74
385.20
477.65
568.99
Disclaimer/Publisher’s Note: The statements, opinions and data contained in all publications are solely those of the individual author(s) and contributor(s) and not of MDPI and/or the editor(s). MDPI and/or the editor(s) disclaim responsibility for any injury to people or property resulting from any ideas, methods, instructions or products referred to in the content.

