
Microwave-Assisted Oxidative Degradation of Lignin Catalyzed by Hydrogen Peroxide–Alkaline Ionic Liquid System


Abstract
1. Introduction
2. Results and Discussion
2.1. Effect of Reaction Conditions on the Degradation of Lignin
2.1.1. Microwave Time
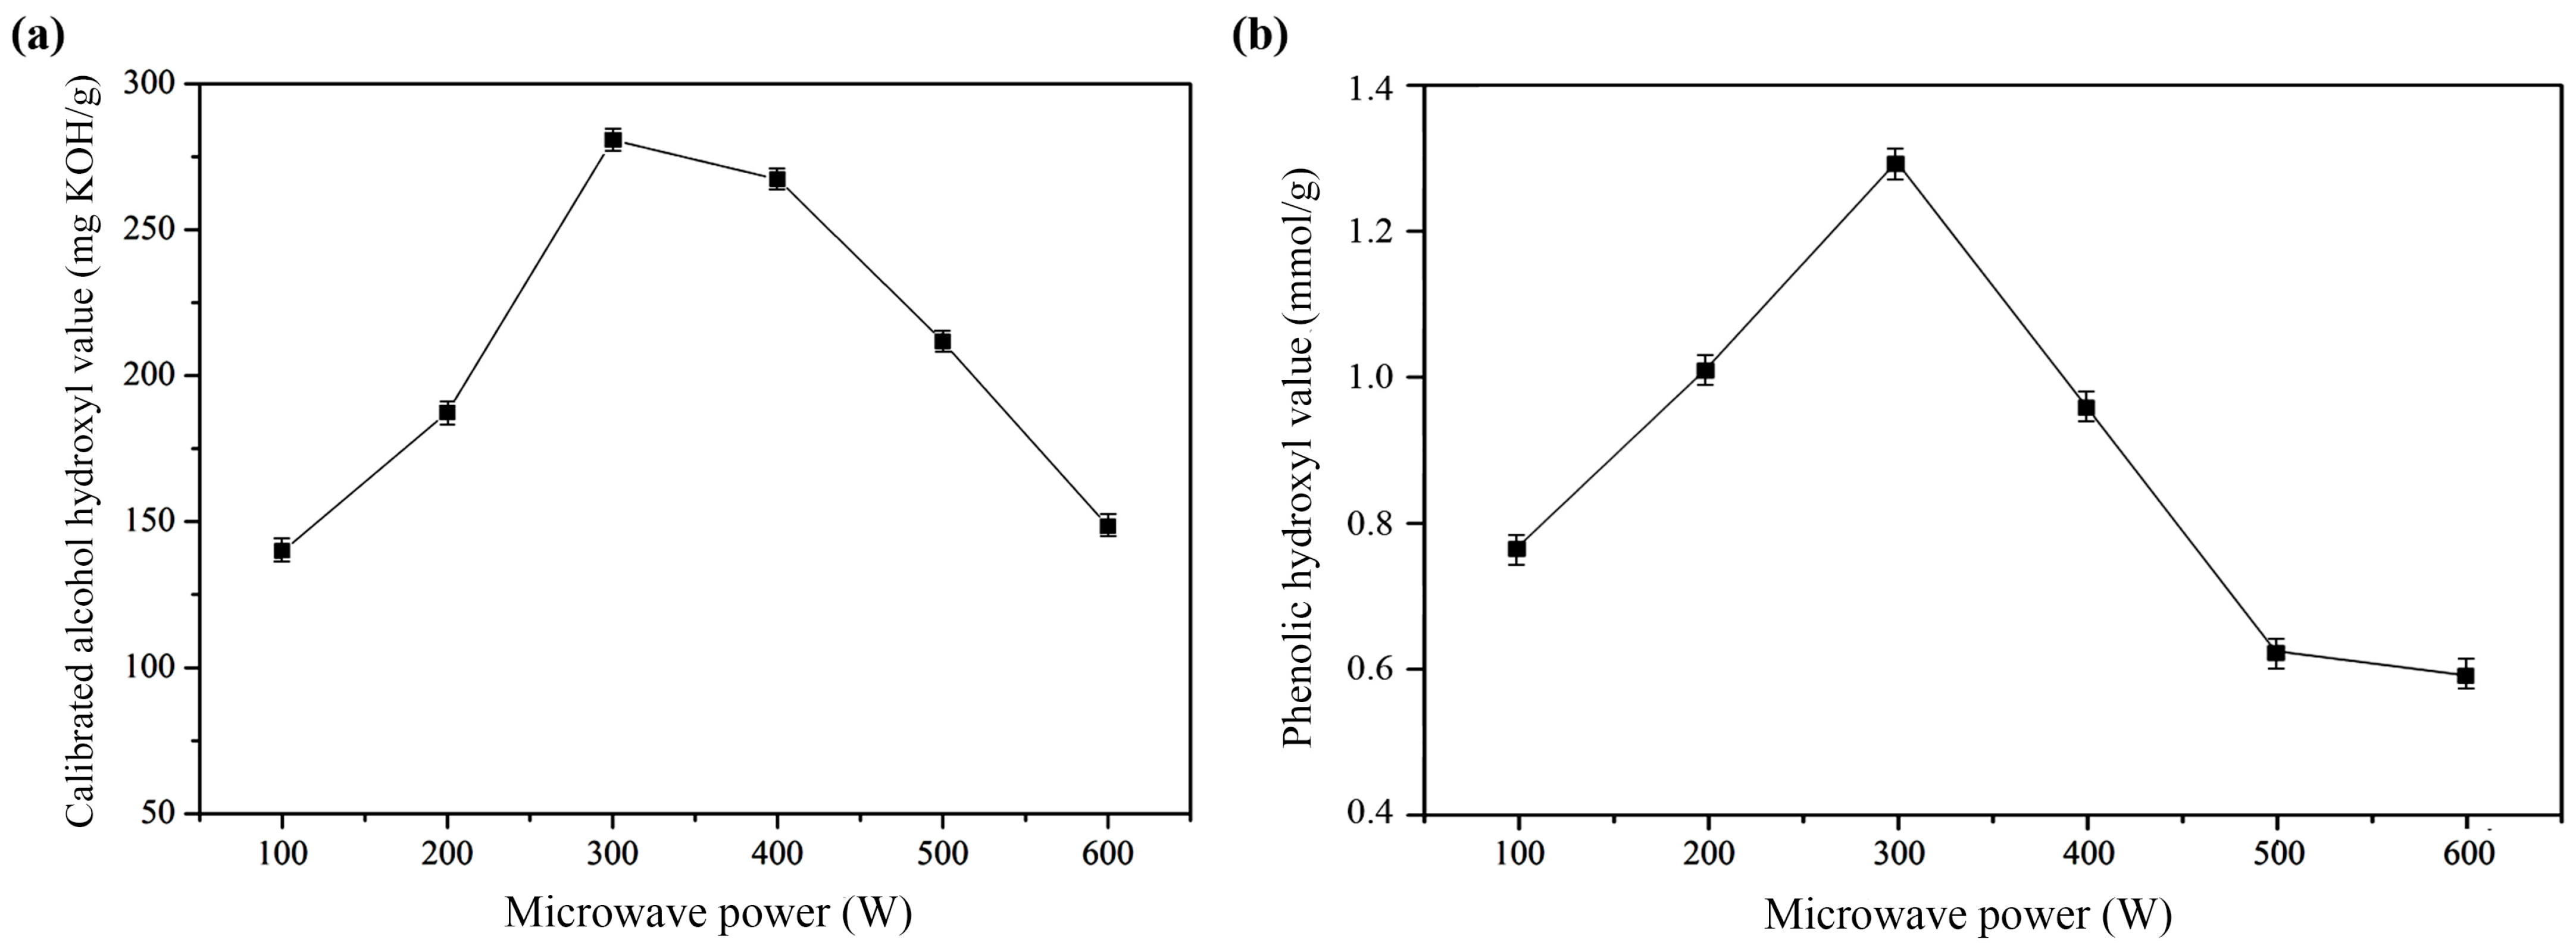
2.1.2. Microwave Power
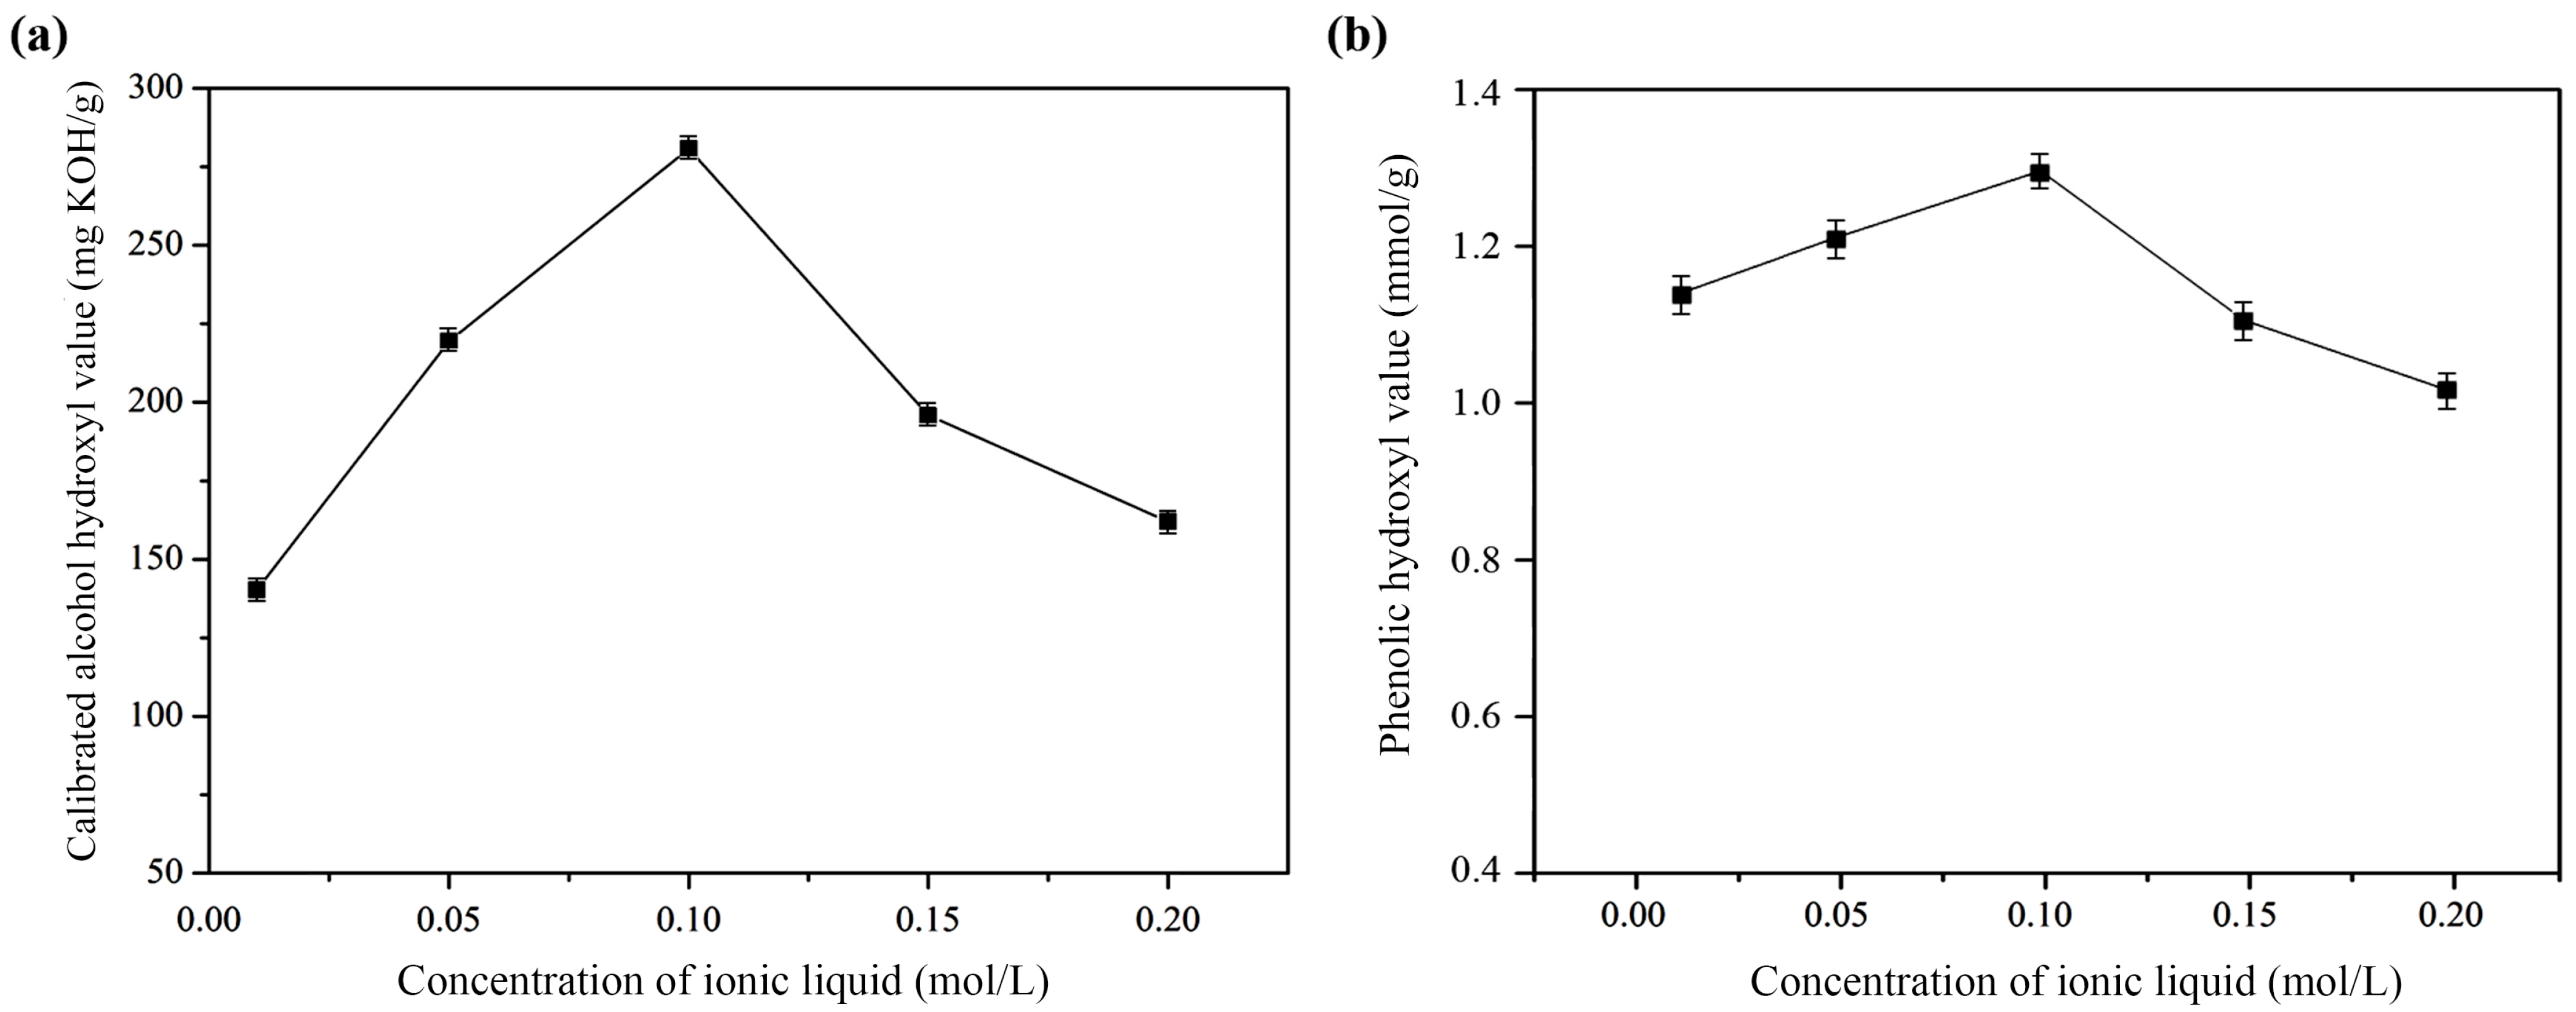
2.1.3. The Concentration of Ionic Liquid
2.1.4. The Concentration of Hydrogen Peroxide
2.2. GC–MS Analysis of Catalytic Degradation Products of Lignin
2.3. Study of Degradation Mechanisms
2.4. Characterization of Degraded Lignin Solids
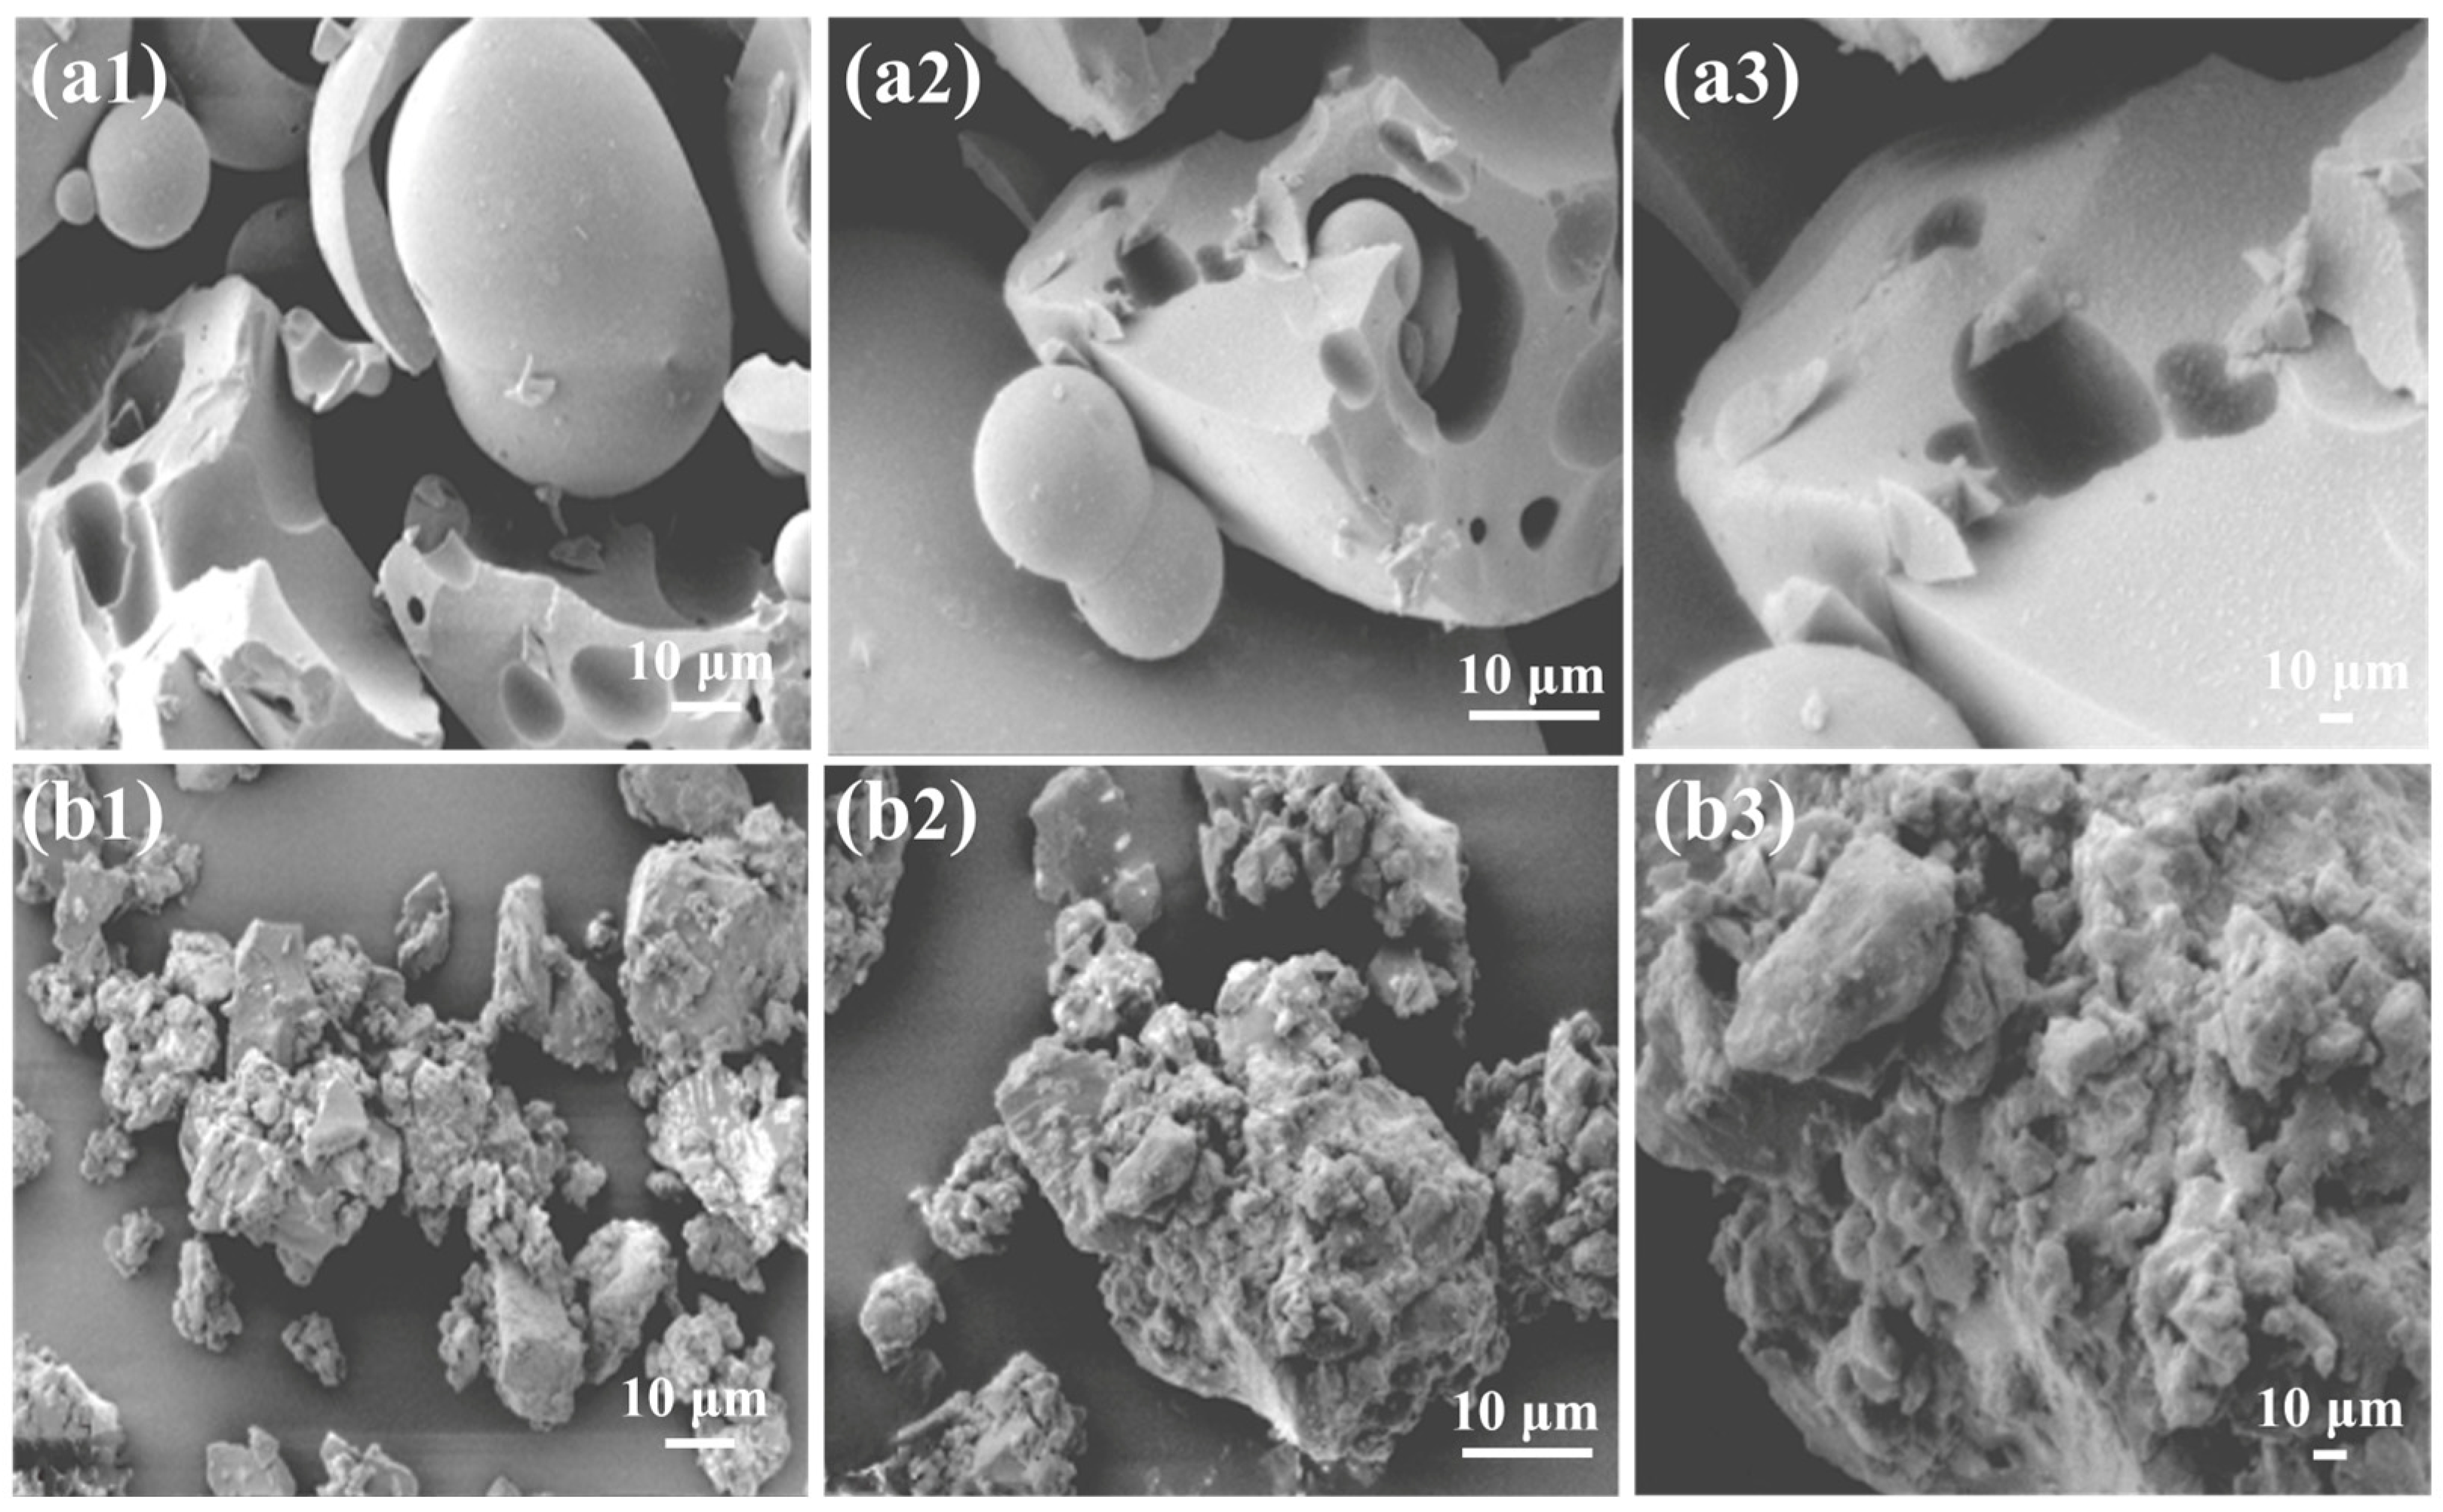
2.4.1. Scanning Electron Microscopy (SEM)
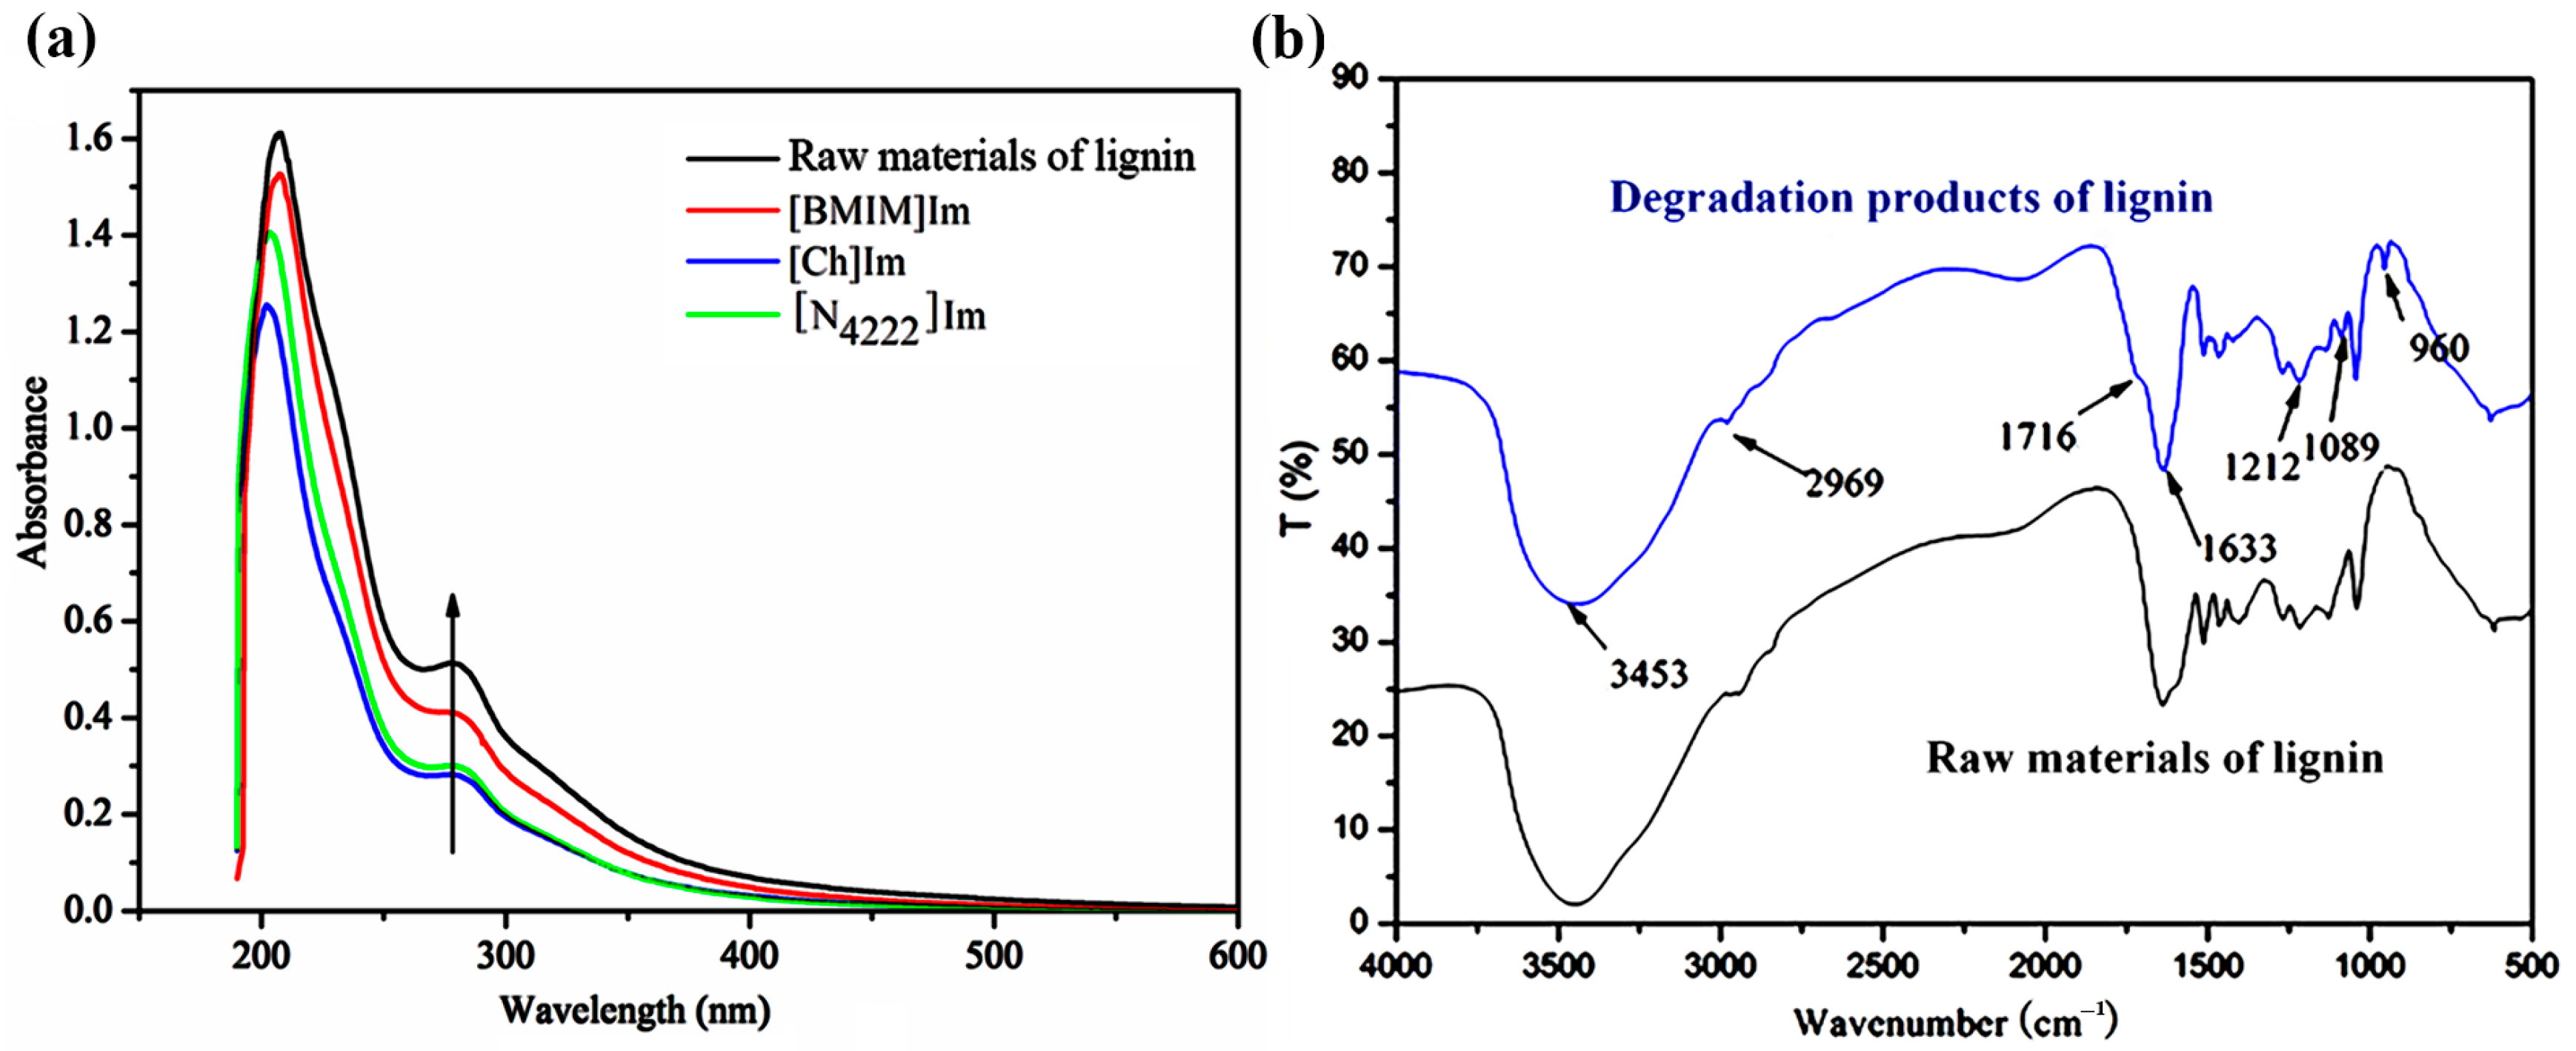
2.4.2. Ultraviolet and Visible (UV–Vis) Spectral Analysis
2.4.3. Fourier-Transform Infrared Spectroscopy (FT–IR)
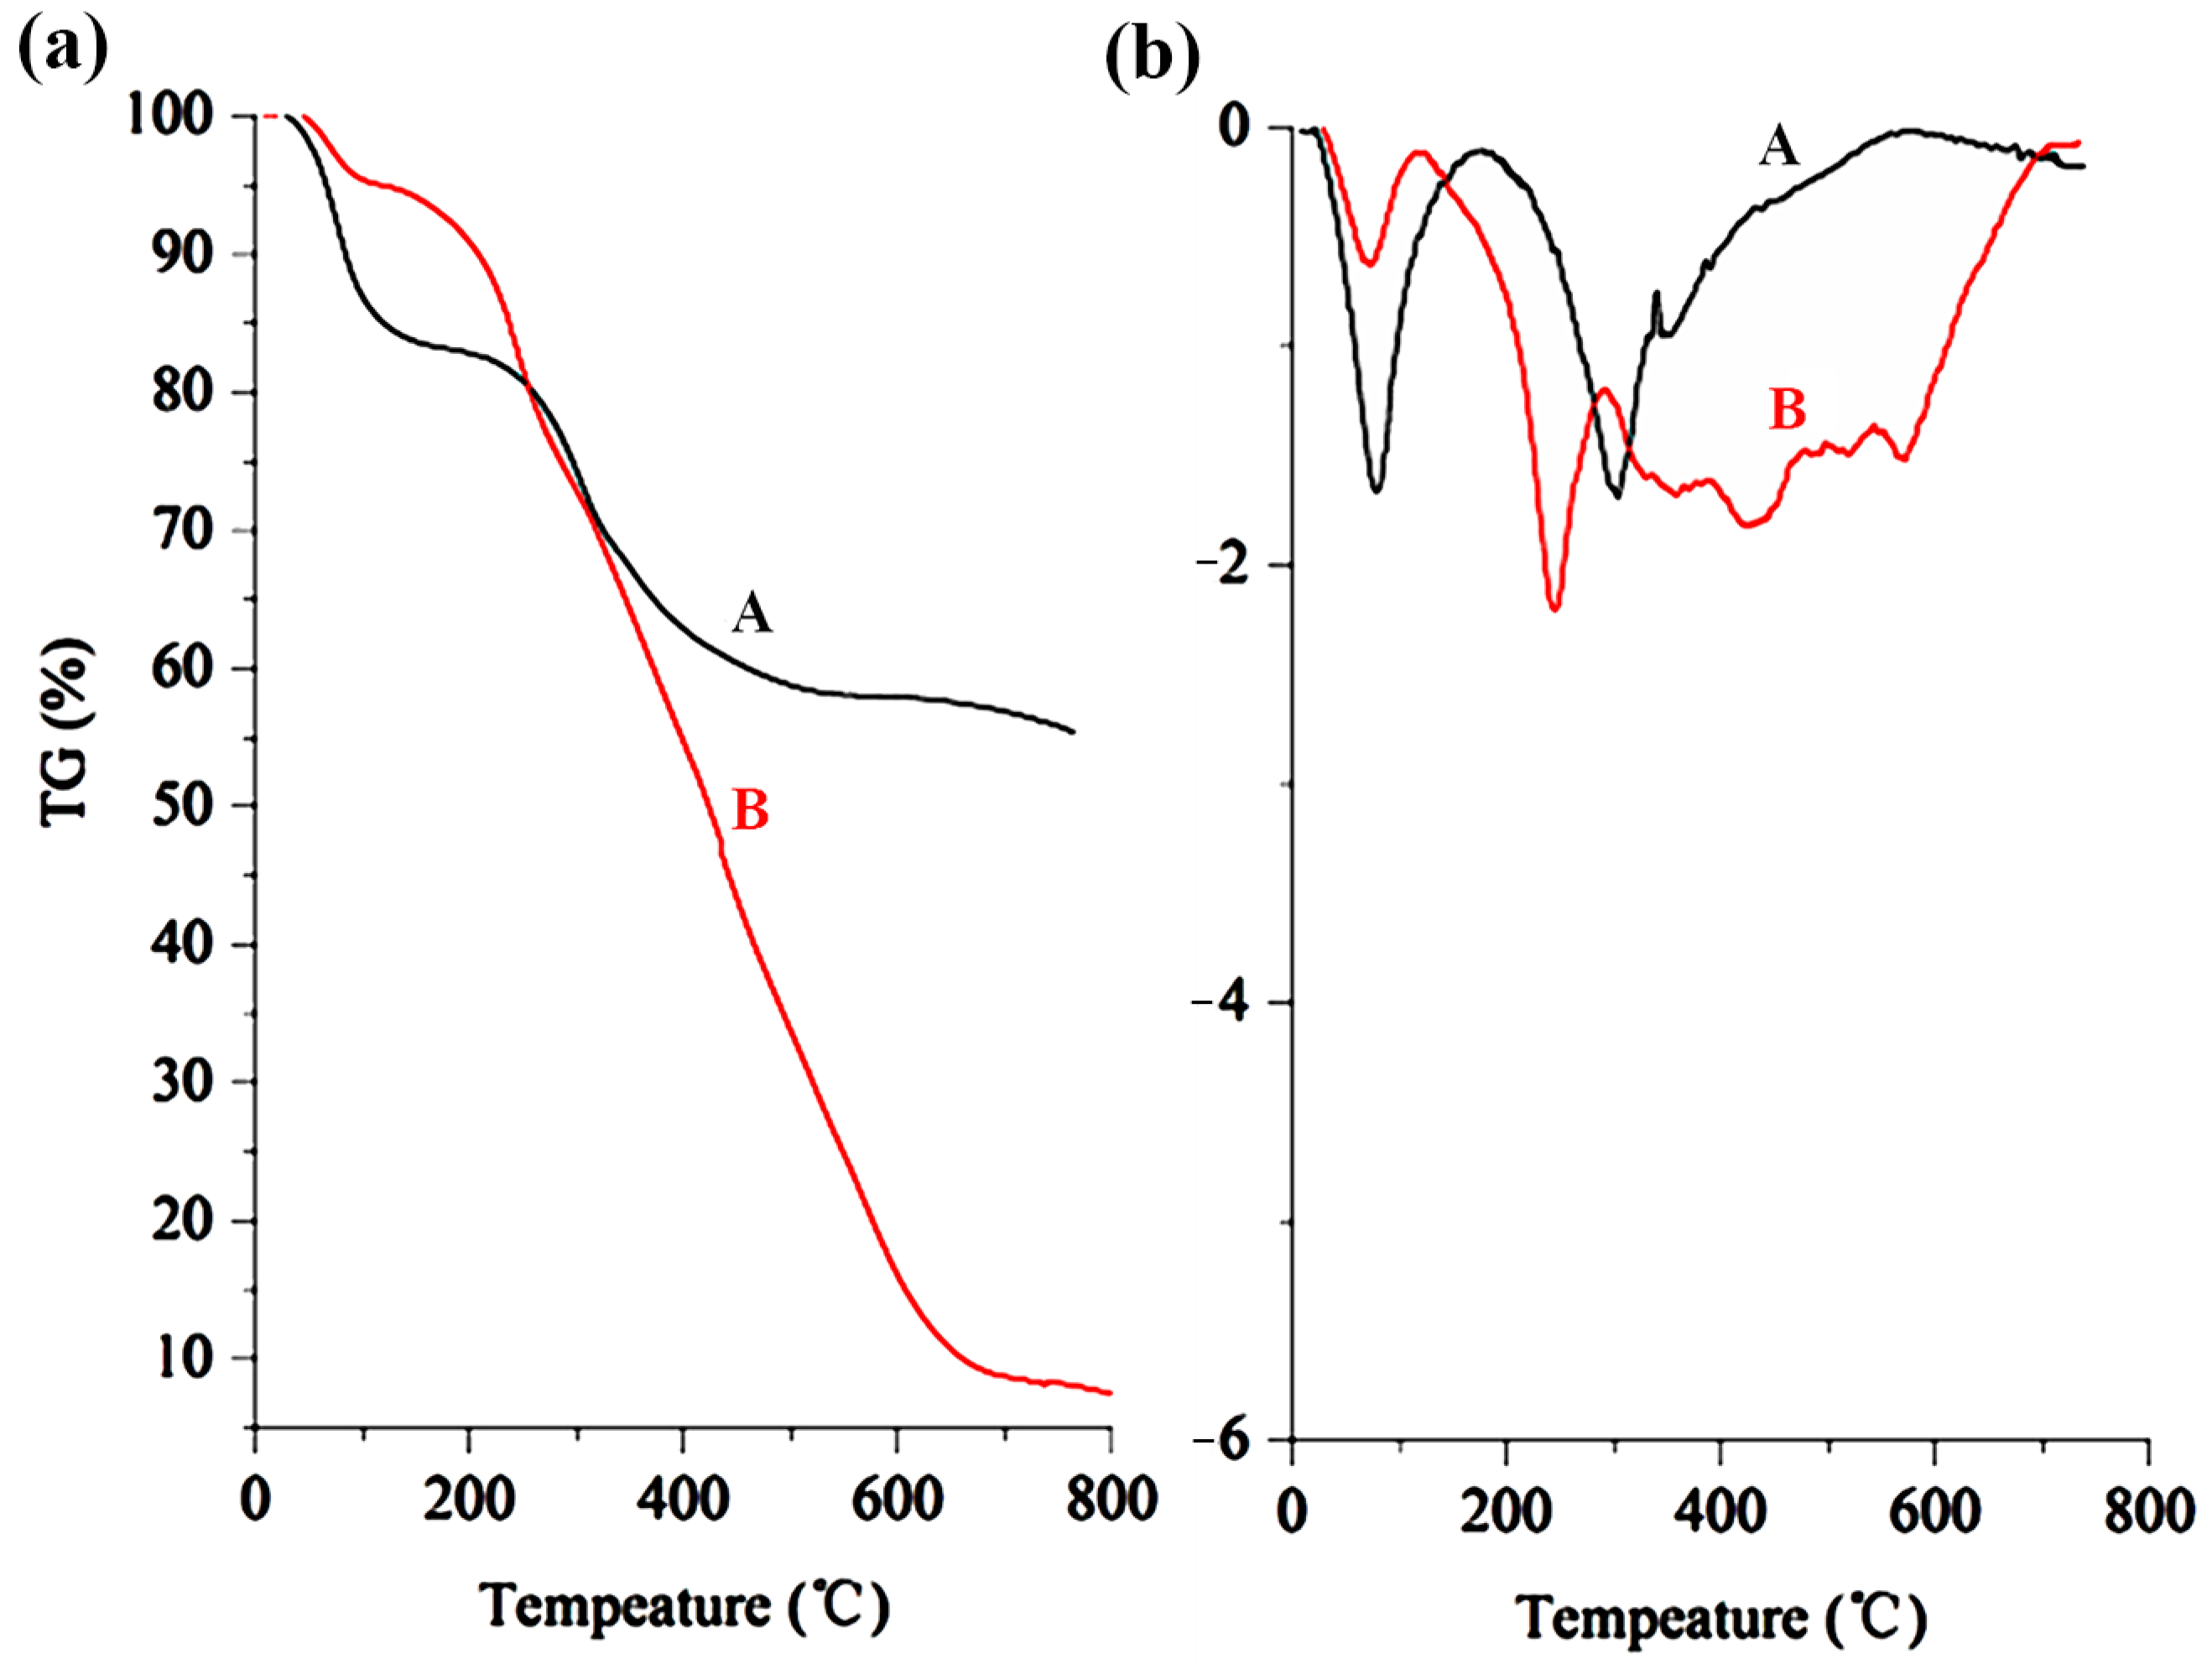
2.4.4. Thermogravimetric and Derivative Thermogravimetric (TG–DTG) Analysis
3. Materials and Methods
3.1. Experimental Reagents
3.2. Experimental Instruments and Analytical Methods
3.3. Catalytic Oxidative Degradation of Lignin
3.3.1. Determination of Alcohol Hydroxyl Groups in Lignin
3.3.2. Determination of Phenolic Hydroxyl Groups in Lignin
4. Conclusions
Author Contributions
Funding
Data Availability Statement
Acknowledgments
Conflicts of Interest
Abbreviations
| [BMIM]Im | 1-Butyl-3-methylimidazolium imidazolide |
| [Ch]Im | (2-Hydroxyethyl)-trimethyl-ammonium imidazolide |
| [N4222]Im | 1-Butyltriethyl-ammonium imidazolide |
| ∆ε-IDUS | Ionization difference ultraviolet spectrophotometry |
| DTG | Derivative thermogravimetric analysis |
| FT–IR | Fourier-transform infrared spectroscopy |
| GC–MS | Gas chromatography–mass spectrometry |
| IL | Ionic liquid |
| Mw | Molecular weight |
| SEM | Scanning electron microscopy |
| TG | Thermogravimetric analysis |
| TPU | Thermoplastic polyurethane |
| UV–Vis | Ultraviolet–visible spectroscopy |
References
- Li, J.; Guan, D.; Xia, S.; Fan, Y.; Zhao, K.; Zhao, Z.; Zheng, A. Recent Advances, Challenges, and Opportunities in Lignin Valorization for Value-Added Chemicals, Biofuels, and Polymeric Materials. Energy Convers. Manag. 2024, 322, 119123. [Google Scholar] [CrossRef]
- Zakzeski, J.; Bruijnincx, P.C.A.; Jongerius, A.L.; Weckhuysen, B.M. The Catalytic Valorization of Lignin for the Production of Renewable Chemicals. Chem. Rev. 2010, 110, 3552–3599. [Google Scholar] [CrossRef]
- Lange, H.; Decina, S.; Crestini, C. Oxidative Upgrade of Lignin—Recent Routes Reviewed. Eur. Polym. J. 2013, 49, 1151–1173. [Google Scholar] [CrossRef]
- Liu, G.; Wang, Q.; Zhang, Y.; He, H.; Jiang, L. Degradation of Lignin in Ionic Liquids: A Review. Sci. Sin. Chim. 2020, 50, 259–270. [Google Scholar] [CrossRef]
- Carpenter, D.; Westover, T.L.; Czernik, S.; Jablonski, W. Biomass Feedstocks for Renewable Fuel Production: A Review of the Impacts of Feedstock and Pretreatment on the Yield and Product Distribution of Fast Pyrolysis Bio-Oils and Vapors. Green Chem. 2014, 16, 384–406. [Google Scholar] [CrossRef]
- Pei, Z.; Liu, X.; Chen, J.; Wang, H.; Li, H. Research Progress on Lignin Depolymerization Strategies: A Review. Polymers 2024, 16, 2388. [Google Scholar] [CrossRef] [PubMed]
- Adler, E. Lignin Chemistry—Past, Present and Future. Wood Sci. Technol. 1977, 11, 169–218. [Google Scholar] [CrossRef]
- Higuchi, T. Lignin Biochemistry: Biosynthesis and Biodegradation. Wood Sci. Technol. 1990, 24, 23–63. [Google Scholar] [CrossRef]
- Gan, M.J.; Niu, Y.Q.; Qu, X.J.; Zhou, C.H. Lignin to Value-Added Chemicals and Advanced Materials: Extraction, Degradation, and Functionalization. Green Chem. 2022, 24, 7705–7750. [Google Scholar] [CrossRef]
- Cao, L.; Yu, I.K.M.; Liu, Y.; Ruan, X.; Tsang, D.C.W.; Hunt, A.J.; Ok, Y.S.; Song, H.; Zhang, S. Lignin Valorization for the Production of Renewable Chemicals: State-of-the-Art Review and Future Prospects. Bioresour. Technol. 2018, 269, 465–475. [Google Scholar] [CrossRef]
- Li, C.; Zhao, X.; Wang, A.; Huber, G.W.; Zhang, T. Catalytic Transformation of Lignin for the Production of Chemicals and Fuels. Chem. Rev. 2015, 115, 11559–11624. [Google Scholar] [CrossRef]
- Zhu, S.; Chen, K.; Xu, J.; Li, J.; Mo, L. Bio-Based Polyurethane Foam Preparation Employing Lignin from Corn Stalk Enzymatic Hydrolysis Residues. RSC Adv. 2018, 8, 15754–15761. [Google Scholar] [CrossRef]
- Wang, H.; Lin, W.; Qiu, X.; Fu, F.; Zhong, R.; Liu, W.; Yang, D. In Situ Synthesis of Flowerlike Lignin/ZnO Composite with Excellent UV-Absorption Properties and Its Application in Polyurethane. ACS Sustain. Chem. Eng. 2018, 6, 3696–3705. [Google Scholar] [CrossRef]
- Zhang, Y.; Liao, J.; Fang, X.; Bai, F.; Qiao, K.; Wang, L. Renewable High-Performance Polyurethane Bioplastics Derived from Lignin-Poly(ε-Caprolactone). ACS Sustain. Chem. Eng. 2017, 5, 4276–4284. [Google Scholar] [CrossRef]
- Klein, S.E.; Alzagameem, A.; Rumpf, J.; Korte, I.; Kreyenschmidt, J.; Schulze, M. Antimicrobial Activity of Lignin-Derived Polyurethane Coatings Prepared from Unmodified and Demethylated Lignins. Coatings 2019, 9, 494. [Google Scholar] [CrossRef]
- Wan, Z.; Zhang, H.; Guo, Y.; Li, H. Advances in Catalytic Depolymerization of Lignin. ChemistrySelect 2022, 7, e202202582. [Google Scholar] [CrossRef]
- Yuan, J.-M.; Li, H.; Xiao, L.-P.; Wang, T.-P.; Ren, W.-F.; Lu, Q.; Sun, R.-C. Valorization of Lignin into Phenolic Compounds via Fast Pyrolysis: Impact of Lignin Structure. Fuel 2022, 319, 123758. [Google Scholar] [CrossRef]
- Wang, X.; Zhang, Y.; Jia, S.; Deng, H.; Xu, W.; Shi, J. Unraveling Lignin’s Structural Features for Catalytic Oxidative Depolymerization and Enhanced Renewable Resource Utilization. Ind. Crops Prod. 2024, 207, 117750. [Google Scholar] [CrossRef]
- Bajwa, D.S.; Pourhashem, G.; Ullah, A.H.; Bajwa, S.G. A Concise Review of Current Lignin Production, Applications, Products and Their Environmental Impact. Ind. Crops Prod. 2019, 139, 111526. [Google Scholar] [CrossRef]
- Ha, J.-M.; Hwang, K.-R.; Kim, Y.-M.; Jae, J.; Kim, K.H.; Lee, H.W.; Kim, J.-Y.; Park, Y.-K. Recent Progress in the Thermal and Catalytic Conversion of Lignin. Renew. Sustain. Energy Rev. 2019, 111, 422–441. [Google Scholar] [CrossRef]
- Gücyeter, S.; Erpelding, R.; Schmidt, M.S. Review: Chemical Approaches toward Catalytic Lignin Degradation. Chem. Pap. 2022, 76, 1899–1922. [Google Scholar] [CrossRef]
- Li, P.; Ren, J.; Jiang, Z.; Huang, L.; Wu, C.; Wu, W. Review on the Preparation of Fuels and Chemicals Based on Lignin. RSC Adv. 2022, 12, 10289–10305. [Google Scholar] [CrossRef] [PubMed]
- Tolesa, L.D.; Gupta, B.S.; Tiwikrama, A.H.; Wu, Y.-C.; Lee, M.-J. Alkali Lignin Degradation with Aqueous Ammonium-Based Ionic Liquid Solutions. J. Clean. Prod. 2020, 258, 120724. [Google Scholar] [CrossRef]
- Yoo, C.G.; Pu, Y.; Ragauskas, A.J. Ionic Liquids: Promising Green Solvents for Lignocellulosic Biomass Utilization. Curr. Opin. Green Sustain. Chem. 2017, 5, 5–11. [Google Scholar] [CrossRef]
- Singh, K.; Mehra, S.; Kumar, A. Recent Advances in Catalytic Conversion of Lignin to Value-Added Chemicals Using Ionic Liquids and Deep Eutectic Solvents: A Critical Review. Green Chem. 2024, 26, 1062–1091. [Google Scholar] [CrossRef]
- Das, L.; Xu, S.; Shi, J. Catalytic Oxidation and Depolymerization of Lignin in Aqueous Ionic Liquid. Front. Energy Res. 2017, 5, 21. [Google Scholar] [CrossRef]
- Li, W.; Wang, Y.; Li, D.; Jiang, J.; Li, K.; Zhang, K.; An, Q.; Zhai, S.; Wei, L. 1-Ethyl-3-Methylimidazolium Acetate Ionic Liquid as Simple and Efficient Catalytic System for the Oxidative Depolymerization of Alkali Lignin. Int. J. Biol. Macromol. 2021, 183, 285–294. [Google Scholar] [CrossRef]
- Ouyang, X.; Lin, Z.; Deng, Y.; Yang, D.; Qiu, X. Oxidative Degradation of Soda Lignin Assisted by Microwave Irradiation. Chin. J. Chem. Eng. 2010, 18, 695–702. [Google Scholar] [CrossRef]
- Hamzah, W.S.W.; Kait, C.F.; Baharuddin, N.A.; Rahim, A.H.A.; Jumbri, K.; Wilfred, C.D.; Man, Z.; Idris, A. Microwave-Assisted Chemistry: Parametric Optimization for Catalytic Degradation of Lignin Model Compounds in Imidazolium-Based ILs. Biomass Conv. Bioref. 2023, 13, 1793–1803. [Google Scholar] [CrossRef]
- Mingming, F.; Sisi, L.; Xue, Y.; Pingping, J. Preparation of Biodiesel from Soybean Oil Catalyzed by Imidazolide Basic Ionic Liquids. New Chem. Mater. 2012, 40, 115–117+146. [Google Scholar] [CrossRef]
- Peng, L.; Zhu, H.; Sun, J. Study on degradation of lignin catalyzed by basic ionic liquids. Chem. Eng. 2017, 31, 10–12. [Google Scholar] [CrossRef]
- Dudley, G.B.; Richert, R.; Stiegman, A.E. On the Existence of and Mechanism for Microwave-Specific Reaction Rate Enhancement. Chem. Sci. 2015, 6, 2144–2152. [Google Scholar] [CrossRef]
- Sun, R.; Tomkinson, J.; Ye, J. Physico-Chemical and Structural Characterization of Residual Lignins Isolated with TAED Activated Peroxide from Ultrasound Irradiated and Alkali Pre-Treated Wheat Straw. Polym. Degrad. Stab. 2003, 79, 241–251. [Google Scholar] [CrossRef]
- Sun, G.; Wan, P.; Zhao, L.; Chen, Y.; Li, G.; Qin, T. The Improvement in the Determination Method of Hydroxyl Value for Lignin. Chem. Ind. For. Prod. 2012, 32, 51–55. [Google Scholar]
- Gärtner, A.; Gellerstedt, G.; Tamminen, T. Determination of Phenolic Hydroxyl Groups in Residual Lignin Using a Modified UV-Method. Nord. Pulp Pap. Res. J. 1999, 14, 163–170. [Google Scholar] [CrossRef]


| No. | ILs | Cations | Anions | pH |
|---|---|---|---|---|
| 1 | [BMIM]Im | 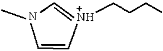 |  | 12.24 |
| 2 | [Ch]Im | 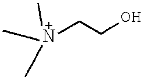 |  | 12.74 |
| 3 | [N4222]Im | 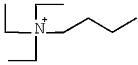 |  | 13.06 |
| No. | Retention Time (Min) | Area (%) | Molecular Formula | Compound Name | Structure |
|---|---|---|---|---|---|
| 1 | 5.86 | 13.77 | C3H6O3 | Lactic acid |  |
| 2 | 6.07 | 2.09 | C5H6O4 | 2-Methyl-2-butenedioic acid | 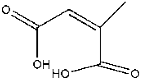 |
| 3 | 6.81 | 1.59 | C6H6O | Phenol |  |
| 4 | 7.41 | 2.73 | C4H8O2 | 2-Butene-1,4-diol | 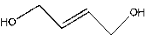 |
| 5 | 8.54 | 0.43 | C6H12O2 | Butyl acetate | 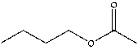 |
| 6 | 8.68 | 27.15 | C7H8O2 | Guaiacol | 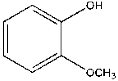 |
| 7 | 9.90 | 0.20 | C5H10O | 4-Penten-1-ol |  |
| 8 | 9.19 | 0.38 | C5H8O | Dimethyl succinate |  |
| 9 | 9.63 | 0.48 | C5H6O5 | 2-Methoxy-2-butenedioic acid |  |
| 10 | 10.24 | 3.20 | C7H6O2 | Benzoic acid |  |
| 11 | 10.34 | 0.19 | C8H10O2 | 2-Methoxy-6-methylphenol |  |
| 12 | 11.38 | 0.35 | C8H8O2 | Phenylacetic acid |  |
| 13 | 11.59 | 0.38 | C7H8O3 | 2-Methoxybenzene-1,3-diol |  |
| 14 | 12.18 | 0.89 | C9H10O2 | 4-Hydroxy-3-methoxystyrene |  |
| 15 | 12.23 | 0.69 | C8H6O4 | Phthalic acid | 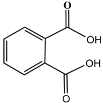 |
| 16 | 12.73 | 1.73 | C8H10O3 | 2,6-Dimethoxyphenol |  |
| 17 | 13.48 | 0.81 | C7H8O3 | 3-Methoxybenzene-1,2-diol | 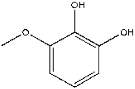 |
| 18 | 14.48 | 0.43 | C8H10O3 | 2-Hydroxy-3-methoxybenzyl alcohol |  |
| 19 | 14.63 | 1.10 | C9H10O3 | Acetovanillone | 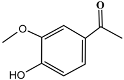 |
| 20 | 15.02 | 0.23 | C11H12O5 | Dimethyl 4-Methoxyisophthalate | 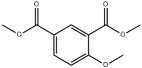 |
| 21 | 15.21 | 0.37 | C10H12O3 | 4-Hydroxy-3-methoxyphenylacetone |  |
| 22 | 16.30 | 14.05 | C8H8O4 | 3-Hydroxy-4-methoxybenzoic acid | 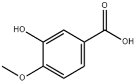 |
| 23 | 16.79 | 0.36 | C13H18O | 2-Methyl-5-phenylhex-1-en-3-ol | 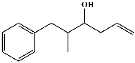 |
| 24 | 16.98 | 8.50 | C9H10O4 | Methyl 3-Hydroxy-4-methoxybenzoate | 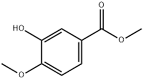 |
| 25 | 17.14 | 0.21 | C10H14O | 2-Phenylbutan-1-ol | 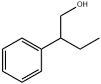 |
| 26 | 17.28 | 2.11 | C9H10O4 | 4-Hydroxy-3-methoxybenzeneacetic acid |  |
| 27 | 17.74 | 3.28 | C11H14O5 | Ethyl 2-(4-Hydroxy-3-methoxyphenyl) acetate |  |
| 28 | 19.29 | 1.03 | C10H12O2 | 2-Methoxy-5-(prop-2-en-1-yl) phenol |  |
| 29 | 20.43 | 0.16 | C10H12O3 | 3-Ethoxy-4-methoxybenzaldehyde |  |
| 30 | 22.14 | 0.13 | C11H14O3 | 4-Methoxy-3-propoxybenzaldehyde |  |
| 31 | 23.23 | 0.28 | C10H14O | 2,3,5,6-Tetramethyl phenol |  |
| 32 | 23.72 | 0.28 | C10H12O2 | 2-Methoxy-5-(prop-2-en-1-yl) phenol | 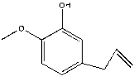 |
| 33 | 24.13 | 0.14 | C10H14O2 | 4-Propylguaiacol | 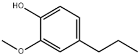 |
| 34 | 24.22 | 0.15 | C11H10O4 | 4-Hydroxymethyl-7-methoxycoumarin | 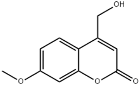 |
| 35 | 24.35 | 0.23 | C10H10O2 | 6-Methoxy-3-methylbenzofuran | 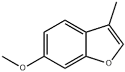 |
| 36 | 25.28 | 0.18 | C10H14O2 | 2-Methoxy-4-propylphenol |  |
| 37 | 26.90 | 0.43 | C10H14O | 2,4,6-Trimethylanisole | 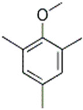 |
| 38 | 27.53 | 0.74 | C8H8O3 | 4-Hydroxy-2-methoxybenzaldehyde |  |
| 39 | 28.03 | 1.49 | C10H14O2 | 3-Methoxy-2,5,6-trimethyl-phenol | 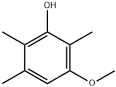 |
| 40 | 29.90 | 0.10 | C11H14O3 | 3-Isopropoxy-4-methoxy-benzaldehyde |  |
| 41 | 30.51 | 0.27 | C24H38O4 | Bis(2-ethylhexyl) phthalate | 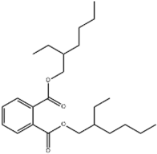 |
| 42 | 34.55 | 0.61 | C20H26O7 | 2,3-Bis[(4-hydroxy-3-methoxyphenyl) methyl] butane-1,2,4-triol | 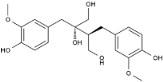 |
Disclaimer/Publisher’s Note: The statements, opinions and data contained in all publications are solely those of the individual author(s) and contributor(s) and not of MDPI and/or the editor(s). MDPI and/or the editor(s) disclaim responsibility for any injury to people or property resulting from any ideas, methods, instructions or products referred to in the content. |
© 2025 by the authors. Licensee MDPI, Basel, Switzerland. This article is an open access article distributed under the terms and conditions of the Creative Commons Attribution (CC BY) license (https://creativecommons.org/licenses/by/4.0/).
Share and Cite
Qin, Y.; Li, D.; Mahmood, S.; Che, J.; Xiang, T.; Yao, S. Microwave-Assisted Oxidative Degradation of Lignin Catalyzed by Hydrogen Peroxide–Alkaline Ionic Liquid System. Catalysts 2025, 15, 367. https://doi.org/10.3390/catal15040367
Qin Y, Li D, Mahmood S, Che J, Xiang T, Yao S. Microwave-Assisted Oxidative Degradation of Lignin Catalyzed by Hydrogen Peroxide–Alkaline Ionic Liquid System. Catalysts. 2025; 15(4):367. https://doi.org/10.3390/catal15040367
Chicago/Turabian StyleQin, Yuxin, Dan Li, Subhan Mahmood, Jiajun Che, Tianhong Xiang, and Shun Yao. 2025. "Microwave-Assisted Oxidative Degradation of Lignin Catalyzed by Hydrogen Peroxide–Alkaline Ionic Liquid System" Catalysts 15, no. 4: 367. https://doi.org/10.3390/catal15040367
APA StyleQin, Y., Li, D., Mahmood, S., Che, J., Xiang, T., & Yao, S. (2025). Microwave-Assisted Oxidative Degradation of Lignin Catalyzed by Hydrogen Peroxide–Alkaline Ionic Liquid System. Catalysts, 15(4), 367. https://doi.org/10.3390/catal15040367