Article

Silver-Modified Biochar: Investigating NO2 Adsorption and Reduction Efficiency at Different Temperatures

1
CNRS, IS2M UMR 7361, Université de Haute-Alsace, F-68100 Mulhouse, France
2
Université de Strasbourg, 67081 Strasbourg, France
3
Chemistry Department, Institute of Environmental, Chemical and Pharmaceutical Sciences, Federal University of São Paulo, Diadema 09913-030, SP, Brazil
*
Authors to whom correspondence should be addressed.
Catalysts 2025, 15(4), 392; https://doi.org/10.3390/catal15040392
Submission received: 14 March 2025 / Revised: 7 April 2025 / Accepted: 16 April 2025 / Published: 17 April 2025

Abstract

:
This study investigates the adsorption and reduction of NO2 on biochar (BCC) and silver-modified biochar (Ag-BCC) in a continuous flow. Ag-BCC showed a higher NO2 adsorption capacity (11.78 mg/g) than BCC (11.04 mg/g) at 200 °C, despite its lower surface area (345 vs. 402 m2/g). While neither material decomposed NO2 at 22 °C, Ag-BCC achieved a NO/NO2 ratio of 20% (vs. 9% for BCC) at 200 °C, highlighting the catalytic role of silver in NO2 conversion. Breakthrough curve modeling identified the Dose–Response model as optimal, accurately describing adsorption kinetics at all temperatures (22–200 °C). Adsorption rate constants decreased with increasing temperature, confirming exothermicity. Overall, the results highlight the enhanced performance of Ag-BCC for NO2 capture and conversion, underlining the potential of surface-modified biochars in the sustainable mitigation of air pollution.

1. Introduction

Emissions of nitrogen oxides (NOx), largely coming from vehicle exhausts and stationary power generation facilities, pose a substantial threat to the environment. The NOx family of gases, predominantly composed of nitrogen monoxide (NO) and nitrogen dioxide (NO2), contributes to air pollution and related hazards [1,2,3]. Among these, NO2 is particularly toxic, causing severe material corrosion and damage even at low concentrations [2].
Achieving an effective reduction of NO2 emissions is essential to meet stringent emission standards and improve environmental quality. In terms of the industrial technologies available, using Selective Catalytic Reduction (SCR) is currently the leading and most broadly used method. It uses ammonia as a reductant to convert NOx into nitrogen and water in the presence of a catalyst [4,5]. The elimination efficiency of SCR is impressive, reaching around 90% for NOx emissions [6]. Nevertheless, it is highly dependent on high reaction temperatures, as common catalysts—such as V2O5-WO3/TiO2 and copper-exchanged zeolites—are only effective within the 250–600 °C range [6,7,8]. Consequently, at low temperatures (<200 °C), NO2 emissions from sources such as exhaust fumes from cold-start vehicles along roadsides are still challenging to deal with effectively.
There is a pressing need to develop innovative and efficient technologies for the removal of ambient NO2 emissions. Among the potential solutions, adsorption using adsorbents has emerged as a promising approach due to its reliance on host−guest interactions, enabling effective NO2 capture [9]. Unlike traditional SCR catalysts, adsorbents offer significant advantages at low temperatures, making them a versatile option for NO2 abatement [9,10]. The efficiency of adsorption-based NO2 removal largely depends on the properties of the adsorbents used. Various porous materials have been explored for this purpose, including silica [11,12] (low-cost and abundant but prone to pore collapse under humid conditions), carbon-based materials [13,14,15] (high surface area and chemical stability but limited redox-active sites for NO2 conversion), metal oxides [16] (thermally robust and catalytically active but often requiring high regeneration temperatures), zeolites [17,18,19] (excellent ion-exchange capacity and molecular sieving properties but constrained by rigid pore networks and poor selectivity for polar gases like NO2), and metal−organic frameworks (MOFs) [20,21,22,23,24] (exceptional porosity and tunable functionality but hindered by high synthesis costs, moisture sensitivity, and scalability challenges).
Recently, biochar has emerged as a promising alternative for NO2 adsorption due to its low cost, tunable surface chemistry, and environmental sustainability. Unlike zeolites, MOFs, or silica, biochar is derived from renewable biomass sources, making it an eco-friendly option for pollutant removal [25]. However, research on biochar-based NO2 adsorption remains limited, with only two studies reported to date [26,27]. These studies suggest that biochar’s efficiency in NO2 capture can be enhanced through chemical modifications, but the underlying mechanisms and optimization strategies require further investigation.
A key challenge in NO2 adsorption is enhancing the redox activity of the adsorbent to facilitate NO2 reduction into less harmful byproducts. Metal modification is one approach to addressing this limitation, with previous research focusing on transition metals such as iron and vanadium for NOx removal applications [28,29,30,31]. Silver (Ag) stands out among these catalysts due to its superior redox activity and selectivity for NO2 reduction, as demonstrated in catalytic and adsorption studies [28]. Moreover, silver nanoparticles exhibit strong electron transfer properties, which can enhance NO2 adsorption and conversion when integrated into a biochar matrix.
In this context, silver-modified biochar (Ag-BCC) presents a novel approach that combines the good adsorption capacity of biochar with the catalytic potential of silver nanoparticles. This hybrid design aims to mitigate the key limitations of conventional adsorbents, such as low catalytic efficiency in pristine carbon, instability under elevated-temperature conditions in MOFs or silica, and energy-intensive regeneration in metal oxides. Thus, Ag-BCC offers a sustainable and multifunctional platform for simultaneous NO2 capture and conversion, positioning biochar as a viable alternative to traditional adsorbents.

2. Results and Discussion

2.1. TGA and Proximate Analyses

To examine the thermal degradation processes of corncob-based raw feedstocks, thermogravimetric analysis (TGA-DTG) was carried out under a controlled nitrogen atmosphere. As shown in Figure 1a, in the temperature range of 30–150 °C, the TG curve of the corncob (CC) feedstock reveals a slight mass loss, which corresponds to a small peak observed in the DTG curve between 50 and 100 °C. This indicates the evaporation of moisture content [32] absorbed by the biomass, a typical occurrence during the initial heating stage. As the temperature increases to around 200 °C, the TG curve begins to show a sharper decline, marking the beginning of more significant thermal changes. Simultaneously, the DTG curve displays the start of a major peak, with its left shoulder starting around 250–300 °C. This phase is primarily attributed to the decomposition of hemicellulose [33], which is the least thermally stable component of lignocellulosic biomass. As hemicellulose decomposes first, it contributes to a rapid mass reduction at this stage. The most significant mass loss occurs between 300 and 350 °C, where the TG curve reaches its sharpest decline. This steep drop corresponds with the maximum peak on the DTG curve at around 310–320 °C, which is indicative of cellulose decomposition [34,35]. Cellulose breaks down rapidly over this narrow temperature range, and the prominence of this peak suggests that cellulose makes up a major portion of the corncob sample, driving much of the observed mass loss. Beyond 350 °C, the TG curve continues to show mass loss, although at a slower rate. The DTG curve exhibits a long tail following the cellulose peak, extending up to 500 °C. This extended period of mass loss is characteristic of lignin decomposition [32,36], which occurs over a broader temperature range due to its complex chemical structure and the variety of chemical bonds within lignin. Compared to hemicellulose and cellulose, lignin decomposes more gradually, contributing to sustained mass loss over a prolonged period. From 500 °C to 800 °C, the TG curve shows a slow, continuous loss of mass, while the DTG curve becomes almost flat, fluctuating slightly above zero. This plateau zone suggests that the decomposition process is proceeding very slowly at this stage, probably reflecting the decomposition of the remaining biochar and inorganic components that were not volatilized at lower temperatures.
In view of this decomposition profile, it is strategic to choose 600 °C as the pyrolysis temperature for biochar production. At this temperature, most of the hemicellulose and cellulose will have been completely broken down, guaranteeing a high carbon content in the final biochar. Moreover, by stopping the process before reaching 800 °C, we can retain some of the lignin, which contributes to the biochar’s structural integrity and porosity. Pyrolysis at 600 °C achieves a balance between maximizing biochar yield and improving its stability and functionality, making it suitable for many applications. This choice of temperature also minimizes excessive ash formation, while ensuring that the biochar retains desirable properties such as high surface area and porosity, which are crucial to its performance in environmental applications.
After producing biochar at 600 °C from corncob (CC) feedstock, a TGA analysis was conducted under the same conditions as previously mentioned to validate the stability of the generated biochar and assess the effectiveness of the pyrolysis temperature. The TG-DTG analysis (Figure 1b) provides valuable insights into the thermal behavior and decomposition characteristics of the biochar. The TG and DTG data in Figure 1b indicate that biochar derived from CC feedstock exhibits high stability at temperatures below 600 °C, the designated pyrolysis temperature. This suggests that the biochar remains structurally intact and does not undergo significant decomposition within this temperature range. Upon closer examination of the DTG thermogram, the majority of the organic matter present in the CC feedstock was successfully converted into biochar, highlighting the efficiency of the pyrolysis process. This conversion resulted in the formation of a stable carbonaceous material, indicating the effective decomposition of the volatile organic components during pyrolysis. The yield of biochar produced from the CC feedstock (BCC) was found to be approximately 23%, reflecting the efficiency of the pyrolysis process in converting the original biomass into a stable carbon-rich material.
The proximate analysis of BCC, determined based on TG results, as outlined in Table 1, provides a detailed understanding of the compositional transformations following pyrolysis at 600 °C. Initially, the corncob feedstock exhibited a moisture content of 4.10%, representing the intrinsic water retained within the biomass. Post-pyrolysis, this value decreased to 2.03%, due to the elevated temperatures that drive out residual moisture during the thermal decomposition process. A notable reduction in volatile matter (VM) was observed, decreasing from 75.69% in the raw feedstock to 9.90% in the BCC. This drastic decrease is attributed to the pyrolysis process, wherein a large fraction of the labile organic compounds volatilizes, resulting in a more carbon-rich and thermally stable material. The fixed carbon (FC) content, initially measured at 18.81% in the corncob, rose significantly to 83.05% in the BCC. This substantial increase highlights the concentration of recalcitrant carbon in the final product, indicative of biochar’s enhanced stability and resistance to thermal degradation. Additionally, the ash content saw a moderate rise from 1.40% in the corncob feedstock to 5.02% in the BCC. This increase reflects the accumulation of inorganic minerals, as the organic constituents are decomposed during pyrolysis, leaving behind a higher proportion of non-combustible residues.

2.2. Ultimate Analysis and Mineral Composition

The CHNOS ultimate analysis (Table 2) reveals significant transformations in the elemental composition of the corncob feedstock following pyrolysis. The carbon content increases markedly from 48.00% in the raw corncob to 87.30% in the BCC. This substantial rise in carbon content indicates the effective conversion of organic matter into stable carbon structures, enhancing the biochar’s potential for carbon sequestration. Conversely, the hydrogen content experiences a drastic reduction, decreasing from 6.04% in the corncob to just 1.82% in the BCC. This reduction reflects the loss of volatile compounds and moisture during pyrolysis, contributing to the overall stability of the resulting carbonaceous material. The oxygen content also diminishes significantly from 43.00% to 2.64%, further highlighting the transformation of the feedstock into a carbon-rich material. The nitrogen content shows a slight increase from 0.77% in the corncob to 0.86% in the BCC, which may be attributed to the retention of nitrogenous compounds during the pyrolysis process. The sulfur content remains unchanged at 0.13%, suggesting that sulfur-containing compounds are stable under pyrolytic conditions.
The mineral composition analysis conducted via XRF reveals significant changes (Table 3) in the concentrations of various minerals in corncob feedstock (CC) before and after pyrolysis at 600 °C (BCC). Notably, the potassium concentration increases dramatically from 0.826% to 3.804%. Similarly, the calcium content rises from 0.057% to 0.111%, and the sodium concentration increases from 0.015% to 0.089%. The silicon concentration also shows a marked increase, rising from 0.661% to 1.149%, while the magnesium concentration grows from 0.051% to 0.381%. Additionally, the aluminum content increases from 0.051% to 0.101%, indicating the retention of specific inorganic compounds. These elevated mineral concentrations in the BCC produced from corncobs suggest significant transformations during the pyrolysis process, reflecting the retention and concentration of inorganic components in the final product. The observed increases in mineral concentrations correlate with the higher ash content (Table 1) determined after pyrolysis at 600 °C, highlighting the retention of these elements while volatile components are lost, resulting in a more concentrated residue [37].

2.3. Discussion of Ag-BCC Synthesis Protocol

In order to confirm the successful synthesis of silver nanoparticles (AgNPs), TEM analysis was carried out (Figure 2a). The images revealed well-defined nanoparticles with predominantly circular to ellipsoidal morphologies. The particle size distribution (Figure 2b) ranged from around 5 to 25 nm, with the majority of particles concentrated between 10 and 15 nm. This indicates a controlled and uniform synthesis process, minimizing size variability. Following the impregnation of the AgNPs on the BCC matrix, XRF analysis was carried out to verify the presence of silver. The results confirmed a silver content of 0.945 wt.% (Table 3), closely corresponding to the target of 1 wt.% and demonstrating the efficient deposition of nanoparticles on the biochar surface.

2.4. Textural Properties

CO2 adsorption–desorption isotherms (Figure 3a) for BCC and Ag-BCC samples reveal interesting information about their textural properties. In particular, Ag-BCC shows a lower adsorption capacity than BCC over the whole range of relative pressures. This difference becomes more pronounced at higher relative pressures, where BCC shows systematically higher CO2 adsorption. This variation in adsorption characteristics can be attributed to differences in the physical and chemical properties of the two samples. The specific surface area was determined using the Dubinin–Astakhov model, based on CO2 adsorption data. It was found that BCC has a higher specific surface area (402 m2/g), as well as a higher total pore volume (0.10 cm3/g), compared to Ag-BCC (345 m2/g and 0.08 cm3/g, respectively). The total pore volume was calculated from adsorption data obtained by CO2 isotherm analysis. These textural properties confer BCC with a greater number of adsorption sites, facilitating a faster and more efficient adsorption of CO2. On the other hand, silver modification appears to have reduced the available surface area and pore volume, thus decreasing the overall adsorption capacity of Ag-BCC. In addition to these differences in specific surface area and porosity, pore size distribution was studied using the Non-Local Density Functional Theory (NLDFT) model, which is particularly well suited to micropore analysis. Both materials (Figure 3b) show a bimodal distribution in the ultra-micropore region (<1 nm). However, Ag-BCC displays a pronounced peak around 0.5 nm, indicating a large volume of very narrow micropores. In comparison, BCC shows a broader distribution with peaks at 0.5 nm and 0.8 nm, suggesting a more heterogeneous micropore structure.
The silver modification thus appears to reduce the overall adsorption capacity of the biochar, probably because the silver nanoparticles block or partially fill the larger pores, thus limiting access to adsorption sites. In addition, silver could occupy certain adsorption sites or reduce total pore volume, explaining this reduction. However, this modification by silver favors the formation of very narrow micropores, which could have positive implications for certain specific applications requiring such pores.
SEM images of the BCC at a scale of 10 µm reveal a porous surface with a variety of porous structures, featuring interconnected porosity (Figure 4). This architecture favors gas adsorption by offering a large specific surface area and a network of accessible channels. After the impregnation of the BCC with silver, SEM images show a homogeneous distribution of silver particles on the surface (Figure 4). However, silver detection at this scale (10 µm) is difficult due to the low concentration used for impregnation. The small amount of silver dispersed on the biochar remains quite invisible at this resolution. It is only at finer scales, at 1 µm and 100 nm, that silver nanoparticles can be seen to be well distributed on the porous structure. The reduced concentration, while optimizing catalytic and adsorptive properties without saturating the surface, makes the silver less visible on a large scale. Nevertheless, at higher resolutions, the homogeneous distribution of silver is evident, guaranteeing uniform reactivity throughout the material.

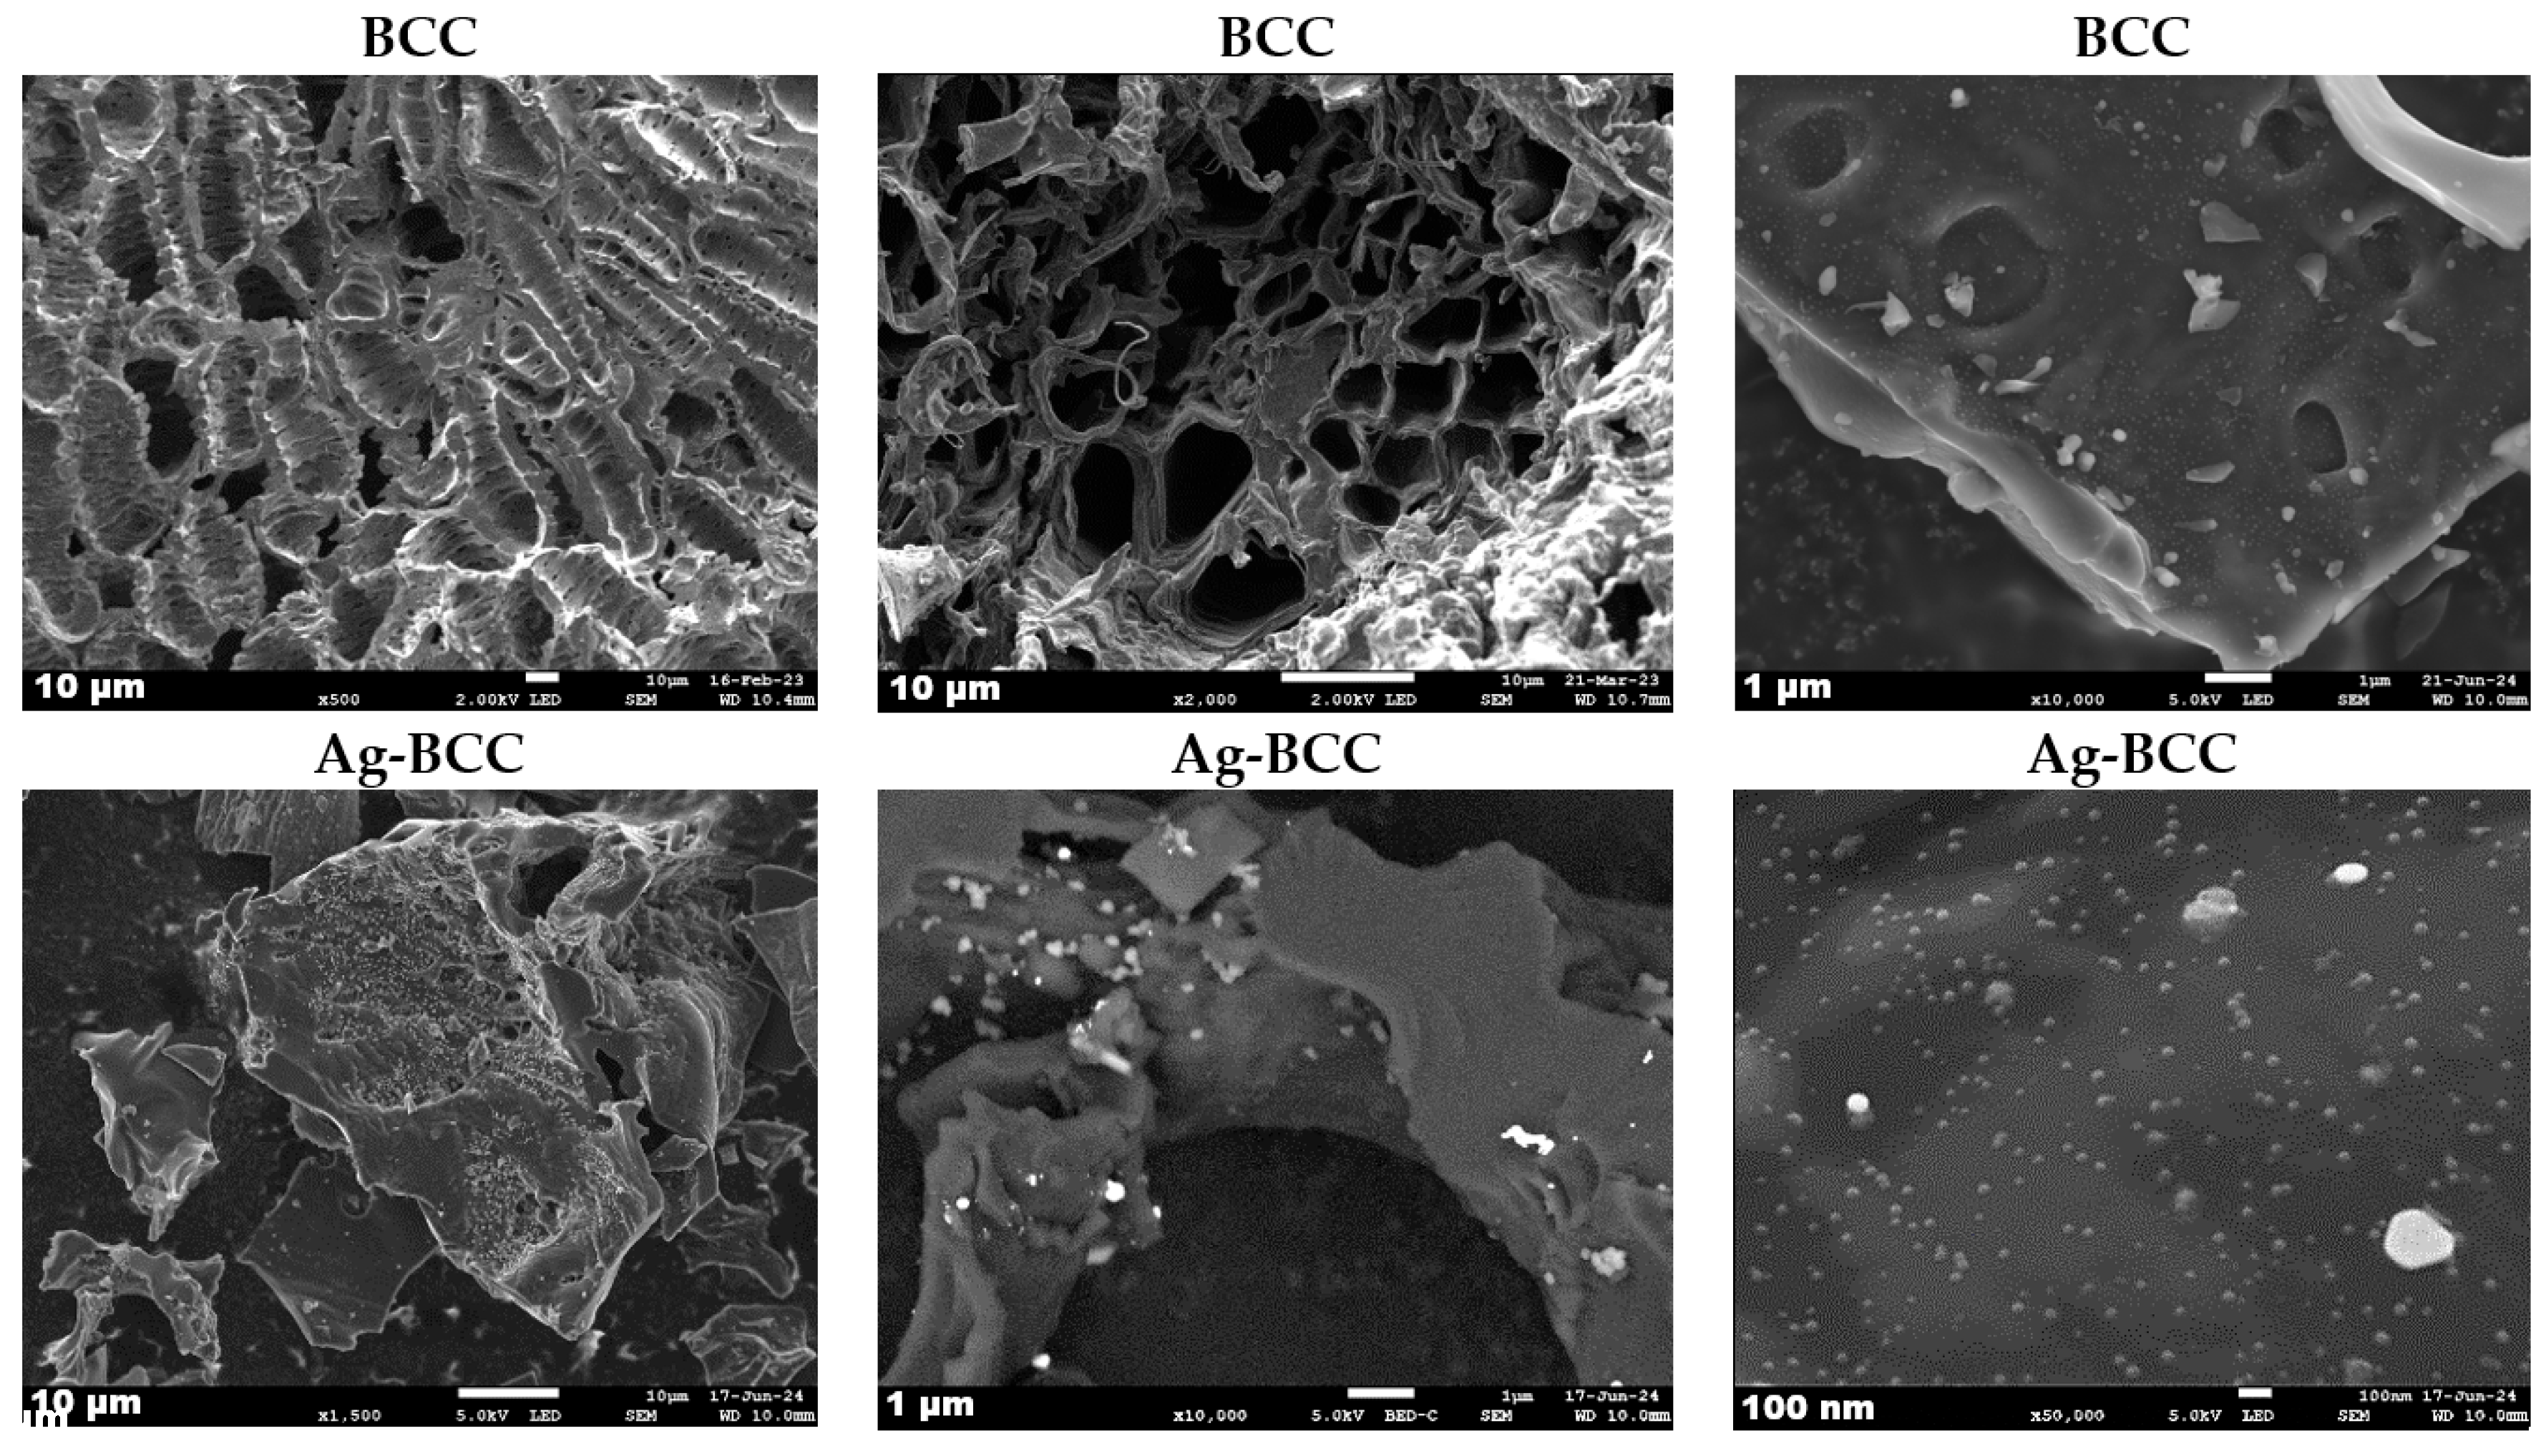
2.5. Structural Properties

The XRD analysis of BCC reveals broad, low-intensity peaks characteristic of amorphous carbon materials (Figure 5). A prominent peak between 15 and 25° 2θ is indicative of the disordered carbon structures commonly found in BCC, and the absence of sharp peaks suggests a lack of long-range crystalline order, consistent with its disordered nature [36,38]. In the case of Ag-BCC, the overall BCC structure is retained, with the addition of distinct sharp peaks corresponding to crystalline silver (Ag) nanoparticles (ICDD: 04-002-1171). Major peaks for Ag are observed at approximately 38° (Ag 111), 44° (Ag 200), 64° (Ag 220), and 77° 2θ (Ag 311), and all are associated with the face-centered cubic (fcc) structure of silver. Both patterns also display peaks attributed to potassium chloride (KCl; ICDD: 01-076-3362), which originated from the biomass feedstock. The Ag (111) peak at 38° 2θ is the most intense, which aligns with the standard intensity pattern for fcc silver, suggesting no preferential orientation of the nanoparticles. Importantly, the preservation of broad BCC features in the Ag-BCC pattern indicates that the silver impregnation did not significantly disrupt the carbon structure. Furthermore, no peak shifts or additional phases corresponding to silver oxides or silver–carbon bonds were detected, suggesting that the silver is primarily present in its metallic form and physically adsorbed onto the BCC surface rather than chemically bonded. This aligns with the impregnation method used, where silver nanoparticles were deposited onto the BCC matrix through a solution-based approach without in situ chemical reactions.

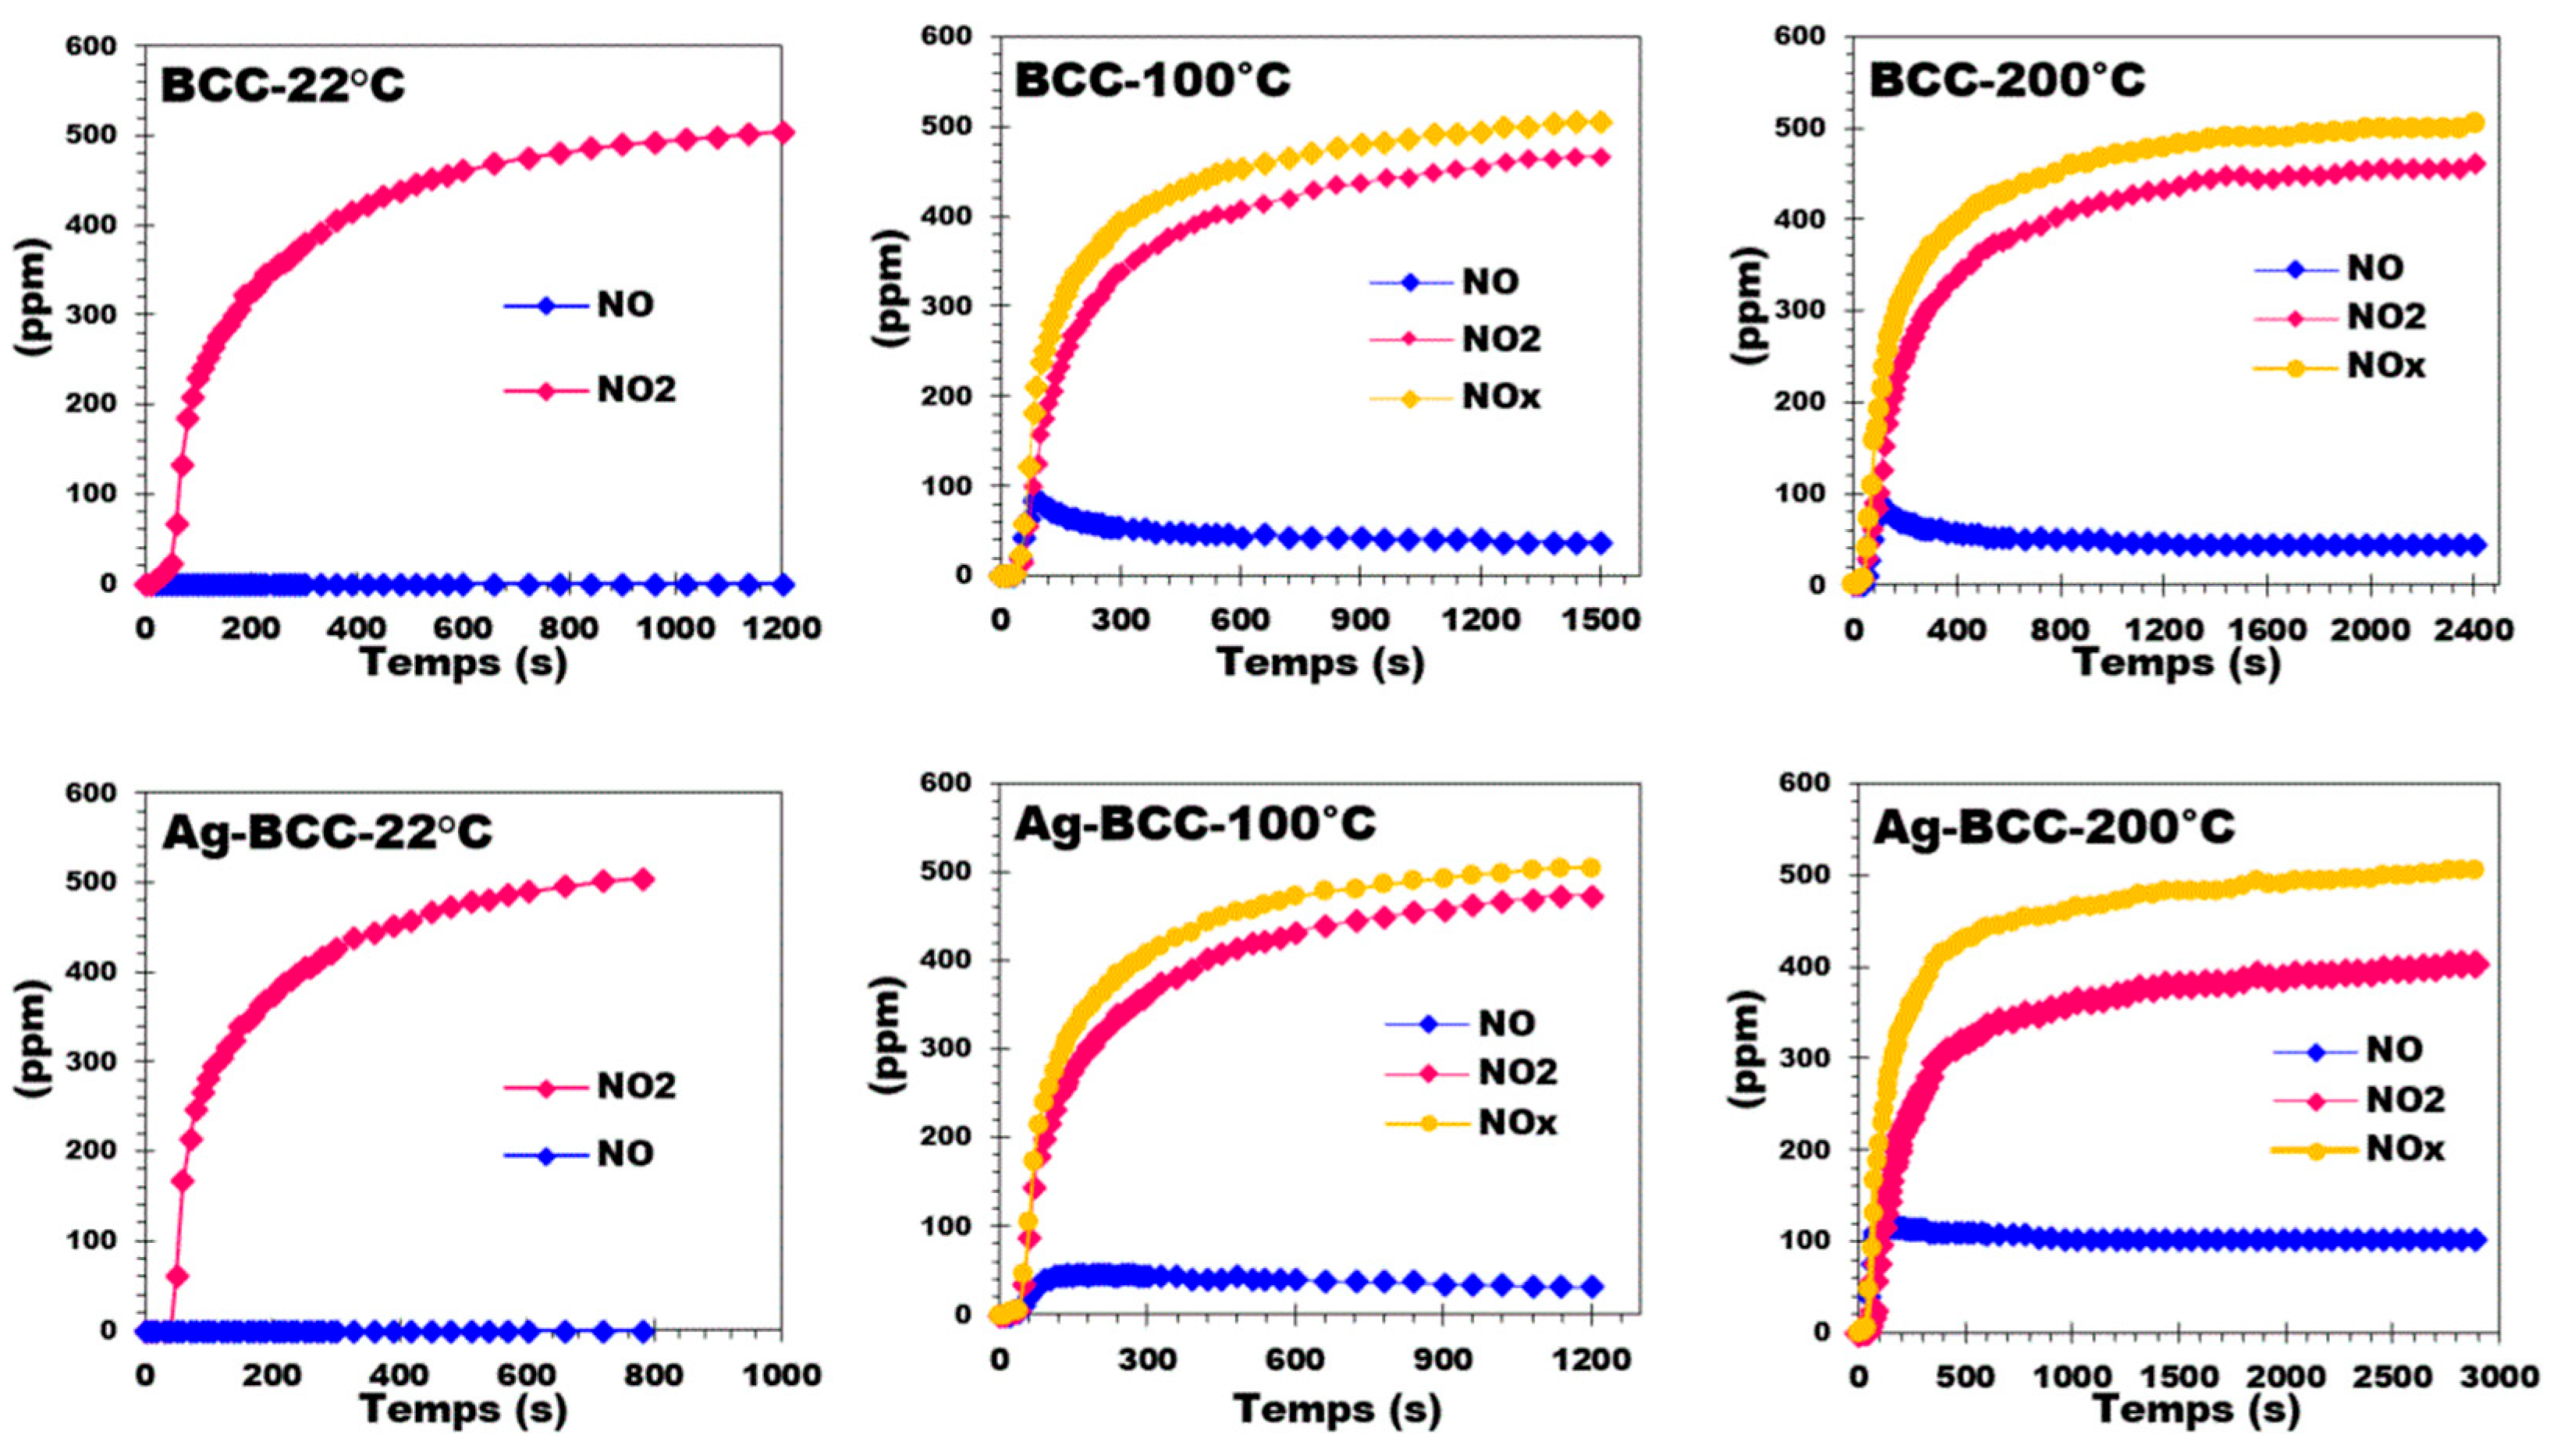
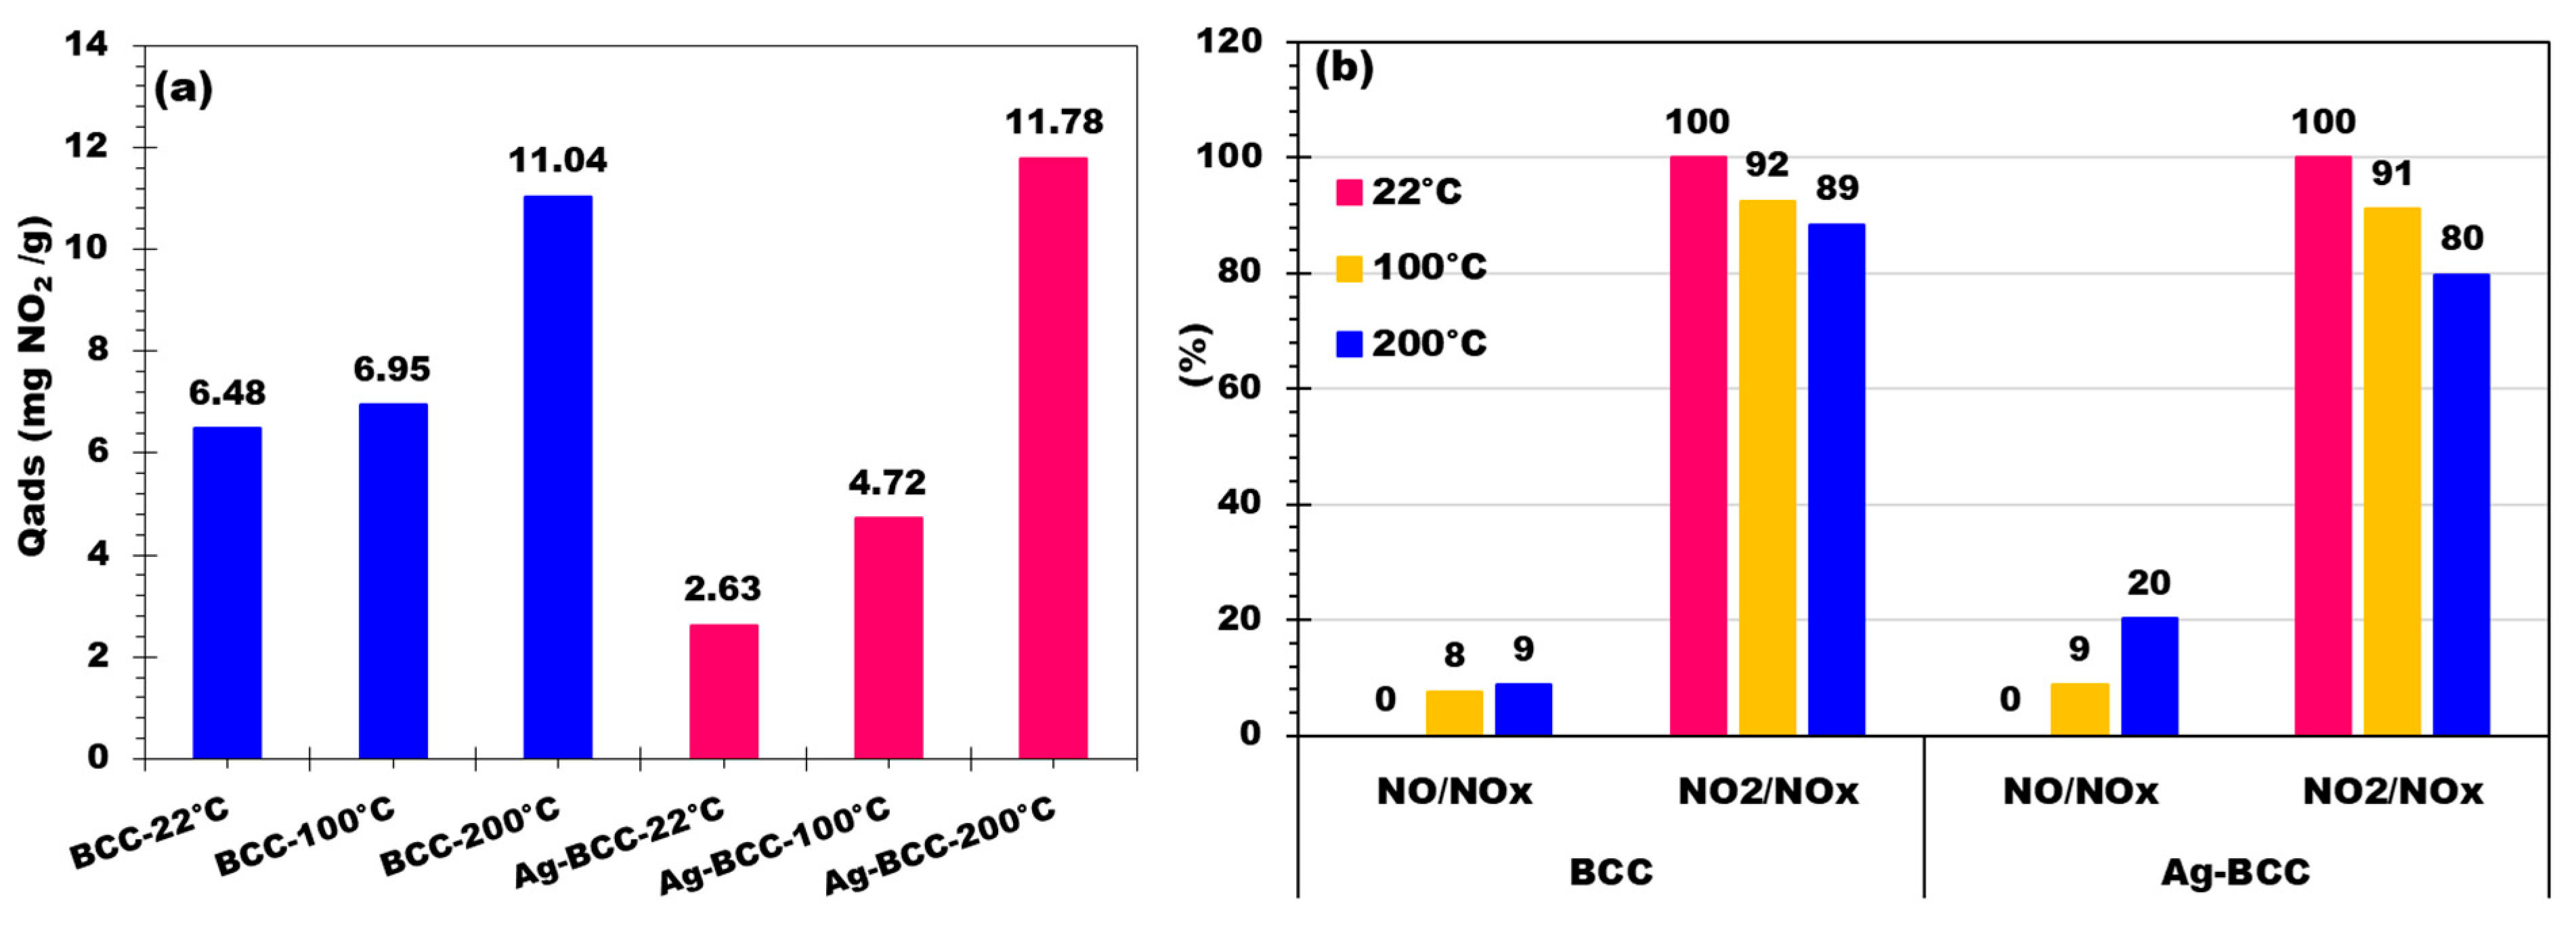
2.6. NO2 Adsorption and Distribution of NO and NO2

Figure 6 presents the concentrations of NO2 and NO gases released during the NO2 adsorption experiments on 250 mg of sample at three different temperatures: 22 °C, 100 °C, and 200 °C. The results highlight the role of temperature and the impact of silver modification on BCC’s adsorption and catalytic behavior.
At 22 °C (room temperature), the adsorption process shows a rapid increase in NO2 concentration, reaching approximately 500 ppm. Notably, no NO is detected at this temperature, indicating that NO2 is primarily adsorbed without undergoing any significant decomposition. The same trend is observed for the Ag-BCC, where NO2 adsorption occurs quickly, and NO remains undetectable. This suggests that, at 22 °C, the presence of silver does not activate any catalytic reaction. Both unmodified and Ag-BCC are effective at adsorbing NO2, but no chemical transformation into NO takes place, likely due to insufficient thermal energy for catalysis.
Figure 7a shows a comparative adsorption capacity evaluation of NO2 by unmodified BCC and Ag-BCC at different temperatures (22 °C, 100 °C and 200 °C). At an ambient temperature of 22 °C, BCC displays an adsorption capacity of 6.48 mg NO2/g, while Ag-BCC shows a lower performance with only 2.63 mg NO2/g. This observation suggests that the presence of silver does not enhance adsorption at room temperature and may even inhibit it. Increasing the temperature to 100 °C, BCC shows a slight increase in adsorption efficiency, reaching 6.95 mg NO2/g, while Ag-BCC rises again to 4.72 mg NO2/g. Although both biochars show an improvement compared to 22 °C, Ag-BCC remains less efficient than BCC. At 200 °C, however, the trend is reversed: BCC shows a maximum adsorption of 11.04 mg NO2/g, while Ag-BCC reaches 11.78 mg NO2/g. This indicates that modification with silver promotes NO2 adsorption at elevated temperatures, suggesting a beneficial catalytic role for silver in facilitating adsorption processes. These results highlight the crucial importance of temperature in adsorption mechanisms and highlight how chemical modifications of BCC can significantly influence its effectiveness as an adsorbent material.
Figure 7b shows the ratios between NO and NO2 (NO/NO2), as well as NO2 and NO (NO2/NO), for BCC and Ag-BCC at different temperatures (22 °C, 100 °C and 200 °C). At 22 °C, no NO is detected in either case, with a NO2/NO ratio of 100%, indicating that all the gas measured is NO2, with no trace of decomposition to NO. This suggests that neither pure BCC nor that modified with silver promotes the conversion of NO2 to NO at room temperature.
At 100 °C, a slight decomposition of NO2 to NO is observed for both materials. For BCC, the NO/NO2 ratio is 8%, indicating that 8% of the gas released is NO, while 92% remains as NO2. In comparison, Ag-BCC shows a slightly lower ratio, with 9% NO and 91% NO2, showing that the addition of silver at this temperature does not significantly increase the decomposition of NO2 to NO, although there is a noticeable effect compared to at 22 °C. Finally, at 200 °C, the differences between the two materials become more marked. BCC shows a NO/NO2 ratio of 9%, indicating an increase compared to 100 °C, while Ag-BCC sees this ratio climb to 20%, with a higher proportion of NO released. This clearly shows that silver catalyzes the decomposition of NO2 to NO to a greater extent at high temperatures, reducing the NO2/NO ratio to 80% for Ag-BCC compared with 89% for BCC.
By analyzing the results of BCC and Ag-BCC textural properties with respect to NO2 adsorption results, it can be seen that BCC has a higher specific surface area (402 m2/g) than Ag-BCC (345 m2/g), which means that it should theoretically offer more active sites available for NO2 adsorption. However, despite a lower specific surface area, Ag-BCC shows a better adsorption capacity at high temperature (200 °C), reaching 11.78 mg NO2/g versus 11.04 mg NO2/g for BCC. This suggests that the catalytic effect of silver compensates for the reduction in available surface area by activating the decomposition of NO2 to NO and promoting NO2 retention at higher temperatures.
The pore volume of BCC is slightly higher (0.10 cm3/g) than that of Ag-BCC (0.08 cm3/g). A higher pore volume may offer better physical adsorption capacity by facilitating the diffusion of gas molecules into the material. This could explain why, at a low temperature (22 °C), BCC adsorbs more NO2 than Ag-BCC (6.48 mg/g vs. 2.63 mg/g). At high temperatures (200 °C), the reduction in pore volume in Ag-BCC does not appear to limit adsorption, probably because the catalytic reaction becomes the dominant factor, not just physical adsorption.
To better assess the relevance of our materials, we compared their NO2 adsorption performance with previously reported sorbents. The adsorption capacities of Ag-BCC (11.78 mg/g) and BCC (11.04 mg/g) are significantly higher than those of some carbon-based materials, such as GOFe1-n (4 mg/g) [39] and unactivated Polish bituminous coal, which only reached 0.3–0.5 mg/g [40]. These results highlight the efficiency of our biochar-based sorbents, even though they were prepared without additional activation steps, which often require significant energy input. Furthermore, while our materials do not reach the highest adsorption capacities reported for chemically engineered activated carbons, such as copper-impregnated (121–206 mg/g) [41] and urea-impregnated (66–140 mg/g) wood-based activated carbons [42], they offer a more sustainable and cost-effective alternative. The silver modification used in our study involved only 1% impregnation, yet it significantly enhanced NO2 adsorption and reduction compared to the BCC. In contrast, activated carbons with higher adsorption capacities often require complex chemical treatments, additional functionalization, or high-temperature activation, all of which increase processing costs and environmental impact.
These findings underscore the potential of Ag-BCC as a promising sorbent for NO2 removal, balancing performance with sustainability. The results also emphasize the importance of surface functionalization strategies, which will be further explored in our ongoing research to optimize adsorption properties and enhance the applicability of biochar-based materials in air purification.

2.7. Modeling the Breakthrough Curves

In fixed-bed adsorption systems, breakthrough curves are fundamental for assessing the dynamic performance of adsorbents under continuous-flow conditions [43]. These curves provide valuable insights into adsorption kinetics, capacity, and system efficiency, forming the basis for fitting and comparing standard adsorption models. In this study, the breakthrough curves were analyzed and fitted to commonly used models for fixed-bed adsorption systems [44].
The Bohart-Adams (B-A) model assumes that the adsorption process is not instantaneous, and that the rate is proportional to the residual adsorption capacity of the adsorbent and the adsorbate concentration in the fixed bed. It implies a linear dependence of adsorption rate on adsorbate concentration and available adsorption sites [45]. The equation describing the time evolution of adsorbate concentration is given below:
C t C 0 = 1 1 + e x p ( K B A C 0 N 0 x μ C 0 t )
where KBA (cm3/mg·s) is the B-A rate constant; N0 (mg/cm3) is the initially available adsorption capacity of the adsorbent per unit volume of the bed; x (cm) is the bed height and µ (cm/min) is the linear flow velocity.
The Clark model is based on the mass-transfer concept in combination with the Freundlich isotherm, describing the plug-flow behavior in a fixed-bed column [46]:
C t C 0 = 1 1 + A e x p ( r t ) 1 n 1
where A (dimensionless) and r (1/min) is the Clark model constant, and n (dimensionless) is the Freundlich constant which represents a measure of adsorption intensity.
The Dose–Response (D-R) model is a further example of a simplified model that can be adapted to low- and long-term breakthrough curves and allows asymmetric modeling [47]:
C t C 0 = 1 1 1 + ( K D R t ) s
In which s (dimensionless) and KDR (1/min) are the dose-response parameters. The D-R model forms a sigmoidal curve only when the parameter s exceeds unity (s > 1), and determines the slope of the regression function. As a result, as s increases, the breakthrough curve becomes more symmetrical. The constant KDR is linked to the throughput volume that produces a half-maximum response.
Figure 8 compares the suitability of different models to describe the breakthrough curves for NO2 adsorption on BCC and Ag-BCC samples at different temperatures (22 °C, 100 °C and 200 °C). Table 4, Table 5 and Table 6 provides the corresponding fitting parameters for each model. For the D-R model, there is consistently the best fit to the experimental data, as indicated by its high R2 values (≥0.975) and low reduced chi-squared values (Table 6). Moreover, its ability to account for breakthrough curve asymmetry guarantees accurate predictions for the initial rise and plateau regions. It is therefore highly effective in capturing the dynamic behavior of adsorption in continuous-flow systems. In comparison, the B-A model gives satisfactory results in the central part of the breakthrough curves but fails to accurately capture the initial and final phases (Table 5). In contrast, Clark’s model aligns well with experimental data during the early stages of the breakthrough curve, particularly the initial increase. However, it shows moderate deviations in the longer term, underestimating the plateau region. This suggests that while the Clark model effectively captures early adsorption dynamics, it is less suited to describing the full NO2 adsorption cycle.
The dose–response rate constant (KDR) shows a significant temperature dependence for both BCC and Ag-BCC samples, providing insight into adsorption behavior under varying temperature conditions (Table 6). For BCC, the KDR decreases from 0.441 at 22 °C to 0.315 at 200 °C. This trend indicates that adsorption is slower than in the case of Ag-BCC. It also indicates a slower adsorption rate at higher temperatures, which may be attributed to increased desorption or weaker adsorbate–adsorbent interactions due to the high thermal energy. Similarly, Ag-BCC shows a decrease in KDR with temperature, from 0.592 at 22 °C to 0.300 at 200 °C, reflecting the trend observed for BCC. However, the KDR values for Ag-BCC are consistently higher than those for BCC at all temperatures, highlighting the improved adsorption kinetics introduced by silver doping. This improvement is probably due to the catalytic effects of silver, which enhance interactions between NO2 and the adsorbent surface, facilitating faster adsorption. These results underline the effectiveness of Ag-BCC as a promising adsorbent, particularly at lower temperatures where the kinetic advantage is more pronounced.

2.8. Proposed Possible Mechanism for NO2 Adsorption on Ag-BCC

This proposed mechanism serves as a conceptual framework for understanding NO2 adsorption on Ag-BCC. While it aligns with general findings in silver-catalyzed processes [28,48,49], its validity in the context of Ag-BCC remains to be fully elucidated. It is essential to emphasize that this work represents a preliminary exploration, with the proposed mechanism serving as a starting point for deeper investigations.
Possible Mechanism Steps [28,48,49]:
i. 
Metallic silver acts as a reducing agent, converting NO2 into NO gas while forming silver (I) oxide (Ag2O). This step is consistent with silver’s redox capabilities and its ability to form stable oxides. The reduction of NO2 leads to the formation of NO, which is detected as part of the NOx concentration in the experimental results.
NO2 + 2Ag → Ag2O + NO (g)
ii. 
Silver oxide (Ag2O) reacts further with NO2, resulting in the formation of silver nitrite (Ag[NO2]) while regenerating metallic silver. This highlights the dynamic oxidation states of silver during the reaction process. Again, NO is produced and contributes to the observed NOx concentration in the measurements.
NO2 + Ag2O → Ag[NO2] + Ag
iii. 
Silver nitrite (Ag[NO2]) decomposes into silver nitrate (Ag[NO3]), regenerates metallic silver, and releases NO gas. The NO produced in this step is part of the NOx measured in the experiments.
2Ag[NO2] → Ag[NO3] + Ag + NO(g)
To the best of our knowledge, no previous study has specifically examined biochar modified with silver nanoparticles for NO2 adsorption. This underlines the innovative nature of this research and provides a basis for further investigations. It opens up several pathways for further exploration. Advanced spectroscopic and microscopic techniques, such as X-ray photoelectron spectroscopy (XPS), could be valuable for future investigations to confirm the presence of intermediates such as Ag2O, Ag[NO2], and Ag[NO3]. This technique would also help in studying the interaction of biochar functional groups with NO2 or silver species, which could potentially influence adsorption and reaction dynamics. Investigating the effect of varying silver contents on adsorption and catalytic performance can help optimize material design. In addition, studying the durability and regeneration capacity of Ag-BCC under cyclic adsorption–desorption conditions will enable us to assess its long-term use.
The present work marks a starting point for understanding the adsorption of NO2 on Ag-BCC. The proposed mechanism provides a plausible explanation for the observed interactions, aligning with the silver-catalyzed processes reported in the literature [28,48,49].

3. Materials and Methods

3.1. Preparation of Biochar

The selected raw material for this study was corncob feedstock (CC), chosen for its wide availability in France. Before BCC production, the corncobs were ground to achieve a particle size between 0.5 and 2 cm. The BCC was produced using a pilot-scale pyrolyzer, equipped with a screw conveyor that transported both the corncobs and the resulting BCC through the pyrolysis reactor. During the pyrolysis process, the gases generated (both condensable and non-condensable fractions) were directed to a flare for complete combustion. Upon exiting the furnace, the BCC was collected and transported through a double-walled tube with a water-cooling system, reducing its temperature to approximately 20 °C. The BCC was then stored in an airtight metal container, ensuring it remained free of oxygen exposure. Prior to feeding the corncobs into the reactor, the entire system was purged with nitrogen (20 NL/h) until the oxygen concentration in the reactor was reduced to below 1% by volume. Throughout the pyrolysis process, nitrogen was continuously flushed into the system to maintain an oxygen-free environment. The BCC was produced at 600 °C, as indicated by the TGA results shown in Figure 1, with a residence time of 30 min in the pyrolysis reactor.

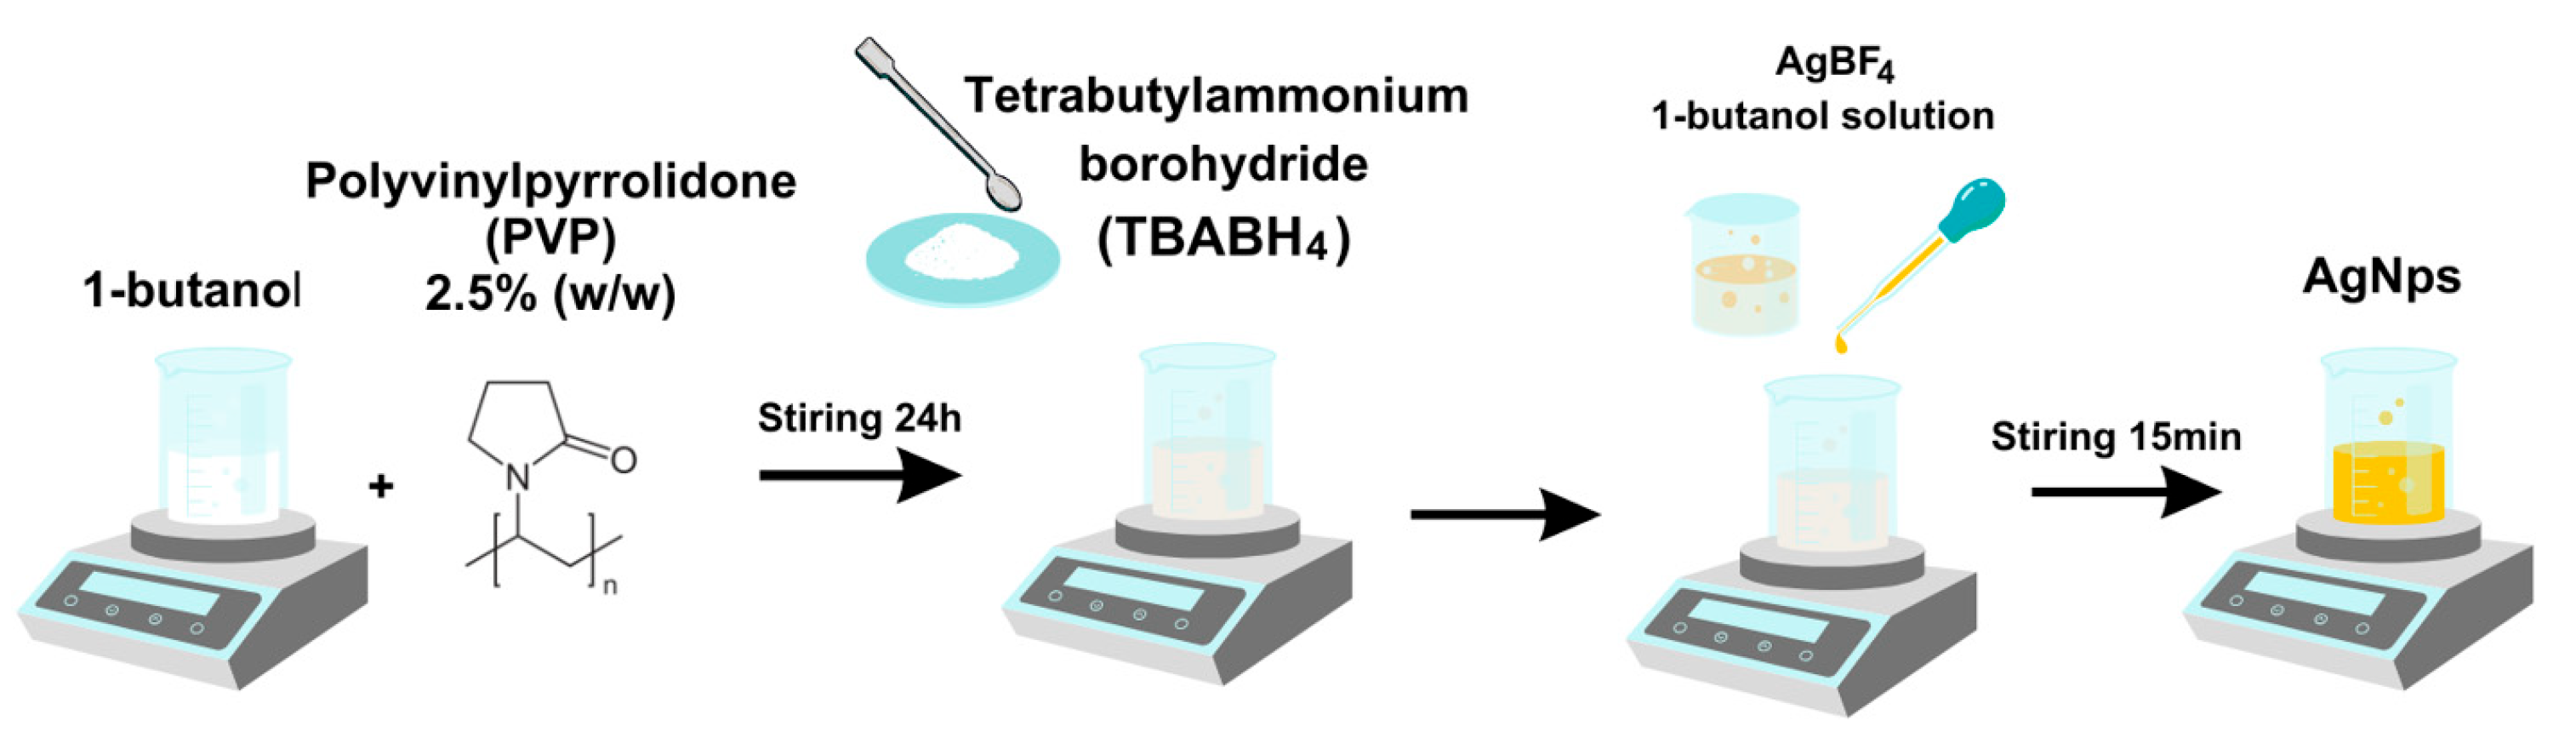
3.2. Synthesis of Silver Nanoparticle Dispersion

The silver nanoparticle dispersion was synthesized through a chemical reduction process using silver salt dissolved in the organic solvent 1-butanol [50,51,52]. While water-based methods offer advantages such as eco-friendliness, they often result in low metal concentrations, limiting their practical applicability. To overcome this limitation, 1-butanol was selected due to its ability to enhance particle stability against oxidation and enable the preparation of dispersions with higher metal concentrations [53]. Additionally, silver nanoparticles synthesized in an organic medium such as 1-butanol exhibit better compatibility with the hydrophobic biochar used in this study.
A novel aspect of this methodology lies in the use of silver tetrafluoroborate (AgBF4) as the silver precursor, which is highly soluble in 1-butanol, and tetrabutylammonium tetrahydroborate (TBABH4) as a reducing agent, which, while less commonly used, is highly effective in this solvent system. Polyvinylpyrrolidone (PVP) was incorporated as a stabilizing agent to prevent nanoparticle aggregation and ensure colloidal stability.
For the synthesis, 83.0 mg of PVP (360 kDa, Sigme-Aldrich, St. Louis, MO, USA) was dissolved in 1.0 mL of 1-butanol and stirred for 24 h to ensure complete solubilization. Next, 112 mg (4.38 × 10⁻⁴ mol) of TBABH4 was added to this solution, yielding Solution 1. In a separate flask, 56 mg (2.98 × 10⁻⁴ mol) of AgBF4 was dissolved in 3.0 mL of 1-butanol to prepare Solution 2. Solution 2 was then added dropwise to Solution 1 under continuous stirring. As the reaction progressed, the solution turned dark yellow, indicating the formation of silver nanoparticles. Stirring was continued for an additional 15 min to ensure the complete reduction of Ag+ to metallic silver.
The resulting silver nanoparticle dispersion exhibited a theoretical silver concentration of 73 mM, assuming complete reduction. The detailed chemical reaction and synthesis process is illustrated in Figure 9.

3.3. Impregnation of BCC with Silver Nanoparticles

The BCC was ground and sieved to obtain particle sizes between 0.5 and 0.8 mm, ensuring a uniform starting material for the impregnation process. A total of 3.00 g of BCC was mixed with 4.00 mL of the silver nanoparticle dispersion and 40 mL of 1-butanol in a flask. The mixture was stirred for 24 h using an orbital shaker, where the controlled circular motion promoted thorough wetting of the BCC and minimized bubble formation. This step was crucial to prevent pore blockage and ensure a uniform distribution of nanoparticles.
The volume of the nanoparticle dispersion was carefully calculated to achieve a silver content of 1 wt% relative to the BCC, corresponding to 30.0 mg of silver. After impregnation, the sample was dried in a ventilated oven to remove excess solvent, first at 40 °C for 24 h, followed by an additional drying step at 80 °C for 24 h, to ensure complete solvent evaporation.

3.4. Characterization Methods

A thermogravimetric analyzer (TGA 850, manufactured by Mettler Toledo, Columbus, OH, USA) was used to study the thermal decomposition of corncob feedstock and the stability of the resulting BCC, as well as to determine their proximate analysis. Prior to the experiments, the samples were dried overnight in a ventilated oven at 105 °C. Approximately 30 mg of each sample was precisely weighed and placed in an open-type alumina crucible (150 μL), which was then inserted into the TGA furnace. The temperature was ramped from room temperature to 900 °C at a rate of 10 °C/min under a continuous flow of nitrogen at 100 mL/min. Once the temperature reached 900 °C, it was held for 10 min before switching to a synthetic air atmosphere (100 mL/min) for an additional 60 min. The parameters and conditions used for characterizing the samples by X-ray fluorescence (using the PANalytical Zetium, manufactured by Malvern Panalytical, Almelo, The Netherlands), X-ray diffraction (XRD), and scanning electron microscopy (SEM) have been previously detailed in published papers [54,55]. For the TEM analysis, a JEOL ARM-200F microscope (JEOL Ltd., Tokyo, Japan) operating at 200 kV was used. The samples were prepared by depositing four drops of the suspension onto gold grids. Between each drop, the grids were allowed to dry under ambient conditions. Elemental analyses (CHONS, Cl) were conducted to determine the mass percentages of carbon (C), hydrogen (H), oxygen (O), nitrogen (N), sulfur (S), and chlorine (Cl) in both the corncob feedstock (CC) and the BCC. These analyses were subcontracted to Eurofins. The oxygen content was estimated via mass balance calculations.
To evaluate textural properties (specific surface area (SSA), pore volume, and pore size distribution), CO2 isotherms were employed. CO2 isotherms were performed on a Micromeritics ASAP2420 porosity analyzer at 273 K (0 °C). Isotherms were performed in the P/P° 0–0.03 range. This range was determined by taking into account the CO2 vapor pressure P° at 273.15 (26,141.72 mmHg or 3485.28 kPa) and the maximum device pressure (normal pressure or 760 mmHg or 101.5 kPa). CO2 adsorption is a special analysis for characterizing micropores (smaller than 1 nm). Specific surface area values were calculated using the Dubinin–Astakhov model. Pore size distributions were evaluated using the isothermal adsorption branch and Non-Local Density Functional Theory (NLDFT) model, specifically the NLDFT Carbon Slit Pore Model, which is well suited for microporous carbonaceous materials like biochar. This analysis was conducted using MicroActive software version 5.02, with the model selection based on minimizing the RMS error of fit and optimizing the distribution smoothness. Before measurements, both samples (BCC and Ag-BCC) were degassed overnight at 200 °C under a primary vacuum (1 µm Hg). Each sample was degassed again on the analysis pore at 200 °C for 2 h just before analysis to perfectly empty the porosity and enable the best detection of ultra-microporosity. Free volume determination was carried out for each sample with a separate analysis between the two degassing processes.

3.5. Adsorption Experiment

Nitrogen dioxide adsorption was carried out using a fixed-bed reactor (internal diameter of 16 mm and length of 600 mm). The bed temperature was measured by a thermocouple placed 1 mm above the surface of the biochar sample. BCC and Ag-BCC samples were placed on a fused silica frit (porosity 40–100 µm) inside a vertical quartz reactor (Figure 10). In each experiment, 0.25 g of sample was used, and the experiments were performed at different temperatures (22 °C, 100 °C, and 200 °C) until saturation was reached. Before each experiment, nitrogen (N2) was used to purge the system of remaining gases. Calibration procedures were carefully conducted before the experiments to ensure precise concentration measurements using a ROSEMOUNT NGA 2000 detector. During the experiment, a gas mixture containing 511 ppm of NO2 diluted in nitrogen was injected through the sample’s fixed-bed column. A constant gas flow rate of 50 NL/h was maintained using mass flow controllers (BROOKS 5850, Brooks Instrument, Hatfield, PA, USA). The concentrations of NO and NO2 in the outlet gases were monitored continuously and in real time using the highly sensitive ROSEMOUNT NGA 2000 detector (Emerson, Chanhassen, MN, USA). A blank experiment was performed using an empty reactor to account for potential background signals or interferences. To accurately reflect the NO2 adsorption behavior, the results of the blank experiment were subtracted from the sample measurements.
The amount of NO2 adsorbed on BCC and Ag-BCC was calculated according to Equations (4) and (5):
NO2 ads(t) (μmol/s) = ([NO2]inlet − ([NO2]outlet + [NO]outlet))×10−6 × F/VM
where NO2 ads(t) represents the rate of NO2 adsorption in µmol/s or the adsorption capacity of BCC and Ag-BCC (mg/g). [NO2]inlet is the inlet NO2 concentration (ppmv). [NO2]outlet and [NO]outlet are the outlet NO2 and NO concentrations (ppmv). F is the gas flow rate (NL/s). VM is the molar volume under normal conditions (22.4 L/mol).
NO2 ads (mg/g) = ʃ([NO2]ads (t) × 106 × M(NO2)/mBiochar) dt
where NO2 ads (mg/g) represents the adsorption capacity of NO2 in mg/g of biochar. [NO2]ads (t) is the adsorbed NO2 concentration over time (µmol/s). M(NO2) is the molar mass of NO2 (46,000 mg/mol) and mBiochar is the mass of biochar used in the adsorption experiment (g).

4. Conclusions

This study demonstrates the efficacy of BCC and Ag-BCC for NO2 adsorption and catalytic reduction under continuous-flow conditions. Ag-BCC exhibited a superior performance at 200 °C, achieving a NO2 adsorption capacity of 11.78 mg/g compared to BCC’s 11.04 mg/g, despite its lower surface area (345 m2/g vs. 402 m2/g). This enhancement is attributed to silver’s catalytic role, which facilitated the conversion of NO2 to NO, as evidenced by Ag-BCC’s higher NO/NO2 ratio (20% vs. 9% for BCC). Temperature-dependent studies revealed decreasing adsorption rate constants with rising temperatures, consistent with exothermic adsorption processes; however, Ag-BCC’s catalytic activity mitigated capacity loss at elevated temperatures, underlining its suitability for thermally dynamic applications. The adsorption kinetics, best described by the Dose–Response model, highlighted the synergy between biochar’s porous structure and silver’s redox functionality, enabling reactive adsorption that compensates for the reduced surface area. These findings position Ag-BCC as a sustainable, multifunctional material for industrial applications such as flue gas or vehicular emission control, where simultaneous adsorption and catalytic conversion are critical. Future efforts should focus on optimizing silver loading, biochar feedstock selection, and scalability while addressing practical challenges like long-term stability, regeneration cycles, and performance in humid or multicomponent gas streams. This work advances the development of engineered biochars as cost-effective, environmentally friendly solutions for air pollution mitigation, aligning with global sustainability objectives.

Author Contributions

Data collection, data curation, formal analysis, investigation, F.T. Writing—original draft, writing—review and editing, investigation, formal analysis, data curation, co-supervisor, M.Z. Conceptualization, writing—original draft, writing—review and editing, funding acquisition, validation, supervisor, F.F.C. Conceptualization, writing—original draft, writing—review and editing, validation, supervision, L.L. Conceptualization, writing—original draft, writing—review and editing, validation, supervision, J.B. All authors have read and agreed to the published version of the manuscript.

Funding

Fernanda F. Camilo and Flavia Tavares gratefully acknowledge the financial support provided by The São Paulo Research Foundation (FAPESP) (2021/08987-5) and Brazilian National Council for Scientific and Technological Development (CNPq) (grant number 310893/2021-6). Flavia Tavares gratefully acknowledges the financial support provided by the Coordination for the Improvement of Higher Education Personnel (CAPES) for their doctoral scholarship, as well as by an overseas scholarship (PDSE—Edital No. 44/2022—Selection 2023). The physicochemical characterizations were performed on the IS2M technical platforms. The authors are very grateful to L. Michelin (XRF and XRD), C. Vaulot (CO2 adsorption) and L. Josien (SEM) for their contributions.

Institutional Review Board Statement

Not applicable.

Informed Consent Statement

Not applicable.

Data Availability Statement

Data will be made available on request.

Conflicts of Interest

The authors declare no conflicts of interest.

References

  1. Gómez-García, M.A.; Pitchon, V.; Kiennemann, A. Pollution by nitrogen oxides: An approach to NOx abatement by using sorbing catalytic materials. Environ. Int. 2005, 31, 445–467. [Google Scholar] [CrossRef] [PubMed]
  2. Ebrahim, A.M.; Bandosz, T.J. Ce(III) Doped Zr-Based MOFs as Excellent NO2 Adsorbents at Ambient Conditions. ACS Appl. Mater. Interfaces 2013, 5, 10565–10573. [Google Scholar] [CrossRef] [PubMed]
  3. Wang, Y.; Wang, T.; Gu, Q.; Shang, J. Adsorption Removal of NO2 Under Low-Temperature and Low-Concentration Conditions: A Review of Adsorbents and Adsorption Mechanisms. Adv. Mater. 2025, 37, 2401623. [Google Scholar] [CrossRef] [PubMed]
  4. Bello, E.; Margarit, V.J.; Gallego, E.M.; Schuetze, F.; Hengst, C.; Corma, A.; Moliner, M. Deactivation and regeneration studies on Pd-containing medium pore zeolites as passive NOx adsorbers (PNAs) in cold-start applications. Microporous Mesoporous Mater. 2020, 302, 110222. [Google Scholar] [CrossRef]
  5. Han, L.; Cai, S.; Gao, M.; Hasegawa, J.; Wang, P.; Zhang, J.; Shi, L.; Zhang, D. Selective Catalytic Reduction of NOx with NH3 by Using Novel Catalysts: State of the Art and Future Prospects. Chem. Rev. 2019, 119, 10916–10976. [Google Scholar] [CrossRef]
  6. Han, X.; Yang, S.; Schröder, M. Porous metal–organic frameworks as emerging sorbents for clean air. Nat. Rev. Chem. 2019, 3, 108–118. [Google Scholar] [CrossRef]
  7. Martínez-Franco, R.; Moliner, M.; Thogersen, J.R.; Corma, A. Efficient One-Pot Preparation of Cu-SSZ-13 Materials using Cooperative OSDAs for their Catalytic Application in the SCR of NOx. ChemCatChem 2013, 5, 3316–3323. [Google Scholar] [CrossRef]
  8. Busca, G.; Lietti, L.; Ramis, G.; Berti, F. Chemical and mechanistic aspects of the selective catalytic reduction of NO by ammonia over oxide catalysts: A review. Appl. Catal. B Environ. 1998, 18, 1–36. [Google Scholar] [CrossRef]
  9. Shang, S.; Yang, C.; Tian, Y.; Tao, Z.; Smith, M.; Zhang, H.; Zhang, L.; Li, L.; Gu, Q.; Zhou, H.-C.; et al. Designing multivariate porphyrin-based metal-organic frameworks with Ni/Co dual-metal atom sites for cooperative NO2 capture and NO retention. Sep. Purif. Technol. 2023, 320, 124080. [Google Scholar] [CrossRef]
  10. Li, J.; Chang, H.; Ma, L.; Hao, J.; Yang, R.T. Low-temperature selective catalytic reduction of NOx with NH3 over metal oxide and zeolite catalysts—A review. Catal. Today 2011, 175, 147–156. [Google Scholar] [CrossRef]
  11. Levasseur, B.; Ebrahim, A.M.; Bandosz, T.J. Interactions of NO2 with Amine-Functionalized SBA-15: Effects of Synthesis Route. Langmuir 2012, 28, 5703–5714. [Google Scholar] [CrossRef] [PubMed]
  12. Chmielarz, L.; Jankowska, A. Mesoporous silica-based catalysts for selective catalytic reduction of NOx with ammonia—Recent advances. Adv. Inorg. Chem. 2022, 79, 209–245. [Google Scholar]
  13. Huang, G.; Yang, J.; Lv, C.; Li, D.; Fang, D. Research progress of NH3-SCR over carbon-based catalysts for NOx removal. J. Environ. Chem. Eng. 2023, 11, 110966. [Google Scholar] [CrossRef]
  14. Shirahama, N.; Moon, S.; Choi, K.-H.; Enjoji, T.; Kawano, S.; Korai, Y.; Tanoura, M.; Mochida, I. Mechanistic study on adsorption and reduction of NO2 over activated carbon fibers. Carbon 2002, 40, 2605–2611. [Google Scholar] [CrossRef]
  15. Jeguirim, M.; Belhachemi, M.; Limousy, L.; Bennici, S. Adsorption/reduction of nitrogen dioxide on activated carbons: Textural properties versus surface chemistry—A review. Chem. Eng. J. 2018, 347, 493–504. [Google Scholar] [CrossRef]
  16. Ebrahim, A.M.; Bandosz, T.J. Effect of amine type on acidic toxic gas adsorption at ambient conditions on modified CuBTC. J. Environ. Chem. Eng. 2022, 10, 107261. [Google Scholar] [CrossRef]
  17. Sun, J.; Gao, W.; Fei, H.; Zhao, G. Efficient and selective electrochemical reduction of nitrate to N2 by relay catalytic effects of Fe-Ni bimetallic sites on MOF-derived structure. Appl. Catal. B Environ. 2022, 301, 120829. [Google Scholar] [CrossRef]
  18. Khan, S.; Wasfi, A.; Mushtaq, M.; Awwad, F.; Tit, N.M. Transition-Metal Single Atom Catalyst Embedded in C2n for Toxic-Gas Reduction Reaction and Selective Gas-Sensing Application: Atomic-Scale Study. SSRN Electron. J. 2022, 599, 154037. [Google Scholar] [CrossRef]
  19. Sunil Kumar, M.; Alphin, M.S.; Senthil Kumar, P.; Raja, S. A review on zeolite catalyst for deNOx performance in ammonia–selective catalytic reduction. Fuel 2023, 334, 126828. [Google Scholar] [CrossRef]
  20. Ko, S.; Gao, F.; Yao, X.; Yi, H.; Tang, X.; Wang, C.; Liu, H.; Luo, N.; Qi, Z. Synthesis of metal–organic frameworks (MOFs) and their application in the selective catalytic reduction of NOx with NH3. New J. Chem. 2022, 46, 15758–15775. [Google Scholar] [CrossRef]
  21. Ji, W.; Yang, F.; Sun, J.; Xu, R.; Li, P.; Jing, L. Improved Performance of g-C3N4 for Optoelectronic Detection of NO2 Gas by Coupling Metal–Organic Framework Nanosheets with Coordinatively Unsaturated Ni(II) Sites. ACS Appl. Mater. Interfaces 2023, 15, 11961–11969. [Google Scholar] [CrossRef] [PubMed]
  22. Wang, Z.; Sheveleva, A.M.; Lee, D.; Chen, Y.; Iuga, D.; Franks, W.T.; Ma, Y.; Li, J.; Li, L.; Cheng, Y.; et al. Modulation of Uptake and Reactivity of Nitrogen Dioxide in Metal-Organic Framework Materials. Angew. Chemie 2023, 135, e202302602. [Google Scholar] [CrossRef]
  23. Wang, X.; Li, K.; Liang, G.; Zhao, Y.; Su, R.; Luan, Z.; Li, L.; Xi, H. Amino-modified zirconia aerogels for the efficient filtration of NO2: Effects of water on the removal mechanisms. Environ. Sci. Nano 2021, 8, 3722–3734. [Google Scholar] [CrossRef]
  24. Shang, S.; Wen, C.; Yang, C.; Tian, Y.; Wang, C.; Shang, J. The low-temperature NO2 removal by tailoring metal node in porphyrin-based metal-organic frameworks. Sci. Total Environ. 2021, 801, 149710. [Google Scholar] [CrossRef]
  25. Lee, J.; Kim, K.-H.; Kwon, E.E. Biochar as a Catalyst. Renew. Sustain. Energy Rev. 2017, 77, 70–79. [Google Scholar] [CrossRef]
  26. Drané, M.; Zbair, M.; Hajjar-Garreau, S.; Josien, L.; Michelin, L.; Bennici, S.; Limousy, L. Unveiling the Potential of Corn Cob Biochar: Analysis of Microstructure and Composition with Emphasis on Interaction with NO2. Materials 2023, 17, 159. [Google Scholar] [CrossRef]
  27. Zbair, M.; Drané, M.; Limousy, L. NO2 Adsorption on Biochar Derived from Wood Shaving Litter: Understanding Surface Chemistry and Adsorption Mechanisms. Clean Technol. 2024, 6, 973–993. [Google Scholar] [CrossRef]
  28. Seredych, M.; Bashkova, S.; Pietrzak, R.; Bandosz, T.J. Interactions of NO2 and NO with Carbonaceous Adsorbents Containing Silver Nanoparticles. Langmuir 2010, 26, 9457–9464. [Google Scholar] [CrossRef]
  29. Illan-Gomez, M.J.; Linares-Solano, A.; Radovic, L.R.; Salinas-Martinez de Lecea, C. NO Reduction by Activated Carbons. 5. Catalytic Effect of Iron. Energy Fuels 1995, 9, 540–548. [Google Scholar] [CrossRef]
  30. Carabineiro, S.A.; Brás Fernandes, F.; Ramos, A.M.; Vital, J.; Silva, I.F. Vanadium as a catalyst for NO, N2O and CO2 reaction with activated carbon. Catal. Today 2000, 57, 305–312. [Google Scholar] [CrossRef]
  31. Li, M.; Guo, Y.; Yang, J. Spatially Nanoconfined Architectures: A Promising Design for Selective Catalytic Reduction of NOx. ChemCatChem 2020, 12, 5599–5610. [Google Scholar] [CrossRef]
  32. Shariff, A.; Mohamad Aziz, N.S.; Ismail, N.I.; Abdullah, N. Corn Cob as a Potential Feedstock for Slow Pyrolysis of Biomass. J. Phys. Sci. 2016, 27, 123–137. [Google Scholar] [CrossRef]
  33. Tomczyk, A.; Sokołowska, Z.; Boguta, P. Biochar physicochemical properties: Pyrolysis temperature and feedstock kind effects. Rev. Environ. Sci. Bio/Technol. 2020, 19, 191–215. [Google Scholar] [CrossRef]
  34. Zbair, M.; Ainassaari, K.; Drif, A.; Ojala, S.; Bottlinger, M.; Pirilä, M.; Keiski, R.L.; Bensitel, M.; Brahmi, R. Toward new benchmark adsorbents: Preparation and characterization of activated carbon from argan nut shell for bisphenol A removal. Environ. Sci. Pollut. Res. 2018, 25, 1869–1882. [Google Scholar] [CrossRef] [PubMed]
  35. Skreiberg, A.; Skreiberg, Ø.; Sandquist, J.; Sørum, L. TGA and macro-TGA characterisation of biomass fuels and fuel mixtures. Fuel 2011, 90, 2182–2197. [Google Scholar] [CrossRef]
  36. Frikha, K.; Limousy, L.; Arif, M.B.; Thevenin, N.; Ruidavets, L.; Zbair, M.; Bennici, S. Exhausted Grape Marc Derived Biochars: Effect of Pyrolysis Temperature on the Yield and Quality of Biochar for Soil Amendment. Sustainability 2021, 13, 11187. [Google Scholar] [CrossRef]
  37. Al-Wabel, M.I.; Al-Omran, A.; El-Naggar, A.H.; Nadeem, M.; Usman, A.R.A. Pyrolysis temperature induced changes in characteristics and chemical composition of biochar produced from conocarpus wastes. Bioresour. Technol. 2013, 131, 374–379. [Google Scholar] [CrossRef]
  38. Mo, Z.; Shi, Q.; Zeng, H.; Lu, Z.; Bi, J.; Zhang, H.; Rinklebe, J.; Lima, E.C.; Rashid, A.; Shahab, A. Efficient removal of Cd(II) from aqueous environment by potassium permanganate-modified eucalyptus biochar. Biomass Convers. Biorefinery 2024, 14, 77–89. [Google Scholar] [CrossRef]
  39. Bashkova, S.; Bandosz, T.J. Adsorption/Reduction of NO2 on Graphite Oxide/Iron Composites. Ind. Eng. Chem. Res. 2009, 48, 10884–10891. [Google Scholar] [CrossRef]
  40. Pietrzak, R. Active Carbons Obtained from Bituminous Coal for NO2 Removal under Dry and Wet Conditions at Room Temperature. Energy Fuels 2009, 23, 3617–3624. [Google Scholar] [CrossRef]
  41. Levasseur, B.; Gonzalez-Lopez, E.; Rossin, J.A.; Bandosz, T.J. Effect of Reduction Treatment on Copper Modified Activated Carbons on NOx Adsorption at Room Temperature. Langmuir 2011, 27, 5354–5365. [Google Scholar] [CrossRef] [PubMed]
  42. Bashkova, S.; Bandosz, T.J. The effects of urea modification and heat treatment on the process of NO2 removal by wood-based activated carbon. J. Colloid Interface Sci. 2009, 333, 97–103. [Google Scholar] [CrossRef] [PubMed]
  43. Ligero, A.; Calero, M.; Martín-Lara, M.Á.; Blázquez, G.; Solís, R.R.; Pérez, A. Fixed-bed CO2 adsorption onto activated char from the pyrolysis of a non-recyclable plastic mixture from real urban residues. J. CO2 Util. 2023, 73, 102517. [Google Scholar] [CrossRef]
  44. Chu, K.H. Breakthrough curve analysis by simplistic models of fixed bed adsorption: In defense of the century-old Bohart-Adams model. Chem. Eng. J. 2020, 380, 122513. [Google Scholar] [CrossRef]
  45. Bohart, G.S.; Adams, E.Q. Some aspects of the behavior of charcoal with respect to chlorine. J. Am. Chem. Soc. 1920, 42, 523–544. [Google Scholar] [CrossRef]
  46. Clark, R.M. Evaluating the cost and performance of field-scale granular activated carbon systems. Environ. Sci. Technol. 1987, 21, 573–580. [Google Scholar] [CrossRef]
  47. Hu, Q.; Xie, Y.; Zhang, Z. Modification of breakthrough models in a continuous-flow fixed-bed column: Mathematical characteristics of breakthrough curves and rate profiles. Sep. Purif. Technol. 2020, 238, 116399. [Google Scholar] [CrossRef]
  48. Kagawa, S.; Furukawa, H.; Iwamoto, M. Reaction of silver(I) oxide with nitrogen monoxide. J. Chem. Soc. Dalt. Trans. 1979, 74–78. [Google Scholar] [CrossRef]
  49. Sun, M.; Hanif, A.; Wang, T.; Gu, Q.; Shang, J. Ambient temperature NO2 removal by reversible NO2 adsorption on copper-based metal-organic frameworks (MOFs)-derived nanoporous adsorbents. Sep. Purif. Technol. 2023, 314, 123563. [Google Scholar] [CrossRef]
  50. Yang, M.; Xia, J.J. Preparation and Characterization of Platinum Nanorods Using Ascorbic Acid as the Reducing Agent. Adv. Mater. Res. 2013, 774–776, 577–580. [Google Scholar] [CrossRef]
  51. Kimling, J.; Maier, M.; Okenve, B.; Kotaidis, V.; Ballot, H.; Plech, A. Turkevich Method for Gold Nanoparticle Synthesis Revisited. J. Phys. Chem. B 2006, 110, 15700–15707. [Google Scholar] [CrossRef] [PubMed]
  52. García-Barrasa, J.; López-de-Luzuriaga, J.; Monge, M. Silver nanoparticles: Synthesis through chemical methods in solution and biomedical applications. Open Chem. 2011, 9, 7–19. [Google Scholar] [CrossRef]
  53. Huang, Z.Y.; Mills, G.; Hajek, B. Spontaneous formation of silver particles in basic 2-propanol. J. Phys. Chem. 1993, 97, 11542–11550. [Google Scholar] [CrossRef]
  54. Nguyen, M.H.; Zbair, M.; Dutournié, P.; Bennici, S. Thermochemical sorption heat storage: Investigate the heat released from activated carbon beads used as porous host matrix for MgSO4 salt. J. Energy Storage 2023, 59, 106452. [Google Scholar] [CrossRef]
  55. Nguyen, M.H.; Zbair, M.; Dutournié, P.; Gervasini, A.; Vaulot, C.; Bennici, S. Toward new low-temperature thermochemical heat storage materials: Investigation of hydration/dehydration behaviors of MgSO4/Hydroxyapatite composite. Sol. Energy Mater. Sol. Cells 2022, 240, 111696. [Google Scholar] [CrossRef]
Figure 1. TG and DTG curves of (a) corncob (CC) feedstock and (b) BCC biochar produced at 600 °C.
Catalysts 15 00392 g001
Figure 2. (a) TEM image for the sample of AgNP. (b) Particle size histogram for silver nanoparticles.
Catalysts 15 00392 g002
Figure 3. (a) Adsorption–desorption isotherms of CO2 at 0 °C and (b) pore width distribution.
Catalysts 15 00392 g003
Figure 4. SEM images of BCC and Ag-BCC samples.
Catalysts 15 00392 g004
Figure 5. XRD patterns of BCC and Ag-BCC.
Catalysts 15 00392 g005
Figure 6. Adsorption and reduction evolution of NO2 by BCC and Ag-BCC samples.
Catalysts 15 00392 g006
Figure 7. (a) NO2 adsorption capacities and distribution of (b) NO and NO2 percentages versus temperatures.
Catalysts 15 00392 g007
Figure 8. Model fitting of NO2 adsorption breakthrough curves: Clark, B-A, and D-R models.
Catalysts 15 00392 g008
Figure 9. General scheme to prepare AgNp in 1-butanol.
Catalysts 15 00392 g009
Figure 10. Schematic diagram of the NO2 adsorption and reduction setup.
Catalysts 15 00392 g010
Table 1. Proximate analyses of prepared BCC from corn cobs.
Proximate Analysis (wt.%, Wet Basis)
HumidityVM *FC **Ash
CC4.1075.6918.811.40
BCC2.039.9083.055.02
* Volatile material. ** Fixed carbon.
Table 2. CHONS analysis (wt.%, dry basis).
ElementCCBCCAg-BCC
C48.0087.3093
H6.041.82-
O43.002.641.66
N0.770.86-
S0.130.130.07
Table 3. Mineral composition (wt.%, dry basis).
ElementCCBCCAg-BCC
Mg0.0510.3810.213
Al0.0510.1010.106
Si0.6611.1490.432
P0.1080.3670.139
Na0.0150.0890.066
Cl0.2491.1410.715
K0.8263.8042.527
Ca0.0570.1110.063
Fe0.0320.0840.039
Zn0.0030.0110.019
Br0.0020.006-
Ag--0.945
Table 4. Clark model parameters.
SampleAr (1/min)nR2Reduced Chi-Sqr
BCC-22 °C1.61 × 101431.44220.870.9830.001
BCC-100 °C2.47 × 101329.18418.2880.9880.001
BCC-200 °C7.55 × 101125.62617.9030.9920.001
Ag-BCC-22 °C1.62 × 101534.13220.6520.9740.003
Ag-BCC-100 °C6.14 × 10921.36614.5100.9820.002
Ag-BCC-200 °C4.34 × 10920.40514.4660.9890.001
Table 5. B-A model parameters.
SampleN0 (mg/cm3)KBA (cm3/mg.min)R2Reduced Chi-Sqr
BCC-22 °C5641.2890.9110.008
BCC-100 °C6481.2970.9110.008
BCC-200 °C8140.7290.9470.003
Ag-BCC-22 °C4211.7640.8960.010
Ag-BCC-100 °C5351.3520.9070.009
Ag-BCC-200 °C7821.0670.9310.007
Table 6. Dose–Response model parameters.
SampleKDR (1/min)sR2Reduced Chi-Sqr
BCC-22 °C0.4411.5840.9840.008
BCC-100 °C0.3671.7060.9890.001
BCC-200 °C0.3151.5530.9940.001
Ag-BCC-22 °C0.5921.7180.9750.002
Ag-BCC-100 °C0.4651.5800.9840.001
Ag-BCC-200 °C0.3001.5660.9920.001
Disclaimer/Publisher’s Note: The statements, opinions and data contained in all publications are solely those of the individual author(s) and contributor(s) and not of MDPI and/or the editor(s). MDPI and/or the editor(s) disclaim responsibility for any injury to people or property resulting from any ideas, methods, instructions or products referred to in the content.

