Article

Effects of the Intrinsic Structures of Graphite Felt and Carbon Cloth on the Working Condition of Iron-Chromium Redox Flow Batteries

1
School of Textile and Material Engineering, Dalian Polytechnic University, Dalian 116034, China
2
School of Electrical Engineering and Automation, Harbin Institute of Technology, Harbin 150006, China
*
Author to whom correspondence should be addressed.
These authors contributed equally to this work.
Catalysts 2025, 15(4), 399; https://doi.org/10.3390/catal15040399
Submission received: 20 March 2025 / Revised: 7 April 2025 / Accepted: 15 April 2025 / Published: 19 April 2025
(This article belongs to the Section Catalytic Materials)

Abstract

:
The design parameters of large-scale iron-chromium redox flow batteries (ICRFB) encompass a wide range of internal and external operational conditions, including electrodes, membranes, flow rate, and temperature, among others. Among these factors, the intrinsic structures of graphite felt (GF) and carbon cloth (CC) play a pivotal role in determining the overall working conditions of ICRFBs. This study systematically investigates the multifaceted relationship between the intrinsic structure of the GF and CC and their impact on the operational performance of ICRFBs. The fundamental difference between the two types of electrodes lies in the intrinsic structure space available in them for electrolyte penetration. A systematic analysis of the structure–activity relation between the electrodes and the initial internal resistance, as well as the operating temperature of the cell, was performed. Additionally, the influence of the electrode structure on critical parameters, including the flow rate, membrane selection (Nafion 212 and Nafion 115), and performance of electrodeposition catalysts (bismuth and indium), is examined in detail. Under varying operating conditions, the intrinsic structures of GF and CC turn out to be a crucial factor, providing a robust basis for electrode selection and performance optimization in large-scale ICRFB systems.

1. Introduction

In recent years, significant progress has been made in the research and development of renewable energy systems, such as wind, sea-wave, and solar energy systems. However, the intermittent and variable nature of these energy sources highlights the need for large-scale energy storage systems to ensure stable and reliable energy supplies. Redox flow batteries (RFBs) are among the various popular electrochemical energy storage technologies that are available because of their low cost, abundant raw materials, exceptional flexibility, and substantial energy storage capacity. Notably, RFBs are extremely safe and offer an extended service life, making them ideal for large-scale energy storage applications [1,2,3]. Among the various types of RFBs, the iron-chromium redox flow battery (ICRFB) has emerged as one of the most promising systems and has already achieved commercial deployment [4,5].
Figure 1 illustrates the architecture of an ICRFB, highlighting key components such as the electrolyte, electrodes, and membranes. Additionally, the inclusion of a temperature control system is essential to enhancing the battery’s cathode reactivity and to mitigate electrolyte aging [6]. During operation, the electrolyte is circulated by a pump, moving both inside and outside the electrodes. This circulation facilitates electrochemical reactions on the electrode surfaces (as described in Equations (1) and (2)), enabling the conversion between chemical and electrical energy. To ensure optimal performance, the electrodes must meet stringent requirements such as elevated electrochemical activity, exceptional stability, and efficient dynamic permeability. As a result, graphite felt (GF) and carbon cloth (CC), both featuring porous structures, have become the most widely used electrode materials in ICRFBs [7,8].
Positive   side :   F e 3 + + e charge / discharge Fe 2 +   E 0 = 0.77   V   ( v s . S H E )
Negative   side :   Cr 2 + + e charge / discharge Cr 3 +   E 0 = 0.41   V   ( v s . S H E )
Building on the importance of electrode materials, recent studies have focused on accelerating the electrode reactions in ICRFBs, with particular emphasis on the modifications of GFs and CCs. Notably, the introduction of oxygen- and nitrogen-containing functional groups onto their surfaces has been demonstrated to significantly improve both their wettability and electrocatalytic activity [9,10]. Furthermore, addressing the challenges posed by the low reactivity of chromium and hydrogen evolution side reactions, substantial research has been directed toward the development of advanced catalysts, including bismuth (Bi), lead (Pb), and indium (In), through electro-deposition techniques [11,12,13]. The field has witnessed remarkable progress with the emergence of nanoscale and atomic-scale metal catalysts, which have substantially boosted the electrochemical activity of electrodes [14,15]. It is noteworthy that the synthesis and practical application of these catalysts are intrinsically linked to the internal architecture of the electrodes that are used, especially when employing the in situ electro-deposition methodology [16].
To achieve a more homogeneous and stable flow field, researchers have extensively explored methods to enhance the internal spatial structure of GFs and CCs. Firstly, the compression ratio of the electrode has been identified as a critical parameter that significantly influences both the battery resistance and its mass transfer characteristics [17]. For deeply porous GFs, increasing the compression ratio reduces the battery resistance but complicates the mass transfer, highlighting the need for an optimal balance. Despite the thinner CC possessing relatively low ohmic resistance, which facilitates enhanced electron conduction, its limited deformability under compression leads to increased contact resistance [18]. Thus, an optimal compression ratio can effectively balance the trade-off between ohmic resistance and electrochemical reactions [19,20]. Secondly, the flow rate of the electrolyte within the electrode is a significant factor that directly influences the battery performance [21]. Increasing the flow rate generally results in an adequate supply of electrolyte within the electrodes and accelerates the transport of reaction products from the electrodes, thus mitigating the concentration polarization. This phenomenon is also closely associated with the operating temperature of the battery [22]. Ye et al. also proposed that the bubbles trapped in the electrolyte would lead to flow blockage, consequently diminishing the flow rate and ultimately aggravating the bubble accumulation [23,24]. To address these challenges, researchers have designed and simulated various flow field configurations. From traditional designs such as serpentine and interdigitated flow fields to advanced network models that are capable of precisely identifying flow dead zones, these innovations have significantly improved the uniform distribution of reactants by optimizing both the planar flow field and the local depth of the flow channels [25,26,27]. Sun et al. applied localized ultrasonic waves to the bipolar plates that are external to the cell, which effectively mitigated the concentration polarization inside the cell. An ultrasonic wave frequency of 1 MHz has the potential to enhance the energy efficiency of the cell by approximately 2.9% [28].
To date, most studies have focused on controlling the electrolyte flow environment within the electrodes by regulating the external conditions using the aforementioned methods. Indeed, the intrinsic microstructure of GFs and CCs exerts a substantial influence on the mass transfer in the electrolyte. Zhou et al. proposed that the mass transfer behavior in electrodes involves two distinct mechanisms: surface mass transfer and pore mass transfer [29]. (I) The strategies to enhance surface mass transfer primarily focus on surface modifications, including etching holes, attaching catalysts, and growing nanocarbon fibers or carbon nanotubes via vapor phase growth on the surfaces of fibers [30,31,32]. Notably, certain metal catalysts not only improve the surface reactivity but also effectively suppress the hydrogen evolution side reaction [33]. (II) Enhancing the pore mass transfer mainly entails modifying the fiber configuration to optimize the interstitial structures between fibers. Typically, GFs exhibit a disordered pore structure, whereas CCs possess an ordered flow space characterized by an interwoven warp and weft configuration [34]. Sun et al. utilized electrospinning technology to refine the internal structure of carbon fiber electrodes [35]. Their work demonstrated that an optimized disordered carbon felt structure could comprise approximately 60% large fibers (~10 μm diameter) and 40% tiny fibers (~1 μm diameter). In this configuration, the smaller fibers provide a larger reactive surface area, while the larger fibers enhance the structure’s permeability. Furthermore, in oriented carbon fiber electrodes with an average diameter of ~10 μm, aligning the fibers perpendicular to the flow field direction significantly reduces the diffusion resistance and improves the uniformity of the flow distribution.
However, the engineering design complexity of RFBs often impedes the optimal performance of the electrode materials that are used [36]. Optimizing the operating conditions in lab-scale single cells is insufficient for evaluating electrodes that are intended for large-scale battery stacks [18]. The scalability of RFBs is influenced by the type of flow field that is employed; specifically, the choice is between flow-through configurations (using GFs) and flow-by configurations (typically utilizing CCs) [36]. In fact, the use of a twill-structured CC results in higher ohmic polarization losses, yet exhibits lower electrochemical polarization losses compared to herringbone-structured CCs. Additionally, GFs with varying thicknesses have contrasting effects on the electrochemical polarization, ohmic polarization, and concentration polarization losses [18]. Consequently, a comprehensive understanding of how the intrinsic structure of GFs and CCs affects the performance of batteries is crucial for defining the geometric dimensions of ICRFBs. The working conditions under consideration should encompass both external factors such as the operating temperature and flow rate and internal factors including separators and catalysts [37,38,39].
In summary, this study highlights the critical role of the intrinsic structures of electrodes, such as GF and CC, in determining the performance of ICRFBs under varying operating conditions. By elucidating the interplay between the electrode structure, flow rate, and catalytic activity, this work provides valuable insights for optimizing large-scale ICRFB applications.

2. Results and Discussion

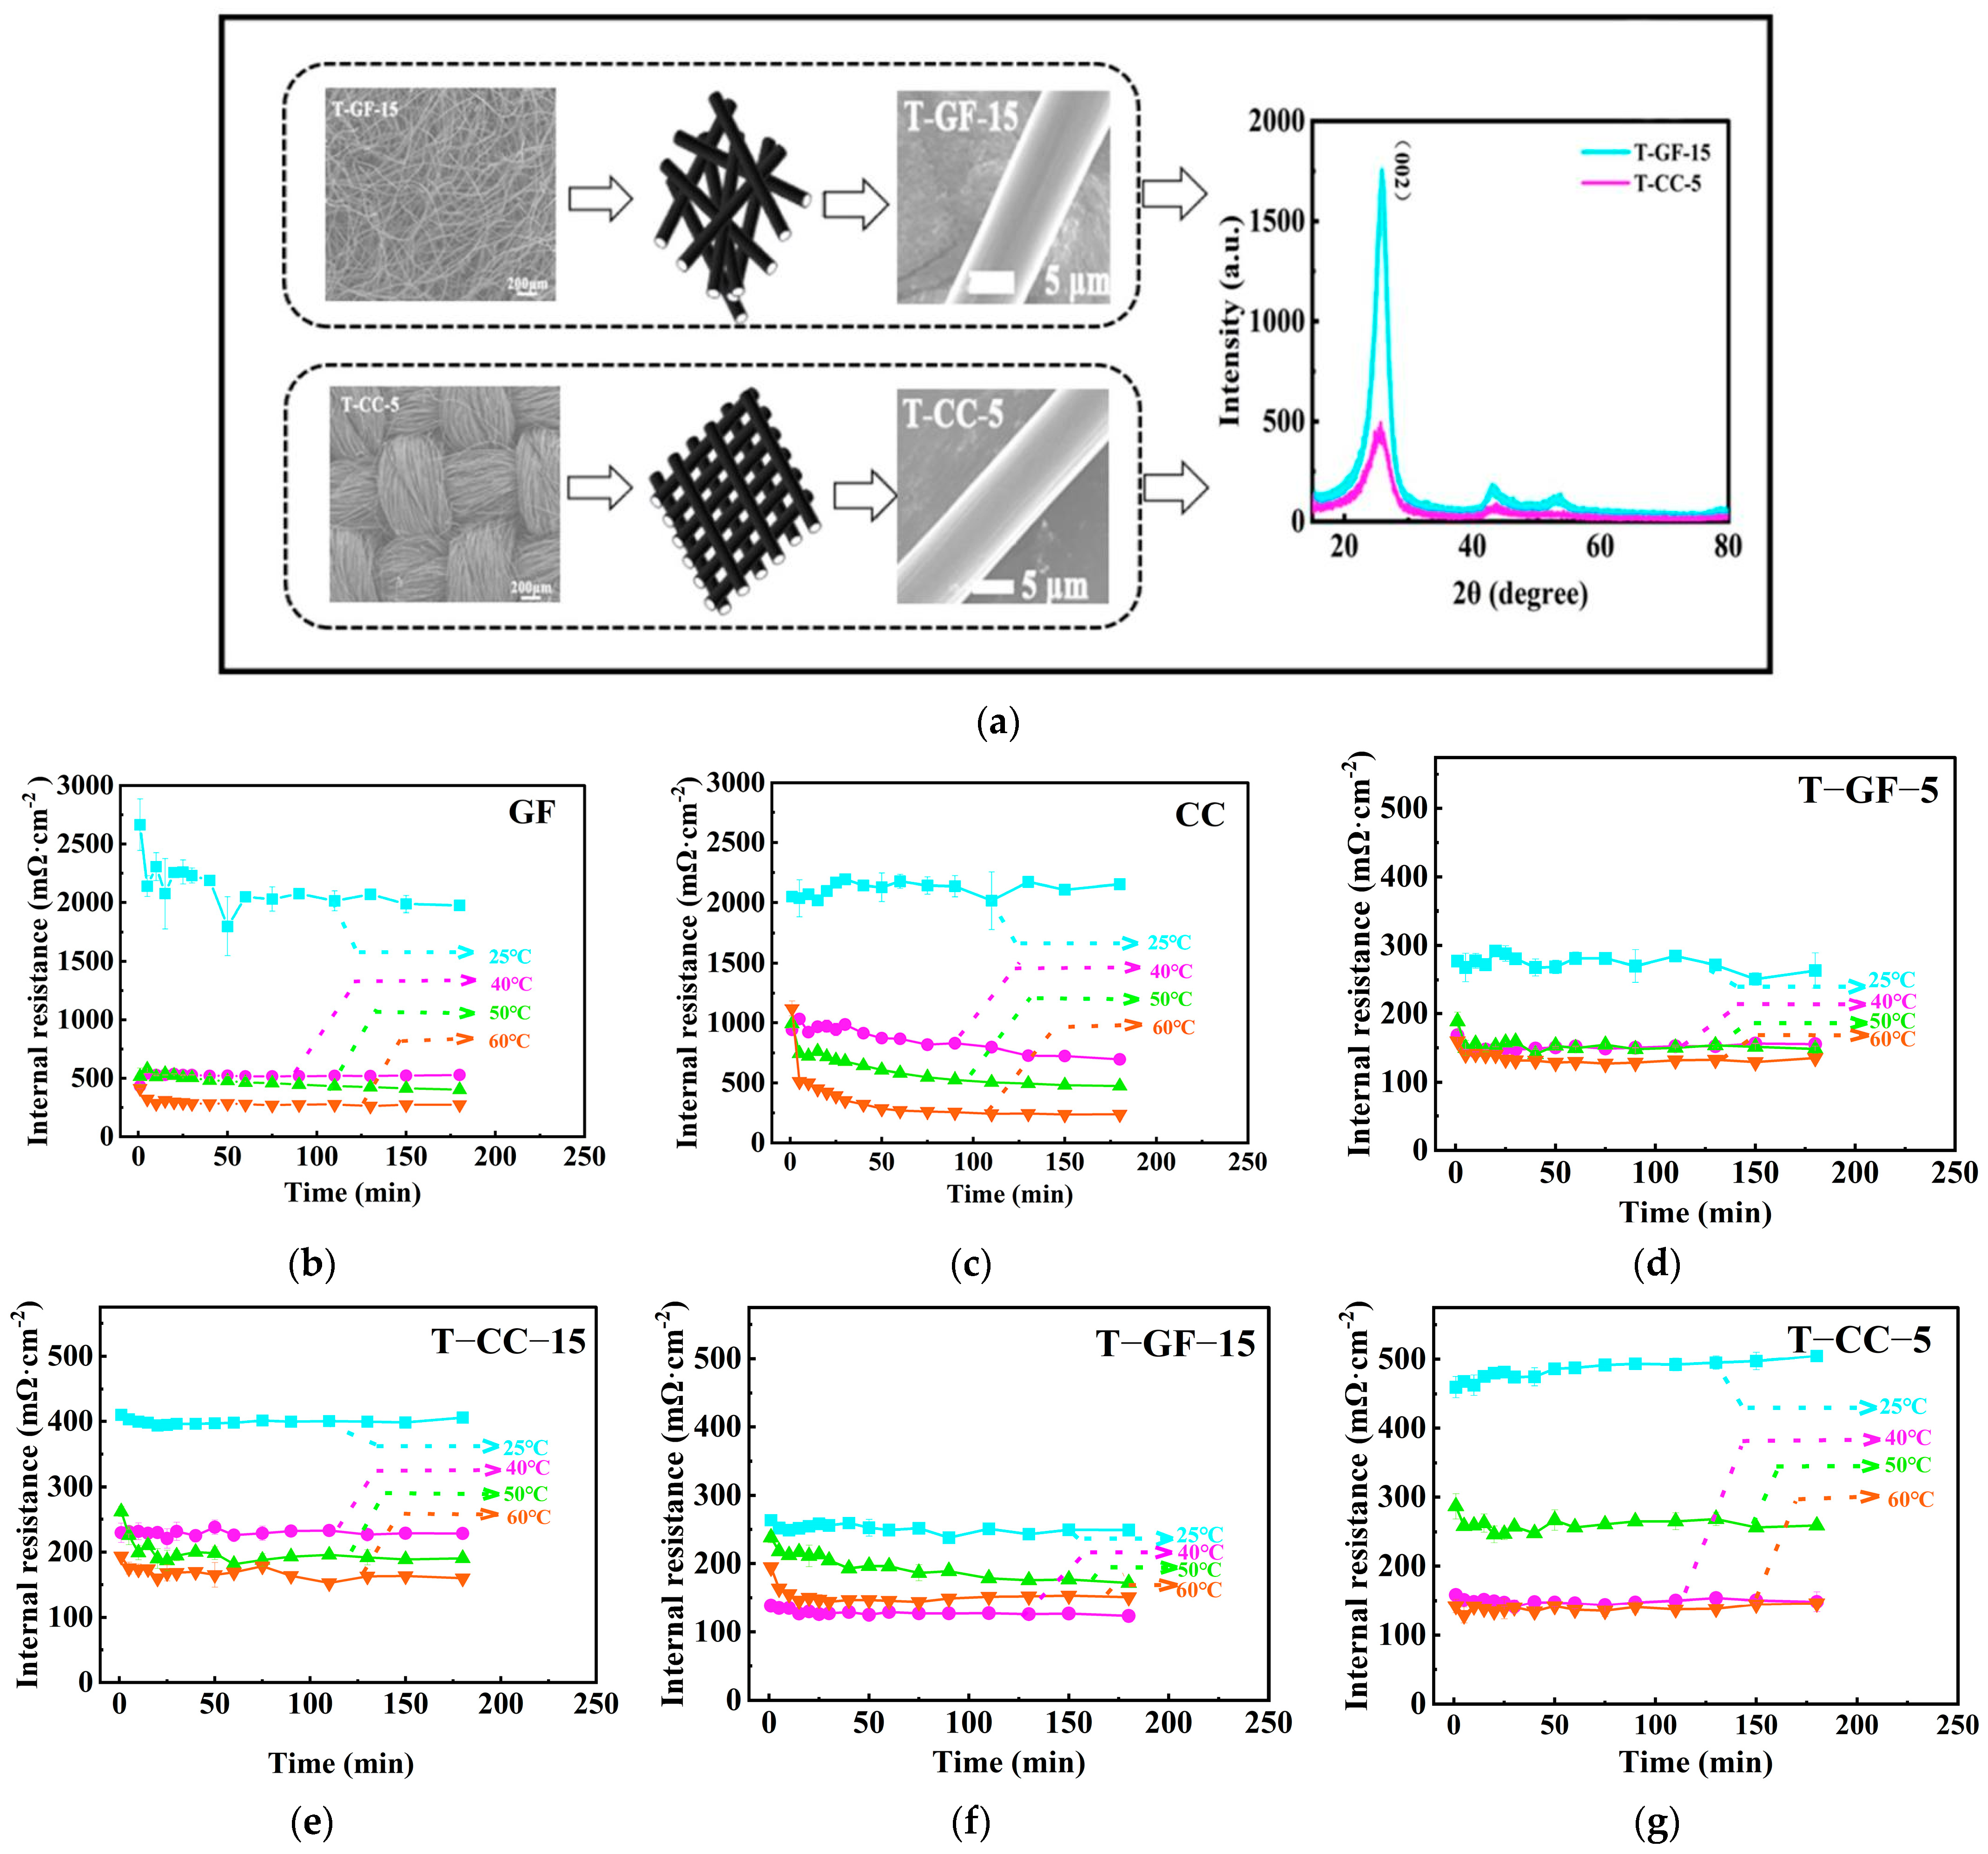
2.1. Initial Cell Resistance

The initial cell resistance is primarily governed by the ohmic and contact resistances of key components, including the electrodes, membranes, electrolyte, and current collectors [20]. The conductivity of the studied electrolyte was measured at various temperatures: 14.25 mS/cm (25 °C), 12.97 mS/cm (40 °C), 11.51 mS/cm (50 °C), and 11.27 mS/cm (60 °C). These measurements show that the ohmic resistance of the electrolyte decreases with an increasing temperature. As shown in Figure 2a, T−GF−15 and T−CC−5 exhibit distinct structural differences. T−GF−15 features disordered voids between its fibers, while T−CC−5 has a more ordered but smaller void structure. Additionally, the fibers in T−GF−15 are slightly thicker than those in T−CC−5, implying a higher fiber density in T−CC−5. BET analysis supports this observation, revealing a larger specific surface area for T−CC−5 (2.68 m2/g) compared to T−GF−15 (1.84 m2/g). However, XRD results indicate that T−GF−15 has a stronger (0 0 2) diffraction peak, reflecting a higher degree of graphitization [40]. Despite these differences, the precompression ohmic resistance of both the GF and CC is nearly identical, approximately 1.6–2 Ω/cm. This similarity may be attributed to the higher density and larger contact area of the CC, which compensates for its lower degree of graphitization. Consequently, under the same compression ratio, the ohmic resistance of CC is expected to be lower than that of GF [18]. Therefore, when evaluating the initial cell resistances, priority should be given to the changes in contact resistance [20].
The batteries were assembled using graphite felts (GF, T−GF−5, T−GF−15) and carbon cloths (CC, T−CC−5, T−CC−15) as electrodes, with Nafion 115 serving as the membrane. The initial resistance of each battery was evaluated at various temperatures (25 °C, 40 °C, 50 °C, 60 °C) under a constant flow rate of 90 mL/min. Figure 2b–f shows the temporal variations in the initial cell resistances. At 25 °C, both the GF and CC electrodes exhibited relatively steep initial resistances, as seen in Figure 2b,c. At the onset of testing, the internal resistance of the GF-based battery reached 2664.4 mΩ·cm2. As the electrolyte circulation progressed, the internal resistance initially decreased sharply before stabilizing due to improved wetting of the electrode by the electrolyte, ultimately averaging 1975 mΩ·cm2. In contrast, the CC-based battery demonstrated relatively stable internal resistance throughout the test period, with an average initial internal resistance of 2152.5 mΩ·cm2 after 180 min of electrolyte circulation. With an increasing ambient temperature, the internal cell resistance behavior diverges between the two electrode types. At 40 °C and 50 °C, the initial resistance of the GF-based battery significantly decreased compared to at 25 °C, but the reduction was less pronounced than at lower temperatures, averaging 539.6 mΩ·cm2 at 40 °C and 577.9 mΩ·cm2 at 50 °C. When the temperature reached 60 °C, the initial cell resistance dropped to its lowest value of approximately 275 mΩ·cm2 (see Figure 2b). Similarly, the initial resistance of the CC-based battery decreased with an increasing temperature, although it was more sensitive to temperature changes. The average initial resistances for the CC-based battery were 695.8 mΩ·cm2 at 40 °C, 473.65 mΩ·cm2 at 50 °C, and 239 mΩ·cm2 at 60 °C (see Figure 2c).
It is evident that the initial resistance of batteries made with GF and CC at 25 °C and 60 °C does not exhibit significant differences after a sufficient circulation period of the electrolyte. However, discrepancies are observed at 40 °C and 50 °C, where the initial resistance of the battery made with GF is consistently lower. This indicates that, although the thinner CC exhibits a lower ohmic resistance than the GF, the higher porosity of the GF allows it to absorb additional electrolyte. Consequently, this reduces the contact resistance and equalizes the initial cell resistance between the two types of batteries at 25 °C. At 40 °C and 50 °C, the decrease in electrolyte ohmic resistance further reduces the initial resistance for both the GF- and CC-based batteries. Nevertheless, the initial cell resistance remains lower in the GF-based cells at these temperatures, indicating that the superior wetting effect of the electrolyte within the porous electrode is more effective in reducing the contact resistance. It is worth noting that the contact resistance at this juncture constitutes a substantial fraction of the overall initial cell resistance. However, at 60 °C, the enhanced conductivity of the electrolyte diminishes the contribution of the contact resistance, leading to a convergence in the initial internal resistance of both batteries.
After thermal oxidation, the initial cell resistances of T−GF−5 and T−GF−15 were significantly lower than those of the untreated GF, as shown in Figure 2d,f. This reduction is attributed to improved electrode hydrophilicity and reduced contact resistance between the electrode and electrolyte. Notably, T−GF−15 exhibited lower initial resistance than T−GF−5 at both 25 °C and 40 °C, likely due to its higher density of surface functional groups and reduced graphitization degree [41]. Consequently, the improved hydrophilicity of T−GF−5 and T−GF−15 leads to lower initial cell resistances at these temperatures. However, the initial resistance of the battery made with T−GF−15 increases compared to that made with T−GF−5 at 50 °C and 60 °C. Notably, at 50 °C, the average initial resistance of the battery made with T−GF−5 is 150 mΩ·cm2, whereas it rises to 180 mΩ·cm2 for the T−GF−15 battery. These findings suggest that the elevated conductivity of the electrolyte at higher temperatures causes the initial cell resistance to approach the intrinsic ohmic resistance of the fiber.
In Figure 2e,g, following the thermal oxidation of the CC, for T−CC−5, an anomalous shift in the positive correlation is observed between the initial resistance and the temperature of the battery. At 25 °C, due to the prolonged oxidation time, the initial resistance of the battery made with T−CC−5 (450 mΩ·cm2) exceeds that of the T−CC−15 (400 mΩ·cm2) battery. However, within the temperature range of 40–60 °C, the average initial resistance of the battery made with T−CC−5 exhibits a fluctuating trend characterized by an initial increase followed by a decrease and then another increase compared to the T−CC−15 battery. This phenomenon may be attributed to alterations in the surface structure of the CC that are induced by varying thermal oxidation times [42].

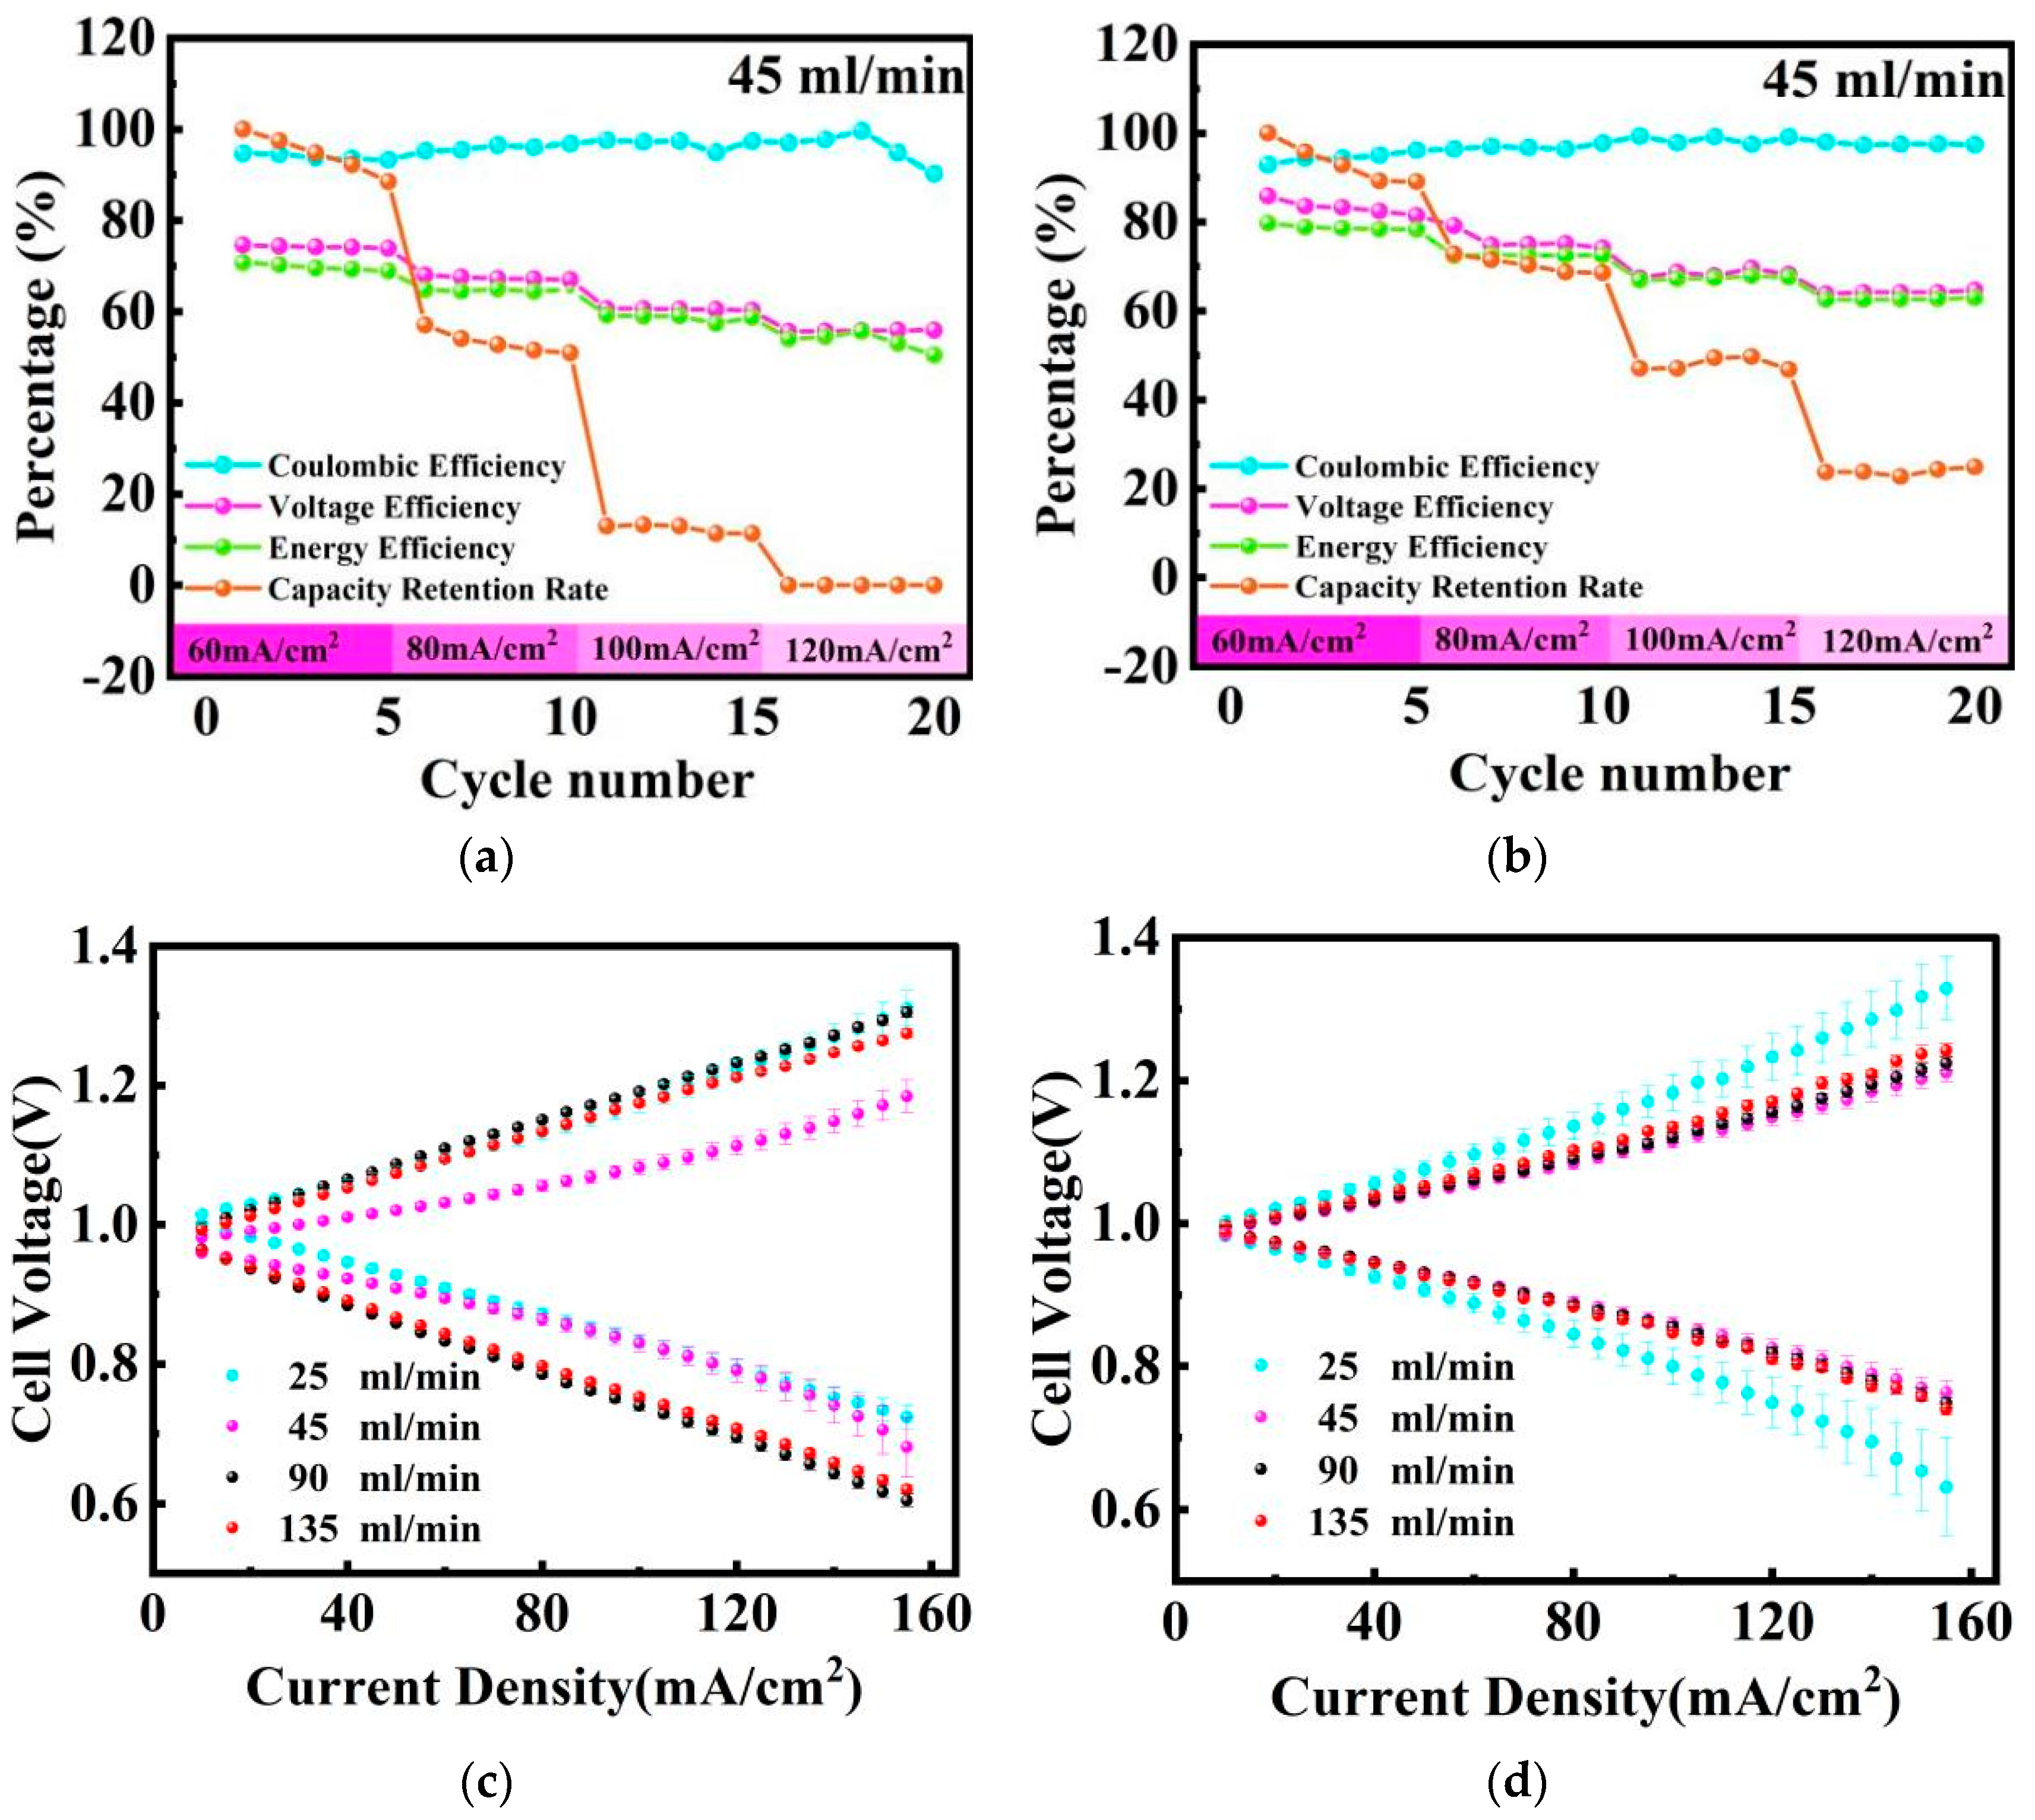
2.2. Electrolyte Flow Rate
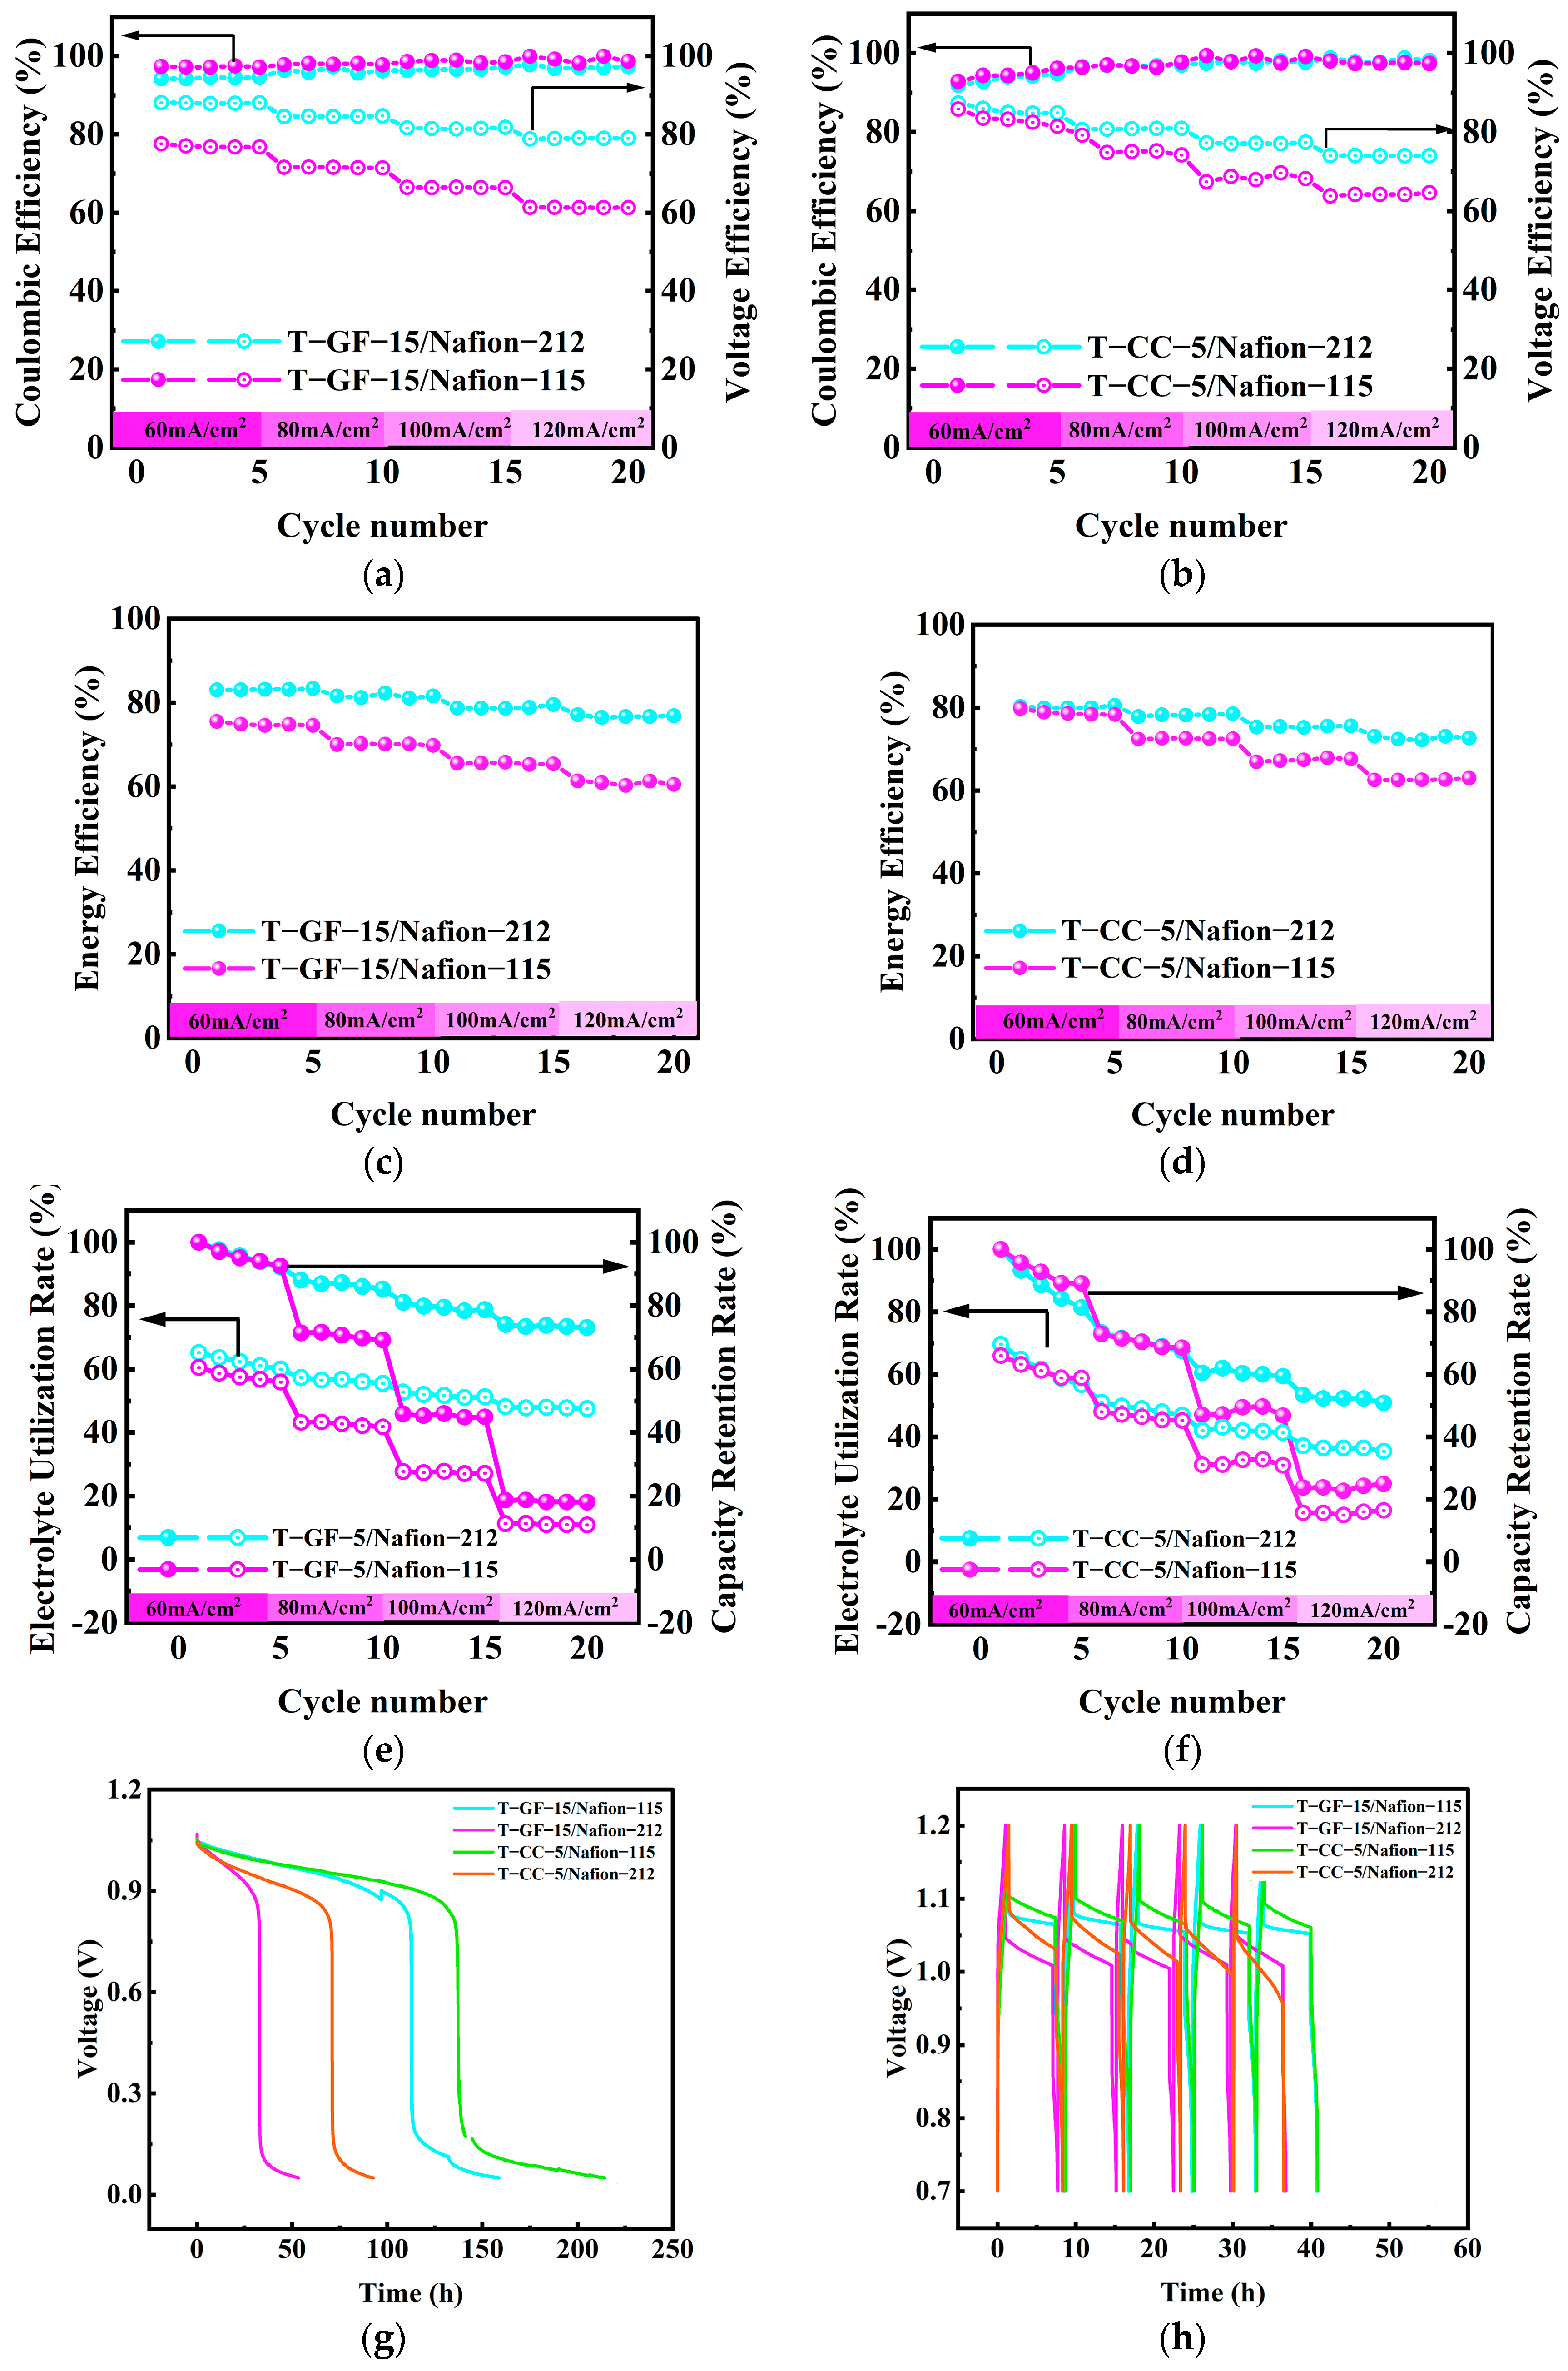
Given the lower initial resistances of the battery with T−GF−15 at 40 °C and that with T−CC−5 at 60 °C, Figure 3a,b presents a comparative analysis of the performance of cell A1 (assembled with T−GF−15) and cell B1 (assembled with T−CC−5) when using Nafion115 as the separator under a flow rate of 45 mL/min for both the anode and cathode during various current densities. At this flow rate, the performance of the battery made with T−CC−5 is significantly better than that with T−GF−15. Specifically, at a current density of 60 mA/cm2, the voltage efficiency (VE) of cell A1 is approximately 74.5%, and the energy efficiency (EE) is about 71%. In contrast, for cell B1, the VE is approximately 82% and the EE is around 80%. At a higher current density of 120 mA/cm2, the VE of cell B1 is approximately 8% higher than that of cell A1, while the EE value is about 6% higher. The capacity retention rate (CR) also underscores the performance disparity between cell A1 (T-GF-15) and cell B1 (T-CC-5). At a current density of 100 mA/cm2, cell A1 retains only about 13.5% of its capacity, and fails totally at 120 mA/cm2. Conversely, cell B1 retains approximately 49.5% of its capacity at 100 mA/cm2 and can still operate continuously at 120 mA/cm2, maintaining a capacity of about 24%.
Figure 3c,d further compares the I–V curves of the batteries assembled with T−GF−15 and T−CC−5 at various flow rates. In these figures, the polarization slope is minimized when both electrodes are operated at a flow rate of 45 mL/min. Remarkably, for T−GF−15, the polarization slope significantly increases at flow rates of 25, 90, or 135 mL/min compared to 45 mL/min. In contrast, for T−CC−5, the polarization slope only increases markedly at 25 mL/min, and shows a slight increase at either 90 or 135 mL/min. These observations suggest that the high porosity of T−GF−15 facilitates more thorough electrolyte impregnation, thereby increasing the mass transfer distance and enhancing the concentration polarization effect on its surface [43]. Consequently, both higher (90, 135 mL/min) and lower (25 mL/min) electrolyte flow rates are more likely to induce battery polarization on the T−GF−15. T−CC−5, in turn, exhibits less electrolyte impregnation, which hinders mass transfer. Therefore, the concentration polarization is more pronounced at low flow rates (25 mL/min), while increasing the flow rate above 45 mL/min has a minimal impact.
Owing to the distinct reaction kinetics of iron ions and chromium ions [12,44], the performance of batteries assembled with T−GF−15 and T−CC−5 was evaluated after adjusting the electrolyte flow rates in their anodes and cathodes, as illustrated in Figure 4. Based on the polarization curve results from the previous section, various flow rate configurations were designed for the anode and cathode of each battery. Specifically, when T−GF−15 served as the cathodic electrode, the flow rate was set at 45 mL/min, while the corresponding flow rates in the anodic electrode of T−GF−15 were reduced to 40 mL/min (cell A2), 35 mL/min (cell A3), and 30 mL/min (cell A4). Conversely, when T−CC−5 functioned as the anodic electrode, the flow rate was maintained at 45 mL/min, whereas the corresponding flow rates in the cathodic electrode of T−CC−5 were increased to 50 mL/min (cell B2), 55 mL/min (cell B3), and 60 mL/min (cell B4). Following these adjustments, the performance of the batteries assembled with T−GF−15 improved when the flow rate in the anode was decreased (see Figure 4a,c). Notably, at a current density of 60 mA/cm2, the VE of cell A2 increased by 2.5% and the EE increased by 4% compared to cell A1 when the anodic flow rate reached 40 mL/min. However, increasing the cathodic flow rate did not enhance the performance of the batteries assembled with T−CC−5 (see Figure 4b,d). At 60 mA/cm2, cell B1, with a flow rate of 45 mL/min for both its anode and cathode, exhibited the highest battery efficiency, achieving a VE of 78.5% and an EE of approximately 74.5%. Eventually, cell A2 and cell B1 achieved comparable battery efficiencies after the flow rates were adjusted. At a current density of 120 mA/cm2, the VE of cell A2 was approximately 61.5% and the EE was approximately 61%. For cell B1, the VE was approximately 63% and the EE was approximately 62%. Additionally, the influence of the flow rate on T−GF−15 and T−CC−5 also extended to the battery capacity, as shown in Figure 4e,f. The results indicate that the EU and CR of cell A2 were 40% and 75% at a current density of 80 mA/cm2, respectively, which were the highest among the T−GF−15-based batteries. In the T−CC−5 series, cell B1 exhibited the highest EU of 50% and a CR of 75% at the same current density. This suggests that reducing the anode flow rate is valid for T−GF−15, while balancing the flow rates for both the anode and cathode benefits T−CC−5. Furthermore, the performances of cell A2 and cell B1 were compared during multiple cycles at a current density of 100 mA/cm2, as depicted in Figure 4g,h. It was found that cell A2 had an average capacity loss rate of 0.37% per cycle, whereas cell B1 demonstrated a rate of 0.43% per cycle. After the first cycle of charging and discharging, cell A1 exhibited an EU of 58%, with an average drop of 0.21% per cycle. In contrast, cell B1 demonstrated an EU of 61.5%, accompanied by an average reduction of 0.25% per cycle.
To comprehensively evaluate the performances of batteries, in addition to essential efficiencies (CE, VE, EE), the EU and CR are critical parameters for assessing battery lifespan. The results indicate that adjusting the flow rates of the positive and negative sides improves the VE, EE, EU, and CR of the battery made with T−GF−15 (cell A2). However, this strategy proves ineffective for the T−CC−5 battery. Considering that the initial cell resistances were essentially identical, the aforementioned results primarily highlight the impact of T−GF−15 and T−CC−5 on the concentration polarization and activation polarization [45]. Due to the high porosity within T−GF−15, its performance could be enhanced by optimizing the electrolyte flow rates (40 mL/min for the anode and 45 mL/min for the cathode). Following this optimization, the performance of T−GF−15 approached that of T−CC−5.

2.3. Membrane

In addition to the intrinsic structural effects of GF and CC on the performance of batteries, the compatibility between the membrane and electrode is also recognized as a critical factor that influences the electrochemical reactions [40,46,47]. To further explore the coupling effect between Nafion membranes of varying thicknesses and the electrodes, Figure 5 illustrates the performance of batteries made with Nafion-115 and Nafion-212 membranes paired with T−GF−15 (40 °C) and T−CC−5 (60 °C), respectively. The flow rates for these cells were based on the findings presented in Section 3.2. Specifically, the anodic flow rate was set at 40 mL/min and the cathodic flow rate at 45 mL/min for the T−GF−15. Both sides operated at 45 mL/min for the T−CC−5. Given that the electrolytes for both sides are stored in a sealed system to prevent air oxidation, the current efficiency (CE) is primarily influenced by the cross-mixing of metal ions [48,49]. The thickness of the membrane significantly influences the mitigation of mutual mixing between the anode and cathode electrolytes. While thicker membranes generally offer superior separation, they also lead to increased ohmic resistance. As shown in Figure 5a,b, the average CE value for the T−GF−15/Nafion-115 cell is 97.5%, approximately 3% higher than that of the T−GF−15/Nafion-212 (94.5%) cell at a current density of 60 mA/cm2. In contrast, the CE values for the T−CC−5/Nafion-115 cell and the T−CC−5/Nafion-212 cell are almost identical, averaging 94.3% at 60 mA/cm2. This indicates that the impact of the membrane thickness on the CE is only substantial in the T−GF−15 cell, whereas it is insignificant in the T−CC−5 cell. This difference can be attributed to the distinct flow fields provided by the two electrode structures. The dependence of the flow rate on the geometrical dimension of the electrodes can be described as follows [18]:
v = Q × l i × h × 1 6000
where v represents the electrolyte flow rate (m·s−1), Q represents the specific flow rate (ml·min−1cm−2), i represents the branch number of the flow field, and l and h represent the length and thickness of the electrode (cm), respectively. As outlined in Section 3.2, T−GF−15 and T−CC−5 exhibited comparable cell performances due to their similar specific flow rates after adjusting the flow rate of each. As a result, the actual electrolyte flow rate within the thinner T−CC−5 is higher than that within the thicker T−GF−15. Thus, the combination of a thick membrane and a thick electrode can provide an effective barrier effect, making T−GF−15 suitable for use with Nafion-115. However, the VE values, an indicator of electrode activity, show that employing Nafion-212 with both electrodes consistently outperforms the batteries utilizing Nafion-115 across all current densities. This can be attributed to the lower ohmic resistance of the thinner Nafion-212 compared to Nafion-115 [48]. Notably, the T−GF−15/Nafion-212 cell achieved a higher VE value than the T−CC−5/Nafion-212 cell, whereas the T−GF−15/Nafion-115 cell resulted in a slightly lower VE value than the T−CC−5/Nafion-115 cell. This discrepancy can be attributed not only to the better electrochemical activity of T−GF−15 compared to T−CC−5 (discussed in detail in Section 2.4) but also to the higher resistance of the thick membrane, which may impede electron transfer at the membrane–electrode interface [50].
The value changes in the EE and CR for each battery are illustrated in Figure 5c–f. In Figure 5c,d, the EE values for the batteries using Nafion-212 with both electrode types are consistently higher than those of the batteries using Nafion-115 across all current densities. Additionally, the trend of variation in the EE values for other cells is affected by their VE values. Furthermore, the CR of the battery with T−GF−15/Nafion-212 reaches 79% at a current density of 100 mA/cm2, while that of the battery with T−CC−5/Nafion-212 is only 51.5%, as shown in Figure 5e,f. However, the electrolyte utilization rate (EU) of the battery with T−GF−15/Nafion-212 is comparable to that of the battery with T−CC−5/Nafion-212, most likely due to the similar specific flow rates resulting from previous adjustments. Therefore, Nafion-212 is more suitable for ICRFBs, especially when paired with T−GF−15, given the observed enhancement of the battery’s cell efficiencies and energy storage duration.
When the battery is in a static self-discharge or intermittent self-discharge state, the thicker Nafion-115 membrane exhibits superior performance compared to the Nafion-212 membrane, as shown in Figure 5g,h. Figure 5g compares the open-circuit voltage (OCV) curves of each battery in the static state (SOC ≈ 50%). As the static duration increases, the OCV of each cell gradually decreases. When the voltage is lowered to 0.1 V, the T−GF−15/Nafion-115 and T−GF−15/Nafion-212 batteries self-discharge for 115 and 38 h, respectively. The T−CC−5/Nafion-115 and T−CC−5/Nafion-212 batteries, however, do so for 150 and 75 h respectively. These results indicate that the Nafion-115 membrane significantly prolongs the self-discharge time of the cell. Notably, the combination of T−CC−5 with both Nafion membranes exhibits a longer self-discharge time than T−GF−15, with the T−CC−5/Nafion-115 battery achieving the longest duration. This performance is attributed not only to the enhanced barrier effect of the thicker Nafion-115 membrane, but also to the faster electrolyte flow rate facilitated by the thinner T−CC−5 electrode. To further investigate the self-discharge behavior of the batteries during operation intervals, Figure 5h illustrates the state of charge of each battery after a 6 h self-discharge at a current density of 60 mA/cm2 during charge–discharge cycle intervals. Due to the inferior charge-retention capability of the Nafion-212 membrane, both the T−GF−15/Nafion-212 and T−CC−5/Nafion-212 cells experienced significant voltage drops, averaging 0.04 V and 0.05 V, respectively, during the static charge intervals. In contrast, the T−GF−15/Nafion-115 and T−CC−5/Nafion-115 batteries maintained a better state of charge, with the T−GF−15/Nafion-115 battery showing the smallest average voltage drop of only 0.02 V and the T−CC−5/Nafion-115 battery showing a drop of 0.03 V. Additionally, the T−CC−5/Nafion-115 cell consistently displayed the highest initial and final voltages during the self-discharge, followed by the T−GF−15/Nafion-115 cell. Although the initial internal resistances of the T−CC−5/Nafion-115 and T−GF−15/Nafion-115 cells were adjusted to be similar, the main influence of this factor was the contact resistance. In the self-discharge state regime, the compressed T−CC−5 electrode is likely to play a decisive role in determining the initial and final voltages.

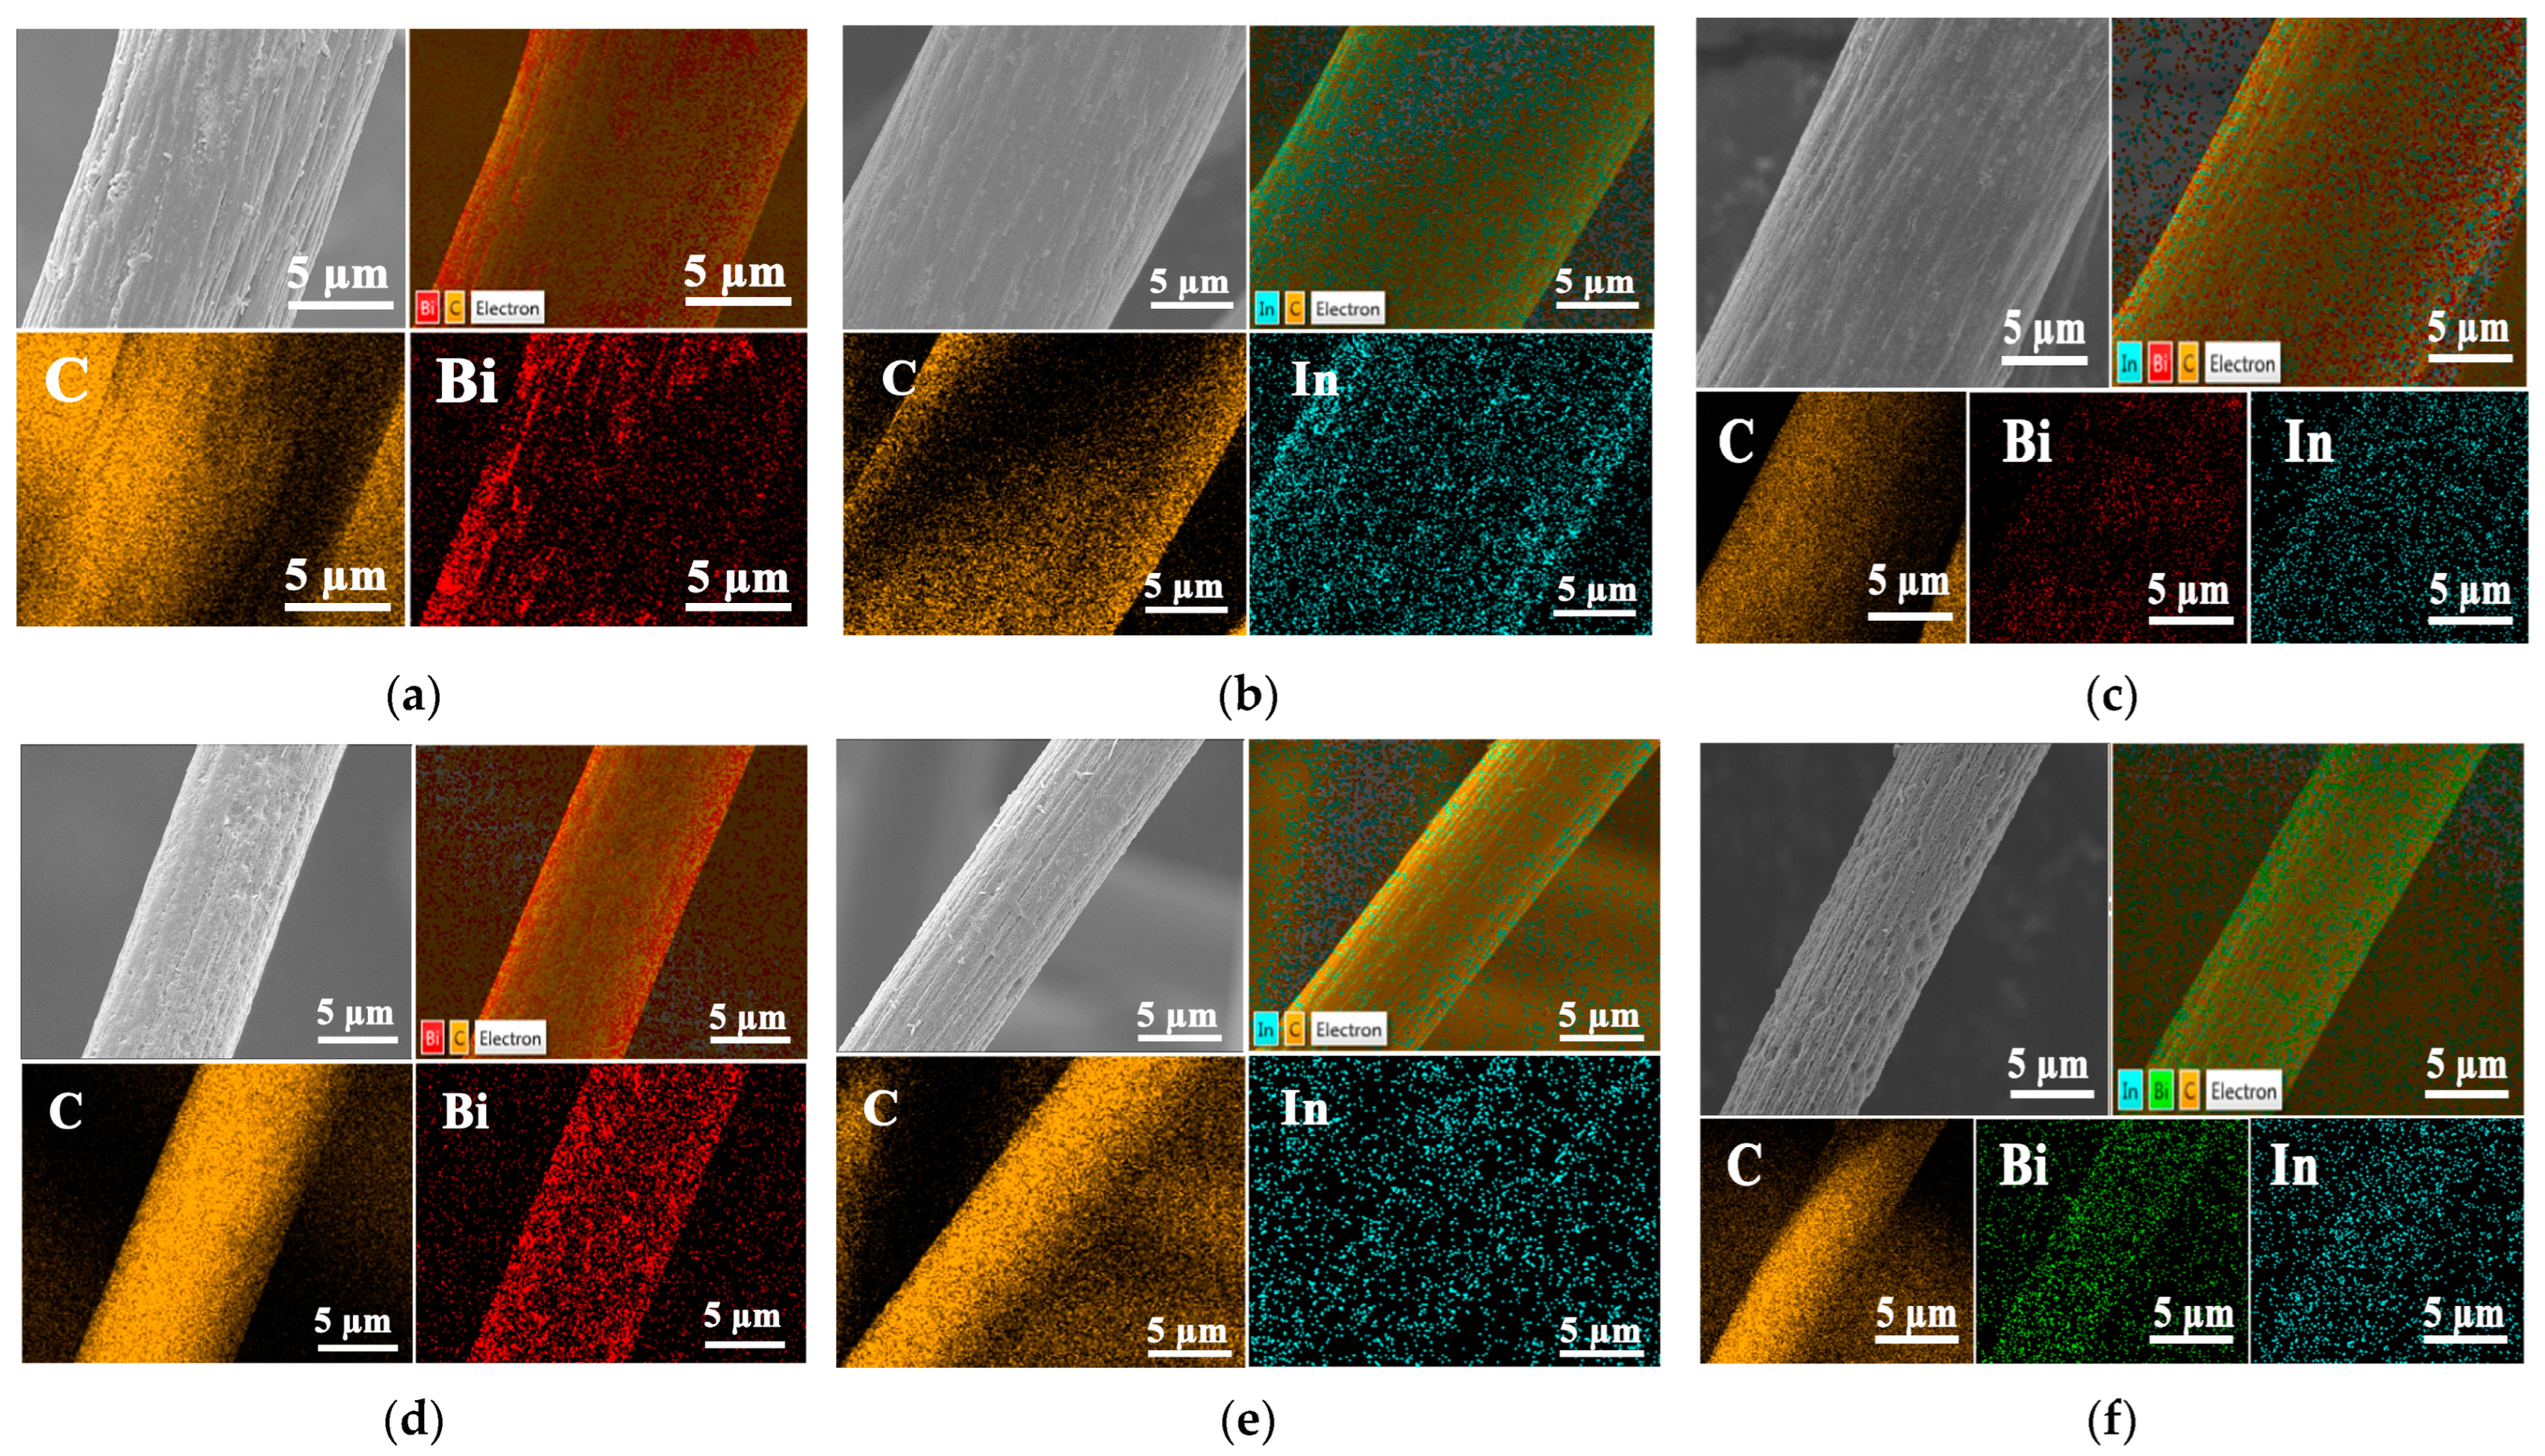
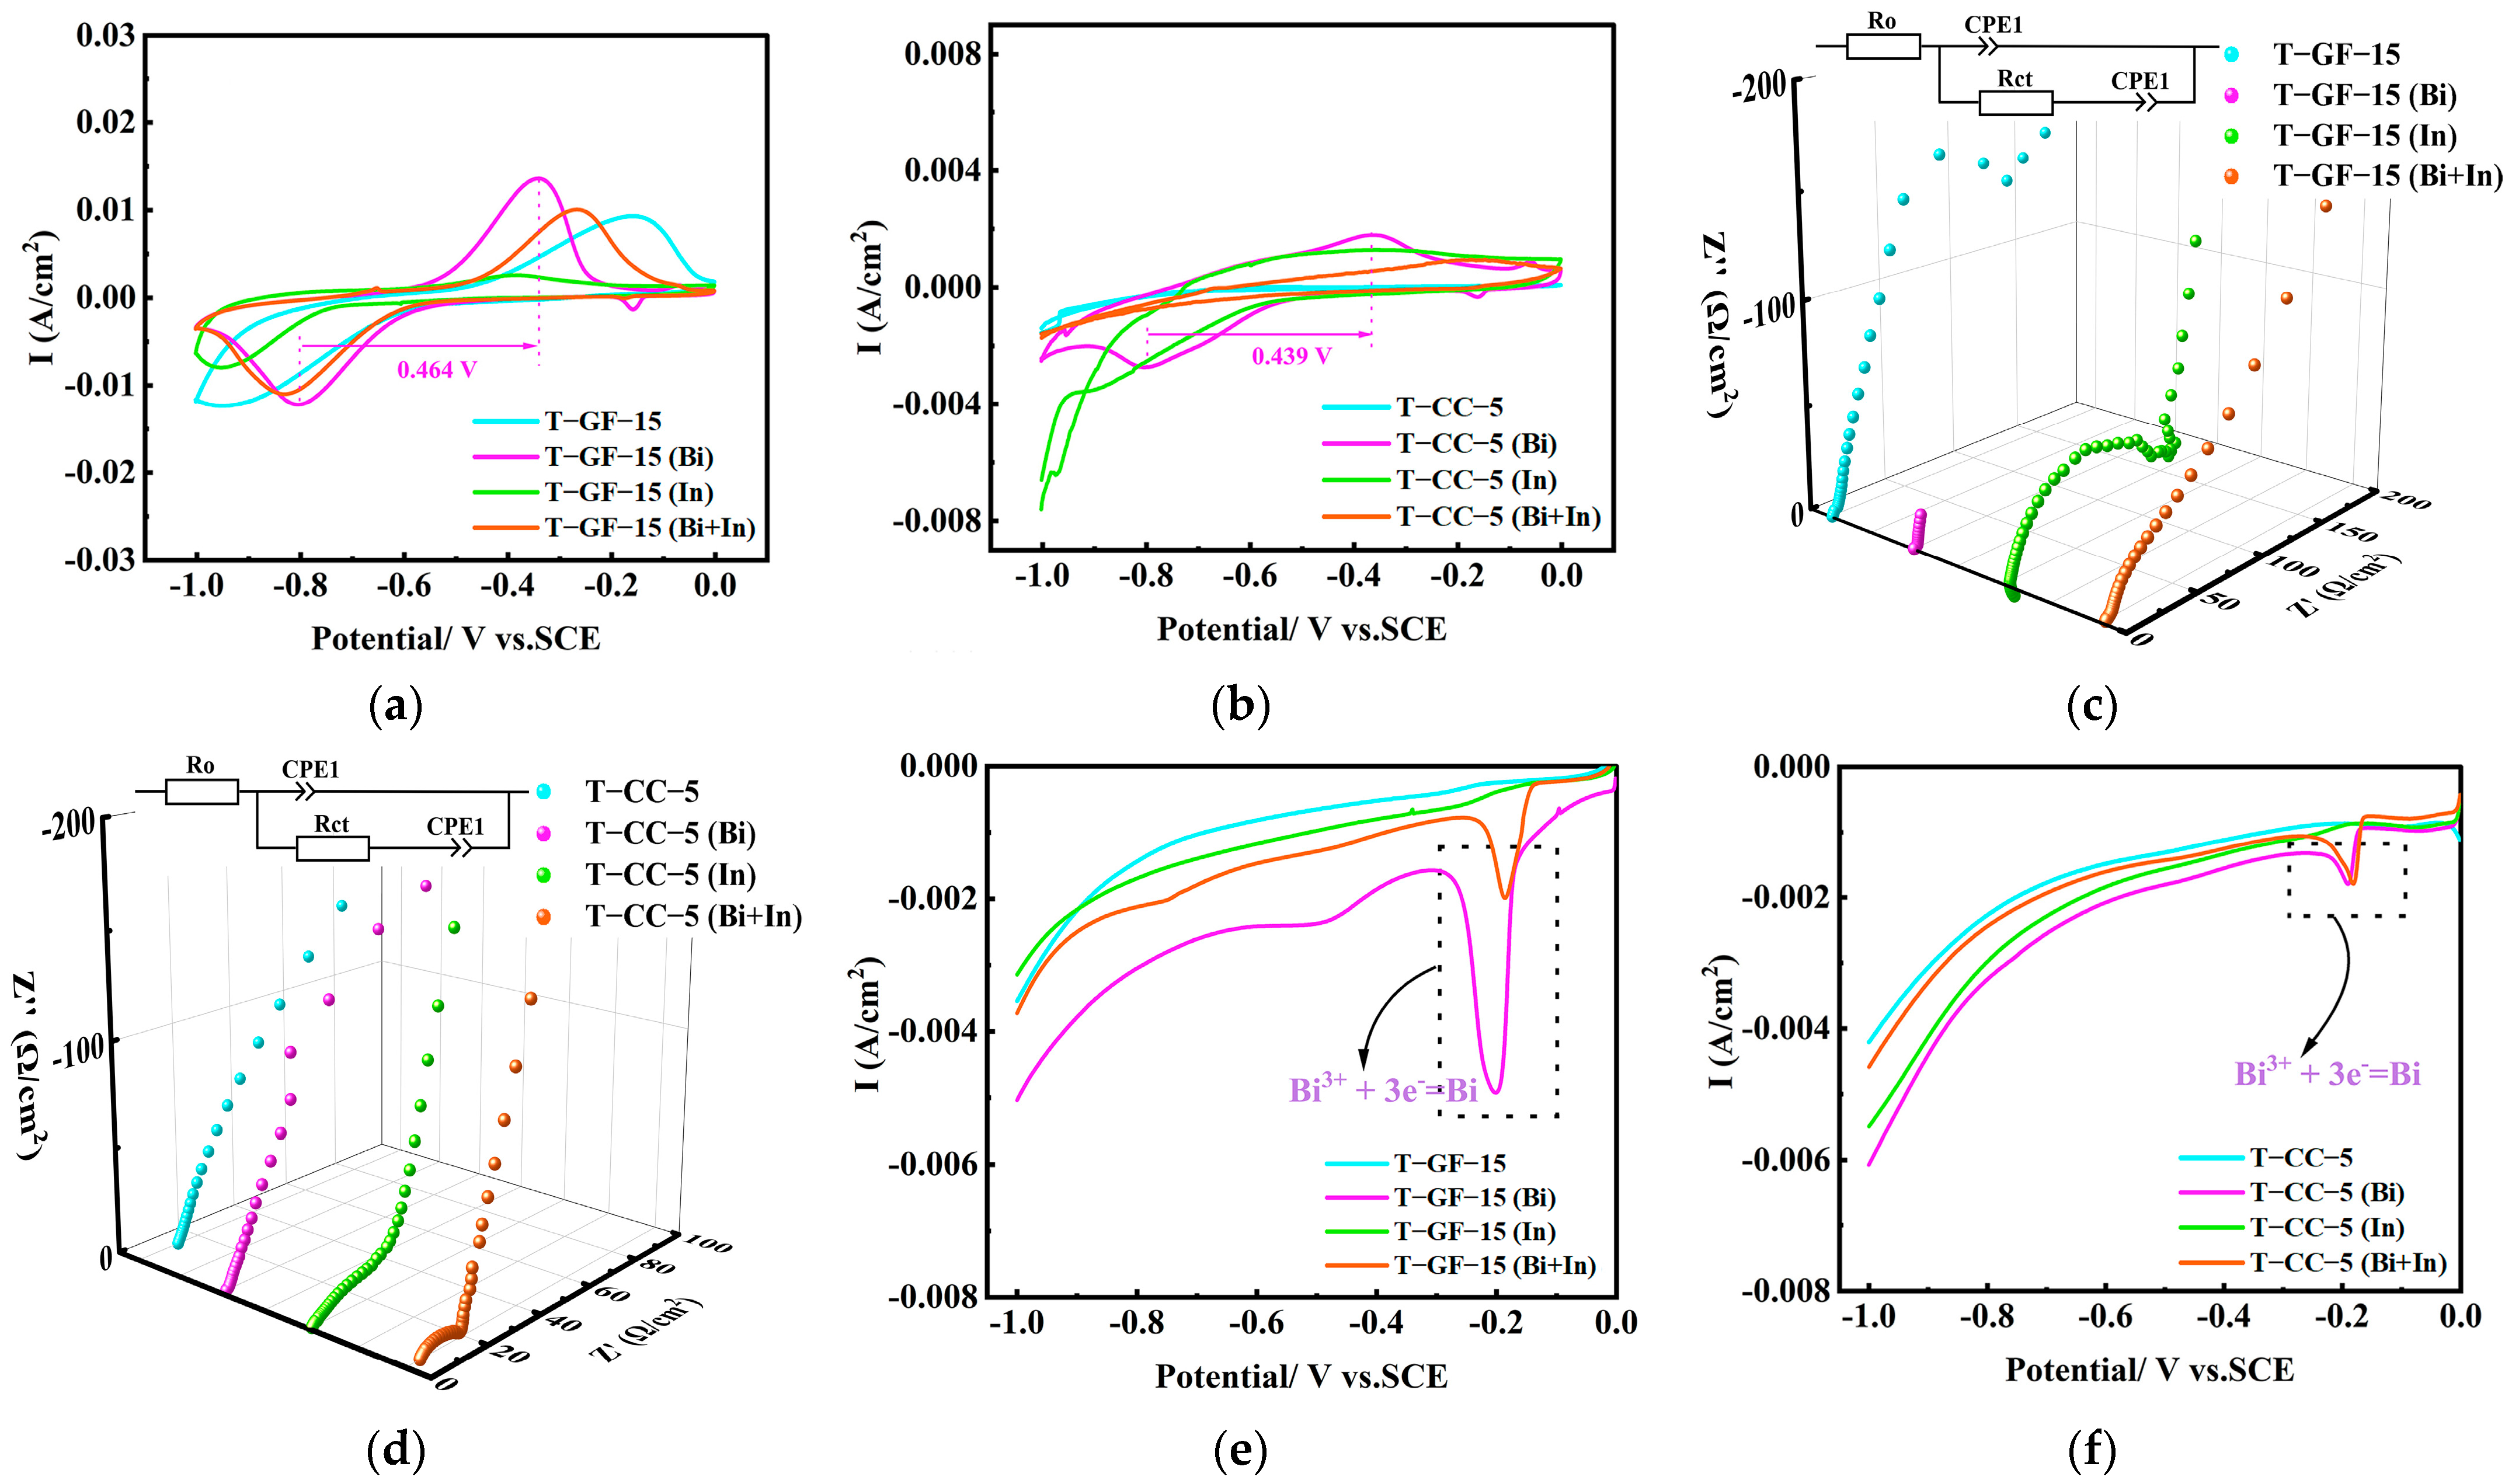
2.4. Bi, in Catalyst

Among the strategies for the electrodeposition of catalysts utilizing the ICRFB cycle process, bismuth (Bi) and indium (In) ions are the most extensively employed [6,11,13,16]. In this study, following the addition of 5 mM BiCl3, 5 mM InCl3, or a combination of 5 mM BiCl3 + 5 mM InCl3 to the electrolyte, and after electrodeposition, SEM characterization of the samples was conducted. The results of the SEM characterization are presented in Figure 6. As depicted in the figure, it was evident that the Bi and In elements were homogeneously distributed on the carbon fiber surface, thereby validating the effectiveness of the method for uniformly depositing each catalyst onto the surfaces of T−GF−15 and T−CC−5.
The effects of T−GF−15 and T−CC−5 on the electrochemical behavior of the cathode in the presence of catalysts are illustrated in Figure 7. Figure 7a and Figure 7b display the CV curves for T−GF−15 and T−CC−5 in electrolytes containing various catalysts, respectively. Each catalyst exhibits a unique catalytic effect on the cathode’s reactivity. Among the catalysts that were tested, BiCl3 demonstrated the most pronounced activation. In Figure 7a, T−GF−15 (Bi) shows the smallest redox peak potential difference (only 464 mV) and the highest redox peak current, with a peak–current ratio of 0.99, indicating excellent symmetry and reversibility. In contrast, Figure 7b reveals that T−CC−5 (Bi) also exhibits a noticeable redox peak, but with a peak potential difference of 439 mV, a significantly lower peak current, and a peak–current ratio of 0.66, suggesting inferior reversibility of the electrode reaction. Furthermore, it can be observed that the peak reaction current of T−GF−15 (In) is lower than that of T−GF−15 but higher than that of T−CC−5 (In). This indicates that the addition of 5 mM InCl3 affects the reactivity of the two electrodes differently. The combined use of both catalysts did not yield synergies, as their performance did not exceed that of the individual catalyst. Additionally, the peak current of the T−CC−5 electrode is consistently lower than that of the T−GF−15 electrode across all catalyst conditions, suggesting that T−GF−15 possesses a larger electrochemical active area. This result further confirms that graphite felt with high porosity can accommodate extra electrolyte.
The electrochemical activity of each sample was assessed using EIS at a polarization potential of −0.4 V (vs. SCE), as illustrated in Figure 7c,d. In these figures, the high-frequency region typically displays a semi-circular shape, representing the charge transfer process, while the low-frequency region corresponds to the diffusion process [51]. The EIS was analyzed using the equivalent circuit depicted in the figure, where RO denotes the ohmic resistance and Rct represents the charge transfer resistance of the electrode, as summarized in Table 1. The results reveal that the Rct values for the T−GF−15 series are consistently lower than those for the T−CC−5 series. Moreover, the addition of BiCl3 significantly reduces the impedance of the cathodic reaction for both T−GF−15 and T−CC−5, confirming the superior catalytic activity of the Bi catalyst in the chromium reduction reaction on the electrode surface. However, the introduction of InCl3 only modestly decreases the Rct value of T−GF−15 from 175 Ω/cm2 to 102.27 Ω/cm2, whereas it markedly reduces the Rct value of T−CC−5 from 234.7 Ω/cm2 to 16.9 Ω/cm2. This observation aligns with the CV results, which show that InCl3 significantly enhances the activity of T−CC−5 but has a minimal impact on T−GF−15. The catalytic effect of InCl3 appears to be influenced by the electrode structure and the redox reaction process of In ions. In an iron-chromium electrolyte containing InCl3, the reduction process proceeds as In(III)→In(0), and the oxidation process follows In(0)→In(I)→In(III), leading to greatly asymmetric deposition and desorption behavior [52]. This asymmetry is corroborated by the CV results, which also reveal poor reversibility in the InCl3 redox reactions. Additionally, the larger electrochemical reaction area of T−GF−15 facilitates the participation of more In ions with poor reversibility in redox reactions, resulting in inferior catalytic performance compared to T−CC−5. Wang et al. reported that graphite felt electroplated with 0.01 M InCl3 exhibits optimal catalytic activity for the reaction of chromium [11]. Consequently, the relatively limited reactivity of InCl3 results in suboptimal catalytic performance when used in conjunction with BiCl3 on both carbon fiber electrodes.
To further investigate the impact of the studied catalysts on the hydrogen evolution side reaction, Figure 7e,f presents the LSV curves of each sample in a hydrochloric acid environment. The descending trend of the curves indicates that the ease of hydrogen evolution on the surface of T−GF−15 follows this order: T−GF−15 (Bi) >T−GF−15 (Bi + In) > T−GF−15 (In) > T−GF−15. For T−CC−5, the sequence is T−CC−5 (Bi) >T−CC−5 (In) > T−CC−5 (Bi + In) > T−CC−5. It is evident that catalysts with higher catalytic activity towards the electrode reaction also promote hydrogen evolution, clearly demonstrating their inability to suppress this process [12]. Further analysis reveals that, under identical catalyst conditions, the T−CC−5 series exhibits a greater tendency for hydrogen evolution compared to the T−GF−15 series, likely due to the influence of the functional groups on the electrode surface [12,53]. The reduction peak of the Bi ions is observable in the figure, and owing to the larger surface area, the reduction peak current of the Bi ions on T−GF−15 surpasses that on T−CC−5, which is consistent with the earlier CV results. However, no reduction peak for the In ions was detected within the electrochemical window of [−1 V, 0] [11].
Employing Nafion-212, the effects of incorporating 5 mM BiCl3, 5 mM InCl3, or a mixture of both (5 mM BiCl3 + 5 mM InCl3) into the electrolyte on the performance of T−GF−15 and T−CC−5 are illustrated in Figure 8. The observed efficiencies, as well as the EU and CR, are illustrated in Figure 8a–d and Figure 8e,f, respectively, for each battery over 30 charge–discharge cycles at a current density of 100 mA/cm2. The CE values for the T−GF−15 series batteries are more stable than those of the T−CC−5 series. As a result of the enhancements made to the VE for the T−CC−5 series, a 5% increase in EE was observed in the cell utilizing the T−CC−5 (Bi). Remarkably, only the T−CC−5 (Bi) cell showed a 10% improvement in EU during the initial stage; however, subsequent cycling resulted in lower CR and EU values compared to T−GF−15 and T−CC−5. Despite the static electrochemical results indicating some catalytic activity for the catalysts, the dynamic battery performance still suffers from issues such as insufficient activity and capacity loss. It has been confirmed that the catalyst particle size and deposition method significantly influence the battery performance [16]. Nonetheless, the results also emphasize that carbon cloth can provide an orderly flow field for the electrolyte, which is crucial for uniform catalyst deposition and functionality. Finally, the battery operating conditions corresponding to T−GF−15 and T−CC−5 are summarized in Table 2.

3. Materials and Methods

3.1. Electrode Materials

Polyacrylonitrile-based GF (5 mm thickness) and CC (0.8 mm thickness) were obtained from Gansu Haoshi Carbon Fiber Co., Ltd., Lanzhou, China. Both materials were washed repeatedly with deionized water and dried at 80 °C for 24 h before use. The ohmic resistance of the electrodes was measured using a multimeter. To activate the GF and CC, they were heated in an air atmosphere at a rate of 10 °C/min to 500 °C and held at this temperature for either 5 or 15 h [8]. After natural cooling, the samples were labeled as T−GF−5, T−GF−15, T−CC−5, and T−CC−15, respectively. The structural properties of the samples were characterized using scanning electron microscopy (SEM, JSM-6500F, JEOL, Tokyo, Japan), X-ray diffraction (XRD, Shimadzu XRD-7000S, Kyoto, Japan), and Brunauer–Emmett–Teller (BET, Tristar 3020, Micromeritics, Norcross, GA, USA) analysis.

3.2. Electrochemical Testing

Electrochemical characterization of the electrodes was performed using a CS310H workstation. Cyclic voltammetry (CV), linear sweep voltammetry (LSV), and electrochemical impedance spectroscopy (EIS) were conducted in a three-electrode system. The system consisted of a working electrode (T-GF-15 or T−CC−5), a counter electrode (high-purity graphite plate), and a reference electrode (saturated calomel electrode). For CV and EIS analyses, the electrolyte solution contained 0.02 M FeCl2, 0.02 M CrCl3, 0.05 M HCl, and either 5 mM BiCl3, 5 mM InCl3, or a combination of both. For LSV measurements, the electrolyte was 0.05 M HCl with or without the addition of 5 mM BiCl3, 5 mM InCl3, or both. Before testing, dissolved oxygen was removed by purging the electrolyte with nitrogen gas. The voltage range for CV and LSV tests was set from −1 V to 0 V (vs. SCE) at a scan rate of 5 mV/s. For EIS, the applied potential was −0.4 V (vs. SCE), with a frequency range from 10−2 Hz to 105 Hz and an amplitude of 5 mV. All reagents were purchased from Shanghai Macklin Biochemical Technology Co., Ltd., Shanghai, China.

3.3. Battery Assembly and Testing

The single-cell battery consisted of a cell stack and two electrolyte storage tanks. Each tank contained 50 mL of electrolyte solution (1.0 M FeCl2, 1.0 M CrCl3, 3.0 M HCl, and either 5 mM BiCl3, 5 mM InCl3, or a combination of both). The electrolyte was circulated through the cell using a peristaltic pump. The temperature of the electrolyte was maintained using a thermostat, and its conductivity was measured using a Leici DDS-307 conductivity meter (Shanghai Leici Instruments Co., Ltd., Shanghai, China). The effective area of the single cell was 2 cm × 5.5 cm. A Nafion membrane separated the positive and negative electrodes, which were compressed with polytetrafluoroethylene (PTFE) gaskets on either side to achieve a compression ratio of approximately 30% of their original thickness. The current collector was made of copper and graphite plates featuring interdigitated flow fields with a groove depth of 1.5 mm, a groove width of 1.0 mm, and a rib width of 1.0 mm. The assembly was clamped together using two steel plates.
Battery performance was evaluated using a CT3002A charge–discharge tester (Landt Instruments, Vestal, NY, USA). Before the charge–discharge cycles, the initial cell resistance was measured after the electrolyte had been circulated for a specified duration. Internal cell resistance was then measured at 30 min intervals, with each measurement representing the average of three consecutive tests. The cut-off voltages for charging and discharging are set between 0.7 V and 1.2 V. The test results were used to calculate the coulombic efficiency (CE), voltage efficiency (VE), energy efficiency (EE), capacity retention rate (CR), and electrolyte utilization rate (EU).

4. Conclusions

In this study, the influence of graphite felt and carbon cloth on the performance of ICRFBs under various operating conditions was systematically investigated through morphological and electrochemical characterization. The intrinsic structural differences between GF and CC, such as their fiber density, fiber spacing, and degree of graphitization, were clearly observed. Notably, graphite felt exhibits a significantly larger infiltrating electrolyte space compared to carbon cloth. Therefore, regarding the internal and external operating conditions of ICRFBs, the key findings for graphite felt and carbon cloth can be summarized as follows.
First, at varying temperatures, changes in the contact resistance within the electrode caused by electrolyte infiltration result in fluctuations in the initial cell resistance. These variations are influenced by both the inherent properties of the electrode and the temperature. Second, by optimizing the flow rate of the anodic and cathodic electrolytes, graphite felt can achieve comparable battery performance to carbon cloth. From the perspective of enhancing battery efficiency and energy storage duration, Nafion-212 is more suitable for ICRFBs, particularly for those using graphite felt due to its high activity. For long-term charging requirements, while thicker Nafion-115 provides a superior barrier effect, thinner carbon cloth facilitates rapid electrolyte flow, which is another critical factor for performance optimization. Both In and Bi deposited on the surfaces of graphite felt and carbon cloth exhibit excellent catalytic activity; however, their ability to inhibit the hydrogen evolution reaction is limited. Carbon cloth, with its orderly flow field for the electrolyte, plays a crucial role in ensuring uniform catalyst deposition and functionality. This study demonstrates the potential for differentiated applications of GF and CC in ICRFBs. The optimization pathway for electrode performance involves balancing internal resistance, mass transfer efficiency, and cost through strategic adjustments of the electrode porosity, fiber orientation, and catalyst loading. The “structure-mass transfer-internal resistance” correlation model proposed herein can serve as a valuable reference for designing electrodes for other redox pairs.

Author Contributions

Conceptualization, H.Z.; methodology, H.Z. and J.T.; software, J.T. and B.Q.; validation, S.L. and J.T.; formal analysis, J.T. and M.F.; investigation, J.T. and B.Q.; resources, H.Z.; data curation, J.T. and B.Q.; writing—original draft preparation, H.Z. and J.T.; writing—review and editing, H.Z. and J.T.; visualization, C.S.; supervision, H.Z. and C.S.; project administration, H.Z.; funding acquisition, S.Y. and C.S. All authors have read and agreed to the published version of the manuscript.

Funding

This work was financially supported by National Natural Science Funds of China (Grant No. 52407239) and Liaoning Provincial Natural Science Foundation Project (2024-MSLH-036).

Data Availability Statement

The generated data are available from the corresponding author upon request.

Conflicts of Interest

The authors declare no conflicts of interest.

References

  1. Zhao, X.; Niu, X.; Liu, X.; Wu, C.; Duan, X.; Ma, Z.; Xu, Y.; Li, H.; Yang, W. Unraveling the coordination behavior and transformation mechanism of Cr3+ in Fe–Cr redox flow battery electrolytes. Mater. Rep. Energy 2024, 4, 100271. [Google Scholar] [CrossRef]
  2. Niu, S.; Sun, S.; Chu, F.; Liu, Y.; Lai, Q.; Cheng, Y. Chelation approach to long-lived and reversible chromium anolytes for aqueous flow batteries. J. Energy Storage 2024, 100, 113720. [Google Scholar] [CrossRef]
  3. Zhang, H.; Sun, C.; Ge, M. Progress in profitable Fe-based flow batteries for broad-scale energy storage. WIREs Energy Environ. 2024, 13, e541. [Google Scholar]
  4. Niu, Y.; Heydari, A.; Qiu, W.; Guo, C.; Liu, Y.; Xu, C.; Zhou, T.; Xu, Q. Machine learning-enabled performance prediction and optimization for iron–chromium redox flow batteries. Nanoscale 2024, 16, 3994–4003. [Google Scholar] [CrossRef]
  5. Wan, C.T.-C.; Rodby, K.E.; Perry, M.L.; Chiang, Y.-M.; Brushett, F.R. Hydrogen evolution mitigation in iron-chromium redox flow batteries via electrochemical purification of the electrolyte. J. Power Sources 2023, 554, 232248. [Google Scholar] [CrossRef]
  6. Zhang, H.; Sun, C. Review of the development of first-generation redox flow batteries iron-chromium system. ChemSusChem 2022, 15, e202101798. [Google Scholar]
  7. Zeng, Y.K.; Zhao, T.S.; Zhou, X.L.; Zeng, L.; Wei, L. The effects of design parameters on the charge-discharge performance of iron-chromium redox flow batteries. Appl. Energy 2016, 182, 204–209. [Google Scholar] [CrossRef]
  8. Zhang, H.; Chen, N.; Sun, C.; Luo, X. Investigations on physicochemical properties and electrochemical performance of graphite felt and carbon felt for iron-chromium redox flow battery. Int. J. Energy Res. 2019, 44, 3839–3853. [Google Scholar] [CrossRef]
  9. Chen, N.; Zhang, H.; Luo, X.D.; Sun, C.Y. SiO2-decorated graphite felt electrode by silicic acid etching for iron-chromium redox flow battery. Electrochim. Acta 2020, 336, 135646. [Google Scholar] [CrossRef]
  10. Liu, Y.; Niu, Y.; Guo, C.; Qu, F.; Liu, Z.; Zhou, X.; Guo, W.; Xu, C.; Xu, Q. Nitrogen-doped bismuth oxide-modified carbon cloth as a bifunctional electrocatalyst for iron-chromium redox flow batteries. Energy Fuels 2024, 38, 12202–12211. [Google Scholar] [CrossRef]
  11. Wang, S.; Xu, Z.; Wu, X.; Zhao, H.; Zhao, J.; Liu, J.; Yan, C.; Fan, X. Excellent stability and electrochemical performance of the electrolyte with indium ion for iron–chromium flow battery. Electrochim. Acta 2021, 368, 137524. [Google Scholar] [CrossRef]
  12. Xie, C.; Yan, H.; Song, Y.; Song, Y.; Yan, C.; Tang, A. Catalyzing anode Cr2+/Cr3+ redox chemistry with bimetallic electrocatalyst for high-performance iron-chromium flow batteries. J. Power Sources 2023, 564, 232860. [Google Scholar] [CrossRef]
  13. Xu, Q.; Wang, S.; Xu, C.; Chen, X.; Zeng, S.; Li, C.; Zhou, Y.; Zhou, T.; Niu, Y. Synergistic effect of electrode defect regulation and Bi catalyst deposition on the performance of iron–chromium redox flow battery. Chin. Chem. Lett. 2023, 34, 108188. [Google Scholar] [CrossRef]
  14. Xing, F.; Fu, Q.; Xing, F.; Zhao, J.; Long, H.; Liu, T.; Li, X. Bismuth single atoms regulated graphite felt electrode boosting high power density vanadium flow batteries. J. Am. Chem. Soc. 2024, 146, 26024–26033. [Google Scholar] [CrossRef] [PubMed]
  15. Zhang, X.; Valencia, A.; Li, W.; Ao, K.; Shi, J.; Yue, X.; Zhang, R.; Daoud, W.A. Decoupling activation and transport by electron-regulated atomic-Bi harnessed surface-to-pore interface for vanadium redox flow battery. Adv. Mater. 2023, 36, 2305415. [Google Scholar] [CrossRef] [PubMed]
  16. Ren, J.; Wang, Z.; Sun, J.; Guo, Z.; Liu, B.; Fan, X.; Zhao, T. In-situ electrodeposition of homogeneous and dense bismuth nanoparticles onto scale-up graphite felt anodes for vanadium redox flow batteries. J. Power Sources 2023, 586, 233655. [Google Scholar] [CrossRef]
  17. Zheng, Y.; Qu, D.; Yang, F.; Chen, D. Study on performance improvement of vanadium redox flow batteries focused on electrode fabrication parameters and compression strategies. J. Energy Storage 2025, 109, 115142. [Google Scholar] [CrossRef]
  18. Wang, Z.; Ren, J.; Sun, J.; Guo, Z.; Wei, L.; Fan, X.; Zhao, T. Characterizations and selections of electrodes with optimal performance for large-scale vanadium redox flow batteries through lab-scale experiments. J. Power Sources 2022, 549, 232094. [Google Scholar] [CrossRef]
  19. Xiong, J.; Song, Y.; Wang, S.; Li, X.; Liu, J.; Yan, C.; Tang, A. Evaluation of the influence of clamping force in electrochemical performance and reliability of vanadium redox flow battery. J. Power Sources 2019, 431, 170–181. [Google Scholar] [CrossRef]
  20. Charvát, J.; Mazúr, P.; Dundálek, J.; Pocedič, J.; Vrána, J.; Mrlík, J.; Kosek, J.; Dinter, S. Performance enhancement of vanadium redox flow battery by optimized electrode compression and operational conditions. J. Energy Storage 2020, 30, 101468. [Google Scholar] [CrossRef]
  21. Ma, T.; Huang, Z.; Li, B.; Xie, X.; Huang, C.; Lin, T.; Guo, Z. Effect of operating conditions on the capacity of vanadium redox flow batteries. J. Electrochem. Soc. 2024, 171, 60503. [Google Scholar] [CrossRef]
  22. Chai, Y.; Qu, D.; Fan, L.; Zheng, Y.; Yang, F. A comprehensive study in experiments combined with simulations for vanadium redox flow batteries at different temperatures. J. Energy Storage 2024, 99, 113405. [Google Scholar] [CrossRef]
  23. Ye, Q.; Dai, J.; Cheng, P.; Zhao, T. Gas evolution induced vicious cycle between bubble trapping and flow choking in redox flow battery stacks. Int. J. Heat Mass Transf. 2024, 51, 125100. [Google Scholar] [CrossRef]
  24. Dai, J.; Ye, Q.; Zhao, T. Increased electrolyte flow resistance and blockage due to hydrogen evolution in a flow battery single cell under stack electrolyte feeding conditions. J. Power Sources 2025, 628, 235940. [Google Scholar] [CrossRef]
  25. Zeng, Y.K.; Zhou, X.L.; Zeng, L.; Yan, X.; Zhao, T. Performance enhancement of iron-chromium redox flow batteries by employing interdigitated flow fields. J. Power Sources 2016, 327, 258–264. [Google Scholar] [CrossRef]
  26. Pan, L.; Sun, J.; Qi, H.; Han, M.; Dai, Q.; Xu, J.; Yao, S.; Li, Q.; Wei, L.; Zhao, T. Dead-zone-compensated design as general method of flow field optimization for redox flow batteries. Proc. Natl. Acad. Sci. USA 2023, 120, 1989395176. [Google Scholar] [CrossRef]
  27. Guo, Z.; Sun, J.; Wan, S.; Wang, Z.; Ren, J.; Pan, L.; Wei, L.; Fan, X.; Zhao, T. Deep neural network-assisted fast and precise simulations of electrolyte flows in redox flow batteries. Appl. Energy 2025, 379, 124910. [Google Scholar] [CrossRef]
  28. Sun, J.; Yang, P.; Lv, M.; Zhao, M.; Xiao, Q.; Zhang, W.; Wang, J.; Zhang, L. Localized acoustic streaming-mediated efficiency enhancement for vanadium redox flow battery. J. Energy Storage 2025, 110, 115108. [Google Scholar] [CrossRef]
  29. Zhou, X.L.; Zhao, T.S.; An, L.; Zeng, Y.; Wei, L. Critical transport issues for improving the performance of aqueous redox flow batteries. J. Power Sources 2017, 339, 1–12. [Google Scholar] [CrossRef]
  30. Sun, J.; Jiang, H.; Wu, M.; Fan, X.; Chao, C.; Zhao, T. Aligned hierarchical electrodes for high-performance aqueous redox flow battery. Appl. Energy 2020, 271, 115235. [Google Scholar] [CrossRef]
  31. Li, J.-C.; Lu, M.-Y.; Yang, W.-W.; Zhang, R.-Z.; Su, J.-W.; Xu, Q. Development of high-performance and ultra-stability hierarchical nested-network-pore carbon electrode for vanadium redox flow batteries. J. Energy Storage 2024, 97, 112987. [Google Scholar] [CrossRef]
  32. Park, S.H.; Ha, J.; Kim, D.W.; Hwang, C.; Choi, J.-I.; Park, H.S.; Kim, Y. Mesoporous graphite felt electrode prepared via thermal oxidative etching on all-vanadium redox flow batteries. Chem. Eng. J. 2024, 500, 157238. [Google Scholar] [CrossRef]
  33. Zhang, Y.; Ye, Q.; Ma, Z. Effects of trace amount of copper, nickel and bismuth on hydrogen evolution reaction of the carbon felt electrode in a hydrochloride-based flow battery. J. Energy Storage 2024, 103, 114329. [Google Scholar] [CrossRef]
  34. Cecchetti, M.; Messaggi, M.; Donazzi, A.; Facibeni, A.; Russo, V.; Casari, C.; Bassi, A.L.; Casalegno, A.; Zago, M. A combined morphological and electrochemical characterization of carbon electrodes in vanadium redox flow batteries: Insights into positive and negative electrode performance. Electrochim. Acta 2020, 329, 135143. [Google Scholar] [CrossRef]
  35. Sun, J.; Jiang, H.R.; Zhang, B.W.; Chao, C.; Zhao, T. Towards uniform distributions of reactants via the aligned electrode design for vanadium redox flow batteries. Appl. Energy 2019, 259, 114198. [Google Scholar] [CrossRef]
  36. Trovo, A.; Zamboni, W.; Marini, G.; Poli, N.; Guarnieri, M. A flow battery cell testing facility for versatile active material characterization: Features and operations. J. Power Sources 2025, 625, 235679. [Google Scholar] [CrossRef]
  37. Saraidaridis, J.D.; Darling, R.M.; Yang, Z.; Shovlin, C.; Fortin, M.E.; Robb, B.H.; Waters, S.E.; Marshak, M.P. Transport of ligand coordinated iron and chromium through cation-exchange membranes. J. Electrochem. Soc. 2022, 169, 60532. [Google Scholar] [CrossRef]
  38. du Toit, J.P.; Krieg, H.M.; Mans, N.; van der Westhuizen, D.J. UV–Vis spectrophotometric analytical technique for monitoring Fe2+ positive electrolyte of an ICRFB. J. Power Sources 2023, 553, 232178. [Google Scholar] [CrossRef]
  39. Farooq, M.O.; Furquan, M.; Munteshari, O.; Qamar, M. An operando investigation of temperature distribution behaviour in full-cell vanadium-redox flow batteries. Electrochim. Acta 2025, 513, 145572. [Google Scholar] [CrossRef]
  40. Ghimire, P.C.; Schweiss, R.; Scherer, G.G.; Lim, T.M.; Wai, N.; Bhattarai, A.; Yan, Q. Optimization of thermal oxidation of electrodes for the performance enhancement in all-vanadium redox flow battery. Carbon 2019, 155, 176–185. [Google Scholar] [CrossRef]
  41. Caiado, A.A.; Chaurasia, S.; Aravamuthan, S.R.; Roy, A.; Inalpolat, M.; Agar, E. Binder-coated carbon cloth electrodes for all-vanadium redox flow batteries. J. Electrochem. Soc. 2024, 171, 120524. [Google Scholar] [CrossRef]
  42. Hou, Y.; Sheng, Z.; Zhang, M.; Lin, K.; Kong, J.; Zhang, X. Hierarchically porous carbon colloidal aerogels for highly efficient flow cells. Adv. Funct. Mater. 2024, 2418721. [Google Scholar] [CrossRef]
  43. Wu, M.; Nan, M.; Ye, Y.; Yang, M.; Qiao, L.; Zhang, H.; Ma, X. A highly active electrolyte for high-capacity iron-chromium flow batteries. Appl. Energy 2024, 358, 122534. [Google Scholar] [CrossRef]
  44. Pezeshki, A.M.; Clement, J.T.; Veith, G.M.; Zawodzinski, T.A.; Mench, M.M. High performance electrodes in vanadium redox flow batteries through oxygen-enriched thermal activation. J. Power Sources 2015, 294, 333–338. [Google Scholar] [CrossRef]
  45. Yao, C.; Zhang, H.; Liu, T.; Li, X.; Liu, Z. Carbon paper coated with supported tungsten trioxide as novel electrode for all-vanadium flow battery. J. Power Sources 2012, 218, 455–461. [Google Scholar] [CrossRef]
  46. Schafner, K.; Becker, M.; Turek, T. Membrane resistance of different separator materials in a vanadium redox flow battery. J. Membr. Sci. 2019, 586, 106–114. [Google Scholar] [CrossRef]
  47. Sun, C.; Negro, E.; Nale, A.; Pagot, G.; Vezzù, K.; Zawodzinski, T.A.; Meda, L.; Gambaro, C.; Di Noto, V. An Efficient Barrier toward Vanadium Crossover in Redox Flow Batteries: The Bilayer [Nafion/(WO3)x] Hybrid Inorganic-Organic Membrane. Electrochim. Acta 2021, 378, 138133. [Google Scholar] [CrossRef]
  48. Sun, C.; Zhang, H. Investigation of Nafion series membranes on the performance of iron-chromium redox flow battery. Int. J. Energy Res. 2019, 43, 8739–8752. [Google Scholar] [CrossRef]
  49. du Toit, J.P.; Krieg, H.M. The feasibility of microporous separators in iron-chromium flow batteries. J. Energy Storage 2025, 107, 115008. [Google Scholar] [CrossRef]
  50. Wu, Q.; Lv, Y.; Lin, L.; Zhang, X.; Liu, Y.; Zhou, X. An improved thin-film electrode for vanadium redox flow batteries enabled by a dual layered structure. J. Power Sources 2019, 410, 152–161. [Google Scholar] [CrossRef]
  51. Alhammadi, A.; Fetyan, A.; Susantyoko, R.A.; Mustafa, I.; Bamgbopa, M.O. Understanding characteristic electrochemical impedance spectral data of redox flow batteries with multiphysics modeling. J. Energy Chem. 2025, 102, 329–339. [Google Scholar] [CrossRef]
  52. Monnens, W.; Deferm, C.; Binnemans, K.; Fransaer, J. Indium electrodeposition from indium(III) methanesulfonate in DMSO. Phys. Chem. Chem. Phys. 2020, 22, 24526–24534. [Google Scholar] [CrossRef] [PubMed]
  53. Deng, Y.; Li, Z.; Tan, H.; Zheng, S.; Fan, B.; Zhang, Y. Suppression of the hydrogen evolution reaction of Iron–chromium flow batteries by organic compounds containing the imidazole group. J. Electroanal. Chem. 2024, 978, 118874. [Google Scholar] [CrossRef]
Figure 1. Schematic diagram of an ICRFB.
Catalysts 15 00399 g001
Figure 2. The structure (a) of T−GF−15 and T−CC−5, and the change in the initial resistance of the battery with temperature for batteries using GF (b), CC (c), T−GF−5 (d), T−CC−15 (e), T−GF−15 (f), and T−CC−5 (g) as electrodes.
Catalysts 15 00399 g002
Figure 3. I–V curves for each battery under varying flow rates: (a,c) T−GF−15 (40 °C), (b,d) T−CC−5 (60 °C).
Catalysts 15 00399 g003
Figure 4. Battery performance using T−GF−15 and T−CC−5 as electrodes: (a,b) CE, VE, (c,d) EE, (e,f) CR, and EU at various current densities; and (g,h) CE, VE, EE, CR, and EU at 100 mA/cm2 over multiple cycles.
Catalysts 15 00399 g004
Figure 5. Performance of cells constructed with T−GF−15, T−CC−5 and Nafion membranes: (a,b) CE, VE, (c,d) EE, (e,f) CR and EU, (g) OCV in static self-discharge state, (h) OCV during self-discharge intervals in multi-cycle operation.
Catalysts 15 00399 g005
Figure 6. SEM and EDS results of (a) T−GF−15 (Bi), (b) T−GF−15 (In), (c) T−GF−15 (Bi + In), (d) T−CC−5 (Bi), (e) T−CC−5 (In), (f) T−CC−5 + In (Bi).
Catalysts 15 00399 g006
Figure 7. Electrochemical results following the incorporation of catalysts into the electrolyte: (a,c,e) T−GF−15; (b,d,f) T−CC−5.
Catalysts 15 00399 g007
Figure 8. Performance evaluation of each battery following catalyst introduction (100 mA/cm2): (a,b) CE, VE, (c,d) EE, (e,f) CR and EU.
Catalysts 15 00399 g008
Table 1. Rct results for each sample.
SamplesRct (Ω/cm2)SamplesRct (Ω/cm2)
T-GF-15175.00T-CC-5234.70
T-GF-15 (Bi)0.76T-CC-5 (Bi)0.53
T-GF-15 (In)102.27T-CC-5 (In)16.90
T-GF-15 (Bi + In)1.27T-CC-5 (Bi + In)11.90
Table 2. The appropriate working conditions of ICRFBs using GF and CC.
SamplesInitial Cell Resistance (mΩ·cm2)Electrolyte Flow Rate (mL·min)MembraneCatalyst
T-GF-15123.55 (40 °C)40(+)/45(−)Nafion 212-
T-CC-5145.95 (60 °C)45(+)/45(−)Nafion 212Bi (0.05 M)
Disclaimer/Publisher’s Note: The statements, opinions and data contained in all publications are solely those of the individual author(s) and contributor(s) and not of MDPI and/or the editor(s). MDPI and/or the editor(s) disclaim responsibility for any injury to people or property resulting from any ideas, methods, instructions or products referred to in the content.

