2. Results and Discussion
The first series of 6 different Ni/GDC catalysts were prepared by the WAR method (
Supplementary Materials, Section 1.2). All starting solutions were prepared with a Ce/Gd molar ratio ~4 (Ce
0.8Gd
0.2O
2-δ). In addition, the concentration of Ni in the starting solutions varied from 0 to 100 mol %. Samples were named as follows: GDC, NiGDC
X (
X = 25, 50, 75, 90, where
X = mol % Ni in starting solution), and 100 Ni (100% Ni).
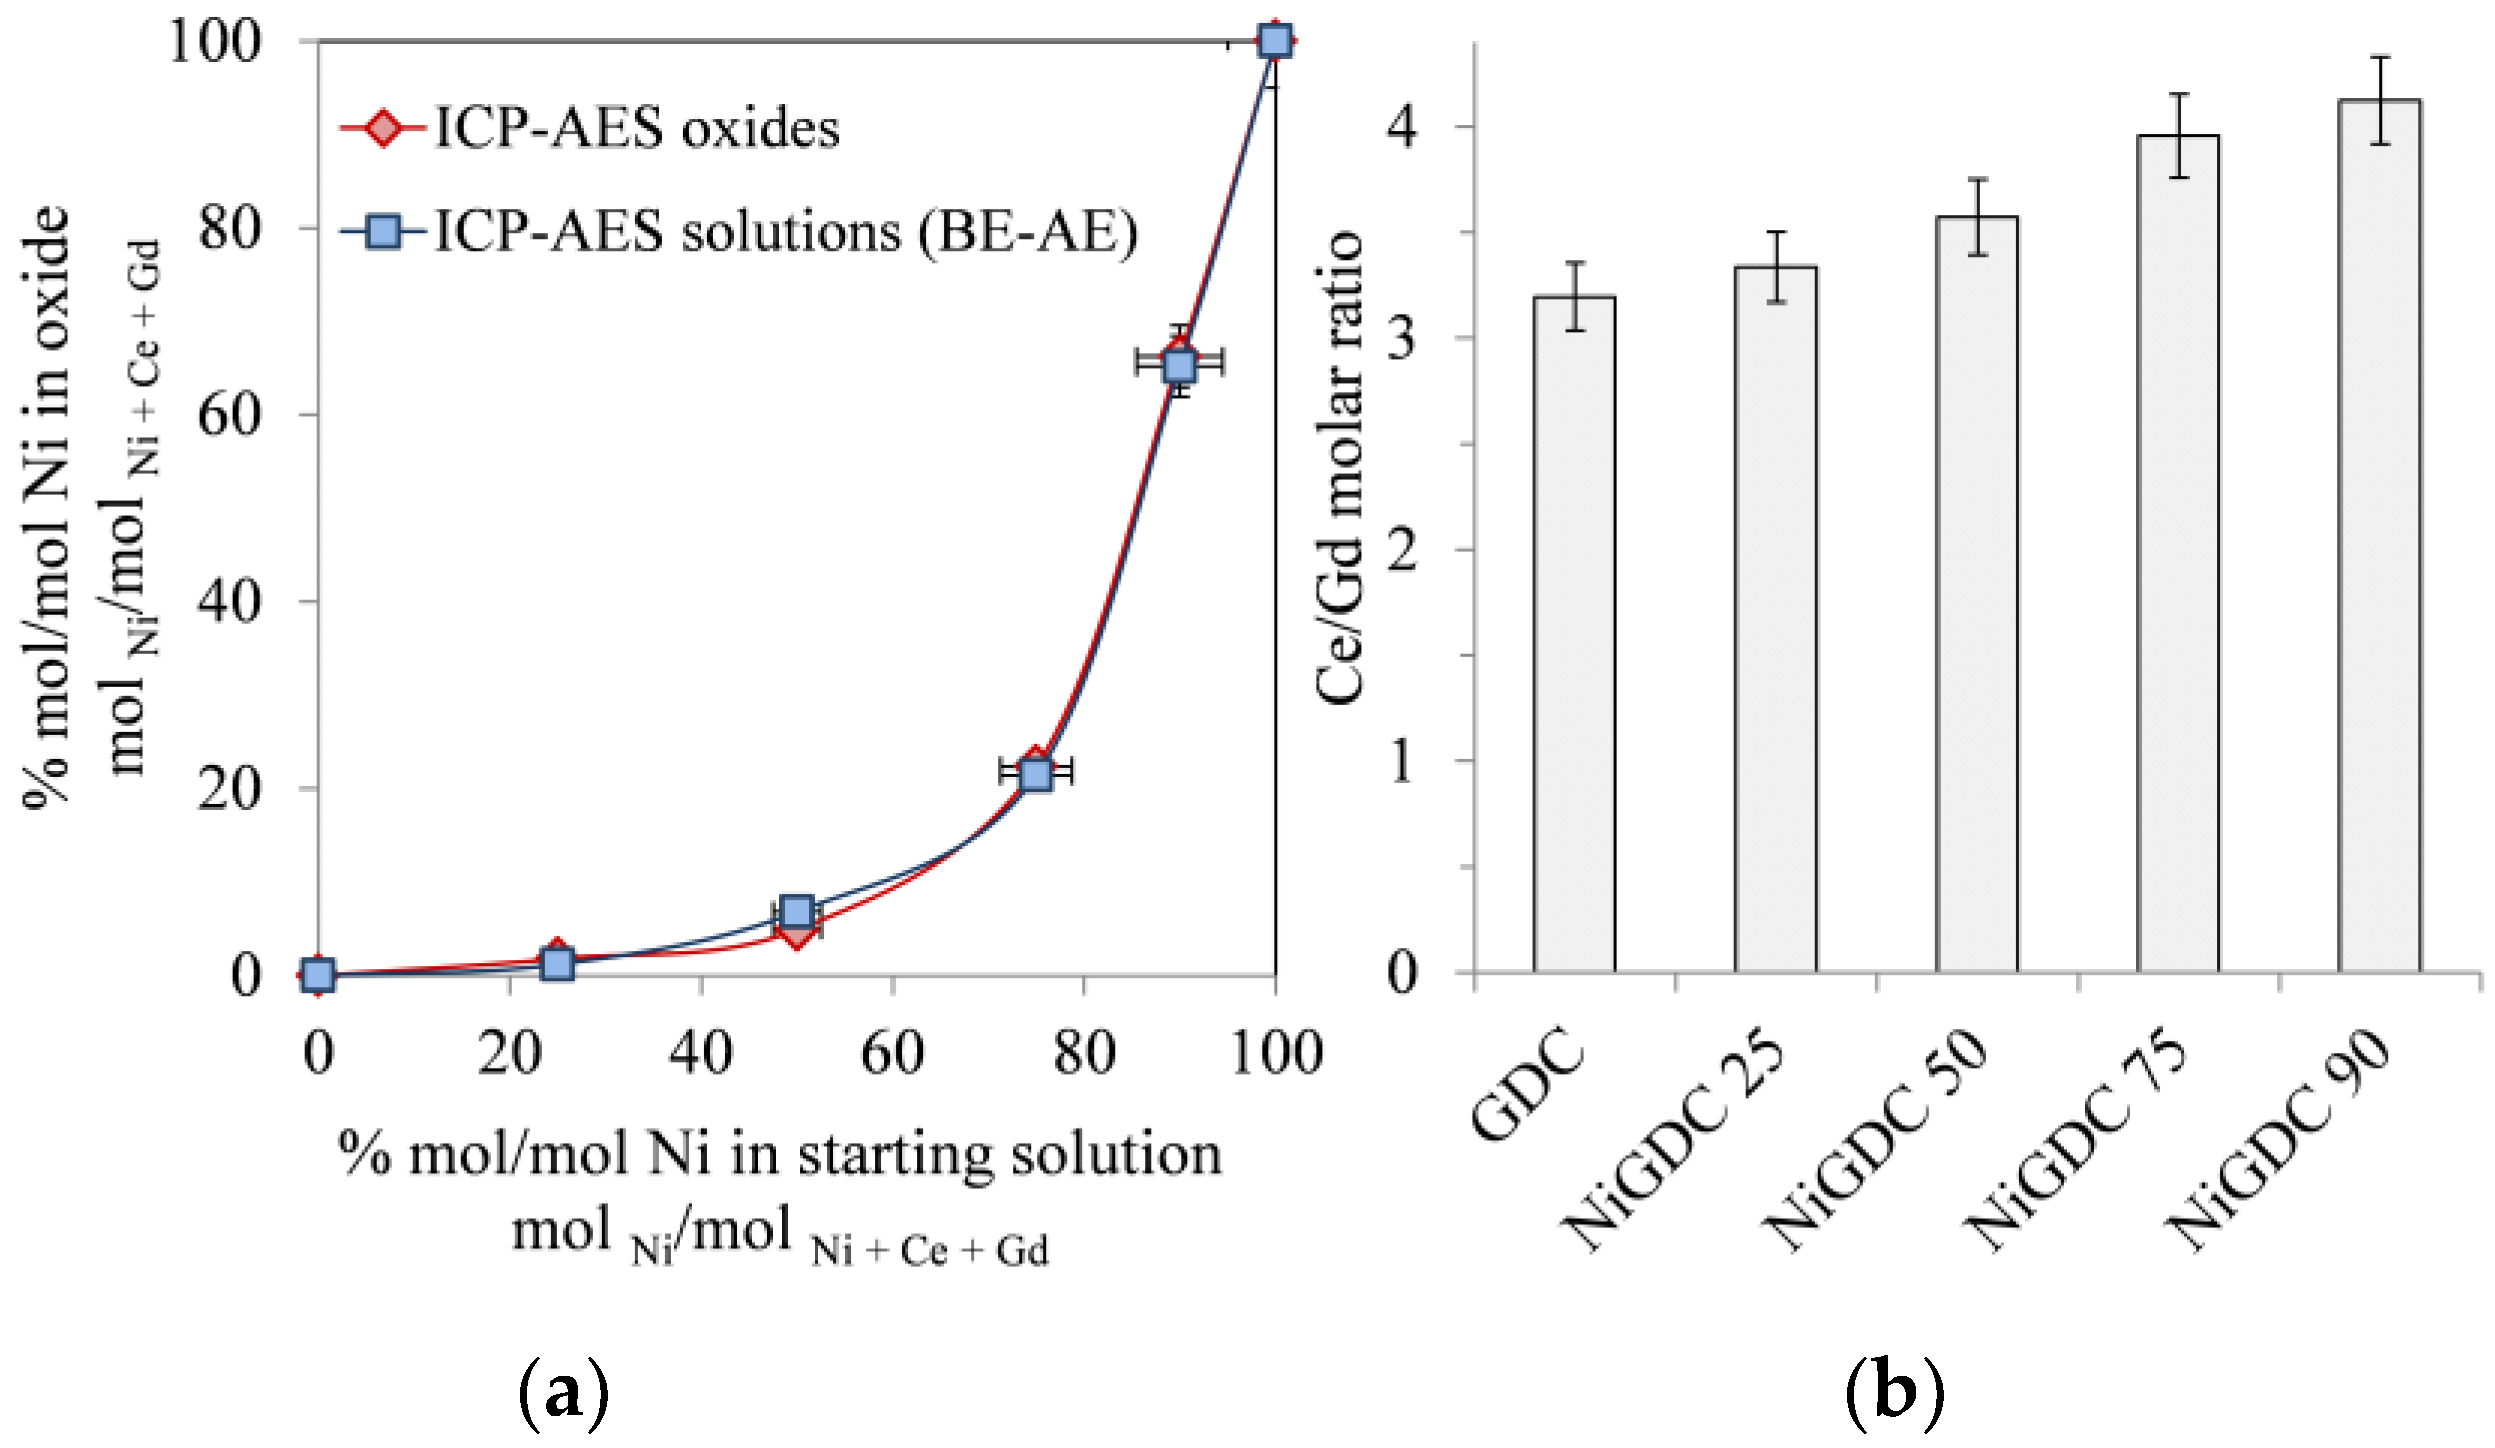
Figure 1a shows the molar concentration of Ni in the catalysts obtained after the calcination of the metal loaded resin. First, the solid materials were dissolved and analyzed via ICP-AES (Inductively coupled plasma atomic emission spectroscopy) For comparison, both the starting (Before Exchange, BE) and the final solutions (After Exchange, AE) were analyzed by ICP-AES, and the Ni, Ce, and Gd loadings in the catalyst were calculated by subtraction (
Supplementary Materials, Section 1.3). It can be clearly observed that the catalyst compositions obtained by both methods are consistent. In addition,
Figure 1b shows that the Ce/Gd molar ratio in the catalysts was very similar to that of the initial solution (Ce/Gd ~ 3–4), while the Ni concentration was lower. This indicates that the affinity of the resin for the ionic exchange was similar for both lanthanides (Ce
3+ and Gd
3+) and lower for Ni
2+, since the electrostatic effects are predominant and, as a consequence, the ion exchanger prefers the counter-ion of higher valence [
11].
The thermal conversion of the metal loaded resin was investigated using TGA (Thermogravimetric analysis) at a heating rate of 2 K·min
−1 from room temperature to 800 °C under air (
Supplementary Materials, Figure S1a). All materials exhibited a similar trend. The slow mass loss at the beginning of the heating (
T < 250 °C) is attributed to the water that left the structure of the loaded resin. In addition, TGA analysis shows a main weight loss between 300 and 400 °C, together with an important release of energy (DSC analysis, Differential Scanning Calorimetry). This is attributed to the departure of the organic skeleton of the acrylic resin [
12,
13,
14].
The exchange efficiency (
Supplementary Materials, Figure S1b) was calculated as the ratio between the effective and the scientific exchange capacity of the resin, based on the ICP-AES and TGA results [
11,
13] (see
Supplementary Materials for detailed calculation).
Figure S1a,b show that, as the Ni concentration increases in the starting solution (and, according to
Figure 1a, in the catalysts), the exchange efficiency decreases. These results corroborate the fact that the general efficiency of the ionic exchange with Ni
2+ ions is slightly lower than that for Ce
3+ and Gd
3+. Nevertheless, even with pure Ni (sample 100 Ni), the efficiency was higher than 80%. Therefore, the exchange efficiency for all elements was high, demonstrating that the WAR method is a powerful technique to produce Ni/GDC catalysts with a controlled composition.
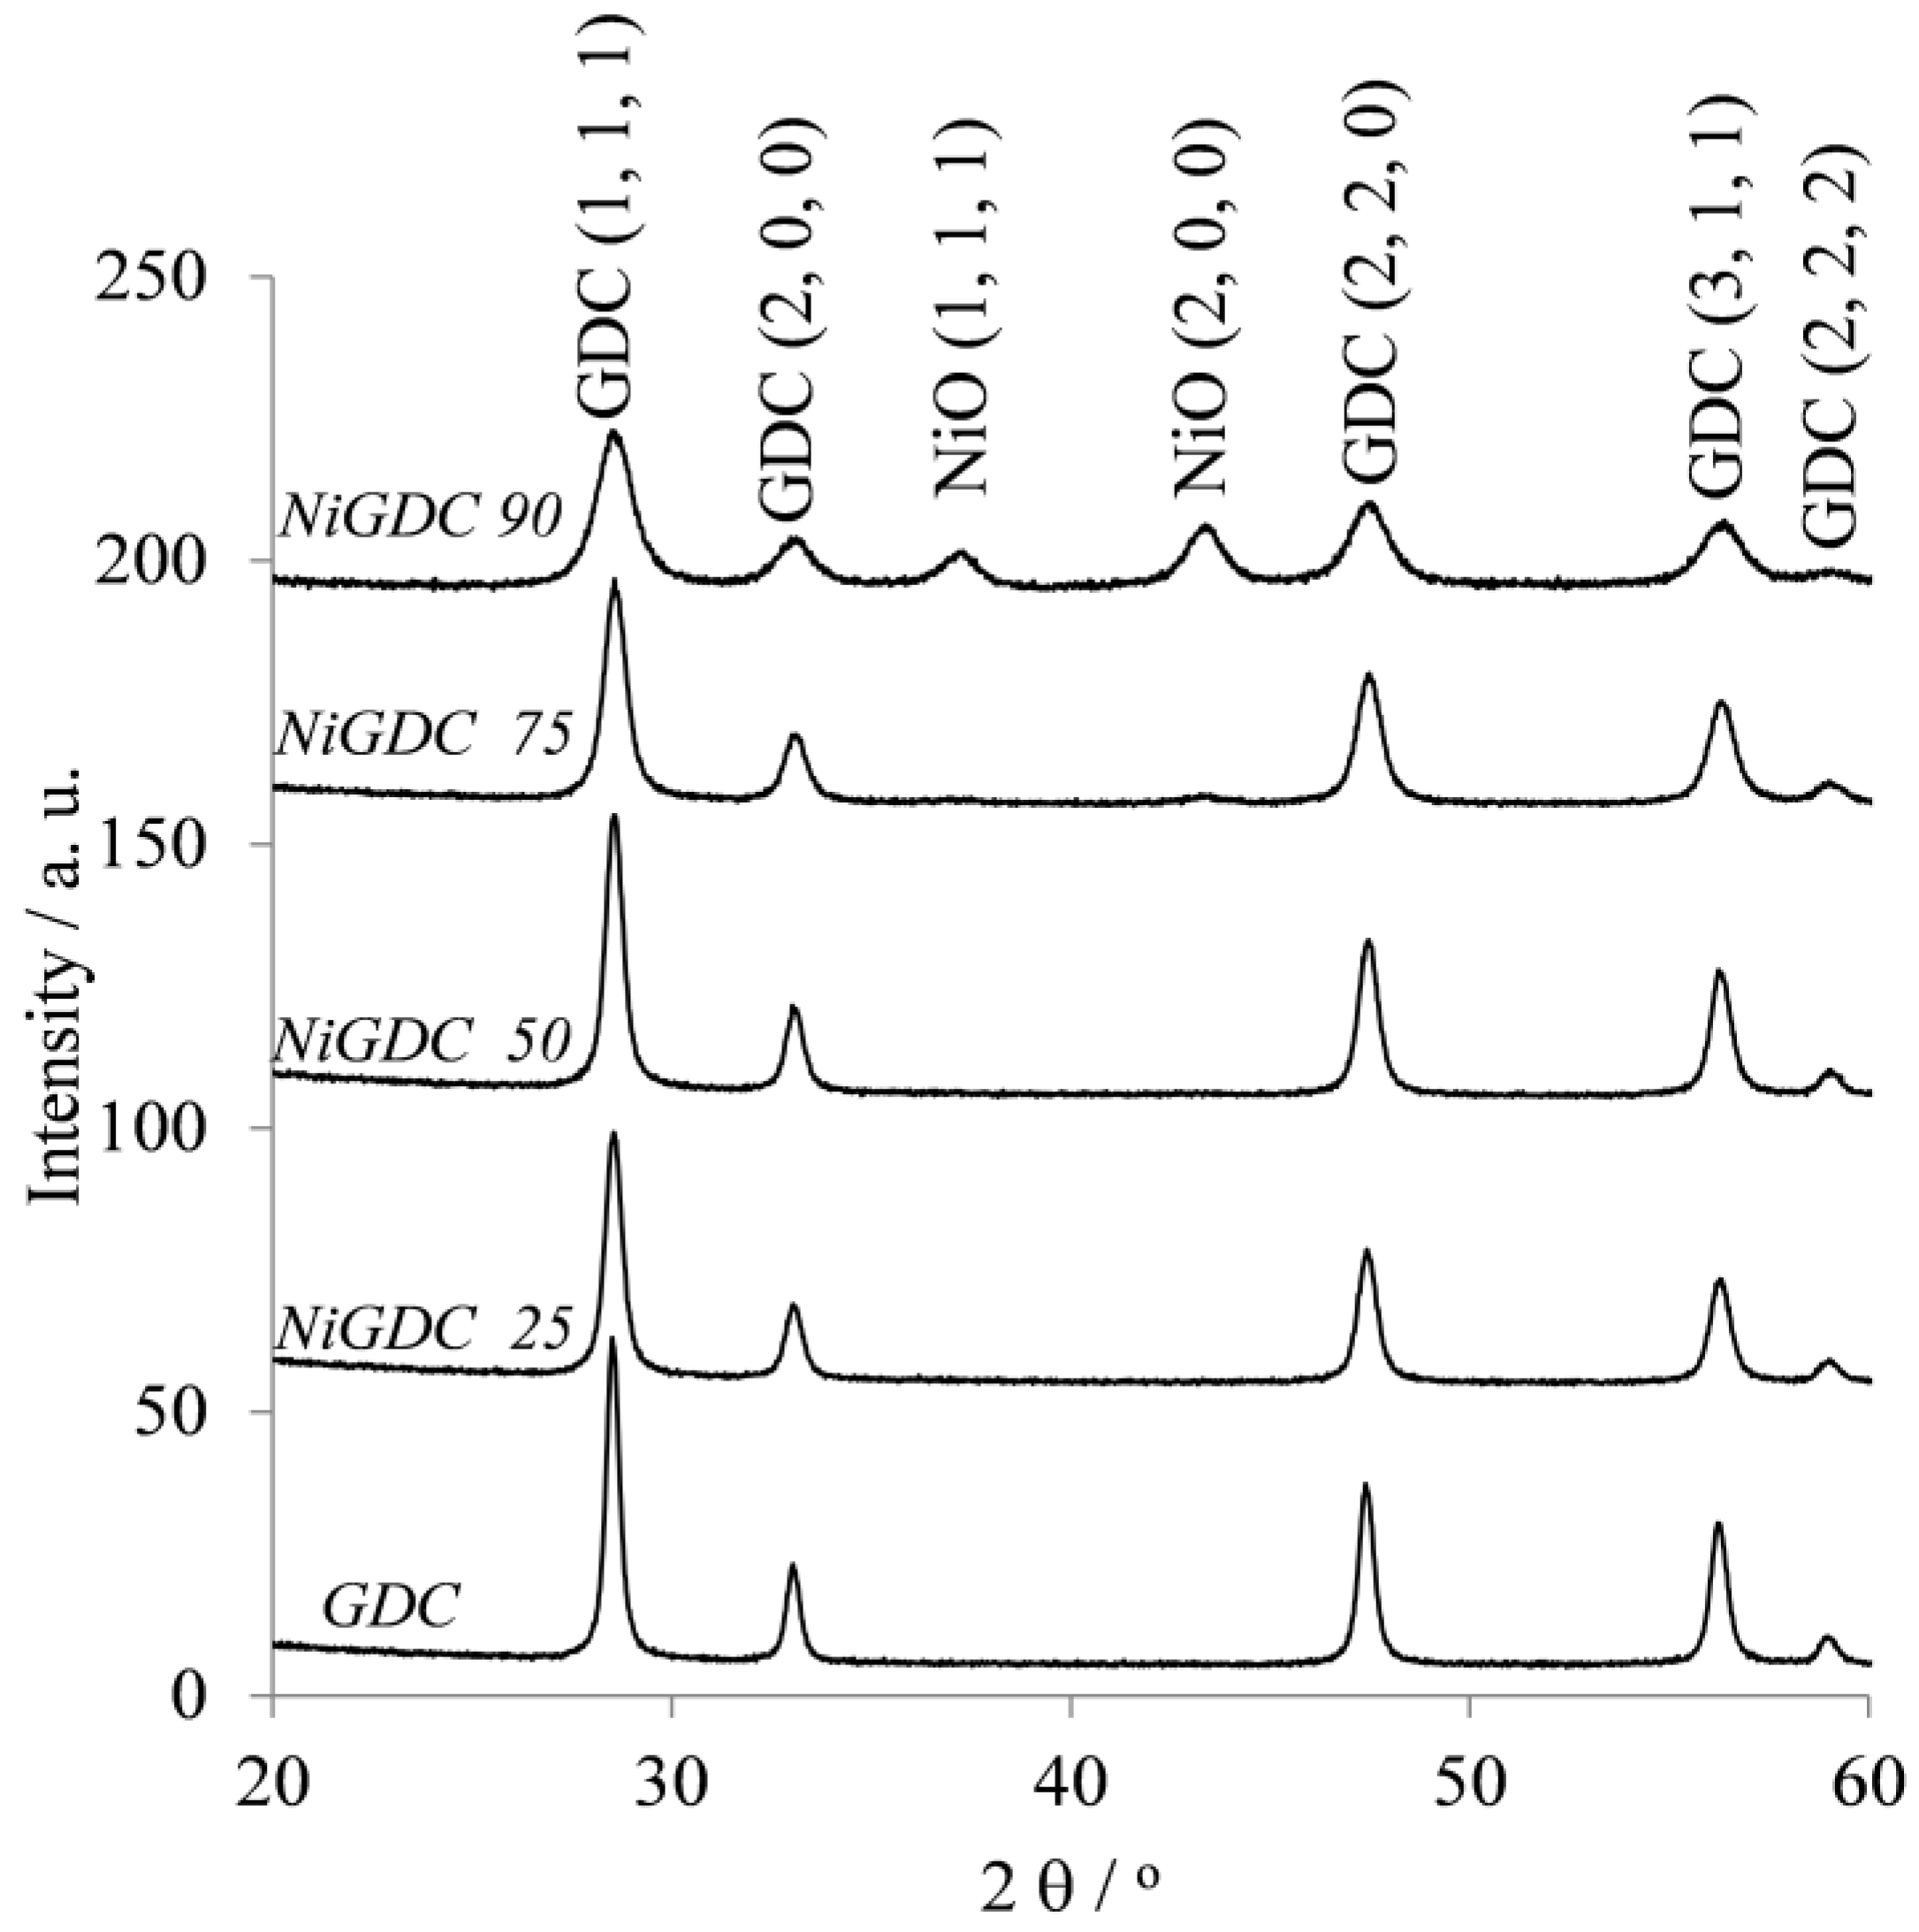
The catalyst materials obtained after the calcination at 750 °C of the loaded resin were analyzed by X-ray diffraction (XRD,
Figure 2). The lattice parameters, crystallite size, and strain of NiO and GDC were calculated based on the XRD patterns (
Supplementary Materials, Table S1). In all catalysts, a first set of peaks could be observed, which can be attributed to a single crystal fluorite-type structure with a lattice parameter between 5.4235 and 5.4280 Å. This value is higher than that for CeO
2 (5.411 Å [
15]), which could be attributed to the substitution of CeO
2 by Gd
2O
3 in the catalyst support [
12,
16].
These results, together with the previous ICP-AES analysis (
Figure 1), confirm not only the presence of Gd in the structure of the materials, but also that the calcination procedure achieved a solid solution between Ce and Gd oxides, leading to a GDC material with a Ce/Gd ratio of ~3–4 depending on the sample (
Figure 1b). In addition, diffraction peaks corresponding to NiO crystallites were observed in samples with high Ni loading (NiGDC 75 and NiGDC 90).
On the other hand, GDC and NiO crystallite sizes were estimated (
Supplementary Materials, Table S1). It is worth noting that, for the sample NiGDC 90, both GDC and NiO exhibit a similar crystallite size of around ~10 nm. These results point out that, even for high NiO loadings, the WAR synthesis can produce small NiO particles highly dispersed in the GDC matrix, most likely due to the fact that a homogeneous distribution of metals is obtained after the metal cation fixation in the resin beads. This resulted in a very intimate mixture of oxides after calcination.
The loading of Ni is shown in
Table 1 in a more conventional way. In view of the XRD results, it could be assumed that Ce and Gd formed a GDC fluorite solid solution, and Ni is in its oxidized state (NiO). Hence, the compositions shown in
Figure 1 were recalculated to obtain the weight loading considering Ni in its reduced state (which is the preferred state for methane reforming processes). The results indicate that high loadings (up to 40%) of Ni can be achieved with the WAR method.
The specific surface area (SSA) and pore size were determined by the BET method (
Table 1). All the materials exhibit a mesoporous structure with an average pore size between 16 and 20 nm. The presence of Ni does not lead to a significant SSA modification in samples NiGDC25, NiGDC50, and NiGDC75 (SSA = 13–15 m
2 g
−1), in which the loading of reduced Ni was lower than 10 wt %. However, a significant SSA increase is observed for the highest Ni loading (NiGDC 90, with a loading of reduced Ni ~40 wt %). This seems to indicate that, for high Ni loadings, Ni might behave as a structural promoter, enhancing the SSA of the final material, although further studies should be performed to verify this interesting behavior.
To summarize the main results obtained regarding the first series of materials, the WAR synthesis procedure allowed us to (a) easily control the metal loading with high exchange efficiencies (higher than 80%), (b) develop Ni/GDC materials by a once-through procedure, with the simultaneous ionic exchange of all the metallic ions involved in the catalyst formulation (Ni2+, Ce3+ and Gd3+), (c) obtain a CeO2/Gd2O3 fluorite solid solution with a Ce/Gd ratio of ~3–4, and (d) produce small NiO crystallites regardless of the high Ni loadings in the GDC matrix (up to 40 wt %). However, even the material with the highest SSA exhibited a rather small SSA, <26 m2 g−1.
In order to enhance the structural parameters of these novel materials, the catalyst with the highest SSA (NiGDC 90) was treated in an HNO
3 solution (
Supplementary Materials, Section 1.2). The idea of this procedure was to selectively dissolve part of the NiO in this material to enhance the SSA [
10].
Hence, a new series of catalytic materials was prepared, with different degrees of NiO partial dissolutions. First, a new NiGDC 90 material was synthesized following the previously described WAR method [
9]. In this case, a greater amount of acrylic resin (40 mL in NH
4+ form, vs. 8 mL used in the first series of materials) was exchanged with the desired cationic species (Ni
2+, Ce
3+, and Gd
3+).
Figure S2 and Table S2 (Supplementary Materials) show the structural properties (TGA/DSC, ICP-AES, and SSA) of the new NiGDC 90 material and the NiGDC 90 catalyst prepared in the first series of experiments. Both materials exhibit almost identical properties, which indicates the satisfactory reproducibility of the WAR synthesis method used in this study.
Using the new NiGDC 90 catalyst as starting material, several partial dissolutions of the NiO were performed using stoichiometric amounts of HNO
3 (
Supplementary Materials, Section 1.2). This way, four samples were prepared, in which 25%, 50%, 75%, and 100% NiO were dissolved, denoted as Dis 25, Dis 50, Dis 75, and Dis 100, respectively.
First, the HNO
3 solutions after this procedure were analyzed by ICP-AES analysis (
Supplementary Materials, Figure S3a). It could be observed that the concentrations of Ce and Gd in the solution were negligible compared to that of Ni (a difference of 1–2 orders of magnitude). In addition,
Figure S3b shows that the concentration of Ni in the solution was almost exactly the expected concentration according to the stoichiometric dissolution of NiO in HNO
3. These results clearly demonstrated that this simple procedure allows to easily control the selective partial dissolution of NiO [
10] and therefore to adjust the Ni loading of these materials.
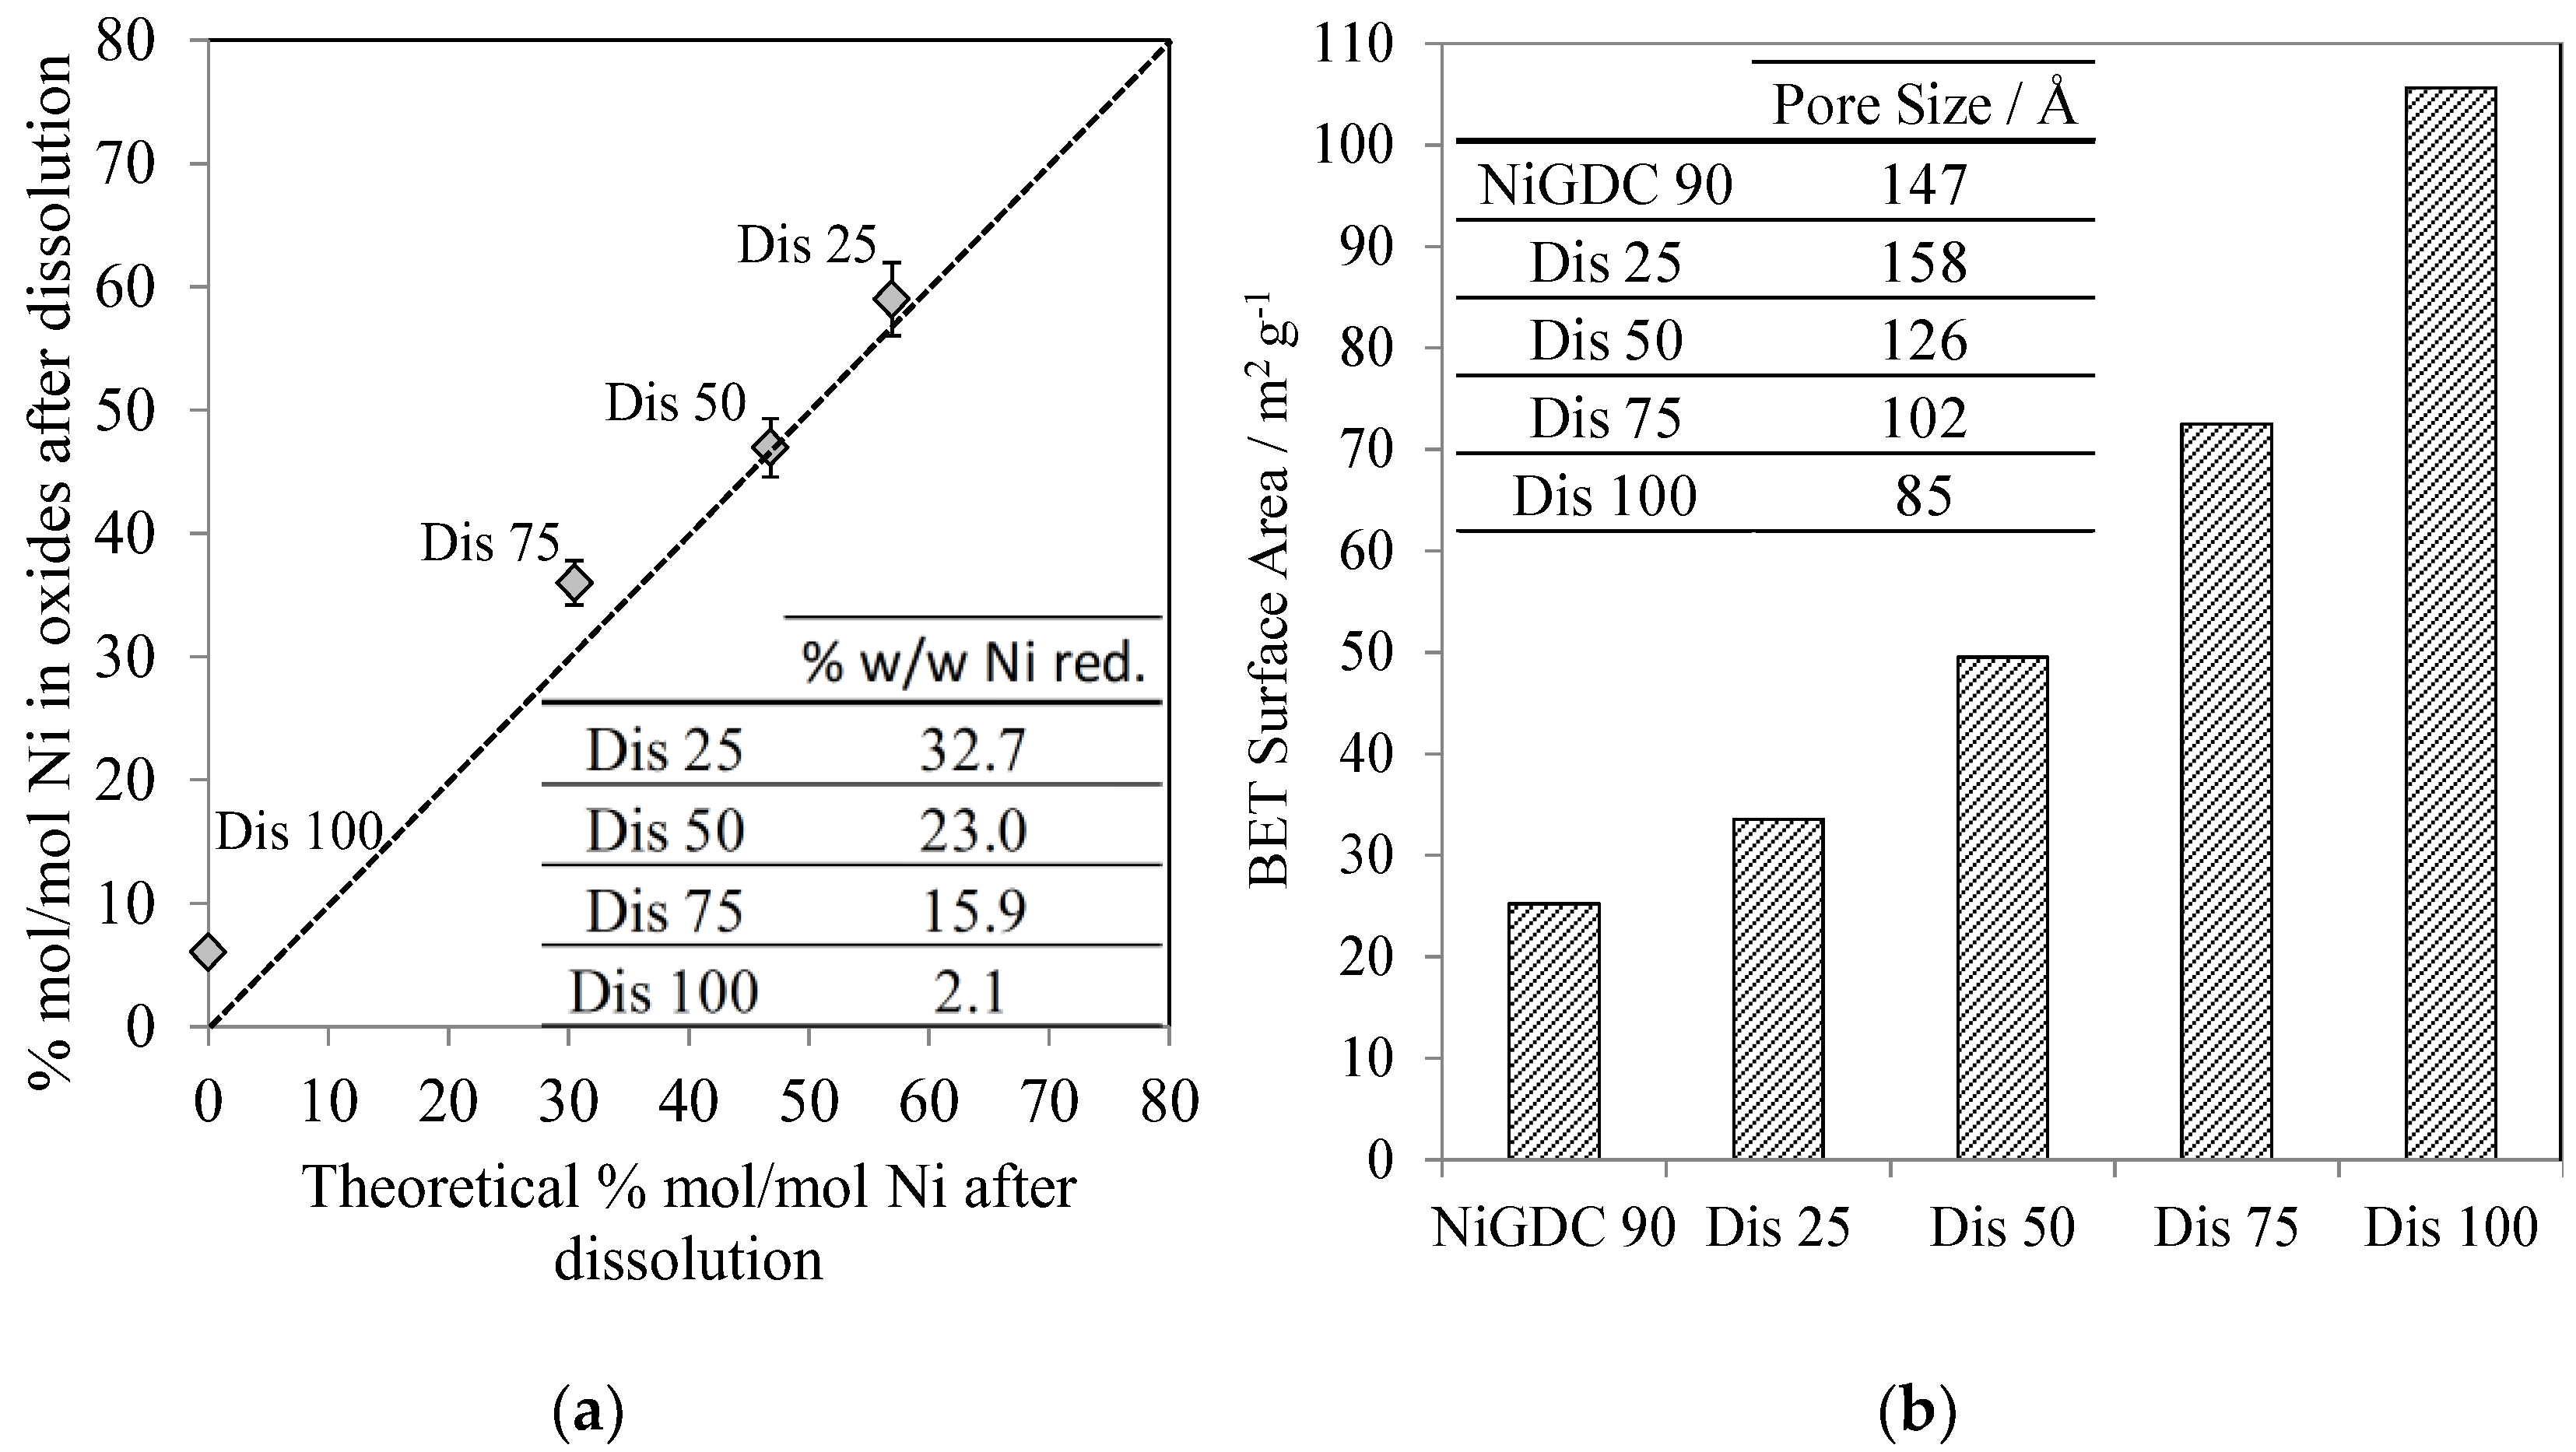
In addition, a small amount of the solid materials obtained after partial dissolution, filtering, washing, and drying (
Supplementary Materials, Section 1.2) was dissolved and then analyzed via ICP-AES (
Figure 3a). First of all, it could be observed that the final loading of the materials was fairly similar to the theoretical loading assuming the stoichiometric dissolution of NiO. In addition, the table inset in
Figure 3a shows the Ni weight loading if Ni were reduced (as previously demonstrated in
Table 1) on GDC. A wide variety of Ni loadings were achieved, varying from 2 (sample Dis 100) to 33 wt % (sample Dis 25).
The obtained solid materials were also analyzed by XRD (
Supplementary Materials, Figure S4 and Table S1). As previously observed, for all these materials, a first set of diffraction peaks is characteristic of GDC fluorite structure, with lattice parameters from 5.4214 to 5.4246 Å. In addition, NiO peaks were observed. It is worth noting that the crystallite sizes of GDC and Ni (~10 nm) are not modified in a significant way after the HNO
3 dissolution procedure.
The SSA of this new series of materials was analyzed by the BET method (
Figure 3b). The SSA strongly increased from 25 (starting material, NiGDC 90, with a Ni loading of 37% w/w), to 105 m
2 g
−1 (Dis 100, with a Ni loading of 2% w/w).
These results clearly demonstrate, for the first time, that the whole synthesis procedure (WAR + partial NiO dissolution) leads to the production of NiO/GDC materials with high Ni loadings, small Ni crystallite sizes, and high SSAs without modifying the GDC structure. For instance, the materials called Dis 50 and Dis 75, with Ni loadings of 23 and 16% w/w, respectively, exhibit high SSAs of ~50 and 72 m
2 g
−1, respectively. These values are much higher than those previously reported for Ni/GDC catalysts with loadings around 10 wt % [
6,
8].
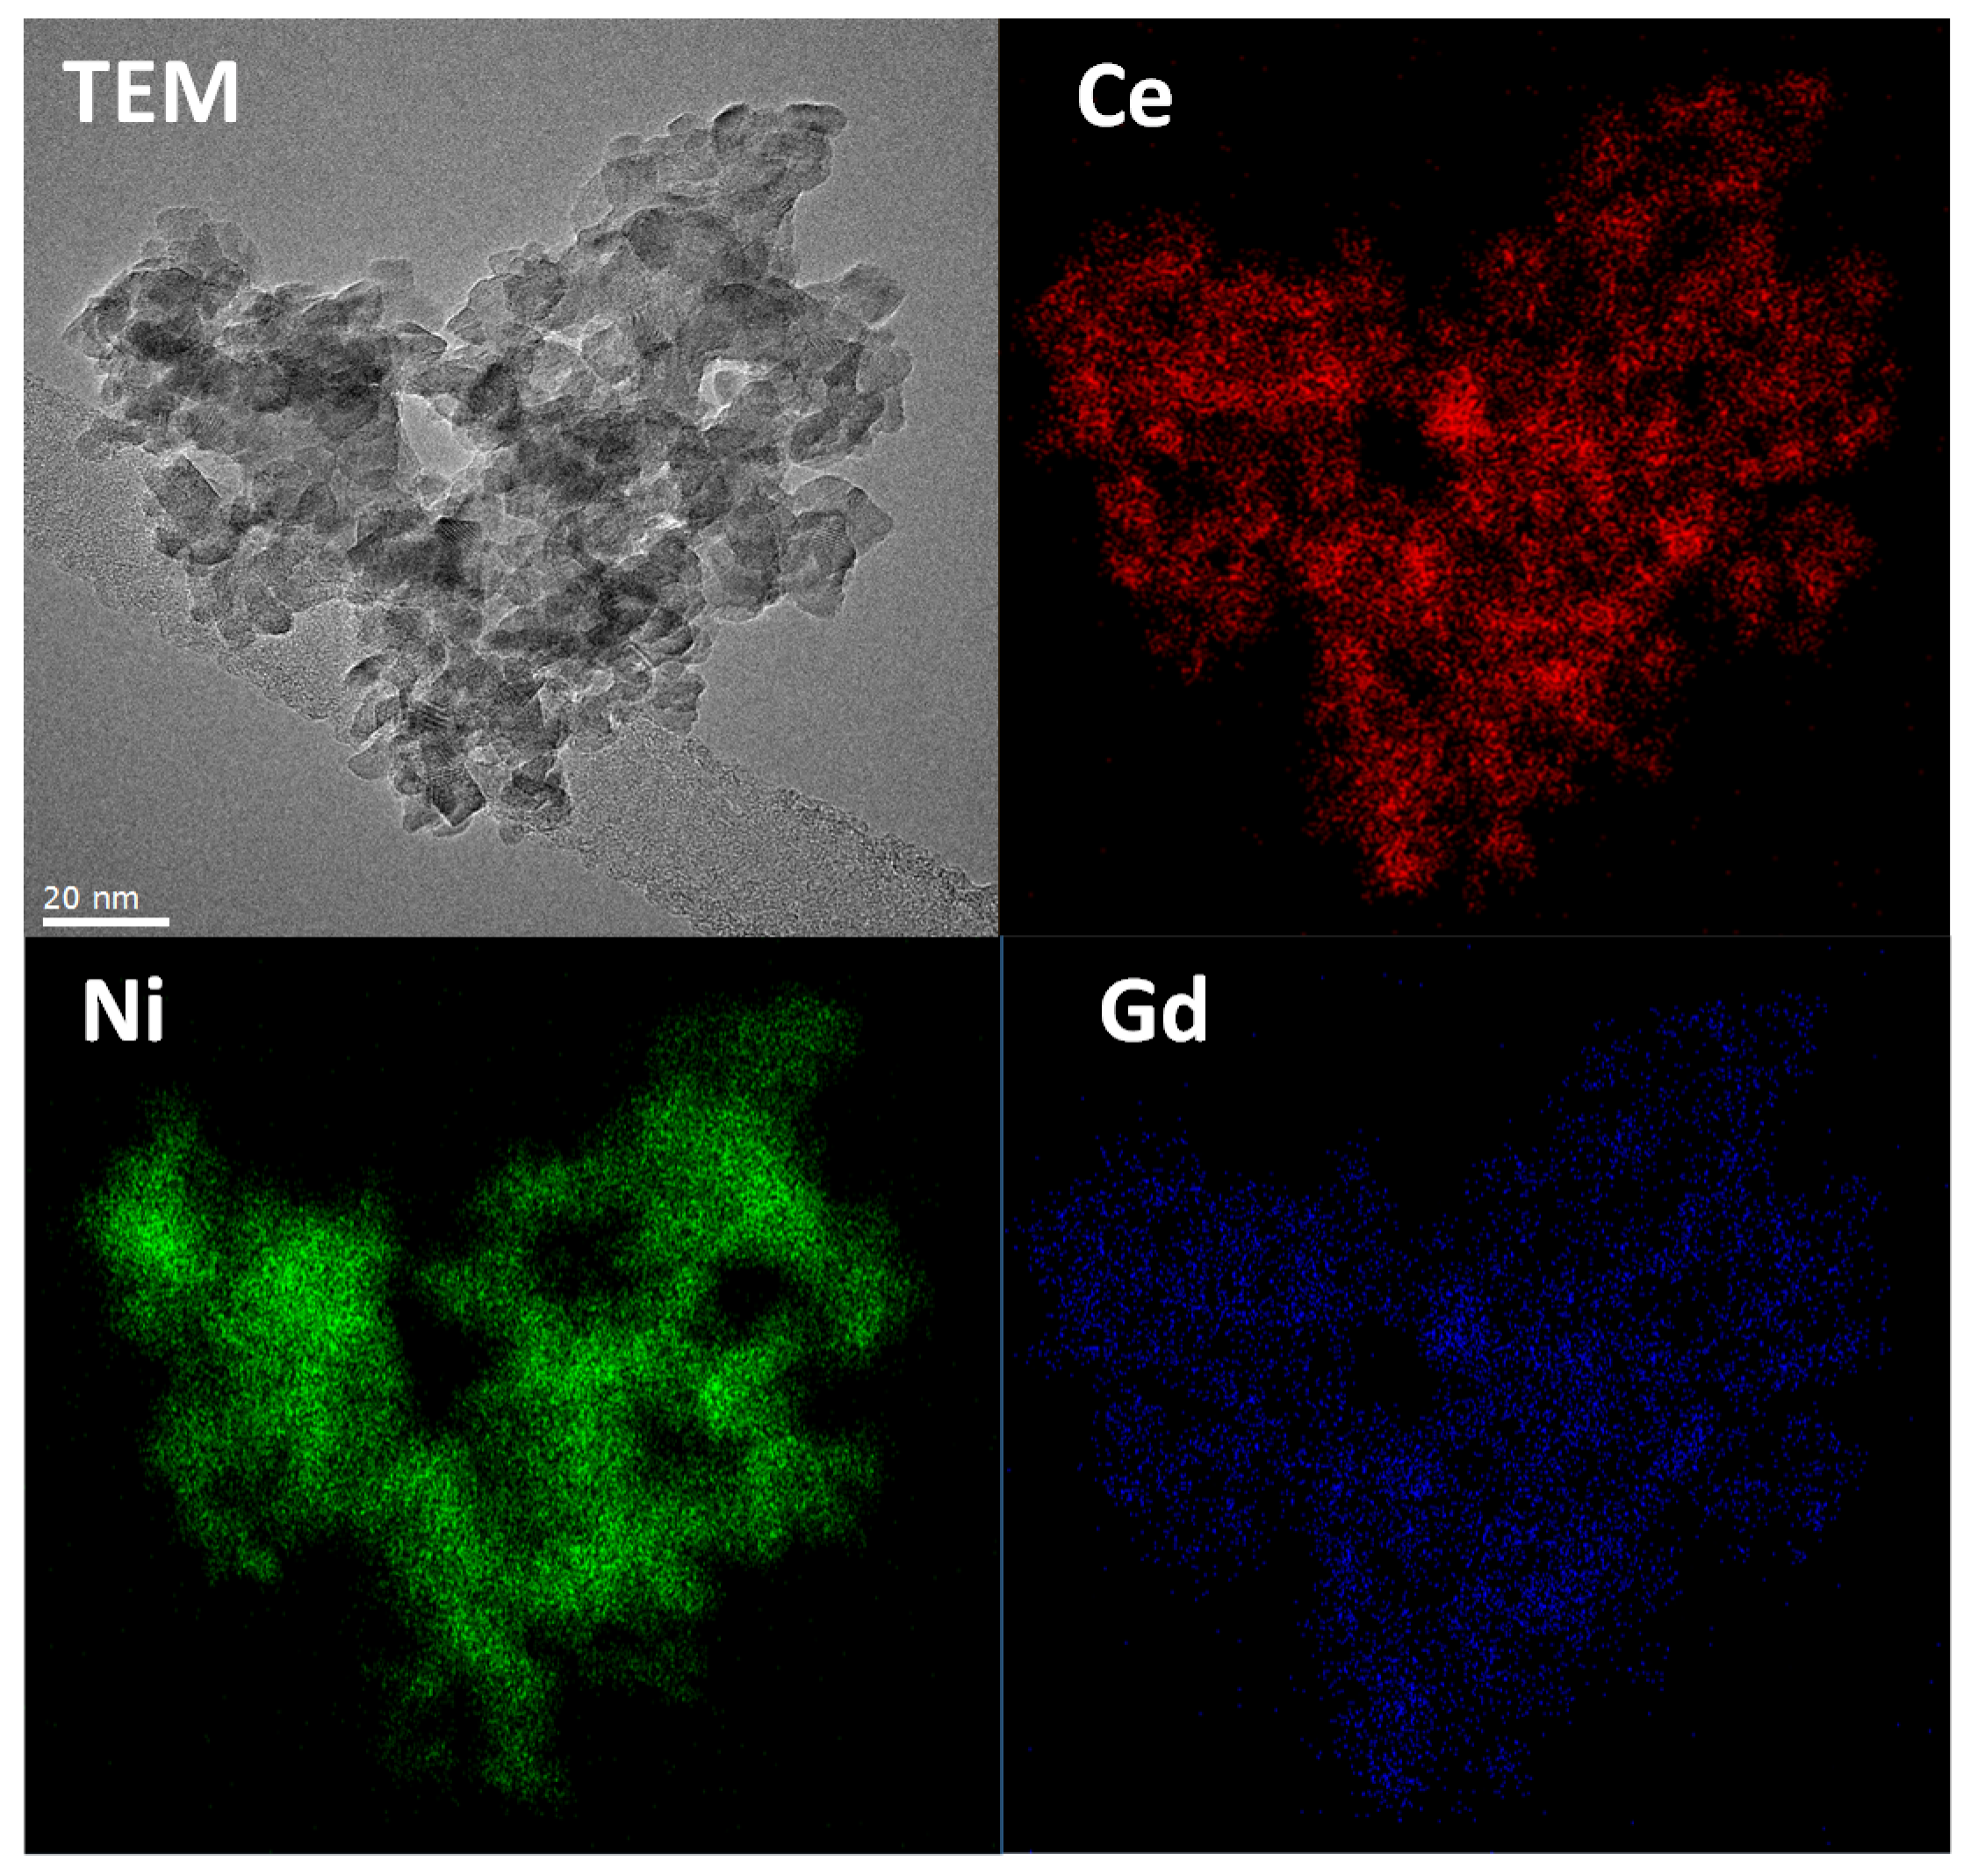
Finally, TEM measurements were carried out on the Dis 50 sample as a representative example (
Figure 4). The presence of Ce, Gd, and Ni was confirmed by EDX analysis (Energy-dispersive X-ray spectroscopy). EDX mappings of the different elements have clearly shown that the catalyst is very homogeneous, containing well dispersed NiO nanoparticles in the GDC matrix. In addition, in good agreement with the XRD measurements, both GDC and NiO nanoparticles exhibit a small particle size (6–10 nm). Additional TEM images and EDX and FFT analysis are shown in
Figures S5 and S6 and Table S3 (Supplementary Materials), confirming the presence, distribution, and low size of the NiO nanoparticles on the GDC support.

 ,
, 
