Article

Production of Thermostable T1 Lipase Using Agroindustrial Waste Medium Formulation

by
Hisham Mohd Nooh
1,2,
Malihe Masomian
2,3,
Abu Bakar Salleh
1,2,4,
Rosfarizan Mohamad
5,6,
Mohd Shukuri Mohamad Ali
2,4 and
Raja Noor Zaliha Raja Abd Rahman
1,2,3,*
1
Laboratory of Molecular Biomedicine, Institute of Bioscience, Universiti Putra Malaysia, 43400 UPM, Serdang, Selangor, Malaysia
2
Enzyme and Microbial Technology Research Centre, Faculty of Biotechnology and Biomolecular Sciences, Universiti Putra Malaysia, 43400 UPM, Serdang, Selangor, Malaysia
3
Department of Microbiology, Faculty of Biotechnology and Biomolecular Sciences, Universiti Putra Malaysia, 43400 UPM, Serdang, Selangor, Malaysia
4
Department of Biochemistry, Faculty of Biotechnology and Biomolecular Sciences, Universiti Putra Malaysia, 43400 UPM, Serdang, Selangor, Malaysia
5
Institute of Tropical Forestry and Forest Products, Universiti Putra Malaysia, 43400 UPM, Serdang, Selangor, Malaysia
6
Department of Bioprocess Technology, Faculty of Biotechnology and Biomolecular Sciences, Universiti Putra Malaysia, 43400 UPM, Serdang, Selangor, Malaysia
*
Author to whom correspondence should be addressed.
Catalysts 2018, 8(11), 485; https://doi.org/10.3390/catal8110485
Submission received: 19 September 2018 / Revised: 10 October 2018 / Accepted: 15 October 2018 / Published: 23 October 2018
(This article belongs to the Special Issue Biocatalysts: Design and Application)

Abstract

:
Large-scale production of T1 lipase using conventional culture media is costly. To reduce the cost of production, an alternative growth medium using local resources has been developed. In this study, the growth of recombinant Escherichia coli and expression of T1 lipase were tested using different agroindustrial wastes as carbon and nitrogen sources by conventional method. Subsequently, by using central composite rotatable design (CCRD), a set of 30 experiments was generated to evaluate the effect of different parameters, including the amount of molasses (as carbon source), fish waste (as nitrogen source), NaCl, and inducer concentration on production of T1 lipase. Response surface methodology (RSM) analysis indicated that all factors had significant effects on T1 lipase production. This statistical analysis was utilised to develop a quadratic model to correlate various important variables for the growth of the recombinant strain and regulation of gene expression to the response (T1 lipase activity). Optimum conditions for T1 lipase production were observed to be 1.0 g/L of molasses, 2.29 g/L of fish waste, 3.46 g/L of NaCl, and 0.03 mM of IPTG (Isopropyl β-d-1-thiogalactopyranoside). Based on these conditions, the actual lipase activity was found to be 164.37 U/mL, which fitted well with the maximum predicted value of 172.89 U/mL. Therefore, the results demonstrated that, the statistical analysis, performed using RSM, was efficient in optimising T1 lipase production. Moreover, the optimum conditions obtained can be applied to scale up the process and minimise the cost of enzyme production.

1. Introduction

Lipases (triacylglycerol acylhydrolase, EC 3.1.1.3) are comprised of a large group of enzymes which differ in substrates specificity and regioselectivity. They hydrolyse triglycerides at the oil–water interface to produce fatty acid, partial acylglycerols, and glycerol [1]. Lipases also catalyse esterification, and transesterification [2]. There are many applications of lipases in industry, especially in biodiesel production. They are also useful in lipolysis with specific application domains, including the manufacture of dairy, oil and fat, food and flavour, bioremediation, and production of leather products [2,3,4].
In industry, lipases are produced through microorganism cultivation. Lipases are often produced by bacteria, yeast, and fungi. Considering that most biotechnological product processes need a lot of capital, thus, obtaining an optimum yield of product at the lowest expense through low-cost material usage is vital [5]. Besides, only very small quantities of enzymes are usually produced by microorganisms natively, and expensive raw materials are near to 30% of the total production expenditure. This explains the reason that most of the marketable enzyme-based products are costly. Hence, it is crucial to decrease the production costs when producing lipase through the use of economical and renewable medium components. This can be achieved by using low-cost culture media, derived from agroindustry residues, so as to make the production cost economically viable.
Agroindustrial wastes are generated through agricultural industry activities, and they are no longer useful in agriculture land, factories, refineries, mills, poultry houses, and slaughterhouses. Agroindustrial waste and complex organic residues, such as molasses and oil palm biomass, constitute a significant source of residual nutrients which can be growth media for microorganisms that able to produce lipases. Molasses, a by-product of sugar refinery and oil palm biomass, are rich with carbon sources which can be used in production medium. Fish processing wastes, obtained from the marine industry, such as whole waste fish, fish head, viscera, skin, bones, blood, frame liver, gonads, guts, and some muscle tissues, can be applied as nitrogen sources [6,7,8].
In order to produce high yields of lipase at lower production costs, a new medium formulation from cheaper sources, that is also readily available, is very much needed. Designing an optimum media composition in fermentation processes is crucial, as it strongly affects the final product concentration. To the best of our knowledge, this is the first report on a medium formulation using the agroindustrial waste, molasses (as carbon source), and fish waste (as nitrogen source) for thermostable T1 lipase production by recombinant Escherichia coli BL21 (DE3) pLysS. The aim of this study was to attain the best system performance for lipase production by statistically optimising the medium compounds and their concentrations. Response surface methodology was carried out to understand the relationship between several reaction variables (molasses, fish waste, NaCl, and IPTG concentration) and the response (T1 lipase activity).
The growth of recombinant E. coli and expression of T1 lipase were tested using different agroindustrial wastes as carbon and nitrogen sources by conventional method. Subsequently, by using central composite rotatable design (CCRD), a set of 30 experiments was generated to evaluate the effect of different parameters including the amount of molasses (as carbon source), fish waste (as nitrogen source), NaCl, and inducer concentration on production of T1 lipase.
Traditionally, optimisation has been carried out using a conventional (one-variable-at-a-time) method, but it is time consuming and unable to show the response of different variable interactions in the experiment [9]. Therefore, optimisation of the production using a multivariate statistical method could provide an alternative to the conventional method. Response surface methodology (RSM) is a collection of mathematical and statistical methods for designing experiments, building models, evaluating the effect of variables, and obtaining the optimum conditions using a minimal number of experiments [10]. Therefore, the number of experimental trials needed to analyse the interaction between multiple variables can be reduced. Also, the cost and time required would be reduced, which make it beneficial and desirable for industrial applications.

2. Results and Discussion

2.1. Analysis of Agroindustrial Wastes in Relation to Carbon and Nitrogen Sources

All waste samples were analysed using anthrone and Kjeldahl analyses (Table 1). A high amount of sugar was detected in molasses. No sugar was detected in other waste samples, except fish waste and mature coconut water, but with very low sugar content (glucose). On the other hand, Kjeldahl analysis indicated higher nitrogen content (19.08%) in fish waste compared with other waste samples. Molasses and mature coconut water did not show any positive results for nitrogen source analysis. Therefore, molasses and fish waste were selected for further optimisation study as carbon and nitrogen sources, respectively. Lee et al. [11] exploited molasses as a sole carbon source in the production of lactic acid by Lactobacillus salivarius L29, along with corn steep liquor as a nitrogen source. The research showed that the medium with new formulation was significantly more economical than conventional broth for lactic acid production.
However, the findings of the present study did not show similar carbon or nitrogen content, compared with the reported waste samples that had been studied by other researchers [12,13,14], on the production of recombinant protein using mature coconut water samples taken from different sites. The results showed inconsistency of carbon and nitrogen contents that exhibited differences in growth rate and the level of protein production by E. coli [15]. The location of waste samples may affect the growth rate and enzyme production by bacteria when the waste samples are supplemented in fermentation media.
So far, this is the first report that uses molasses and fish waste in the medium formulation. For the optimisation study, the concentrations of molasses and fish waste were optimised by one-factor-at-one-time to find the best range of these two compounds for bacterium growth and enzyme production.

2.2. Effect of Molasses Concentration

Table 2 shows the performance and kinetics parameter values of lipase batch fermentation, produced by the E. coli cells harbouring recombinant plasmid pGEX/T1 in a shake flask at different molasses concentrations (1, 2, 3, 4, and 5 g/L). Lipase activity (Pm) is growth-associated (Xm), which was supported by carbohydrate consumption (Sm). The results showed that parameters differed significantly at the different tested initial molasses concentrations. The acetate (A) concentration was higher (0.75 g/L) in the culture using 2 g/L of molasses, but lower than the inhibition range (5.3–9.8 g/L) that inhibited cell growth and enzyme production [16]. Furthermore, in fermentation medium using 2 g/L of molasses, higher cell yield (YX/S) (0.28 g/g), lipase yield (YP/S) (3.64 U/g), and cell productivity (YP/X) (13.11 U/g) were achieved. However, the lowest YX/S (0.22 g/g) was observed using 4 g/L of molasses, which differed significantly with respect to the other molasses concentrations. The values of YP/S were also significantly different at various molasses concentrations. The lowest YP/S (1.81 g/g) was obtained at 5 g/L of molasses, which was a higher initial amount of molasses used in the fermentation medium. A higher specific growth rate (μmax) was observed at 2 g/L of molasses (0.47 h−1), but the value was not significantly different from μmax observed upon fermentation with 1 g/L of molasses (0.46 h−1). The smallest μmax (0.21 h−1) was obtained using 5 g/L of molasses in the fermentation medium. The specific lipase production rate (qP) and specific carbohydrate consumption rate (qS) values were significantly different at various molasses concentrations. Higher qP (8.19 U/g/h) and qS (1.24 g/g/h) were obtained at 2 g/L of molasses, while the lowest values for qP (3.76 U/g/h) and qS (0.88 g/g/h) were obtained using 5 g/L of molasses in the fermentation medium.

2.3. Effect of Fish Waste Concentration

The performance and kinetics parameter values of lipase batch fermentation, produced by the E. coli cells harbouring recombinant plasmid pGEX/T1 in a shake flask at different fish waste concentrations (1.91, 2.29, 2.67, 3.05, 3.43, 3.82, 4.20, and 4.58 g/L), were summarised in Table 2. The values of cell concentration (Xm), lipase activity (Pm), and carbohydrate consumption (Sm) were significantly different at various initial fish waste concentrations, used in lipase fermentation by the recombinant E. coli (Table 3). Higher values of Xm, Pm, and Sm were observed at 2.29 g/L of fish waste. Whereas, a higher concentration of fish waste recorded lower values of Xm, Pm, and Sm. Unlike molasses concentration, the amount of acetate, accumulated in the best concentration of fish waste (2.29 g/L), was lower compared with the other concentrations. The lipase yield (YP/S) and cell productivity (YP/X) were found to be significantly different at various fish waste concentrations. The highest value of YP/S (4.0 U/g) and YP/X (12.5 U/g) were observed at 2.29 g/L fish waste, while the lowest YP/S (2.518 U/g) and YP/X (7.6 U/g) were obtained at 4.58 g/L fish waste.
Higher specific growth rate (μmax) (0.431 h−1) and specific lipase production (qp) (2.669 U/g/h) were observed at 2.29 g/L fish waste, but not significantly different from the μmax and qp, calculated during fermentation with 1.91, 2.67, and 3.05 g/L of fish wastes. The values of specific carbohydrate consumption rates (qS) were statistically different at various fish waste concentrations. The higher value of qS (3.373 g/g/h) was obtained at 2.29 g/L fish waste, but the least value of the qS (2.300 g/g/h) was observed when using 4.58 g/L of fish waste. Regarding the above results, for RSM, molasses in the range of 1.0 to 4.0 g/L, and fish waste in the range of 1.43 to 2.29 g/L, were evaluated.

2.4. Model Fitting and Analysis of Variance (ANOVA)

In order to obtain a proper model for optimisation of T1 lipase production, CCRD, that produced the best design for response surface optimisation with four factors and five levels, was selected for molasses, fish waste, NaCl, and IPTG concentrations. The molasses, fish waste, and NaCl were a substitute for commercial Luria-Bertani (LB) broth, whereas the inducer, IPTG, regulated the gene expression at transcription level. The predicted value was obtained using a model-fitting technique, and the experimental data were shown in Table 4. Among the various medium formulations, a higher lipase activity was observed to be 200.28 U/mL at 1.0 g/L of molasses, 1.86% of fish waste, 4.50 g/L of NaCl, and 0.06 mM IPTG concentration, whereas the least lipase activity was found to be 30.81 U/mL at 2.50 g/L of molasses, 1.86 g/L of fish waste, 2.50 g/L of NaCl, and 0.02 mM IPTG concentration.
The results showed that T1 lipase activity was more appropriately described using a quadratic polynomial model, as shown in Equation (1). Fitting of the data to the various models (linear, two factorial interaction, quadratic, and cubic) and their subsequent ANOVA indicated that the model-fitting technique was sufficiently correlated to the actual values.
Lipase Activity = + 151.08 + 5.24A + 16.94B + 4.21C + 12.98D − 16.59AB + 7.43AD − 11.34BC − 11.12BD + 24.92CD − 14.89B2 − 26.75C2 − 15.53D2 + 11.42ABC
in which molasses, fish waste, NaCl and inducer (IPTG) are A, B, C and D, respectively.
Fit-quality of the yield model was confirmed by the analysis of variance (ANOVA), as shown in Table 5. The ANOVA analysis of the optimisation study indicated that B, D, AB, CD, B2, C2, D2, and ABC were significant models in term of T1 lipase production (Prob ˃ F was less than 0.05). The positive sign before each term indicated a synergistic effect, while the negative sign indicated an antagonistic effect. Negative values of coefficient estimated denote negative influence of parameters on the reaction yield. According to the ANOVA of factors, the computed F-value of the model is 15.03, implying that the model is significant, while the lack of fitness is 0.0822, which is not significant relative to the pure error. The significant model and non-significant lack of fitness indicate good model fitness. The fitness between the developmental model and experimental data can be determined based on the coefficient value (R2). In this case, the R2 value is equal to 0.9607. Normally, a regression model with R2 value above 0.9000 is considered a model of high correlation [17]. Furthermore, a study by Hamzaoui et al. [18] stated that a better empirical model, that fits the actual data, can be obtained when R2 is close to unity value. Hence, the high value of R2, obtained in this regression model, indicates a good agreement between the predicted and actual yields of T1 lipase production.
The ANOVA for the model was demonstrated in Table 5. The computed F-value of the model (15.03) implies that the model is significant, while the lack-of-fit F-value of 11.49 shows that lack-of-fit is not significant relative to the pure error. The model of F-value was identified as significant if the p-value (<0.0001) was less than 0.05. According to Bezerra et al. [19] significant regression and a non-significant lack-of-fit presented in the model was well fitted to the experiments. Figure 1 shows the best correlation between the actual and predicted T1 lipase activities. The linear distribution was indicative of a well-fitted model. The generated models were employed to study the effects of various parameters and their interactions on the yield of the reaction.

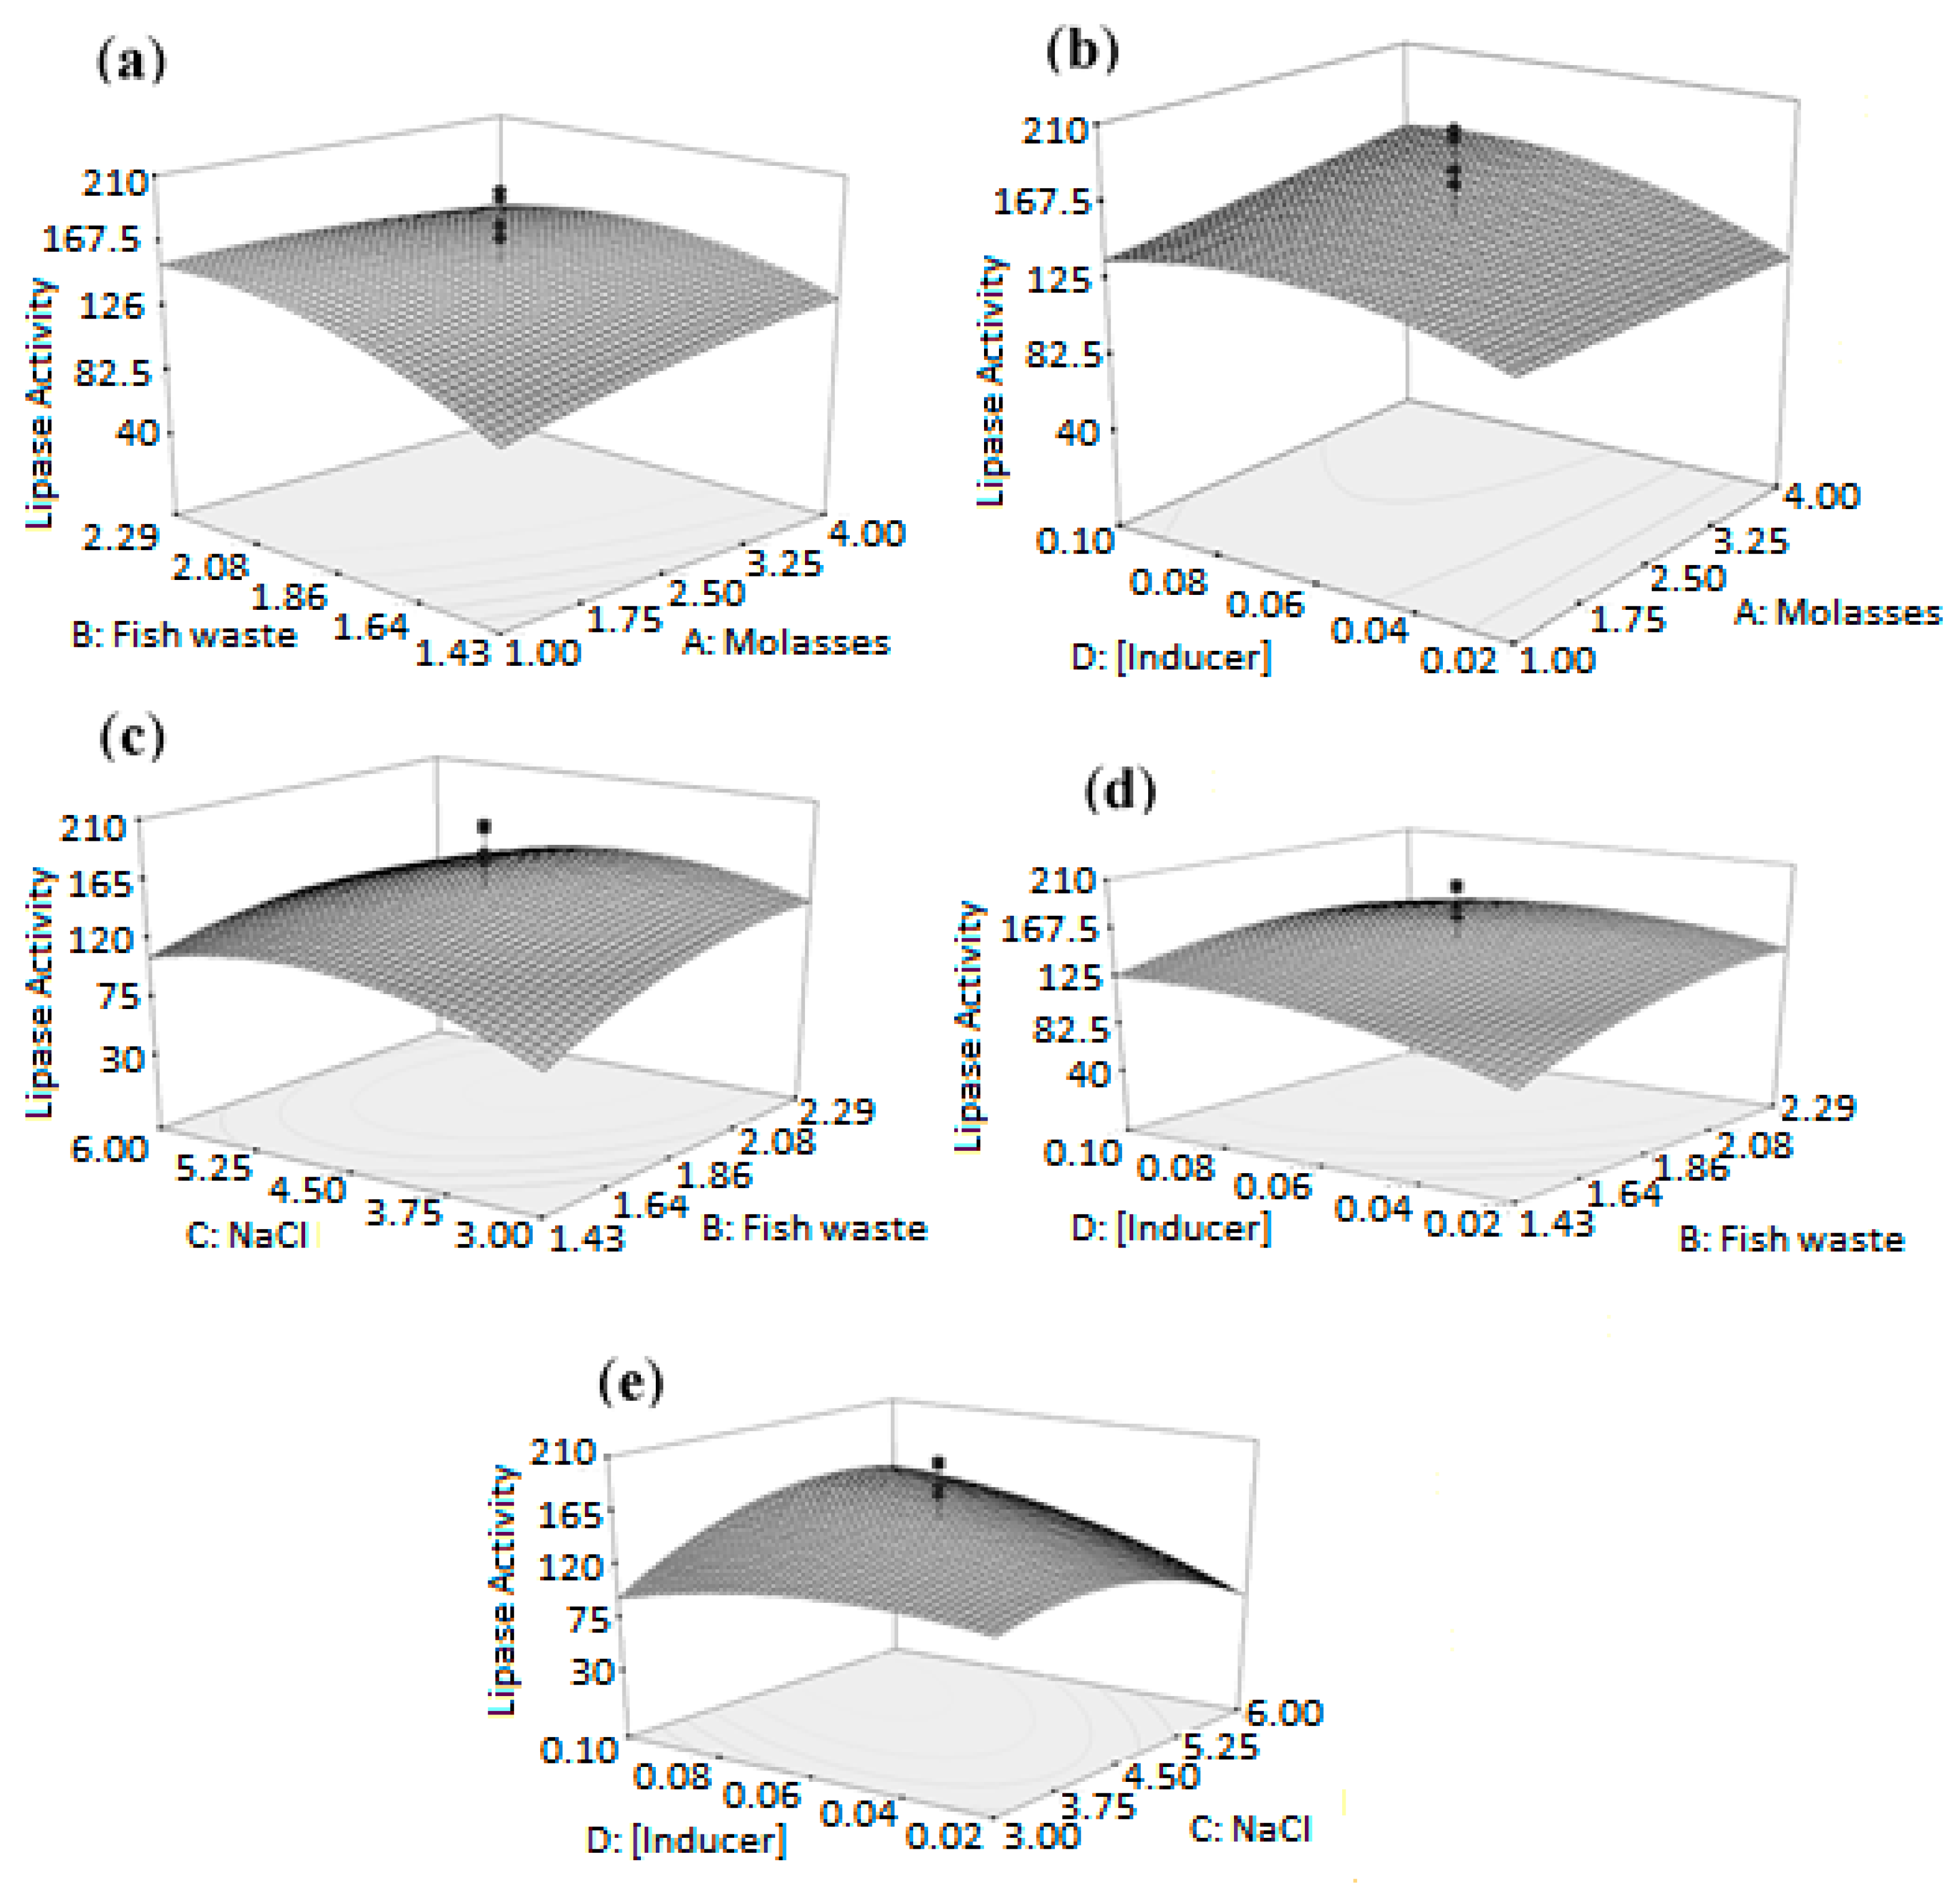
2.5. Effect of Parameters on T1 Lipase Production

The relationship between reaction parameters and response can be understood by studying the three-dimensional (3D) response surface plots, generated from the predicted quadratic model. The 3D response surface plot can also be used to determine the optimum level of each variable for T1 lipase activity. While maintaining other variables at their optimal level, the z-axis (refer to T1 lipase activity) against any two variables was constructed in the response surface plot.
The results in Figure 2a showed that the amount of molasses and fish waste were interpreted in the range of 1–4 g/L and 1.43–2.29 g/L, respectively, with the amount of NaCl fixed at 5.0 g/L and 0.09 mM IPTG concentration. At the beginning, the results indicated that increasing the amount of fish waste (>2.10 g/L) did not increase the lipase activity. By contrast, fish waste increased T1 lipase activity, reaching a maximum (158.6 U/mL) when 2.81 g/L of molasses and 2.10 g/L of fish waste were used. This might be due to the excessive amount of fat in fish waste, that could create an inhibitory effect on microbial growth [6].
Figure 2b illustrates the effect of different inducer concentrations and amount of molasses on T1 lipase activity when the amounts of fish waste and NaCl are fixed at 1.86 and 4.50 g/L, respectively. The result showed that maximum T1 lipase activity (167.5 U/mL) was obtained when 3.98 g/L of molasses and 0.08 mM of inducer concentration were used. Molasses is normally rich in many essential nutrients for microbial growth, but also contains several metal ions (calcium, sodium, iron, magnesium, copper, etc.) and suspended colloids which could be toxic or inhibitory for microbial cells [20].
Figure 2c represents the effect of fish waste and NaCl concentration on the production of T1 lipase. The 3D surface was generated with fixed amount of molasses (2.50 g/L) and 0.06 mM inducer concentration with various amounts of fish waste (1.43 to 2.29 g/L) and NaCl (3.00 to 6.00 g/L), to investigate the lipase production. Higher lipase activity (155.9 U/mL) was obtained using 2.11 g/L of fish waste and 4.41 g/L of NaCl (Figure 2c). Abdulkarim et al. [21] reported that high concentrations of sodium ion could result in hyperosmotic shock, that might inhibit glucose transportation and suppress cell growth.
Figure 2d shows the effect of various amounts of fish waste (1.43 to 2.29 g/L) and inducer concentrations (0.02 to 0.10 mM) when the amount of molasses was fixed at 2.50 g/L, and NaCl at 4.50 g/L. Higher T1 lipase activity (156.7 U/mL) was achieved using fish waste and inducer concentrations of 2.07 g/L and 0.07 mM, respectively. The high concentration of IPTG became a burden to the E. coli biological system, and when the IPTG concentration exceeded 0.07 mM, the lipase activity was significantly reduced [22]. Figure 2e represents the effect of different amounts of NaCl (3.00 to 6.00 g/L) and inducer concentrations (0.02 to 0.10 mM) on the production of T1 lipase. The amounts of molasses and fish waste were fixed at 2.50 and 1.86 g/L, respectively. Maximal T1 lipase activity (172.89 U/mL) was obtained when 5.15 g/L NaCl and 0.09 mM inducer were used.

2.6. Optimum Conditions

The model predicted (Table 6) the optimum expression yield of 172.89 U/mL lipase activity by using 1.0 g/L of molasses, 2.29 g/L of fish waste, 3.46 g/L of NaCl, and 0.03 mM IPTG concentration. Using the optimised formulations, the growth curve was analysed to obtain the actual values, which were compared with the predicted values. Boonchaidung and Papone [23] reported that lipase production by isolated soil yeast Candida sp. KU-PH2-15 produced the highest lipase activity at 1.3 U/mL. Ramani et al. [24] reported that using slaughterhouse waste, as a substrate for lipase production from Pseudomonas gessardii, would produce maximum lipase activity at 156 U/mL. Lipase production from dairy effluent-isolated Fusarium solani would produce 73.3 U/mL as maximum lipase activity [25]. Recombinant thermostable lipase, produced by E. coli BL321, has produced 13,000 U/L under strong temperature-inducible λPL promoters [26]. Figure 3 shows that maximum lipase activity is obtained at 13 h (164.37 U/mL), with corresponding absorbance of 2.331 at 600 nm, which indicates higher cell density. However, the maximum protein concentration (1.16 mg/mL) was obtained at 14 h.
Figure 4 shows that the kinetic analysis of product formation based on the Luedeking–Piret equation model has been conducted, and the graph is plotted (dP/dt vs dX/dt), which suggests that it is based on the growth-associated product formation.

3. Materials and Methods

3.1. Bacterial Strain, Media Compound Preparation and Materials

The T1 lipase gene was cloned into pGEX-4T1 vector and propagated into E. coli BL21 (DE3) pLysS (Merck KGaA, Darmstadt, Germany) [27]. A single loop of the recombinant E. coli cell from −80 °C glycerol stock was streaked on LB agar plate, and supplemented with 50 μg/mL ampicillin and 35 μg/mL chloramphenicol, and incubated overnight at 37 °C. A single colony was inoculated into 10 mL of LB broth (10 g/L tryptone, 5 g/L yeast extract, and 10 g/L NaCl) supplemented with the same concentration of antibiotics, incubated at 37 °C with continuous shaking at 200 rpm overnight, and it was then used as starter culture [28].
Different agroindustrial wastes, such as palm oil mill effluent (POME), empty fruit bunch (fruit bunch) (Jengka 3 Palm Oil Factory, Pahang, Malaysia), 5th grade molasses (molasses)(CSR Sugar Refinary, Selangor, Malaysia), mature coconut water, fish processing waste (fish waste) (Pasar Borong Selangor, Selangor, Malaysia), fish hydrolysate (MTDC-UPM, Selangor, Malaysia), influent and effluent of wastewater treatment plants (Indah Water Konsortium, Kuala Lumpur, Malaysia), were collected and used as carbon and nitrogen sources. The molasses was treated using a water extraction method by subjecting the waste sample to cleaning processes through centrifugation. The equal volume of molasses and distilled water was centrifuged at 15,000× g for 30 minutes and autoclaved for 15 min at 121 °C [29]. Empty fruit bunch and fish processing waste were ground and freeze-dried. The samples were weighed, boiled at 100 °C for 30 min, and centrifuged at 15,000× g for 30 min before the supernatant was used in the medium formulation [6,30,31]. All other agroindustrial wastes were autoclaved and exploited as ingredients in the medium formulation. The waste samples were grouped on the basis of carbon and nitrogen source using anthrone total sugar and Kjeldahl total nitrogen analysis, respectively [32,33]. All of the chemicals used in the study were of analytical grade.

3.2. Media Preparation and Cultivation

The modified minimal medium (2 g/L glucose, 1 g/L NH4Cl, 1 g/L KH2PO4, 0.5 g/L MgSO4, and 1 g/L NaCl) was used as control. The agroindustrial wastes that contained carbon (5th grade molasses and mature coconut water) and nitrogen compounds (POME, fruit bunch, fish waste, influent, effluent, and fish hydrolysate) were used to substitute glucose and NH4Cl in the minimal medium, respectively. All fermentation media were seeded with 1% (v/v) of starter culture inoculated into 100 mL of total culture volume in a 500 mL Erlenmeyer flask. The culture was incubated for 12 h at 37 °C with an agitation speed of 200 rpm. All experiments were done in triplicate to ensure consistency of results.

3.3. Determination of Cell Growth

The culture growth was determined by measuring the optical density (OD) at 600 nm after 12 h of culture incubation.

3.4. Determination of Carbohydrate by Anthrone Analysis

The carbohydrate concentration of medium was measured by the method of Loewus [34]. The carbohydrate standard solutions were prepared in five different test tubes, to which distilled water was later added to bring the volume to 1 mL. In each test tube, 4 mL of anthrone reagent was added, and the contents were mixed well and covered. After that, the test tubes were incubated at 100 °C inside the water bath for 10 minutes, and then the test tubes were cooled to reach room temperature. The ODs of the samples were measured at 620 nm using a spectrophotometer. Simultaneously, a blank with 1 mL of distilled water and 4 mL of anthrone reagent was prepared. Glucose in different concentrations (10 to 100 mg) was used as standard to plot the curve. The concentration of the sugar in the sample was computed from the calibration curve.

3.5. Determination of Nitrogen Content by Kjeldahl Analysis

Concentrated sulphuric acid was used to release the nitrogen from the sample that usually was converted to ammonium using Kjeldahl apparatus (Foss, Hillerød, Denmark). Then, it was distilled by using 2% boric acid, and the ammonia concentration was determined by titration with 0.05 N sulphuric acids. The percentage of nitrogen is obtained by using Equation (2):
Nitrogen   % = ( l s     l b ) × N × 1.4 W ,
in which W is weight of sample, Is represents the volume of sulphuric acids that is required to titrate ammonium, Ib is the volume of sulphuric acids that is required to titrate blank, and N is the molarity of sulphuric acid. Later, the nitrogen percentage was converted to grams per litre (g/L).

3.6. Lipase Assay

Activity of the T1 lipase was assayed colorimetrically, according to the modified method of Kwon and Rhee [35]. The substrate emulsion was prepared by homogenising an equal ratio (1:1) of olive oil (Bertolli, Tuscany, Italy) and 50 mM of phosphate buffer at pH 7.0. The reaction mixture containing 0.05 mL enzyme, 0.95 mL of 50 mM phosphate buffer, 2.5 mL substrate emulsion, and 20 µL of 20 mM CaCl2 was incubated for 30 minutes in a water bath (Protech, Selangor, Malaysia) at 70 °C and 200 rpm shaking rate. The enzymatic reaction was stopped by adding 1 mL of 6 N HCl, followed by 5 mL of isooctane. The mixture was vortexed vigorously for 30 s. The upper layer of isooctane (4 mL) was transferred into a clean test tube before adding 1 mL cupric acetate–pyridine reagent [5% (w/v) of copper (II) acetate monohydrate, pH adjusted by pyridine to 6.1]. The mixture was then vortexed vigorously (30 s) and left for an hour. Absorbance of the upper layer was measured at 715 nm using a spectrophotometer. The lipase assay was carried out in triplicate. One unit (U) of lipase activity was defined as 1 μmol of fatty acid, released per minute, under standard assay conditions.

3.7. Acetate Concentration Detection

Acetate was analysed using acetate assay kits from Merck KGaA, Darmstadt, Germany. Sample (10 uL) was taken and added with 40 μL of acetate assay buffer reaction. A mixture was prepared (42 μL acetate assay buffer, 2 μL acetate enzyme mix, 2 μL ATP, 2 μL acetate substrates mix and 2 μL probe) and added to the sample mixture. The resulting mixture was mixed and incubated at room temperature for 40 min. The absorbance of this mixture was measured at 450 nm [36].

3.8. Experimental Design and Statistical Analysis

A central composite rotatable design (CCRD) was employed to generate efficient estimation of the first- and second-order coefficient mathematical models [37,38]. Equation (3) shows a generalised response surface model.
Y = β 0 + i = 1 4 β i x i + i = 1 4 β i i x i 2 + i = 1 3 j = i + 1 4 β i j x i x j + ε ,
in which Y (yield %) represents the response variable, β 0 is the constant term, β i represents the coefficients of the linear parameters, x i represents the variables, β i i represents the coefficients of the quadratic parameter, β i j represents the coefficients of the interaction parameters, and ε is the residual associated with the experiments. A total of 30 experiments were conducted according to full factorial CCRD. The first 16 experiments (24 = 16, factorial CCRD) were at factorial points, 8 at axial points (α = 2), and 6 replications for the central points. Thirty experiments were conducted at various amounts of molasses (1 to 4 g/L), fish waste (1.43 to 2.29 g/L), NaCl (3.0 to 6.0 g/L), and IPTG concentration (0.02 to 0.1 mM) for T1 lipase production. During all the experiments, the temperature was set at 37 °C with an agitation speed of 200 rpm. Table 7 shows the variables in terms of coded and actual values. Each variable was investigated at five levels. Analysis of variance (ANOVA) was performed to determine any significant difference between the independent variables. The reduced model involves statistically independent variables, which it takes into account. Multiple regressions were applied in analysing experimental data to predict the coefficients of the fitted second-order polynomial model. Experimental values were compared with the predicted values to check the adequacy of the final reduced model. The recommended optimum conditions were also performed to verify the optimum response values, predicted by the model.

4. Conclusions

In this study, molasses and fish waste were identified to be most suitable as carbon and nitrogen sources, respectively, for production of T1 lipase as alternatives to conventional culture media. Optimisation of T1 lipase production, using newly formulated medium, was successfully performed using response surface methodology (RSM). The R2 value of 0.9607 indicated that the model had a good fit with the experimental findings. At the optimum conditions, the actual value for lipase activity was 164.37 U/mL, compared with the predicted value (172.89 U/mL), and the conditions can be used to scale up the enzyme production in future. The result showed that using a new formulation could decrease the cost of production and increase the production of T1 lipase up to 7 times, which could benefit the relevant industries.

Author Contributions

Conceptualization, M.M., A.B.S., R.M., M.S.M.A. and R.N.Z.R.A.R.; Formal analysis, H.M.N.; Funding acquisition, R.N.Z.R.A.R.; Investigation, H.M.N.; Methodology, R.N.Z.R.A.R.; Project administration, R.N.Z.R.A.R.; Resources, R.N.Z.R.A.R.; Supervision, R.N.Z.R.A.R.; Validation, R.M. and R.N.Z.R.A.R.; Visualization, H.M.N.; Writing—original draft, H.M.N.; Writing—review & editing, H.M.N. and M.M.

Funding

This work is funded by Ministry of Science, Technology and Innovation Malaysia (MOSTI) under Malaysia Technology Development Centre (MTDC) for financial aid through the CRDF Bridging Fund (Vote number: 6364703).

Conflicts of Interest

The authors declare no conflict of interest. The funders had no role in the design of the study; in the collection, analyses, or interpretation of data; in the writing of the manuscript; and in the decision to publish the results.

Abbreviations

ttime
Xmmaximum cell concentration
Pmmaximum product formed
Smmaximum substrate consumed
Aacetate concentration
μmmaximum specific growth rate
YX/Scell yield per substrate
YP/Slipase yield per substrate
YP/Xlipase yield per cell
qPspecific product formation rate
qSspecific substrate consumption rate

References

  1. Singh, A.K.; Mukhopadhyay, M. Overview of fungal lipase: A review. Appl. Biochem. Biotechnol. 2012, 166, 486–520. [Google Scholar] [CrossRef] [PubMed]
  2. Andualema, B.; Gessesse, A. Microbial lipases and their industrial applications: Review. Biotechnology 2012, 11, 100–118. [Google Scholar] [CrossRef]
  3. Smaniotto, A.; Skovronski, A.; Rigo, E.; Tsai, S.M.; Durrer, A.; Foltran, L.L.; Paroul, N.; Di Luccio, M.; Oliveira, J.V.; de Oliveira, D.; et al. Concentration, characterization and application of lipases from Sporidiobolus pararoseus strain. Braz. J. Microbiol. 2014, 45, 294–302. [Google Scholar] [CrossRef] [PubMed]
  4. Rodrigues, L.R.; Teixeira, J.A.; Oliveira, R. Low-cost fermentative medium for biosurfactant production by probiotic bacteria. Biochem. Eng. J. 2006, 32, 135–142. [Google Scholar] [CrossRef] [Green Version]
  5. Agarwal, L.; Isar, J.; Meghwanshi, G.K.; Saxena, R.K. A cost effective fermentative production of succinic acid from cane molasses and corn steep liquor by Escherichia coli. J. Appl. Microbiol. 2006, 100, 1348–1354. [Google Scholar] [CrossRef] [PubMed]
  6. Ben Rebah, F.; Miled, N. Fish processing wastes for microbial enzyme production: A review. 3 Biotech. 2013, 3, 255–265. [Google Scholar] [CrossRef] [PubMed]
  7. Kacem, M.; Sellami, M.; Kammoun, W.; Frikha, F.; Miled, N.; Ben, R.F. Seasonal variations in proximate and fatty acid composition of viscera of Sardinella aurita, Sarpa salpa, and Sepia officinalis from Tunisia. J. Aquat. Food Prod. Technol. 2011, 20, 233–246. [Google Scholar] [CrossRef]
  8. Haddar, A.; Fakhfakh-Zouari, N.; Hmidet, N.; Frikha, F.; Nasri, M.; Kamoun, A.S. Low-cost fermentation medium for alkaline protease production by Bacillus mojavensis A21 using hulled grain of wheat and sardinella peptone. J. Biosci. Bioeng. 2010, 110, 288–294. [Google Scholar] [CrossRef] [PubMed]
  9. El-Boulifi, N.; Ashari, S.E.; Serrano, M.; Aracil, J.; Martínez, M. Solvent-free lipase-catalyzed synthesis of a novel hydroxyl-fatty acid derivative of kojic acid. Enzyme Microb. Technol. 2014, 55, 128–132. [Google Scholar] [CrossRef] [PubMed]
  10. Ashari, S.E.; Mohamad, R.; Ariff, A.; Basri, M.; Salleh, A.B. Optimization of enzymatic synthesis of palm-based kojic acid ester using response surface methodology. J. Oleo. Sci. 2009, 58, 503–510. [Google Scholar] [CrossRef] [PubMed]
  11. Lee, K.; Kang, S.K.; Choi, Y.J. A low-cost Lactobacillus salivarius L29 growth medium containing molasses and corn steep liquor allows the attainment of high levels of cell mass and lactic acid production. Afr. J. Biotechnol. 2013, 12, 2013–2018. [Google Scholar]
  12. Michailides, M.K.; Tekerlekopoulou, A.G.; Akratos, C.S.; Coles, S.; Pavlou, S.; Vayenas, D.V. Molasses as an efficient low-cost carbon source for biological Cr(VI) removal. J. Hazard. Mater. 2015, 281, 95–105. [Google Scholar] [CrossRef] [PubMed]
  13. Mohd, Y.N.H.; Fukuzaki, M.; Maeda, T.; Miyazaki, T.; Hakiman, C.M.; Ariffin, H.; Wood, T.K. Biohydrogen production from oil palm frond juice and sewage sludge by a metabolically engineered Escherichia coli strain. Int. J. Hydrogen Energy 2013, 38, 10277–10283. [Google Scholar] [CrossRef]
  14. Vital, M.; Stucki, D.; Egli, T.; Hammes, F. Evaluating the growth potential of pathogenic bacteria in water. Appl. Environ. Microbiol. 2010, 76, 6477–6484. [Google Scholar] [CrossRef] [PubMed]
  15. Sekar, N.; Veetil, S.; Neerathilingam, M. Tender coconut water an economical growth medium for the production of recombinant proteins in Escherichia coli. BMC Biotechnol. 2013, 13, 70. [Google Scholar] [CrossRef] [PubMed]
  16. Luli, G.; Strohl, W. Comparison of growth, acetate production, and acetate inhibition of Escherichia coli strains in batch and fed-batch fermentations. Appl. Envir. Microbiol. 1990, 6, 1004–1011. [Google Scholar]
  17. Lee, L.P.; Karbul, H.M.; Citartan, M.; Gopinath, S.C.B.; Lakshmipriya, T.; Tang, T.H. Lipase-secreting Bacillus species in an oil-contaminated habitat: Promising strains to alleviate oil pollution. Biomed Res. Int. 2015, 1–9. [Google Scholar] [CrossRef]
  18. Hamzaoui, A.H.; Jamoussi, B.; M’nif, A. Lithium recovery from highly concentrated solutions: Response surface methodology (RSM) process parameters optimization. Hydrometallurgy 2008, 90, 1–7. [Google Scholar] [CrossRef]
  19. Bezerra, M.A.; Santelli, R.E.; Oliveira, E.P.; Villar, L.S.; Escaleira, L.A. Response surface methodology (RSM) as a tool for optimization in analytical chemistry. Talanta 2008, 76, 965–977. [Google Scholar] [CrossRef] [PubMed]
  20. Liu, Y.P.; Zheng, P.; Sun, Z.H.; Ni, Y.; Dong, J.J.; Zhu, L.L. Economical succinic acid production from cane molasses by Actinobacillus succinogenes. Bioresour. Technol. 2008, 99, 1736–1742. [Google Scholar] [CrossRef] [PubMed]
  21. Abdulkarim, S.M.; Fatimah, A.B.; Anderson, J.G. Effect of salt concentrations on the growth of heat-stressed and unstressed Escherichia coli. J. Food Agric. Environ. 2009, 7, 51–54. [Google Scholar]
  22. Malakar, P.; Venkatesh, K.V. Effect of substrate and IPTG concentrations on the burden to growth of Escherichia coli on glycerol due to the expression of Lac proteins. Appl. Microbiol. Biotechnol. 2012, 93, 2543–2549. [Google Scholar] [CrossRef] [PubMed]
  23. Boonchaidung, T.; Papone, T. Effect of carbon and nitrogen sources on lipase production by isolated lipase-producing soil yeast. J. Life Sci. Tech. 2013, 1, 176–179. [Google Scholar] [CrossRef]
  24. Ramani, K.; Chockalingam, E.; Sekaran, G. Production of a novel extracellular acidic lipase from Pseudomonas gessardii using slaughterhouse waste as a substrate. J. Ind. Microbiol. 2010, 37, 531–535. [Google Scholar] [CrossRef] [PubMed]
  25. Kanmani, P.; Karthik, S.; Aravind, J.; Kumaresan, K. The use of response surface methodology as a statistical tool for media optimization in lipase production from the dairy effluent isolate Fusarium solani. ISRN Biotechnol. 2013, 2013, 1–8. [Google Scholar] [CrossRef] [PubMed]
  26. Velez, A.; Horta, A.; da Silva, A.; Iemma, M.; Giordano, R.; Zangirolami, T. Enhanced production of recombinant thermo-stable lipase in Escherichia coli at high induction temperature. Protein Expr. Purif. 2013, 90, 96–103. [Google Scholar] [CrossRef] [PubMed]
  27. Leow, T.C.; Rahman, R.N.Z.R.A.; Basri, M.; Salleh, A.B. A thermoalkaliphilic lipase of Geobacillus sp. T1. Extremophiles 2007, 11, 527–535. [Google Scholar] [CrossRef] [PubMed] [Green Version]
  28. Rahman, R.N.Z.R.A.; Leow, T.C.; Basri, M.; Salleh, A.B. Secretory expression of thermostable T1 lipase through bacteriocin release protein. Protein Expr. Purif. 2005, 40, 411–416. [Google Scholar] [CrossRef] [PubMed] [Green Version]
  29. Shasaltaneh, M.D.; Fooladi, J.; Moosavi-Nejad, S.Z. L-tryptophan production by Escherichia coli in the presence of Iranian cane molasses. J. Paramed. Sci. 2010, 1. [Google Scholar] [CrossRef]
  30. Norziah, M.H.; Al-Hassan, A.; Khairulnizam, A.B.; Mordi, M.N.; Norita, M. Characterization of fish gelatin from surimi processing wastes: Thermal analysis and effect of transglutaminase on gel properties. Food Hydrocoll. 2009, 23, 1610–1616. [Google Scholar] [CrossRef]
  31. Ghaley, A.E.M.; Brooks, M.; Ramakrishnan, V.V.; Budge, S.M.; Dave, D. Fish processing wastes as a potential source of proteins, amino acids and oils: A critical review. J. Microb. Biochem. Technol. 2013, 5, 107–129. [Google Scholar] [CrossRef]
  32. Behera, S.; Ghanty, S.; Ahmad, F.; Santra, S.; Banerjee, S. UV-visible spectrophotometric method development and validation of assay of paracetamol tablet formulation. J. Anal. Bioanal. Tech. 2012, 3. [Google Scholar] [CrossRef]
  33. Dey, S.S.; Dora, K.C. Effect of sodium lactate as cryostabilizer on physico-chemical attributes of croaker (Johnius gangeticus) muscle protein. J. Food Sci. Technol. 2010, 47, 432–436. [Google Scholar] [CrossRef] [PubMed]
  34. Loewus, F.A. Improvement in anthrone method for determination of carbohydrates. Anal. Chem. 1952, 24, 219. [Google Scholar] [CrossRef]
  35. Kwon, D.Y.; Rhee, J.S. A simple and rapid colorimetric method for determination of free fatty acids for lipase assay. J. Am. Oil Chem. Soc. 1986, 63, 89–92. [Google Scholar] [CrossRef]
  36. Li, S.; Kim, Y.; Phunysho, S.; Chekli, L.; Shon, H.K.; Leiknes, T.; Ghaffour, N. Methane production in an anaerobic osmotic membrane bioreactor using forward osmosis: Effect of reverse salt flux. Bioresour. Technol. 2017, 239, 285–293. [Google Scholar] [CrossRef] [PubMed]
  37. Chen, C.S.; Liu, K.J.; Lou, Y.H.; Shieh, C.J. Optimisation of kojic acid monolaurate synthesis with lipase PS from Pseudomonas cepacia. J. Sci. Food Agric. 2002, 82, 601–605. [Google Scholar] [CrossRef]
  38. Chaibakhsh, N.; Abdul, R.M.B.; Abd-Aziz, S.; Basri, M.; Salleh, A.B.; Rahman, R.N.Z.R.A. Optimized lipase-catalyzed synthesis of adipate ester in a solvent-free system. J. Ind. Microbiol. Biotechnol. 2009, 36, 1149–1155. [Google Scholar] [CrossRef] [PubMed]
Figure 1. Correlation of actual and predicted values of lipase activity, from the response surface model. Dark blue cubes represent the lowest T1 lipase activity, while the red cubes represent the highest T1 lipase activity.
Catalysts 08 00485 g001
Figure 2. Response surface 3D contour plots for the effects of four main variables on T1 lipase activity shown in (a) fish waste (B) versus molasses (A), (b) inducer (D) versus molasses (A), (c) NaCl (C) versus fish waste (B), (d) inducer (D) versus fish waste (B), and (e) inducer (D) versus NaCl (C).
Catalysts 08 00485 g002
Figure 3. Effects of Different Parameters Involved in the Cultivation of T1 Lipase.
Catalysts 08 00485 g003
Figure 4. Relationship in between lipase formation rate and growth rate of E. coli based on the growth-asscociated product formation model.
Catalysts 08 00485 g004
Table 1. Sugar and Nitrogen Analysis.
SampleGlucose (g/L)Nitrogen (%)
POME-7.11 ± 3.402
Fruit bunch-1.32 ± 4.460
Fish waste0.08 ± 0.07419.08 ± 3.585
Influent-2.35 ± 2.131
Effluent-0.17 ± 4.895
Fish hydrolysate-9.59 ± 1.222
5th grade molasses19.80 ± 0.021-
Mature coconut water0.19 ± 0.065-
Table 2. Batch Fermentation Kinetics of T1 Lipase Production by Recombinant E. coli Using Different Molasses Concentrations in Shake Flask.
Kinetic ParametersMolasses (g/L)
12345
t (h)1212121212
Xm (g/L)3.904.694.183.352.56
Pm (U/mL)46.5361.5653.1130.7818.14
Sm (g/L)15.3016.9016.614.810.00
A (g/L)0.430.750.550.410.24
µmax (h−1)0.460.470.450.380.21
Yx/s (gcells/gsugar)0.2540.2780.2520.2260.256
Yp/s (U/gsugar)3.0413.6433.1992.0791.814
Yp/x (U/gcells)11.93113.12612.7069.1887.086
qp (U/g/h)6.3738.1857.7905.4733.755
qs (g/g/h)1.1221.2421.1141.0010.878
Table 3. Batch Fermentation Kinetics of T1 Lipase Production by the Recombinant E. coli Using Different Fish Waste Percentages in Shake Flask.
Kinetic ParametersFish Waste (g/L)
1.912.292.673.053.433.824.204.58
t (h)1212121212121212
Xm (g/L)5.175.445.024.874.504.134.003.97
Pm (U/mL)62.1367.9958.6454.9850.2145.331.7030.22
Sm (g/L)16.3616.9716.0015.3515.1014.312.1012.00
Am (g/L)0.430.400.550.730.750.810.920.95
µmax (h−1)0.4270.4310.4120.4000.3870.3550.2850.280
Yx/s (gcells/gsugar)0.3160.3210.30140.3170.2980.2860.3310.331
Yp/s (U/gsugar)3.7984.0063.6653.5823.3253.1682.6203.299
Yp/x (U/gcells)12.01712.49811.68111.28911.15810.9687.9257.612
qp (U/g/h)2.5322.6692.5002.4652.4452.3312.2772.230
qs (g/g/h)3.2603.33733.1953.1842.9652.7432.3332.300
Table 4. Central Composite Rotatable Design of T1 Lipase Production.
Standard OrderMolasses, A (g/L)Fish Waste, B (g/L)NaCl C, (g/L)[IPTG], D (mM)Lipase Activity (U/mL)
ActualPredicted
11.00 (−1)1.43 (−1)3.00 (−1)0.10 (+1)51.3243.83
24.00 (+1)1.43 (−1)3.00 (−1)0.02 (–1)23.24925.546
31.00 (−1)2.29 (+1)3.00 (−1)0.02 (–1)125.49136.764
44.00 (+1)2.29 (+1)3.00 (−1)0.10 (+1)101.96103.49
51.00 (−1)1.43 (−1)6.00 (+1)0.02 (–1)66.6764.44
64.00 (+1)1.43 (−1)6.00 (+1)0.10 (+1)88.78290.71
71.00 (−1)2.29 (+1)6.00 (+1)0.10 (+1)147.62146.92
84.00 (+1)2.29 (+1)6.00 (+1)0.02 (−1)93.4893.48
92.50 (0)1.86 (0)4.50 (0)0.06 (0)175.59175.00
102.50 (0)1.86 (0)4.50 (0)0.06 (0)178.02175.00
111.00 (−1)1.43 (−1)3.00 (−1)0.02 (−1)71.0579.17
124.00 (+1)1.43 (−1)3.00 (−1)0.10 (+1)133.89144.03
131.00 (−1)2.29 (+1)3.00 (−1)0.10 (+1)159.38153.02
144.00 (+1)2.29 (+1)3.00 (−1)0.02 (–1)151.98153.59
151.00 (−1)1.43 (−1)6.00 (+1)0.10 (+1)198.319182.345
164.00 (+1)1.43 (0)6.00 (+1)0.02 (−1)80.5589.22
171.00 (−1)2.29 (+1)6.00 (+1)0.02 (−1)135.56127.03
184.00 (+1)2.29 (+1)6.00 (+1)0.10 (+1)186.56180.74
192.50 (0)1.86 (0)4.50 (0)0.06 (0)195.19193.83
202.50 (0)1.86 (0)4.50 (0)0.06 (0)200.28193.83
210.40 (−2)1.86 (0)4.50 (0)0.06 (0)57.5877.07
224.60 (+2)1.86 (0)4.50 (0)0.06 (0)101.4091.74
232.50 (0)1.26 (−2)4.50 (0)0.06 (0)43.1431.51
242.50 (0)2.46 (+2)4.50 (0)0.06 (0)70.5978.94
252.50 (0)1.86 (0)2.40 (0)0.06 (0)30.8126.09
262.50 (0)1.86 (0)6.60 (+1)0.06 (0)36.4137.86
272.50 (0)1.86 (0)4.50 (0)0.00 (−2)45.9435.79
282.50 (0)1.86 (0)4.50 (0)0.12 (+2)72.1472.14
292.50 (0)1.86 (0)4.50 (0)0.06 (0)144.58151.22
302.50 (0)1.86 (0)4.50 (0)0.06 (0)156.21151.22
Table 5. ANOVA for the Quadratic Model Developed for the Production of T1 Lipase.
SourceSum of SquaresDegree of FreedomMean SquareF-Valuep-Value
Model35,117.19132701.3215.030.0003
Molasses, A357.251357.251.990.1963
Fish waste, B3714.8913714.9920.660.0019
NaCl, C180.151180.151.000.3461
[IPTG], D1716.0611716.069.550.0149
AB1786.0611786.609.940.0135
AD478.861478.862.660.1413
BC693.441693.443.860.0851
BD666.311666.313.710.0904
CD3164.4513164.4517.600.0030
B21759.0011759.009.780.0141
C25678.2615678.2631.580.0005
D21914.2311914.2310.650.0115
ABC1206.7011206.706.710.0321
Residual1438.268179.78--
Lack-of-fit1397.716232.9511.490.0822
Pure error40.56220.28--
Corrected total71,172.5623---
Table 6. Optimum Formulation for T1 Lipase Production.
Run no.Molasses, A (g/L)Fish Waste, B (g/L)NaCl, C (g/L)IPTG Concentration, D (mM)Lipase Activity (U/mL)Difference
ActualPredicted
1.1.002.293.460.03164.37172.898.52
Table 7. Range of Variables and Their Levels for the Central Composite Rotatable Design (CCRD).
VariableLevels
–2–10+1+2
Molasses, A (g/L)0.41.02.504.04.6
Fish waste, B (g/L)1.2581.431.862.292.462
NaCl, C (g/L)2.43.04.56.06.6
[Inducer], D (mM)0.0040.020.060.10.116

