Article

First-Principles-Based Simulation of an Industrial Ethanol Dehydration Reactor

by
Kristof Van der Borght
,
Konstantinos Alexopoulos
,
Kenneth Toch
,
Joris W. Thybaut
,
Guy B. Marin
and
Vladimir V. Galvita
*
Laboratory for Chemical Technology, Ghent University, Technologiepark 125, B-9052 Ghent, Belgium
*
Author to whom correspondence should be addressed.
Catalysts 2019, 9(11), 921; https://doi.org/10.3390/catal9110921
Submission received: 26 August 2019 / Revised: 30 October 2019 / Accepted: 31 October 2019 / Published: 5 November 2019
(This article belongs to the Special Issue Catalytic Transformation of Renewables (Olefin, Bio-sourced, et. al))

Abstract

:
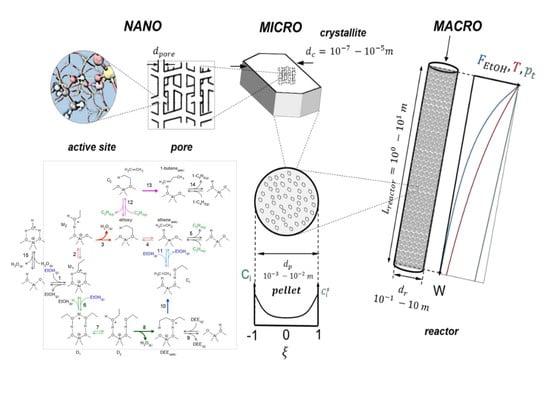
The achievement of new economically viable chemical processes often involves the translation of observed lab-scale phenomena into performance in an industrial reactor. In this work, the in silico design and optimization of an industrial ethanol dehydration reactor were performed, employing a multiscale model ranging from nano-, over micro-, to macroscale. The intrinsic kinetics of the elementary steps was quantified through ab initio obtained rate and equilibrium coefficients. Heat and mass transfer limitations for the industrial design case were assessed via literature correlations. The industrial reactor model developed indicated that it is not beneficial to utilize feeds with high ethanol content, as they result in lower ethanol conversion and ethene yield. Furthermore, a more pronounced temperature drop over the reactor was simulated. It is preferred to use a more H2O-diluted feed for the operation of an industrial ethanol dehydration reactor.

Graphical Abstract

1. Introduction

Since their initial discovery in the late 1970s, the conversion processes of oxygenates have been gaining importance rapidly as an alternative route for the production of fuels and chemicals [1,2,3]. Most industrial focus has been given to the conversion of methanol to hydrocarbons, with products ranging from light olefins to gasoline. Both fixed and fluidized bed reactors are in use in the industry. A fluidized bed reactor with SAPO-34 catalysts offers the advantage of adequately coping with rapid catalyst deactivation and the high exothermicity of the methanol-to-olefins (MTO) reaction. However, the corresponding setbacks are its notable catalyst attrition and low single-pass methanol conversion in addition to its high investment cost. A fixed bed variant, on the other hand, is simple in construction and can easily be operated, certainly in adiabatic operation.
The first records on ethanol dehydration date back to the 18th century, and several plants have been in operation in the course of the 20th century. In contrast to the MTO reaction, ethanol dehydration is an endothermic process typically operated in a multitubular, isothermal reactor at temperatures exceeding 623 K. Such a reactor configuration, which employs indirect heating via a heating fluid, has disadvantages in both its technical and its economic aspects, resulting in a shift towards adiabatic fixed bed reactors [4]. Initially, the catalyst employed was alumina or silica–alumina, while, more recently, also zeolites have been considered for this process [5].
A schematic overview of an ethanol dehydration plant is shown in Figure 1 [6]. When starting from a fermentation broth, i.e., bioethanol, a distillation column (1) is required to partly remove the water from this ethanol–water mixture. The ethanol feedstock is subsequently mixed with unreacted ethanol from the purification section. Next, a heat exchanger (2) allows heat recovery from the reactor effluent, i.e., the latent heat of the effluent is used to vaporize the ethanol feedstock, which is subsequently pressurized (3). In a subsequent heat exchanger (4), the ethanol feedstock is superheated. Finally, a furnace (5) is installed to bring the feed to the temperature of the first ethanol dehydration reactor (6). The effluent from the first reactor is sent to the next ethanol dehydration reactor (8) via an additional furnace (7). The number of reactors in series depends on the reaction conditions and the intended conversion. The effluent of the second reactor undergoes a series of heat exchanges as described above to ensure maximum heat recovery. Downstream of the reactor, the effluent is separated in a distillation column (9) into an ethene top stream and a bottom stream comprising water, side products, and unreacted ethanol. The latter is sent to a second separation column (10) and results in three streams: side products, i.e., by-products (C3+ olefins and oxygenates), water, and unconverted ethanol, which can be recycled.
The capability of accurately simulating the behavior of a chemical reaction over a broad range of process conditions opens up perspectives for the design and optimization of industrial chemical reactors. The current reactor models described in literature typically rely on simplified kinetic models [7]. Efforts have already been undertaken to extend such models towards more complex reaction networks based on elementary steps [8,9,10,11]. However, employing model parameter values that have been determined by regression to experimental results, potentially jeopardizes the extrapolative capabilities of the model. Indeed, it is not guaranteed that all the kinetically relevant reactions are accounted for in the most adequate manner. In contrast, ab initio developed models incorporate information on the level of the active site and truly represent the intrinsic kinetics of the investigated reactions within the constraints under which the corresponding calculations have been performed.
In multiscale industrial reactor modeling, the chemical reaction rates are described via a kinetic model embedded within a suitable reactor model, which accounts for all relevant physical transport phenomena. Ab initio reactor modeling has already been successfully applied for thermal processes [12], but because of the complexity of heterogeneous catalyzed reactions, only few examples of simulations of catalytic processes solely based on ab initio obtained rate and equilibrium coefficients are reported, e.g., NH3 synthesis [13] and benzene hydrogenation [14]. For zeolite catalysis, a successful simulation of an industrial reactor would provide a proof of principle that reliable ab initio modeling of catalytic reactions is possible from molecular to industrial scale.
A reactor model provides guidelines for the design, optimization, and operation of industrial reactors. Alwahabi and Froment [15] developed a conceptual reactor design for the MTO reaction using a SAPO-34 catalyst and compared three different configurations: a multi-tubular quasi-isothermal reactor, a multi-bed adiabatic reactor with intermediate heat exchangers, and a bubbling fluidized bed reactor with internal heat exchanger. The advantages of relying on a fundamental kinetic model was already demonstrated by Park and Froment [16], who explored the use of a multi-bed adiabatic reactor for maximizing the propylene yield over H-ZSM-5 yield during the MTO reaction. CFD-ased models for a fixed bed [17] and a fluidized bed [18] using lumped kinetics have also been proposed. However, so far, no industrial reactor simulation model has been developed for the dehydration of ethanol on zeolites.
In the present work, a multi-bed adiabatic reactor model was developed for the dehydration of ethanol on H-ZSM-5 with Si/Al ratio 140 and acid site concentration of 0.003 mol kg−1. The model also accounts for intermediate heat exchange between the fixed beds. The kinetics implemented in the reactor model are solely based on quantum chemically obtained rate and equilibrium coefficients. A comparison of the ab initio modeling-based reactor simulation results with data found in patent literature provides the ultimate test of the model validity and methodology presented in this work. The benefits of accurate reaction and reactor model are illustrated by exploration of the water content effect.

2. Assessment of Internal and External Mass and Heat Transfer Limitations

A key factor in the development of an adequate reactor model is to assess the extent to which mass and heat transfer inside the catalyst particle and between the fluid bulk in the reactor and the catalyst surface impact on the overall performance, i.e., a determination of the occurrence of internal and external heat and mass transport limitations [19].
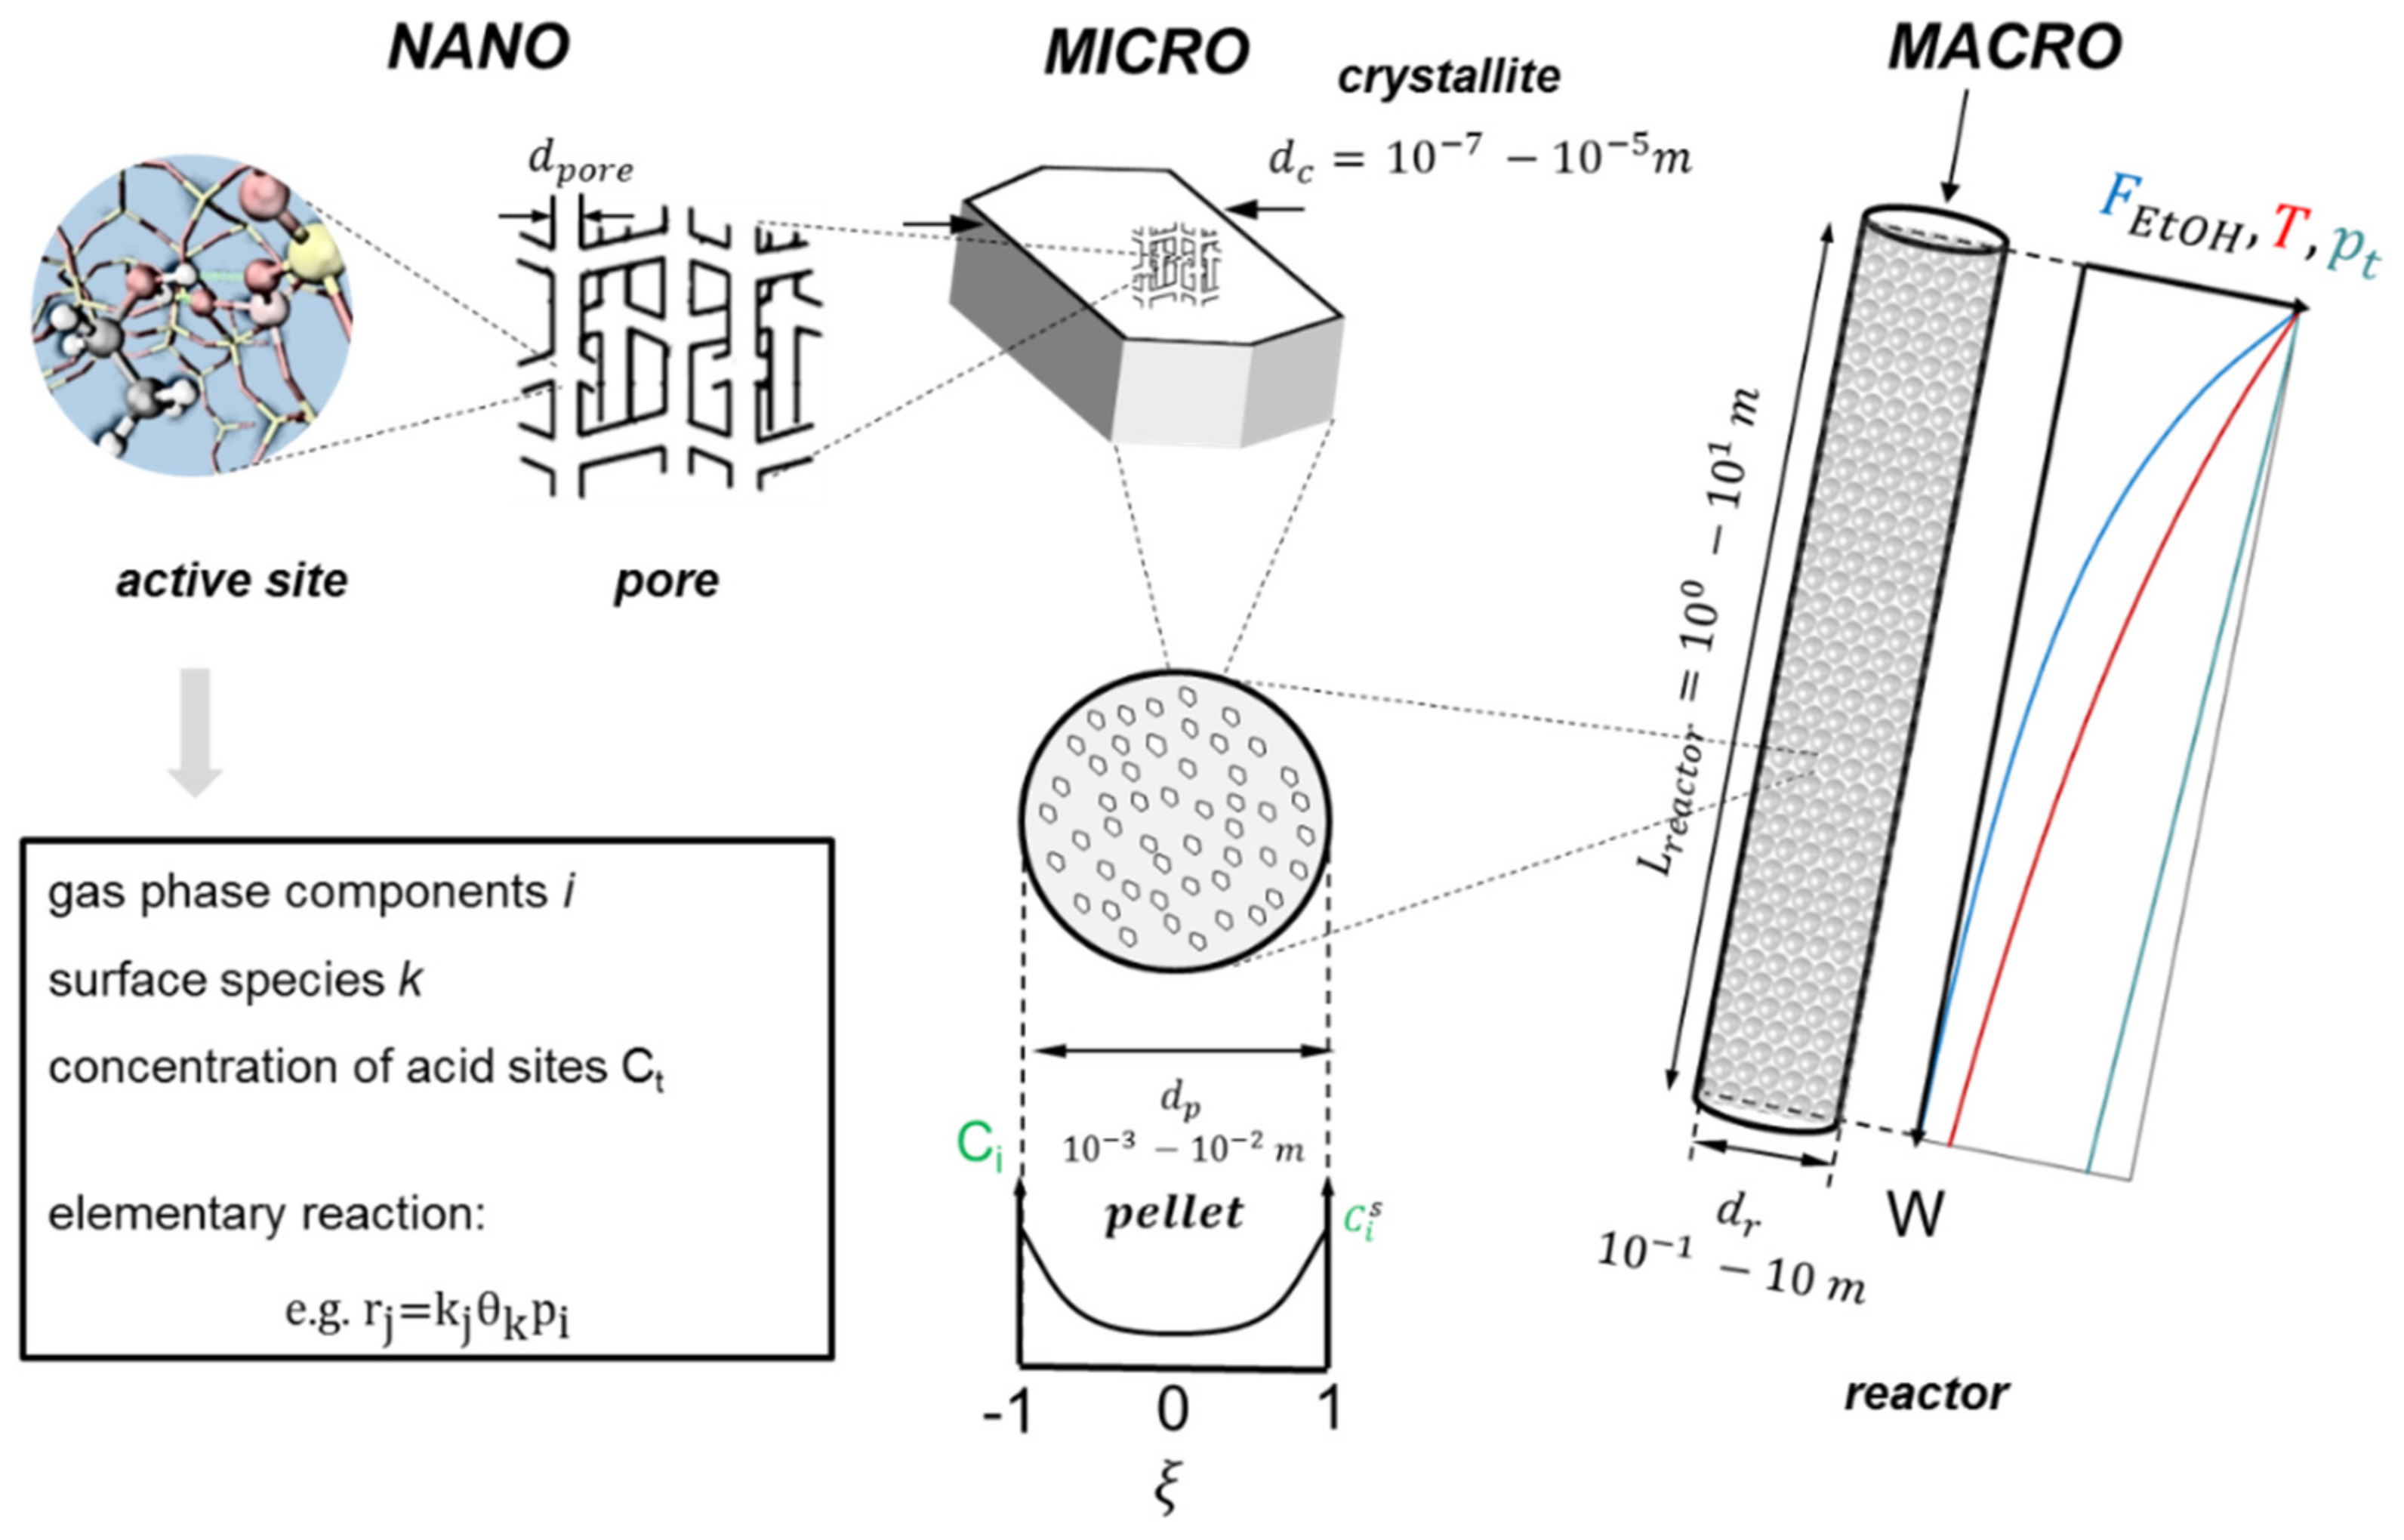
The most extensively investigated catalyst for ethanol dehydration is H-ZSM-5, which is composed of pentasil units. It consists of elliptical straight channels (0.53 nm × 0.56 nm) and near-circular sinusoidal channels (0.51 nm × 0.55 nm) that perpendicularly intersect [20]. This pore network is located in small crystallites with a diameter (dc) ranging between 10−7 and 10−5 m. These crystallites are typically embedded in a binder when applied industrially, to increase the mechanical strength and allow the formation of larger pellets (dp = 10−3 − 10−2 m), so to limit the pressure drop over the catalyst bed. Therefore, two different length scales for internal mass transport limitations exist. An assessment of the relative importance of these limitations can be made using the Weisz–Prater criterion [21]:
n + 1 2 d 2 ρ p R i obs 6 D e , i C i s < 0.08
in which n is the apparent order of reaction, d is the diameter of either the catalyst crystallite (dc) or the catalyst pellet (dp), ρ p is the density, D e , i is the effective diffusion coefficient of component i (m2 s−1), and C i s is the concentration of component i at the catalyst surface.
The Carberry number [22] (Ca) allows verifying the absence of external mass transfer limitations. It expresses the fractional concentration difference between the concentration of component i in the bulk phase, C i bl , and the concentration of component i on the external surface, C i s :
Ca = C i bl C i s C i bl = R i obs k fi a s C i bl < 0.05 n
where R i obs is the observed reaction rate per unit of catalyst mass, k fi is the external mass transfer coefficient of component i which can be calculated via correlations, as is the specific external surface area of the catalyst, i.e., 6/dp for spherical particles, C i bl an C i s refer to the bulk and surface concentration of component i, respectively, and n is the reaction order.
Mears [22] proposes criteria to assess external (Equation (3)) and internal heat transfer limitations (Equation (4)), similar to external mass transfer limitations, stating that the observed reaction rate should not deviate more than 5% from the rate under isothermal conditions:
Δ T film = R w , i obs   ρ p   d p   Δ H r 6   α   T bl E a R   T bl < 0.05
Δ T pellet = R w , i obs   ρ p   d p 2   Δ r H 60   λ p   T bl E a R   T bl < 0.05
where Δ H r corresponds to the reaction enthalpy, α is the heat transfer coefficient inside the film, i.e., the boundary layer between fluid and catalyst surface, λ p   is the catalyst pellet heat conductivity, T bl is the bulk temperature, and Ea is the apparent activation energy of the reaction.
Table 1 shows the results of the transport limitations assessment for ethanol dehydration in an industrial reactor using H-ZSM-5. It can be seen that the catalyst particle is practically isothermal, which is consistent with the results of Froment et al. [23]. In addition, external transport limitations can also be neglected.
The results obtained by applying the Weisz–Prater criterion are shown in Figure 2 for a wide range of pellet and crystallite diameters and effective diffusion coefficients. The area below the black line, which indicates the limit of 0.08, is the region where internal diffusion limitations will occur. Above that line, no internal diffusion limitations will occur. It can be seen that, under the conditions and catalyst studied in this work, internal mass transfer limitations are only expected at the pellet scale.

3. Industrial Reactor Model for Ethanol Dehydration

3.1. Reactor Model

A graphical representation of the reactor model and the phenomena that are taken into consideration are given in Figure 3. The reactor model consists of a tubular fixed bed reactor with specified length and diameter, i.e., Lr and dr. The molar inlet flow rate of ethanol and water, as well as the inlet temperature and pressure, are specified. The reactor is operated in adiabatic mode. The pressure drop over the fixed bed along the axial reactor coordinate is also taken into account. Further, the reactor model explicitly includes intraparticle mass transfer limitations which lead to a typical concentration profile, as shown below the catalyst pellet.

3.1.1. Macroscale: The Reactor

The reactor is described by continuity equations for the conservation of mass, energy, and momentum. The reactor is considered to be in steady state and, hence, no accumulation term has to be added. A one-dimensional heterogeneous reactor model with ideal plug flow was considered. The continuity equation for component i in the gas phase, e.g., ethanol, is given by:
dF i dW = R ¯ i
in which Fi is the molar flow rate of gas phase component i (mol s−1), W is the catalyst mass (kg), R ¯ i   is the net rate of formation of gas phase component i (mol s−1 kg−1).
As the reactor is operated adiabatically, no heat exchange with the wall is occurring, and thus, the energy equation for the gas phase is given by:
dT dW = 1 Gc p i = 1 ncomp Δ H f , i R ¯ i
T is the temperature (K), Δ H f , i is the standard formation enthalpy of component i (J mol−1), G is the total mass flow rate (kg s−1), cp is the heat capacity of the gas (J kg−1 K−1). The latter is determined via the method of Chung et al. [24]. The standard formation enthalpy can be determined via a group additivity method such as Benson’s or directly taken from the literature [24].
Momentum can be lost throughout the reactor because of friction of the gas with the packed bed and is accounted for by:
dp t dW = f G 2 ρ b ρ f A r 3 d p
where pt is the total pressure in the reactor (Pa), ρ fl is the density of the fluid (kg m−3), ρ b is the bed density (kg m−3), Ar is the cross-sectional surface area of the reactor tube (m2), and dp is the diameter of the catalyst pellet (m).
The friction factor f is determined by a correlation proposed by Hicks [25]:
f = 6.8 1 ε B 1.2 ε B 3 Re p 0.2
where ε B is the bed porosity, and Rep is the pellet Reynolds number, which is given by:
Re p = ρ b u s d p μ 1 ε B
where us is the superficial velocity (m s−1), and μ is the dynamic viscosity of the gas phase mixture (Pa s), which is determined according to the method of Chung et al. [24]. The bed porosity ε B can be found via the correlation of Haughey and Beveridge [26]:
ε B = 0.38 + 0.073 1 + d t d p 2 2 d t d p 2
where dt is the diameter of the reactor (m).
The initial conditions for this set of differential equation (Equations (6)–(8)) are given by:
F i = F i 0 T = T 0 p t = p t 0   at   W = 0

3.1.2. Microscale: The Catalyst Pellet

A one-dimensional mass balance for each gas phase component i over an infinitesimal volume of the catalyst pellet is considered:
C i t = R i ρ s 4 d p 2 s ξ D e , i C i ξ + D e , i ξ C i ξ + D e , i 2 C i ξ 2
Here, ρ s is the solid density of the catalyst (kg m−3), Ci is the concentration of the gas phase component i inside the catalyst pellet (mol m−3), ξ is the position coordinate within the pellet, s is the pellet shape factor, i.e., 0, 1 or 2 for, respectively, a slab, a cylinder, and a sphere, Ri is the net rate of formation of component i (mol s−1 kg−1), and De,i is the effective diffusion coefficient for gas phase component i (m2 s−1).
For this set of differential equations, the following initial conditions were considered:
C i = C i s ξ = 1 dC i d ξ = 0 ξ = 0
In contrast to a homogeneous medium, the porous pellets consist of interconnected non-uniform pores, inside which the gaseous components move. This internal void fraction of the porous material and the tortuous nature of the pores are taken into account by using the effective diffusivity for component i, i.e., De,i:
D e , i = ε p τ p D i
where ε p is the porosity, i.e., the fraction of the volume occupied by the pores, and τ p is the tortuosity.
The diffusion coefficient Di is given as the sum of two resistances by the so-called Bosanquet equation [27], which is composed of the diffusion coefficient, corresponding to intermolecular collisions, i.e., Di,m, and the Knudsen diffusion coefficient, i.e., Di,K, corresponding to the collisions of the molecules with the pore wall:
1 D i = 1 D i , m + 1 D i , K
The molecular diffusion coefficient Di,m is preferably calculated using the rigorous Stefan–Maxwell model [28,29], but this can be computationally demanding. The bulk diffusivity of gas phase component i in a gas mixture, D m , i , is therefore calculated from the individual binary diffusion coefficients, using the Wilke equation [30]:
D i , m = j = 1 j i y j D ij 1
where yi is the molar fraction of component i in the gas phase.
The Wilke equation assumes diffusion in a stagnant mixture and is valid when using dilute systems. Solsvik and Jakobsen [31,32] compared the rigorous Stefan–Maxwell model to the simpler Wilke model and concluded that it is appropriate to use the Stefan–Maxwell model in the simulation of a fixed packed-bed methanol synthesis reactor. Good results have been obtained by applying the Wilke–Bosanquet combination for the determination of diffusivity in multicomponent gas mixtures at low pressures in combination with complex reactions such as the MTO reaction [33] and hydrodesulphurization [9].
The molecular binary diffusion coefficient of component i in component j, Di,j, is calculated using the Füller–Schettler–Giddings relation [34], which is recommended by Reid et al. [35]:
D i , j = 1 × 10 7 T 1.75 p t 1 M i + 1 M j 1 / 2 Σ v i 1 / 3 + Σ v j 1 / 3 2
where Mi is the molecular mass of component i (mol kg−1), and Σ v i is the atomic diffusion volume for component i, which was found to be 51.77 cm3 for ethanol, 41.04 cm3 for ethene, 92.81 cm3 for di-ethyl ether, and 13.10 cm3 for water.
The Knudsen diffusion coefficient of component i, D i , K , is given by:
D i , K = 2 3 d pore 2 8 RT π M i
Due to the second-order nature of the balances to be solved over the catalyst pellet, see Equation (12), a meaningful solution is not guaranteed. Therefore, the set of differential equations originating from Equation (12) was solved by integration from an initial to a steady state, rather than by directly solving the steady-state mass balance. A finite difference method was used for solving these second-order differential equations, i.e., the pellet diameter was discretized over a user-defined number of mesh points, nmesh. Every partial differential equation was rewritten as a set of nmesh ordinary differential equations.
The net production rate of component i in case of diffusion limitations, i.e., R ¯ i , can be determined via:
R ¯ i = 0 V R i dV
In practice, its value was obtained by averaging the pointwise net rate of formation of component i at position ξ of the catalyst pellet. A number of equidistant grid points was defined, and a trapezoidal discretization produce was followed for integration:
R ¯ i = 0 V R i dV = s + 1 2 n grid j = 1 n grid R i r p , j r p , j s + R i r p , j + 1 r p , j + 1 s
where n grid is the number of grid points, R i r p , j is the net production rate of component i at a location r p , i inside the pellet, and V is the pellet volume.
The catalyst effectiveness factor is calculated as the ratio of the reaction rate in the presence of pore diffusion resistance to the reaction rate in the absence of diffusion limitations, i.e., at gas bulk concentrations:
η = R ¯ i R i s = 0 V R i dV R i s
The catalyst effectiveness factor as a function of the number of mesh points is nearly constant after 25 mesh points. In this work, 35 mesh points were used for the simulations.

3.1.3. Nanoscale: The Active Site

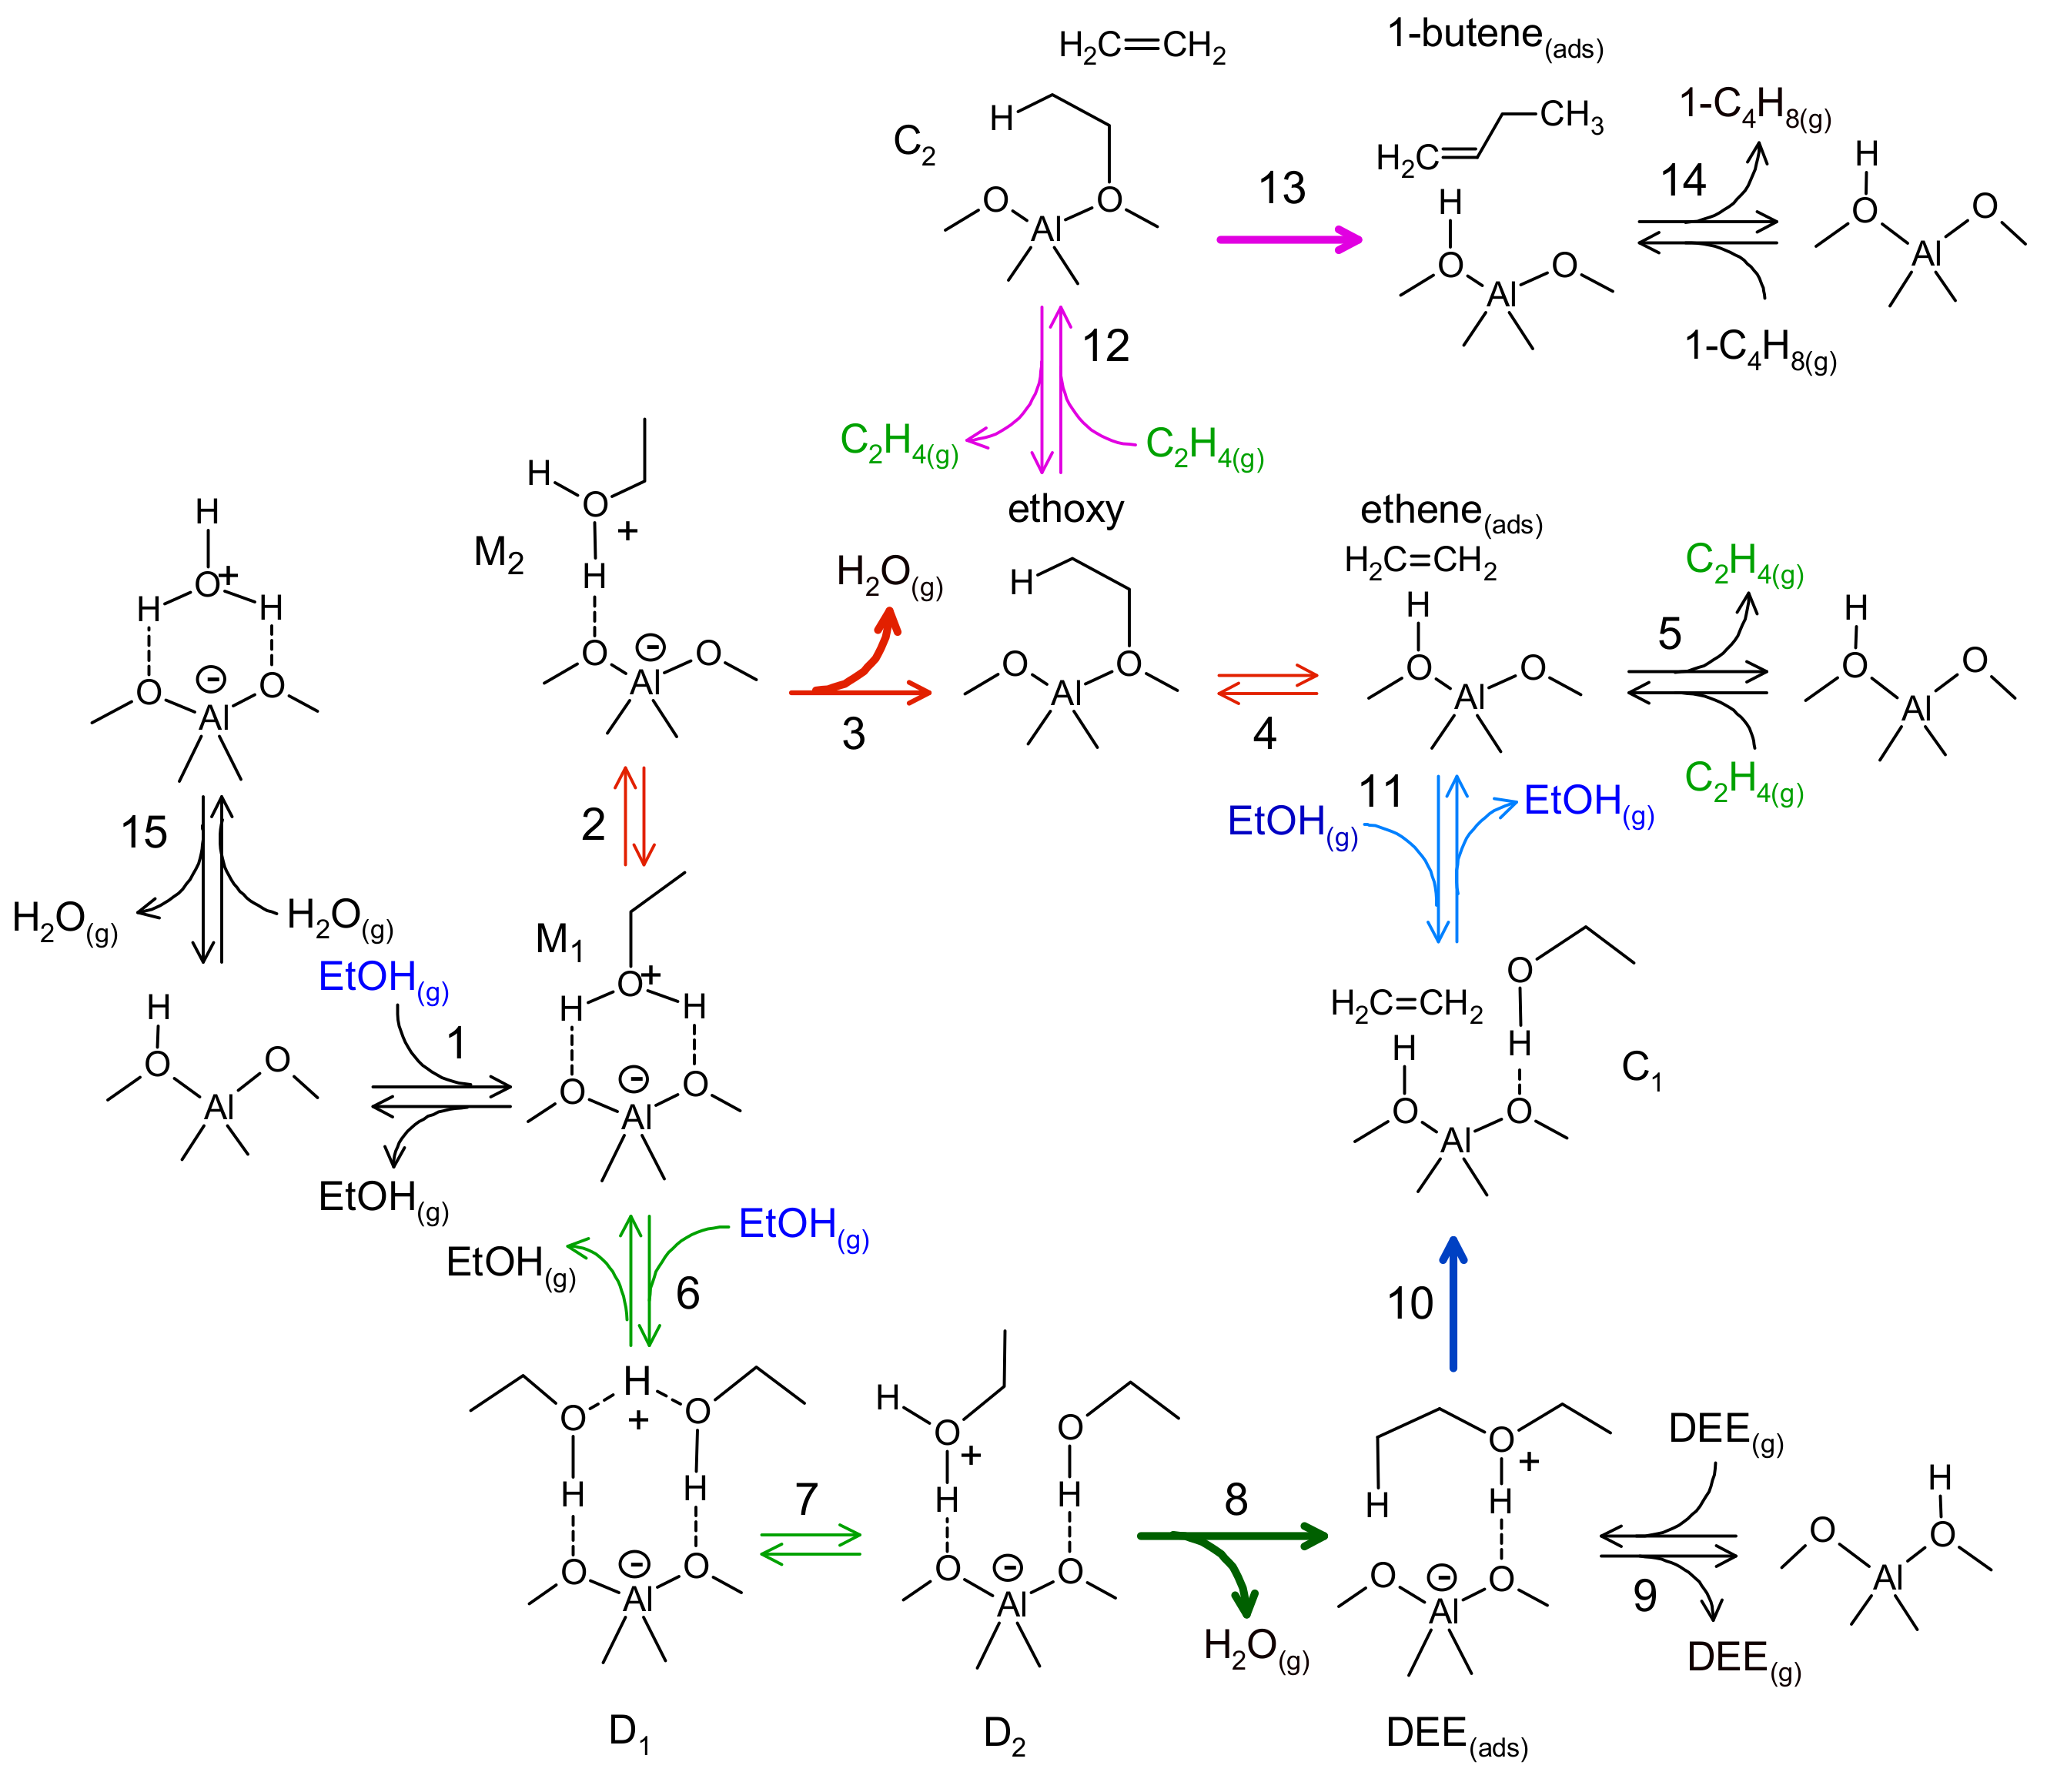
A fully ab initio reaction network [36,37] consisting of 15 elementary steps was used for describing the intrinsic kinetics of ethanol dehydration and is shown in Figure 4. Three different reaction pathways were identified and are given below along with the corresponding reaction enthalpies:
C 2 H 5 OH     C 2 H 4   +   H 2 O Δ H r   =   46   kJ   mol EtOH 1
2   C 2 H 5 OH     ( C 2 H 5 ) 2 O   +   H 2 O Δ H r   =   12   kJ   mol EtOH 1
( C 2 H 5 ) 2 O     C 2 H 4   +   C 2 H 5 OH Δ H r   =   70   kJ   mol EtOH 1
The monomolecular pathway (Equation (22)) describes the direct dehydration of ethanol to ethene, which is endothermic. The alternative route towards ethene comprises the bimolecular dehydration of ethanol to di-ethyl ether (Equation (23)) and its subsequent decomposition into ethanol and ethene (Equation (24)). The former is slightly exothermic, while the latter is endothermic. The mechanism for the production of C3+ hydrocarbons from ethanol is still a matter of debate [38,39,40]. Therefore, it was opted to include the dimerization of ethene to 1-butene, which serves as a representation of higher hydrocarbons formation:
2   C 2 H 4     C 4 H 8 Δ H r   =   53   kJ   mol C 2 H 4 1
The following net rates of formation were applied for the surface species k and gas phase components i, complemented with a site balance:
R k = C t j v jk r j = 0
R i = C t j v ji r j
θ H + + k θ k = 1
where rj is the turnover frequency of elementary step j, vji and vjk are the stoichiometric coefficient of gas phase component i or surface species k in the elementary step j. The forward reaction rate of a typical elementary step j can be written as:
r j = k j θ k n p i m
where θ k is the fractional occupancy of surface species k, and pi is the partial pressure of gas phase component i.
Equilibrium coefficients for each elementary reaction were obtained using the following formula:
K j = exp Δ H 0 T Δ S 0 RT = exp Δ G 0 , # RT
where R is the universal gas constant, ΔH0 is the standard enthalpy of the reaction, ΔS0 is the standard entropy of the reaction, and ΔG0 is the standard Gibbs free energy of the reaction. The rate coefficients for each elementary reaction were calculated on the basis of the transition state theory:
k j = k B T h exp Δ S 0 , R exp Δ H 0 , RT = k B T h exp Δ G 0 , # RT
where kB is the Boltzmann constant, h is the Planck constant, ΔH0,‡ is the standard enthalpy of activation, ΔS0,‡ is the standard entropy of activation, and ΔG0,‡ is the standard Gibbs free energy of activation. Arrhenius pre-exponential factors (Af) and activation energies (Ea(f)), as well as values for ΔS° and ΔH°, were determined on the basis of the computational work discussed by Alexopoulous et al. [36] and reported in Table 2.

4. Multi-Scale Reactor Model Validation

A survey of publicly available information yielded the following patent US 2013/0090510 [6] as the most relevant one for assessing the adequacy of the model developed in this work. The operating conditions and catalyst properties for this design case are presented in Table 3. The process configuration comprised two adiabatic reactors in series with intermediate heating, having a combined catalyst mass amounting to 6 ton. The inlet temperature and pressure for the first adiabatic reactor amounted to 673 K and 590 kPa, while 679 K and 530 kPa were used for the second one. The considered feedstock was an aqueous ethanol mixture containing 26 wt.% ethanol which considerably exceeded the ethanol content of the fermentation broth, i.e., 10 wt.%. The yearly ethanol processing capacity was estimated at 360 kton.
The performance results for the configuration comprising two adiabatic reactors are given in Table 4. Herein, the ethanol conversion ( X EtOH ) and yield of gas phase component i ( Y i ) are defined as:
X EtOH = F EtOH 0 F EtOH F EtOH 0
Y i = F i F EtOH 0
in which F EtOH 0 is the molar inlet flow rate of ethanol, and F i is the molar flow rate of gas phase component i.
According to the results described in patent US 2013/0090510 [6], an ethanol conversion amounting to 0.71 was observed, with a corresponding ethene yield of 0.69 in the first reactor. The by-product at the reactor outlet was said to consist of oxygenates, which are represented in the kinetic model by di-ethyl ether. A temperature drop over the first catalyst bed of more than 80 K was observed. At the end of the second reactor, almost complete ethanol conversion was achieved, with a high yield of ethene (0.97). Table 4 indicates that in this case, the by-products were higher olefins, represented in the kinetic model employed in this work by 1-butene. A less pronounced temperature drop of 26 K was observed over the second catalyst bed.
Figure 5 shows the calculated conversion and yield profiles along the axial reactor position. Ethene was the most abundant product throughout the reactor. At the end of the first catalyst bed, around 2% oxygenates product was observed, which is accurately described by the kinetic model with di-ethyl ether as a representative product. At the end of the second bed, no more di-ethyl ether was present as a consequence of its decomposition into ethene and ethanol, while the formation of higher hydrocarbon by-products, here represented by 1-butene, was observed. The reactor model hence provides a detailed picture of the product evolution throughout the reactor and allows assessing the effects of temperature and pressure.
A monotonous temperature decrease with increasing catalyst mass was observed in Figure 5, indicating that the monomolecular pathway (Equation (18)) was the most dominant along the entire reactor axis. Downstream of the first bed, the temperature of the outlet flow was increased via intermediate heating prior to sending the effluent to the subsequent reactor. Although the temperature showed good agreement at the end of the first reactor, a discrepancy between the simulated and the reported temperature was observed at the end of the second reactor. A total temperature drop of 116 K was simulated, while a temperature drop of only 107 K was observed. This can be compared to the total maximum adiabatic temperature drop calculated by:
Δ T ad , max = F EtOH 0 Δ H r 0 G   c p
This maximum adiabatic temperature drop was found to be 119 K and was closer to the simulated temperature drop than to the experimentally determined one. The pressure drop was also described adequately, as shown in the inset in Figure 5.
The catalyst effectiveness factor along the first reactor bed is shown in Figure 6 and was found to increase from 0.21 to 0.42. A concentration profile along the dimensionless catalyst pellet diameter is shown in the inset, indicating that severe diffusion limitations existed at the catalyst pellet scale.

5. Optimization of an Industrial Ethanol Dehydration Reactor

As good agreement was achieved between the model and the reported values, the model was considered to provide reliable predictions and, hence, was used to investigate and optimize an industrial ethanol dehydration reactor. Key process parameters for industrial operation are the amount of water added to the feed and the operating temperature. The thermodynamic equilibrium composition as a function of temperature was investigated by minimization of the Gibbs free energy. Three cases were considered:
(I).
Dehydration of pure ethanol, i.e., no additional water added in the feed, which considers ethanol, ethene, di-ethyl ether, and water in the product mixture.
(II).
Dehydration of aqueous ethanol, i.e., 90 mol% water contained in the feed, which corresponds to the lower limit of ethanol content obtained via biomass fermentation. This case also considers ethanol, ethene, di-ethyl ether, and water in the product mixture.
(III).
Dehydration of aqueous ethanol, i.e., 90 mol% water in the feed, with dimerization of ethene included as a model reaction for the formation of higher hydrocarbons. In addition to the compounds mentioned above, 1-butene was also added to the calculation.
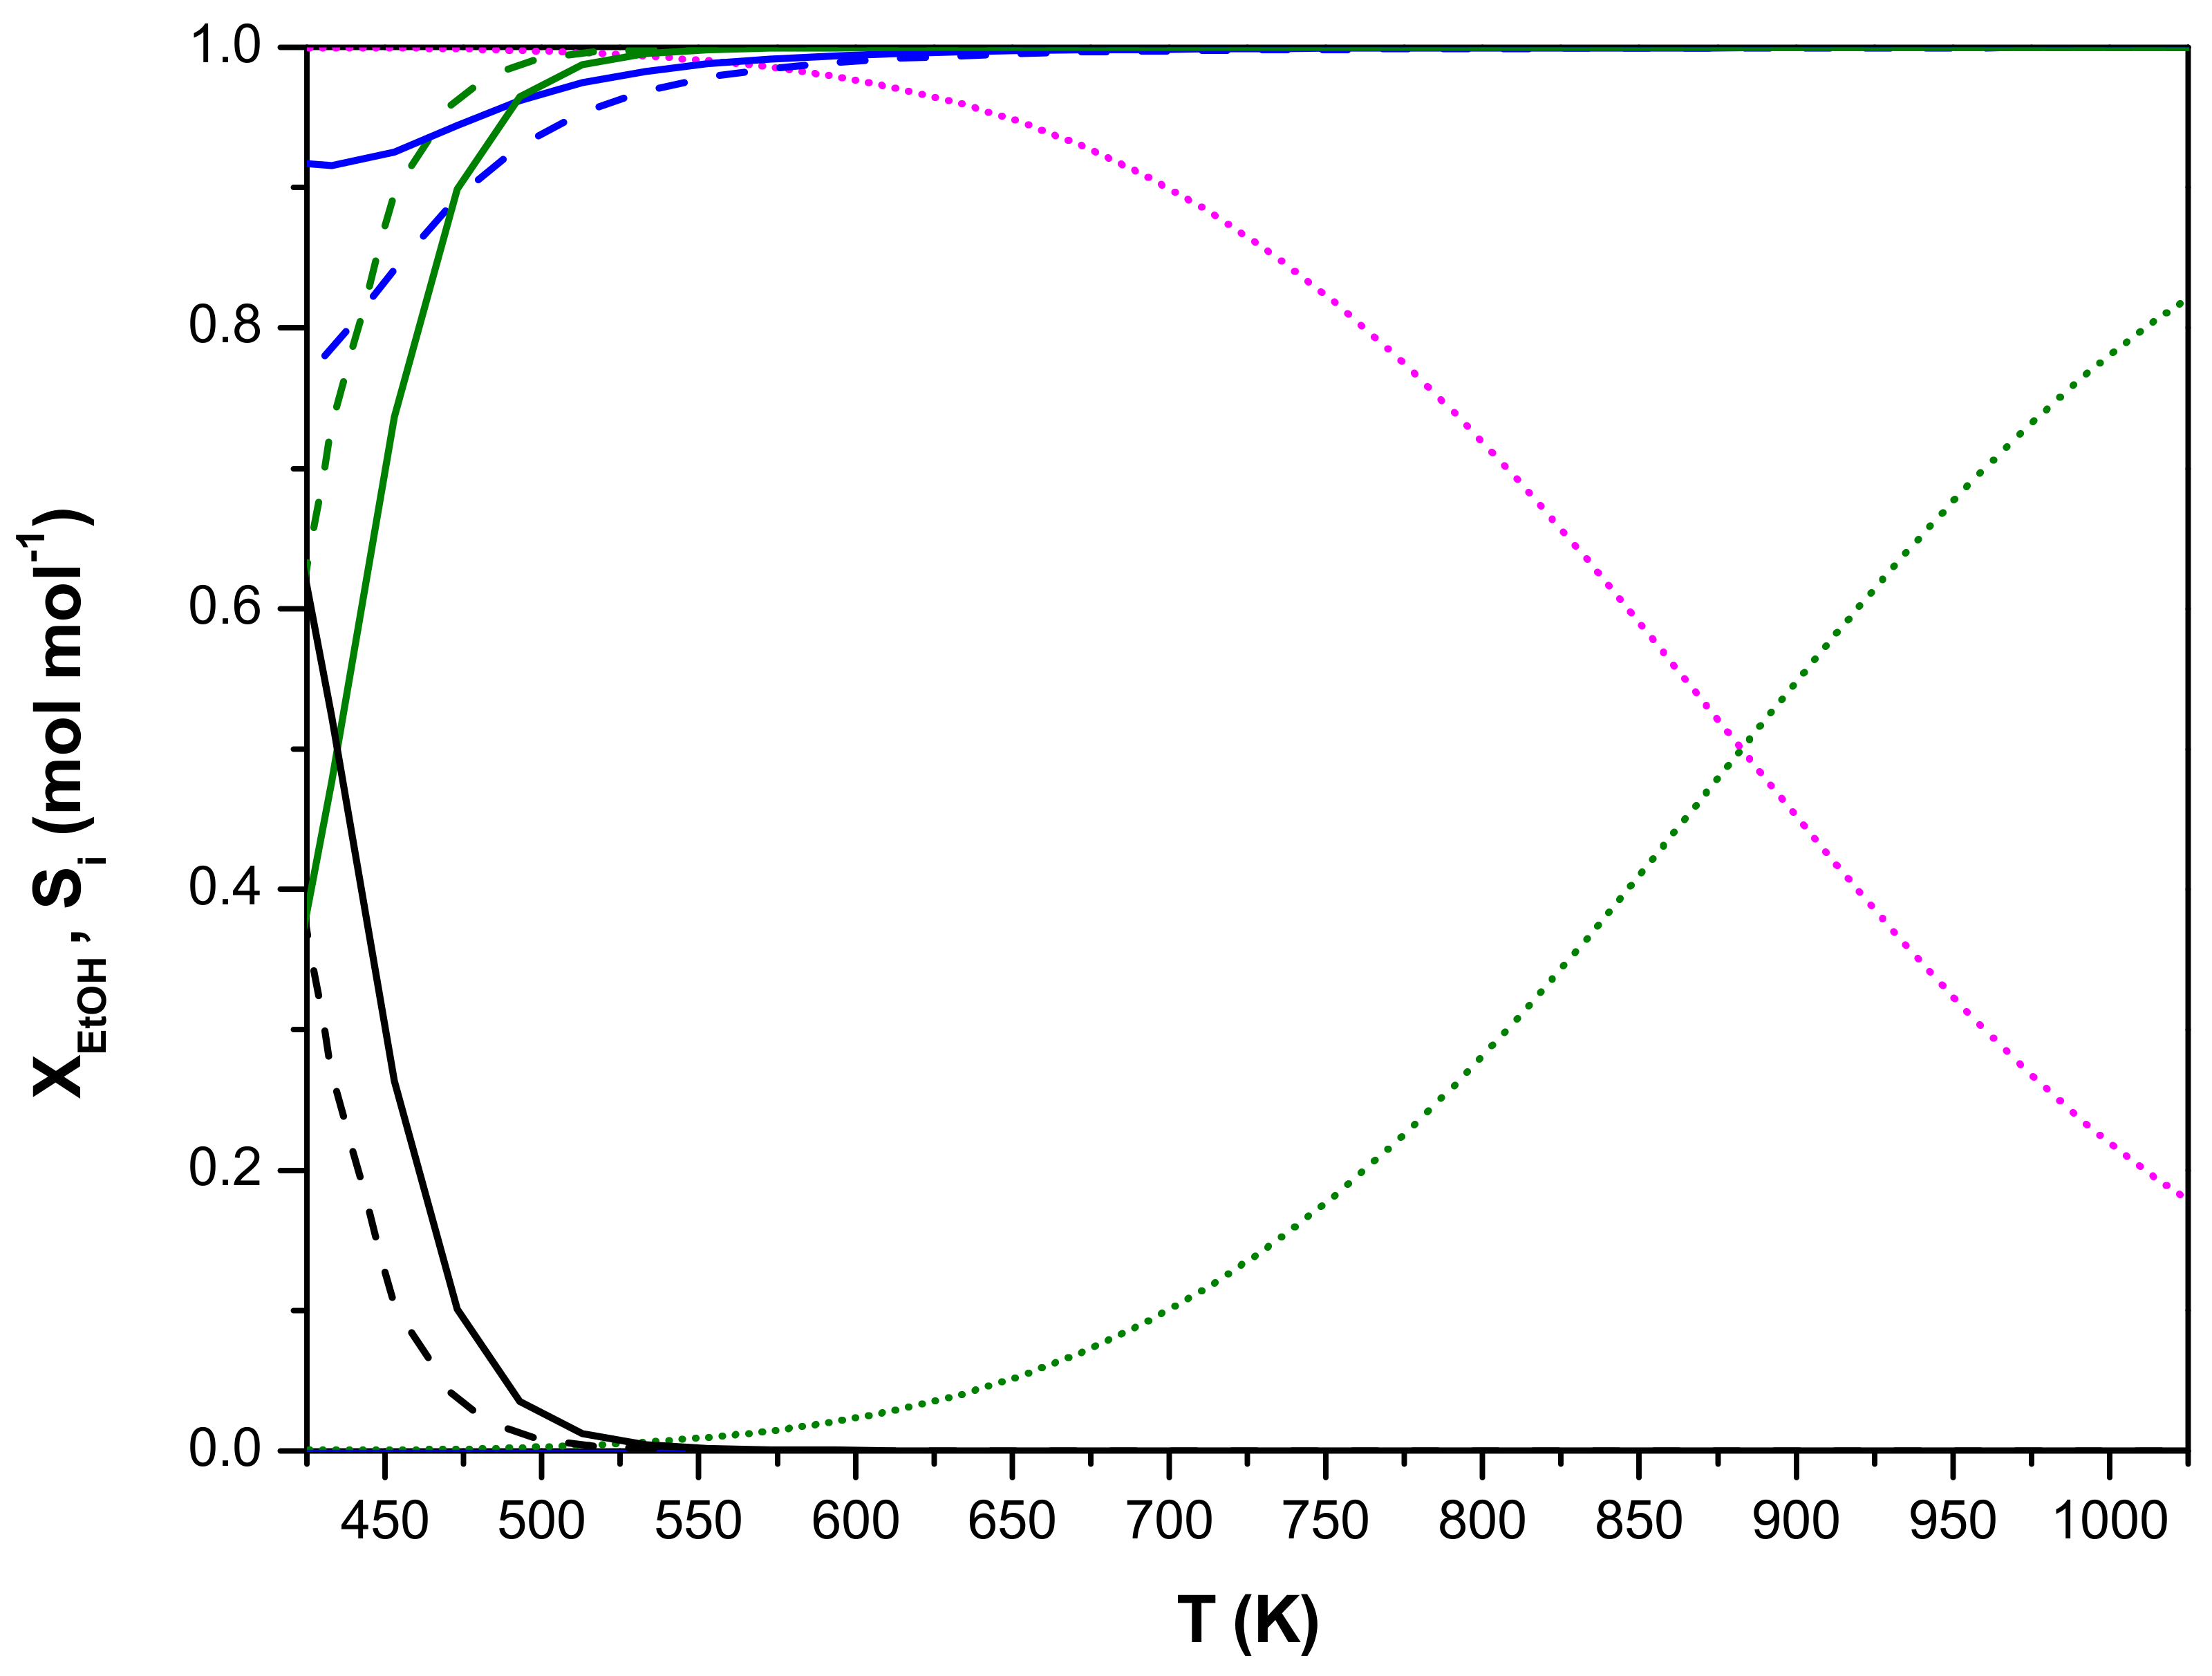
The dehydration of pure ethanol was found to be complete at 600 K, as shown in Figure 7. At low temperatures, the major product was di-ethyl ether, which gradually decreased with the temperature in favor of ethene. It was possible to achieve 100% selectivity towards ethene, i.e., no thermodynamic constraints were encountered in the industrial implementation of this process. The addition of water at the reactor inlet resulted in lower ethanol conversion and higher selectivity towards ethene at lower temperatures. Nevertheless, the ethanol conversion was still complete at temperatures exceeding 650 K.
Taking into account ethene dimerization as a representative for the formation of higher hydrocarbons, it was shown that ethanol conversion remained complete over the entire temperature range shown in Figure 7. However, 1-butene was now the major product when solely considering thermodynamics. Only at temperatures exceeding 650 K, ethene became the principal product. This illustrates the existing competition between ethanol dehydration and the subsequent formation of higher hydrocarbons.
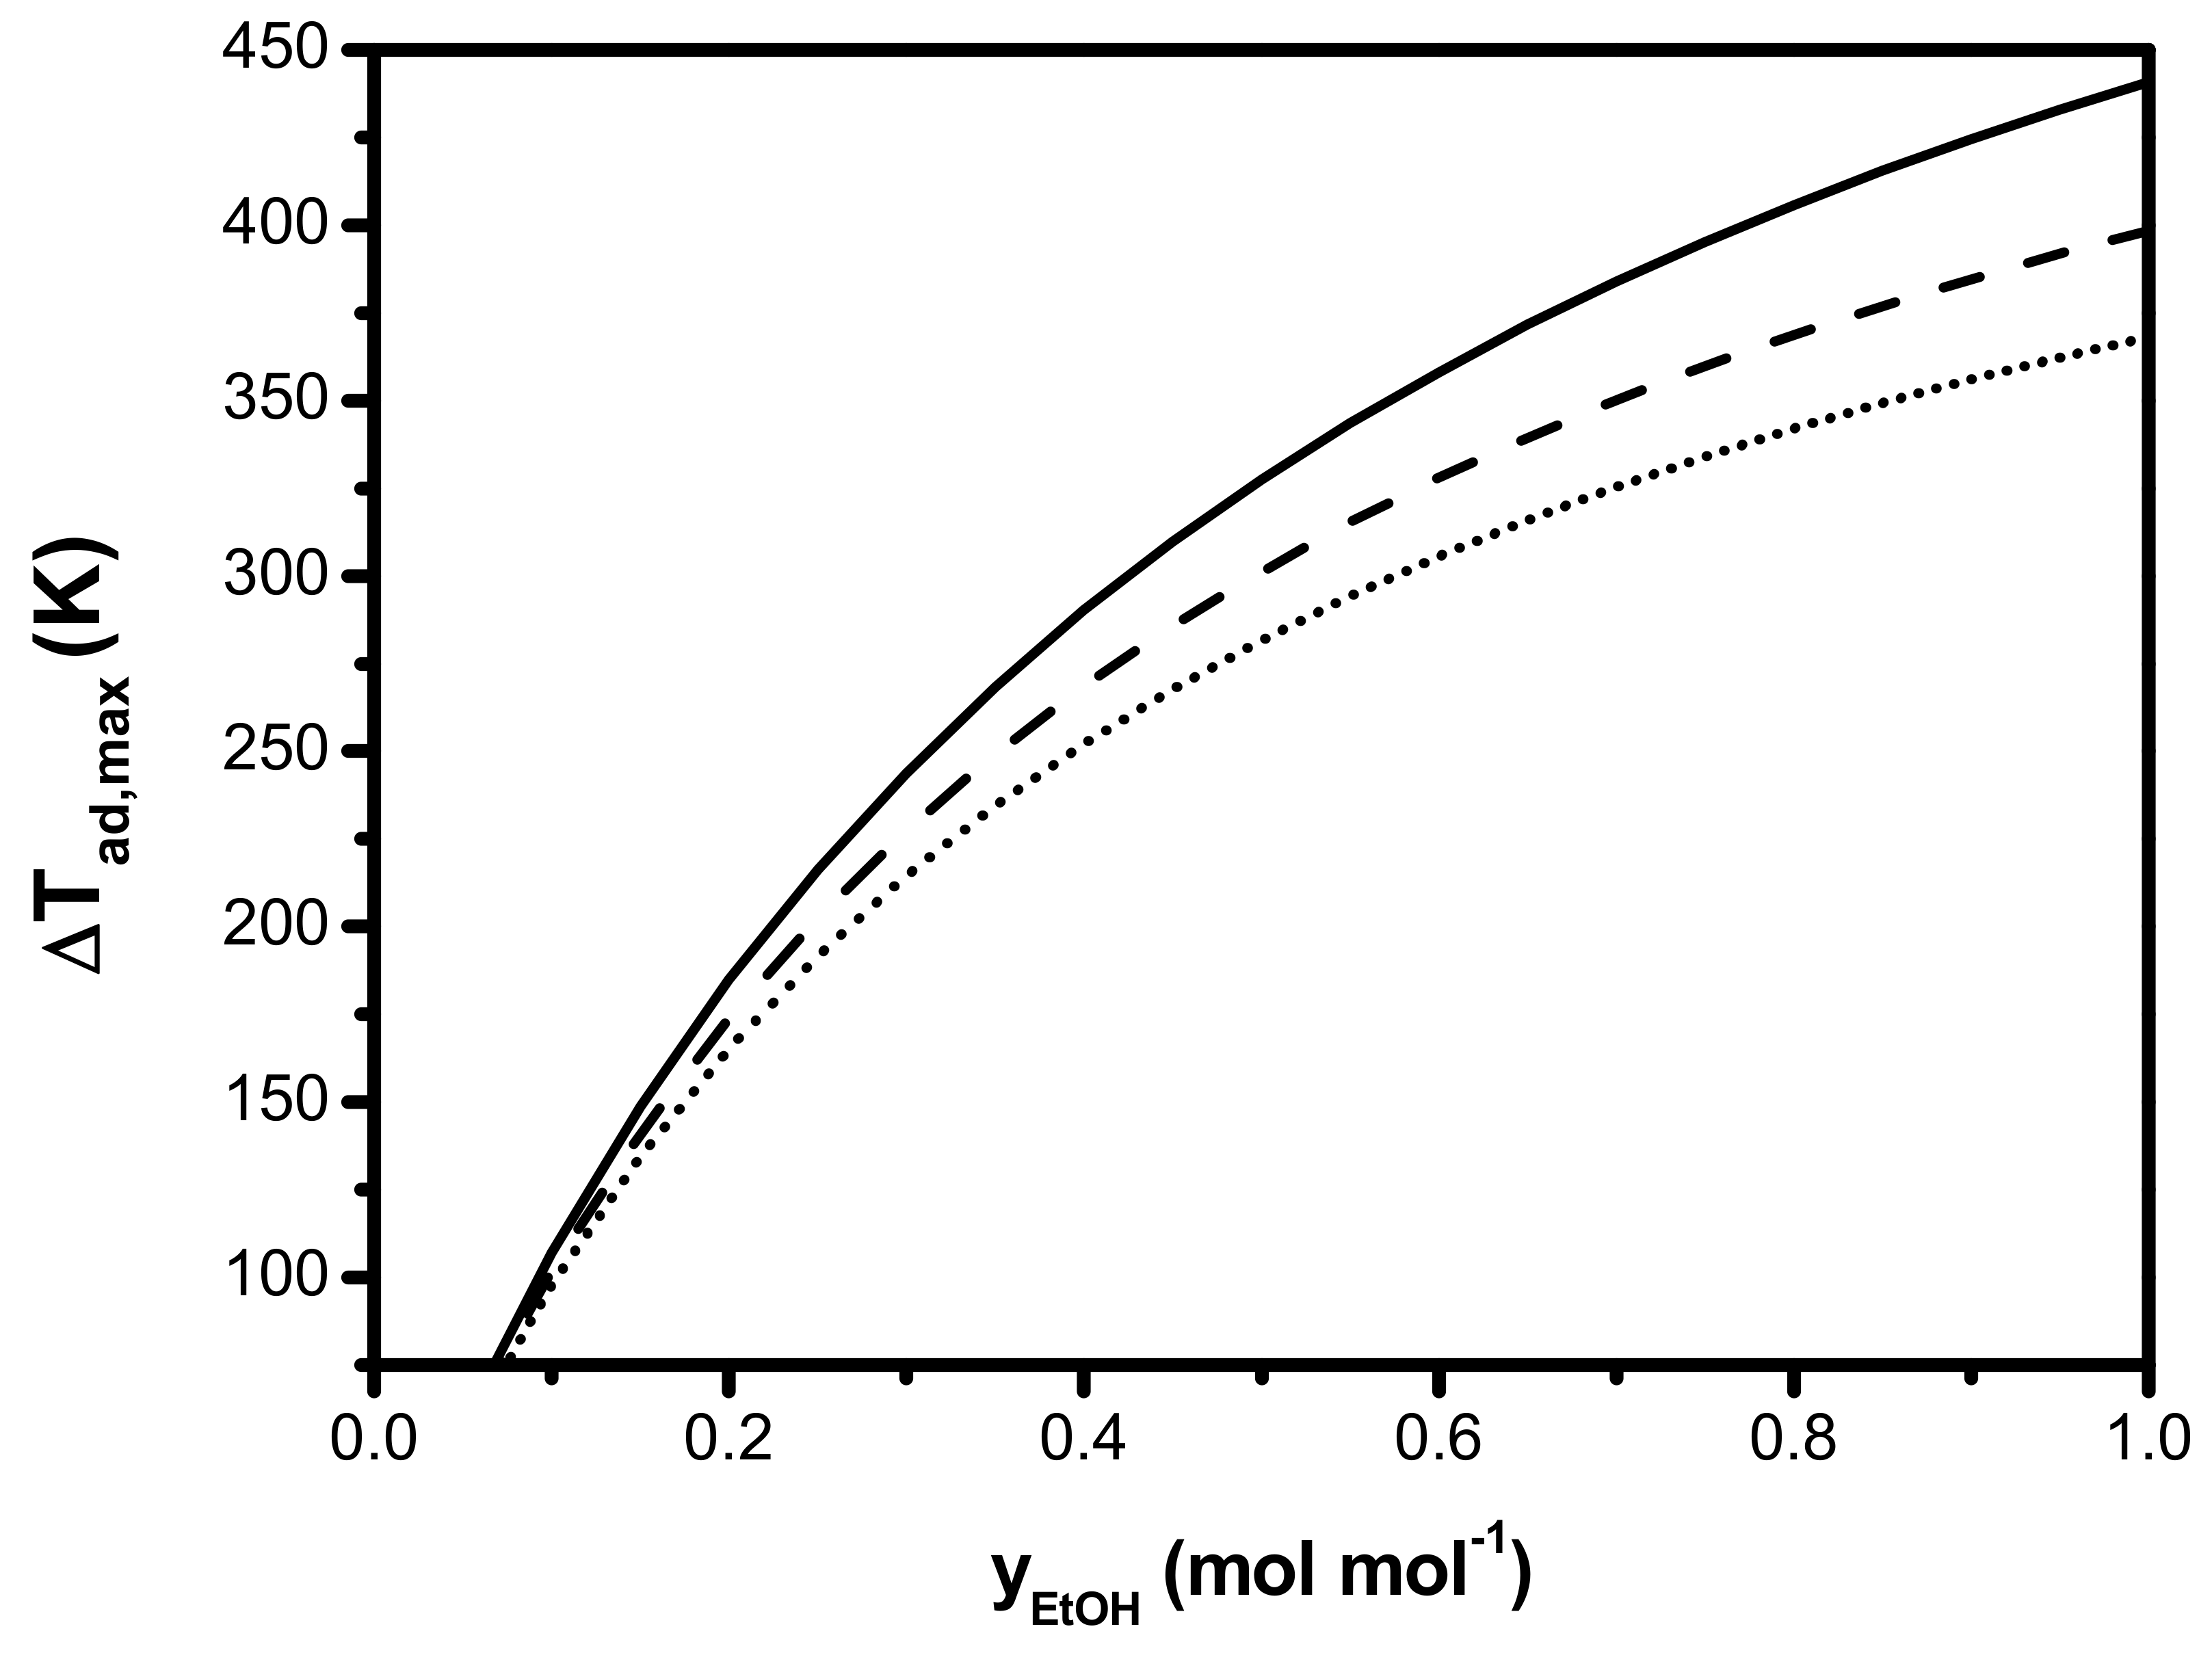
The effect of the ethanol content in the feed on the maximum adiabatic temperature drop is illustrated in Figure 8. The higher the ethanol content, the higher the maximum adiabatic temperature drop over the reactor. This is related to changes in the mixture heat capacity due to changes in feed composition. At 673 K, a pure ethanol feed would result in a total temperature drop amounting to 400 K, while the aqueous conditions investigated in this work only resulted in a temperature drop of 119 K. As heat is consumed along the reactor with increasing ethanol conversion due to the endothermicity of monomolecular ethanol dehydration, a higher water content has a higher heat buffering effect that can be utilized throughout the reaction. At low ethanol content, the reactor inlet temperature effect on the maximum adiabatic temperature drop can be neglected. However, at high ethanol content, a substantial difference can be observed: a temperature difference of 70 K was found between 573 K and 773 K for a feed with no additional water. Hydrous ethanol is a particularly attractive feedstock because the production of anhydrous ethanol is very energy- and cost-intensive. In the context of zeolites, water can influence the kinetics of alcohol dehydration, potentially by competing with alcohol reactants for Brønsted acid sites, by shifting the dehydration–hydration equilibrium, and by inducing potentially different solvation strengths in all states along the reaction coordinates in zeolite [41]. Previously, it was reported that water in the ethanol feed enhances the steady-state catalytic activity of H-ZSM-5 and the selectivity for ethylene formation by possibly moderating the acidity of the catalytic sites, resulting in less extensive deactivation due to coking [42,43].
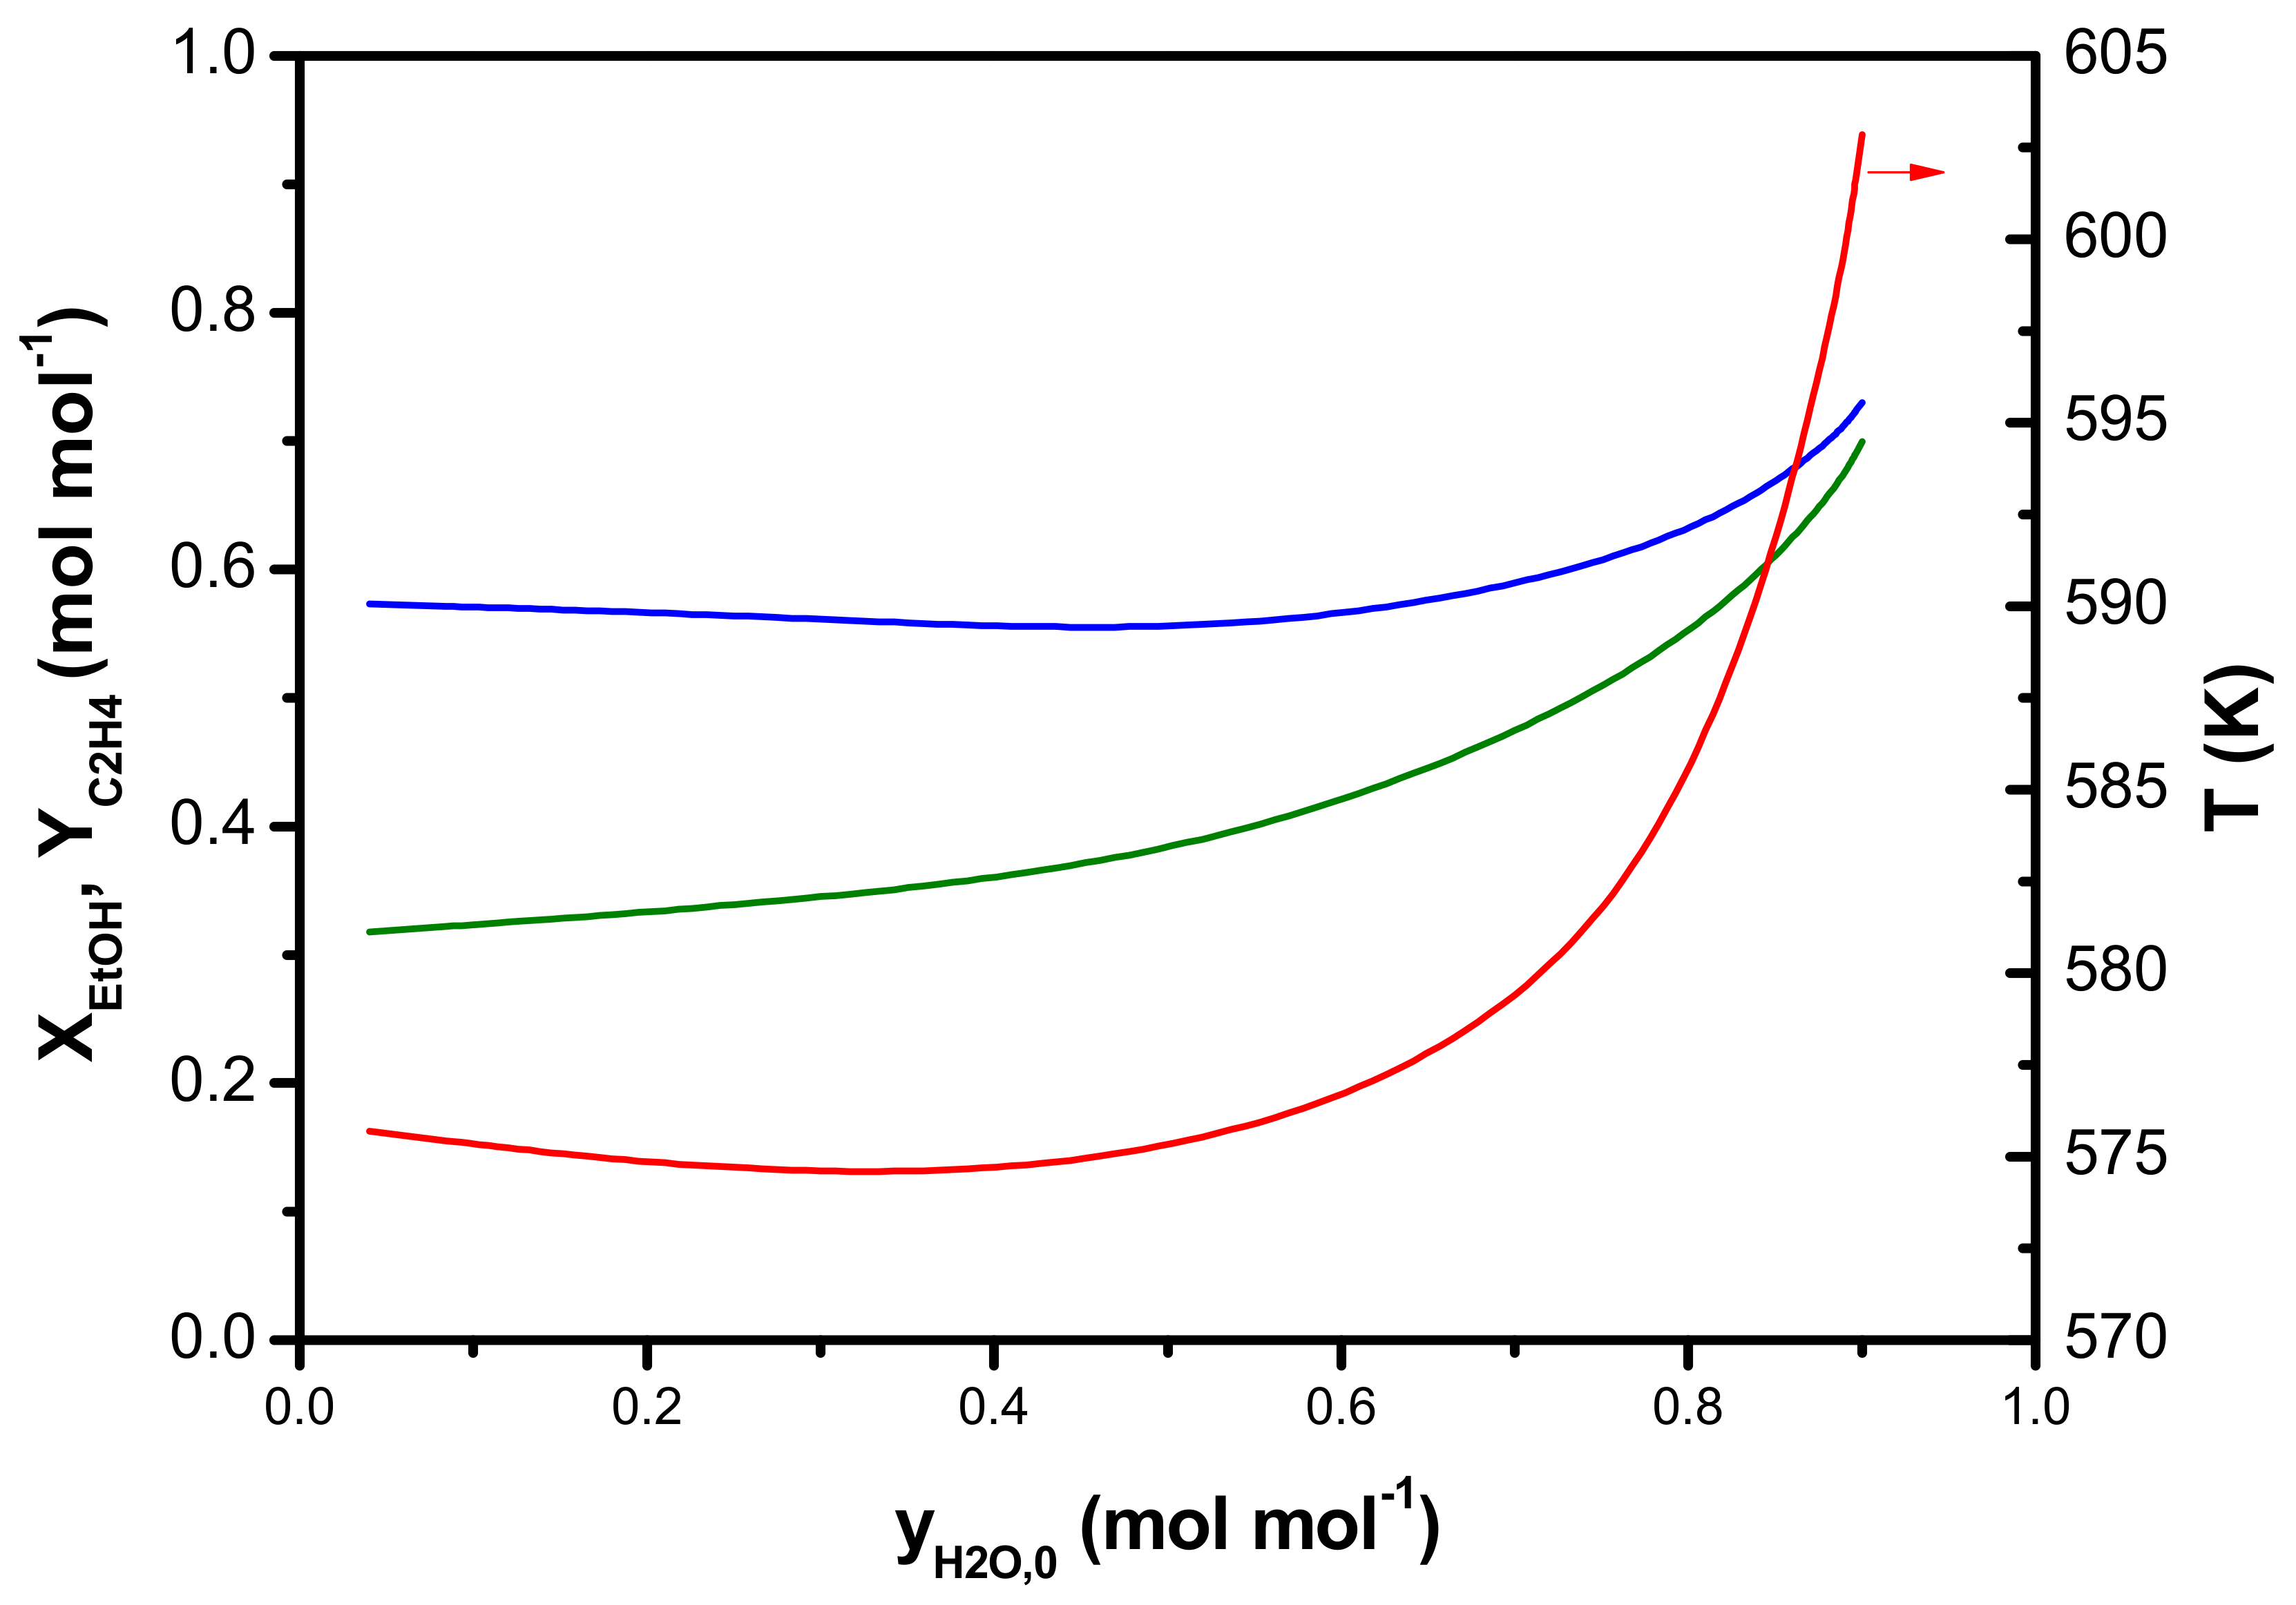
The effect of varying water contents on conversion, ethene yield, and temperature is shown in Figure 9. The highest conversion and ethene yield were obtained in the range of high water content. This high water content also resulted in the lowest adiabatic temperature drop, as shown in Figure 8, and, hence, in overall higher reaction rates compared to less diluted ethanol feeds. However, this can only be assessed when also the size and cost of the other pieces of equipment (compressors) are taken into account.
Decreasing the water content resulted in a decreased ethanol conversion and, remarkably, also a decreased ethene yield (Figure 9). At high water content, the ratio between ethene yield and ethanol conversion was close to one, but decreasing the water content decreased this ratio. Instead, di-ethyl ether was produced in higher quantities, which lowered the ethene production. Higher ethanol partial pressures favored the formation of di-ethyl ether and decreased ethene selectivity. Dimerization of ethene to 1-butene was not observed to a significant extent in any of the case studies. The temperature drop observed in the reactor was not as pronounced as shown in Figure 9, which is related to ethanol conversion to di-ethyl ether, i.e., a mildly exothermic reaction. A less pronounced temperature drop due to high water content automatically resulted in a higher conversion, as can be seen in Figure 9.
These simulation results are in line with patent literature showing the necessity of introducing a heat carrying fluid in the reactor when working with a pure ethanol feed. The use of water vapor has been proposed. This water may come from an external source or be produced internally in the process and recycled from the effluent [4]. Without effluent separation into ethane and water, the latter is not advisable as ethane recycling towards the reactor inlet affects the thermodynamic equilibrium of the dehydration reaction. Ethene also participates in the subsequent conversion to higher hydrocarbons, which will increase the yield of secondary products.

6. Conclusions

A fully ab initio reaction network for ethanol dehydration on H-ZSM-5 was used to simulate an industrial multi-bed adiabatic reactor. Internal transport limitations inside the catalyst pellet needed to be explicitly accounted for, while no external transport limitations nor internal heat transport limitations were diagnosed at the conditions investigated in this work. Good agreement was found with the literature results, i.e., temperature, pressure, and outlet flow rates. The industrial reactor model developed indicated that it is not beneficial to utilize feeds with high ethanol content, as they result in a lower ethanol conversion and ethene yield. Furthermore, a more pronounced temperature drop over the reactor was simulated. It is preferred to use a vapor feed more diluted with water for the operation of the industrial ethanol dehydration reactor. Of course, in order to properly assess an economically optimal configuration and reasonable feedstock properties, the investment and operating costs of the entire facility should be taken into account.

Author Contributions

Conceptualization, K.V.d.B., G.B.M. and V.V.G.; methodology, K.A., J.W.T. and K.T.; software, J.W.T. and K.T.; formal analysis, K.V.d.B.; data curation, K.V.d.B.; writing—original draft preparation, K.V.d.B.; writing—review and editing, K.V.d.B., J.W.T., K.A., K.T., V.V.G. and G.B.M; supervision, G.B.M and V.V.G.

Funding

This research was funded by e ‘Long-Term Structural Methusalem Funding with Grant No. BOF09/01M00409.

Conflicts of Interest

The authors declare no conflict of interest.

List of Symbols

Roman symbols
*free acid sitessur
Arface area of the cross section of the reactor [m2]
cpspecific heat capacity [J kg−1 K−1]
Cpspecific molar heat capacity [J mol−1 K−1]
C i concentration of component i in the pellet [ mol   kg cat 1 ]
Ctacid site concentration [molH+ kg−1]
ddiameter [m]
D e , i effective diffusion coefficient of component i [m2 s−1]
ffriction factor [-]
F i molar flow rate of gas phase component i [mol s−1]
Gmass flow rate [kg s−1]
Δ G Gibbs free energy of reaction [J mol−1]
hPlanck constant = 6.63. 10−34 m2 kg s−1
Δ H enthalpy of reaction [J mol−1]
kBBoltzmann’s constant = 1.38. 10−23 m2 kg s−2 K−1
kjrate coefficient of elementary step j [variable]
Mmolecular mass [kg mol−1]
napparent order of reaction
ncompnumber of components
Nimolar flux of i with respect to a fixed plane [mol m−2 s−1]
pipartial pressure of component i [Pa]
pttotal reactor pressure [Pa]
ussuperficial velocity [m s−1]
rradius of the catalyst pellet [m]
Runiversal gas constant = 8.31 J mol−1 K−1
Rinet production rate of component i [mol molH+−1 s−1]
Siselectivity of component i [mol mol−1]
Δ S entropy of reaction [J mol−1 K−1]
Ttemperature [K]
vstoichiometric coefficient
Vvolume [m³]
Wcatalyst mass [kg]
Xiconversion of component i [mol mol−1]
yimolar fraction of component i in the gas phase [mol mol−1]
Yiyield of component i [mol mol−1]
Greek symbols
ε porosity [-]
η catalyst effectiveness [-]
μ dynamic viscosity [Pa s]
ρ density [kg m−3]
ξ dimensionless distance [-]
θ k fractional coverage of surface species k [-]
Subscripts
bcatalyst bed
blbulk
fformation
flfluid
igas phase species
jelementary step
ksurface species
pcatalyst pellet
porepore
mmixture
rreaction
rreactor
ssurface
vvolumetric
Subscripts
¯ average
activation
°inlet
°standard
C2H4ethene
EtOHethanol

References

  1. Derouane, E.G.; Nagy, J.B.; Dejaifve, P.; Vanhooff, J.H.C.; Spekman, B.P.; Vedrine, J.C.; Naccache, C. Elucidation of Mechanism of Conversion of Methanol and Ethanol to Hydrocarbons on a New Type of Synthetic Zeolite. J. Catal. 1978, 53, 40–55. [Google Scholar] [CrossRef]
  2. Sheldon, R.A. Green and sustainable manufacture of chemicals from biomass: State of the art. Green Chem. 2014, 16, 950–963. [Google Scholar] [CrossRef]
  3. Donnis, B.; Egeberg, R.G.; Blom, P.; Knudsen, K.G. Hydroprocessing of Bio-Oils and Oxygenates to Hydrocarbons. Understanding the Reaction Routes. Top. Catal. 2009, 52, 229–240. [Google Scholar] [CrossRef]
  4. Barrocas, H.V.V.; da Silva, J.B.d.M.; de Assis, R.C. Process for Preparing Ethene. U.S. Patent 4232179 A, 4 November 1980. [Google Scholar]
  5. Phung, T.K.; Hernández, L.P.; Lagazzo, A.; Busca, G. Dehydration of Ethanol over Zeolites, Silica Alumina and Alumina: Lewis Acidity, Brønsted Acidity and Confinement EffectsAppl. Catal. A: General 2015, 493, 77–89. [Google Scholar] [CrossRef]
  6. Coupard, V.; Touchais, N.; Fleurier, S.; Penas, H.G.; de Smedt, P.; Vermeiren, W.; Adam, C.; Minoux, D. Process for Dehydration of Dilute Ethanol into Ethylene with Low Energy Consumption without Recycling of Water. U.S. Patent 20130090510 A1, 11 April 2013. [Google Scholar]
  7. Jiang, B.; Feng, X.; Yan, L.; Jiang, Y.; Liao, Z.; Wang, J.; Yang, Y. Methanol to Propylene Process in a Moving Bed Reactor with Byproducts Recycling: Kinetic Study and Reactor Simulation. Ind. Eng. Chem. Res. 2014, 53, 4623–4632. [Google Scholar] [CrossRef]
  8. Lee, W.L.; Froment, G.F. Ethylbenzene Dehydrogenation into Styrene: Kinetic Modeling and Reactor Simulation. Ind. Eng. Chem. Res. 2008, 47, 9183–9194. [Google Scholar] [CrossRef]
  9. Froment, G.F.; Depauw, G.A.; Vanrysselberghe, V. Kinetic Modeling and Reactor Simulation in Hydrodesulfurization of Oil Fractions. Ind. Eng. Chem. Res. 1994, 33, 2975–2988. [Google Scholar] [CrossRef]
  10. Dewachtere, N.V.; Santaella, F.; Froment, G.F. Application of a single-event kinetic model in the simulation of an industrial riser reactor for the catalytic cracking of vacuum gas oil. Chem. Eng. Sci. 1999, 54, 3653–3660. [Google Scholar] [CrossRef]
  11. Batchu, R.; Galvita, V.V.; Alexopoulos, K.; Glazneva, T.S.; Poelman, H.; Reyniers, M.-F.; Marin, G.B. Ethanol dehydration pathways in H-ZSM-5: Insights from temporal analysis of products. Catal. Today 2019. [Google Scholar] [CrossRef]
  12. Sabbe, M.K.; van Geem, K.M.; Reyniers, M.F.; Marin, G.B. First Principle-Based Simulation of Ethane Steam Cracking. AiChe J. 2011, 57, 482–496. [Google Scholar] [CrossRef]
  13. Jacobsen, C.J.H.; Dahl, S.; Boisen, A.; Clausen, B.S.; Topsøe, H.; Logadottir, A.; Nørskov, J.K. Optimal Catalyst Curves: Connecting Density Functional Theory Calculations with Industrial Reactor Design and Catalyst Selection. J. Catal. 2002, 205, 382–387. [Google Scholar] [CrossRef]
  14. Sabbe, M.K.; Canduela-Rodriguez, G.; Reyniers, M.-F.; Marin, G.B. DFT-based modeling of benzene hydrogenation on Pt at industrially relevant coverage. J. Catal. 2015, 330, 406–422. [Google Scholar] [CrossRef]
  15. Alwahabi, S.M.; Froment, G.F. Conceptual Reactor Design for the Methanol-to-Olefins Process on SAPO-34. Ind. Eng. Chem. Res. 2004, 43, 5112–5122. [Google Scholar] [CrossRef]
  16. Park, T.-Y.; Froment, G.F. Analysis of Fundamental Reaction Rates in the Methanol-to-Olefins Process on ZSM-5 as a Basis for Reactor Design and Operation. Ind. Eng. Chem. Res. 2004, 43, 682–689. [Google Scholar] [CrossRef]
  17. Zhuang, Y.-Q.; Gao, X.; Zhu, Y.-P.; Luo, Z.-H. CFD modeling of methanol to olefins process in a fixed-bed reactor. Powder Technol. 2012, 221, 419–430. [Google Scholar] [CrossRef]
  18. Zhao, Y.; Li, H.; Ye, M.; Liu, Z. 3D Numerical Simulation of a Large Scale MTO Fluidized Bed Reactor. Ind. Eng. Chem. Res. 2013, 52, 11354–11364. [Google Scholar] [CrossRef]
  19. Berger, R.J.; Stitt, E.H.; Marin, G.B.; Kapteijn, F.; Moulijn, J.A. Eurokin. Chemical Reaction Kinetics in Practice. CATTECH 2001, 5, 36–60. [Google Scholar] [CrossRef]
  20. Kokotailo, G.T.; Lawton, S.L.; Olson, D.H.; Olson, D.H.; Meier, W.M. Structure of Synthetic Zeolite ZSM-5. Nature 1978, 272, 437–438. [Google Scholar] [CrossRef]
  21. Weisz, P.B.; Prater, C.D. Interpretation of Measurements in Experimental Catalysis. In Advances in Catalysis; Frankenburg, V.I.K.W.G., Rideal, E.K., Eds.; Academic Press: New York, NY, USA, 1954; pp. 143–196. [Google Scholar]
  22. Mears, D.E. Diagnostic Criteria for Heat Transport Limitations in Fixed Bed Reactors. J. Catal. 1971, 20, 127–132. [Google Scholar] [CrossRef]
  23. Froment, G.F.; de Wilde, J.; Bischoff, K.B. Chemical Reactor Analysis and Design, 3rd ed.; Wiley: Hoboken, NJ, USA, 2011. [Google Scholar]
  24. Reid, R.C.; Prausnitz, J.M.; Sherwood, T.K. The Properties of Gases and Liquids, 3rd ed.; McGraw-Hill: New York, NY, USA, 1977. [Google Scholar]
  25. Hicks, R.E. Pressure Drop in Packed Beds of Spheres. Ind. Eng. Chem. Fundam. 1970, 9, 500–502. [Google Scholar] [CrossRef]
  26. Haughey, D.P.; Beveridge, G.S.G. Structural properties of packed beds—A review. Can. J. Chem. Eng. 1969, 47, 130–140. [Google Scholar] [CrossRef]
  27. Bosanquet, C.H. British TA Report BR-507; Springer: London, UK, 1944. [Google Scholar]
  28. Maxwell, J.C. On the Dynamical Theory of Gases. Philos. Trans. R. Soc. Lond. 1867, 157, 49–88. [Google Scholar]
  29. Stefan, J. Über das Gleichgewicht un die Bewegung, insbesondere die Diffusion von Gasgemengen. Sitzungsberichte Akad Wiss Wien 1871, 63, 63–124. [Google Scholar]
  30. Wilke, C. Diffusional properties of multicomponent gases. Chem. Eng. Prog. 1950, 46, 95–104. [Google Scholar]
  31. Solsvik, J.; Jakobsen, H.A. Modeling of multicomponent mass diffusion in porous spherical pellets: Application to steam methane reforming and methanol synthesis. Chem. Eng. Sci. 2011, 66, 1986–2000. [Google Scholar] [CrossRef]
  32. Solsvik, J.; Jakobsen, H.A. Multicomponent mass diffusion in porous pellets: Effects of flux models on the pellet level and impacts on the reactor level. Application to methanol synthesis. Can. J. Chem. Eng. 2013, 91, 66–76. [Google Scholar] [CrossRef]
  33. Thybaut, J.W.; Marin, G.B. Single-Event MicroKinetics: Catalyst design for complex reaction networks. J. Catal. 2013, 308, 352–362. [Google Scholar] [CrossRef]
  34. Fuller, E.N.; Schettle, P.; Giddings, J.C. A New Method for Prediction of Binary Gas-Phase Diffusion Coeffecients. Ind. Eng. Chem. 1966, 58, 19. [Google Scholar]
  35. Reid, R.C.; Prausnitz, J.M.; Poling, B.E. The Properties of Gases and Liquids, 4th ed.; McGraw-Hill: New York, NY, USA, 1987. [Google Scholar]
  36. Reyniers, M.-F.; Marin, G.B. Experimental and Theoretical Methods in Kinetic Studies of Heterogeneously Catalyzed Reactions. Annu. Rev. Chem. Biomol. Eng. 2014, 5, 563–594. [Google Scholar] [CrossRef]
  37. Alexopoulos, K.; John, M.; van der Borght, K.; Galvita, V.; Reyniers, M.-F.; Marin, G.B. DFT-based microkinetic modeling of ethanol dehydration in H-ZSM-5. J. Catal. 2016, 339, 173–185. [Google Scholar] [CrossRef]
  38. Johansson, R.; Hruby, S.L.; Rass-Hansen, J.; Christensen, C.H. The Hydrocarbon Pool in Ethanol-to-Gasoline over HZSM-5 Catalysts. Catal. Lett. 2009, 127, 1–6. [Google Scholar] [CrossRef]
  39. Madeira, F.F.; Gnep, N.S.; Magnoux, P.; Vezin, H.; Maury, S.; Cadran, N. Mechanistic insights on the ethanol transformation into hydrocarbons over HZSM-5 zeolite. Chem. Eng. J. 2010, 161, 403–408. [Google Scholar] [CrossRef]
  40. Aguayo, A.T.; Gayubo, A.G.; Atutxa, A.; Olazar, M.; Bilbao, J. Catalyst deactivation by coke in the transformation of aqueous ethanol into hydrocarbons. Kinetic modeling and acidity deterioration of the catalyst. Ind. Eng. Chem. Res. 2002, 41, 4216–4224. [Google Scholar] [CrossRef]
  41. Macht, J.; Janik, M.J.; Neurock, M.; Iglesia, E. Mechanistic Consequences of Composition in Acid Catalysis by Polyoxometalate Keggin Clusters. J. Am. Chem. Soc. 2008, 130, 10369–10379. [Google Scholar] [CrossRef] [PubMed]
  42. Phillips, C.B.; Datta, R. Production of ethylene from hydrous ethanol on H-ZSM-5 under mild conditions. Ind. Eng. Chem. Res. 1997, 36, 4466–4475. [Google Scholar] [CrossRef]
  43. Zhi, Y.C.; Shi, H.; Mu, L.Y.; Liu, Y.; Mei, D.H.; Camaioni, D.M.; Lercher, J.A. Dehydration Pathways of 1-Propanol on HZSM-5 in the Presence and Absence of Water. J. Am. Chem. Soc. 2015, 137, 15781–15794. [Google Scholar] [CrossRef]
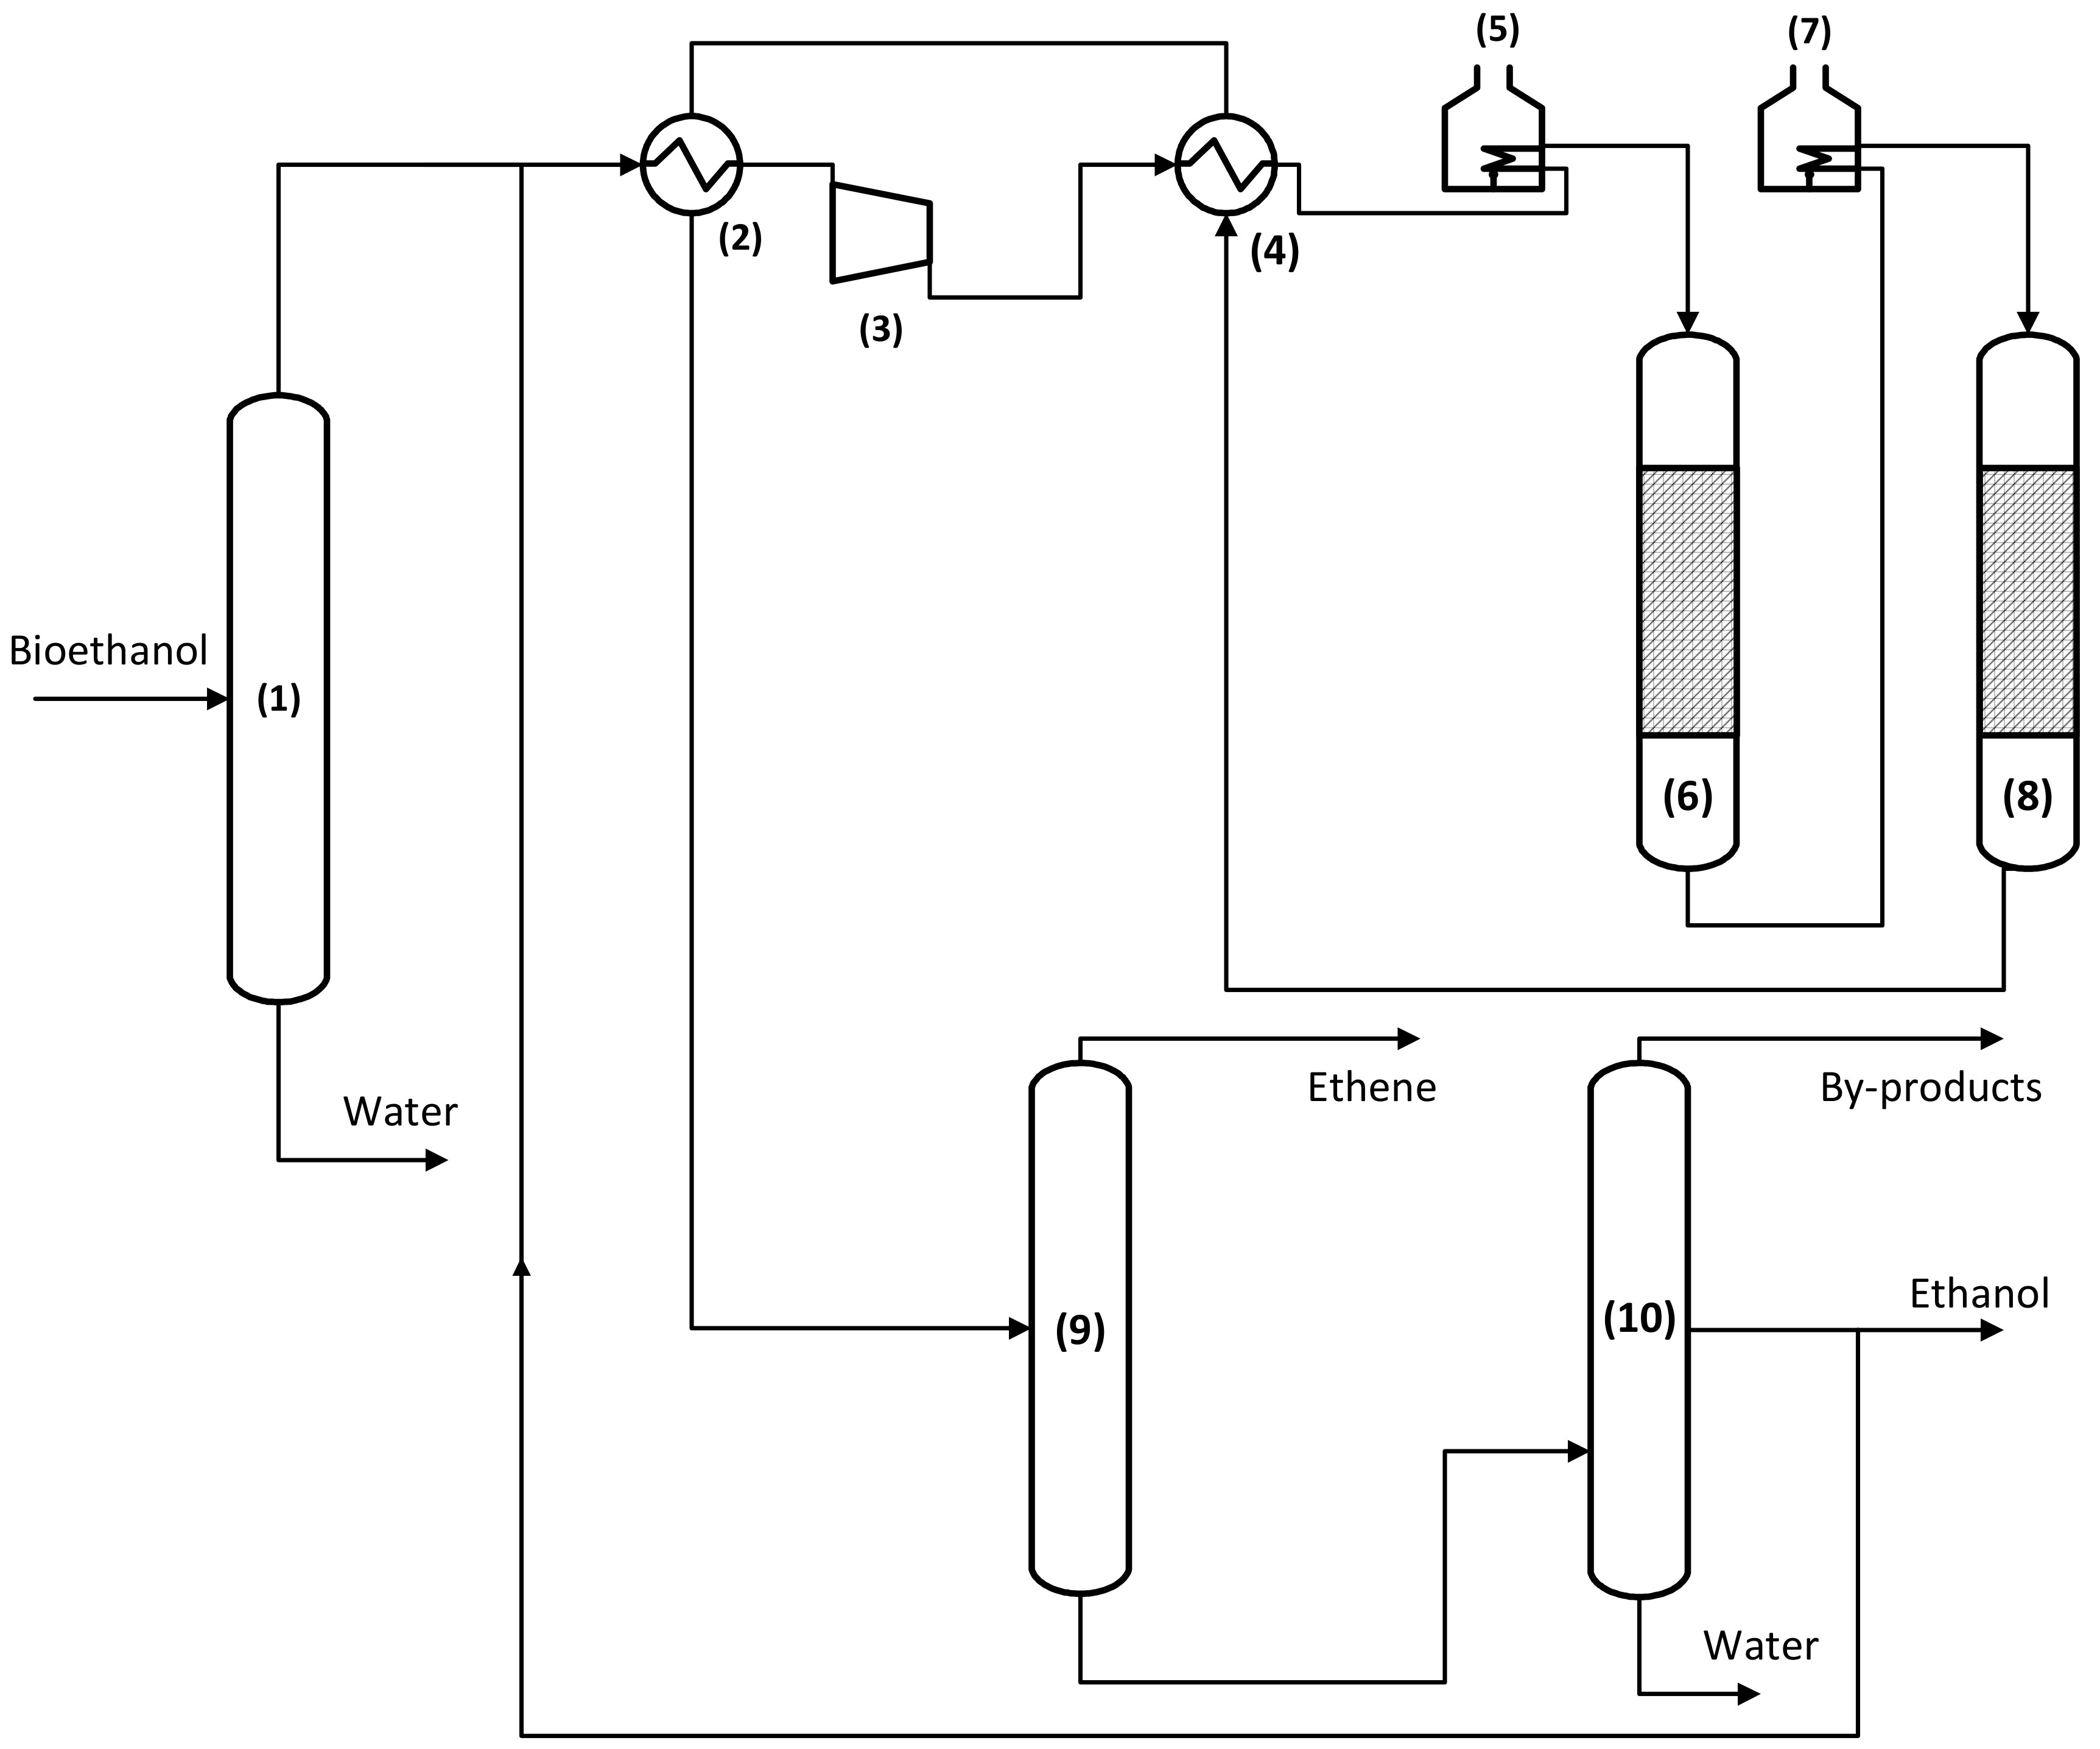
Figure 1. Flow sheet of an ethanol dehydration plant [6] consisting of (1) a pretreatment distillation column, (2) and (4) heat exchangers, (3) a compressor, (5) and (7) heating furnaces, (6) and (8) ethanol dehydration reactors, and (9) and (10) gas/liquid separation columns.
Catalysts 09 00921 g001
Figure 2. Internal mass transfer limitations assessed by the Weisz–Prater criterion (Equation (1)) in an industrial ethanol dehydration reactor as a function of particle diameter d, which can correspond either to the crystallite diameter, i.e., dc, or to the pellet diameter, i.e., dp, and the effective diffusion coefficient De,i. The black line indicates the criterion limit of 0.08. Boxes indicate the typical ranges of diffusion coefficient and diameter for either crystallite or pellet. (Green: no internal mass transport limitations; red: internal mass transport limitations).
Catalysts 09 00921 g002
Figure 3. Graphical representation of the fixed bed reactor for ethanol dehydration.
Catalysts 09 00921 g003
Figure 4. Reaction network used for the simulation of the industrial reactor (red: monomolecular dehydration, green: bimolecular dehydration, blue: di-ethyl ether decomposition, magenta: ethene dimerization). Modified from Alexopoulos et al. [36].
Catalysts 09 00921 g004
Figure 5. Ethanol conversion ( X EtOH ,   blue ), ethene, di-ethyl ether, and butene yield (green: Y C 2 H 4 ;   black :   Y DEE ;   magenta ;   Y C 4 H 8 ), and temperature profiles (T) as a function of catalyst mass. The inset shows the pressure drop (pt) as a function of catalyst mass. Calculations were made by integration of Equations (5)–(7) and (12) and simultaneously solving Equations (26) and (28) with the corresponding net production rates as defined in Equation (27), with parameters taken from Table 2 and the experimental conditions given in Table 3. Square symbols indicate the experimental points from [4] given in Table 4.
Catalysts 09 00921 g005
Figure 6. Catalyst effectiveness factor, calculated by Equation (21), as a function of catalyst mass. The inset shows the relative concentration profile along the dimensionless catalyst pellet diameter. Calculations were made by integration of Equations (5)–(7) and (12) and simultaneously solving Equations (26) and (28) with the corresponding net production rates as defined in Equation (27), with parameters taken from Table 2 and the experimental conditions given in Table 3.
Catalysts 09 00921 g006
Figure 7. Thermodynamic equilibrium of ethanol conversion (blue) and selectivity towards ethene (green), di-ethyl ether (black), and 1-butene (magenta) as a function of temperature. Full line: ethanol dehydration (Equations (22)–(24)) with no additional water (case I); dashed line: ethanol dehydration (Equations (22)–(24)) with 90 mol% water (case II); dotted line: ethanol dehydration with ethene dimerization (Equations (22)–(25)) including 1-butene as a product (case III).
Catalysts 09 00921 g007
Figure 8. Maximum adiabatic temperature drop (Equation (34)) as a function of molar ethanol fraction in the feed for three different reactor inlet temperatures (full line: 573 K, dashed line: 673 K, dotted line: 773 K) and the process conditions indicated in Table 3.
Catalysts 09 00921 g008
Figure 9. Ethanol conversion (XEtOH, blue), ethene yield (YC2H4, green), and temperature (T, red) as a function of water inlet content. Calculations were made by integration of Equations (5)–(7) and (12) and simultaneously solving Equations (26) and (28) with the corresponding net production rates as defined in Equation (27), with parameters taken from Table 2 and the experimental conditions given in Table 3.
Catalysts 09 00921 g009
Table 1. External and internal heat and mass transport limitations in an industrial ethanol dehydration reactor.
Heat Transport Limitations
ExternalEquation (3) Δ T film 0.012<2.35
InternalEquation (4) Δ T pellet 0.736<2.35
Mass transport limitations
ExternalEquation (2)Ca0.00764<0.05
InternalEquation (1) See Figure 2
Table 2. Standard reaction enthalpy ( Δ H r 0 in kJ mol−1), standard reaction entropy ( Δ S r 0 in J mol−1 K−1), activation energy ( E a f in kJ mol−1), and pre-exponential factor ( A f in s−1 or 10−2 kPa−1 s−1) of the forward reaction for the elementary steps, numbered as indicated in Figure 4. The activation steps are indicated in bold.
Elementary Steps Δ H r 0 Δ S r 0 E a f A f
1EtOH(g) + * ↔ M1−122−167--
2M1 ↔ M2147--
3M2 ↔ Ethoxy + H2O(g)771461184.0 1013
4Ethoxy ↔ Ethene(ads)44601069.4 1012
5Ethene(ads) ↔ C2H4(g) + * 4899--
6M1 + EtOH(g) ↔ D1−99−162--
7D1 ↔ D24424--
8D2 ↔ DEE(ads) + H2O(g)16125923.5 1012
9DEE(ads) ↔ DEE(g)139165--
10DEE(ads) ↔ C1114511454.6 1013
11C1 ↔ Ethene* + EtOH(g)59175--
12Ethoxy + Ethene ↔ C2−33−113--
13C2 ↔ 1-butene(ads)−82−25811.7 1012
141-butene(ads) ↔ 1-butene + *90159--
15W ↔ H2O(g) + *83151--
Table 3. Experimental operating conditions: catalyst mass (Wt), inlet temperature (T0), and pressure (pt,0) for each adiabatic reactor and the annual ethene production capacity (GC2H4) and inlet water content for the first reactor (xEtOH,0).
Operating conditionReactor 1Reactor 2
W (ton)33
T0 (K)673679
pt,0 (kPa)590530
FC2H5OH,0 (kton y−1)360
xEtOH,00.26
Catalyst property
dp (m)4 10−3
ε p (-)0.6
τ (-)5
ρ p (kg m−3)700
Ct (mol kg−1)0.003
Table 4. Performance results, i.e., conversion (XEtOH), ethene, oxygenates, and C3+ olefin yield (respectively, YC2H4, Yoxy, Yole), temperature (T), and pressure (pt), as described in Coupard et al. [6].
XEtOH (-)YC2H4 (-)Yoxy (-)Yole(-)T (K)pt (kPa)
Outlet reactor 10.710.690.020.00591560
Outlet reactor 20.990.970.000.01653500