Article

Hydrodeoxygenation (HDO) of Aliphatic Oxygenates and Phenol over NiMo/MgAl2O4: Reactivity, Inhibition, and Catalyst Reactivation

by
Trine Marie Hartmann Dabros
1,2,
Mads Lysgaard Andersen
1,
Simon Brædder Lindahl
1,
Thomas Willum Hansen
3,
Martin Høj
1,
Jostein Gabrielsen
2,
Jan-Dierk Grunwaldt
4,5 and
Anker Degn Jensen
1,*
1
Department of Chemical and Biochemical Engineering, Technical University of Denmark (DTU), Søltofts Plads, Building 229, DK-2800 Kgs. Lyngby, Denmark
2
Haldor Topsøe A/S, Haldor Topsøes Allé 1, DK-2800 Kgs. Lyngby, Denmark
3
National Centre for Nano Fabrication and Characterization (DTU Nanolab), Technical University of Denmark (DTU), Fysikvej - Building 307, DK-2800 Kgs. Lyngby, Denmark
4
Institute for Chemical Technology and Polymer Chemistry, Karlsruhe Institute of Technology (KIT), Engesserstraße 20, D-76131 Karlsruhe, Germany
5
Institute of Catalysis Research and Technology, Karlsruhe Institute of Technology (KIT), Hermann-von-Helmholtz Platz 1, D-76344 Eggenstein-Leopoldshafen, Germany
*
Author to whom correspondence should be addressed.
Catalysts 2019, 9(6), 521; https://doi.org/10.3390/catal9060521
Submission received: 5 May 2019 / Revised: 8 June 2019 / Accepted: 8 June 2019 / Published: 12 June 2019
(This article belongs to the Special Issue Heterogeneous Catalysis for Valorization of Lignocellulosic Biomass)

Abstract

:
This study provides new insights into sustainable fuel production by upgrading bio-derived oxygenates by catalytic hydrodeoxygenation (HDO). HDO of ethylene glycol (EG), cyclohexanol (Cyc), acetic acid (AcOH), and phenol (Phe) was investigated using a Ni-MoS2/MgAl2O4 catalyst. In addition, HDO of a mixture of Phe/EG and Cyc/EG was studied as a first step towards the complex mixture in biomass pyrolysis vapor and bio-oil. Activity tests were performed in a fixed bed reactor at 380–450 °C, 27 bar H2, 550 vol ppm H2S, and up to 220 h on stream. Acetic acid plugged the reactor inlet by carbon deposition within 2 h on stream, underlining the challenges of upgrading highly reactive oxygenates. For ethylene glycol and cyclohexanol, steady state conversion was obtained in the temperature range of 380–415 °C. The HDO macro-kinetics were assessed in terms of consecutive dehydration and hydrogenation reactions. The results indicate that HDO of ethylene glycol and cyclohexanol involve different active sites. There was no significant influence from phenol or cyclohexanol on the rate of ethylene glycol HDO. However, a pronounced inhibiting effect from ethylene glycol on the HDO of cyclohexanol was observed. Catalyst deactivation by carbon deposition could be mitigated by oxidation and re-sulfidation. The results presented here demonstrate the need to address differences in oxygenate reactivity when upgrading vapors or oils derived from pyrolysis of biomass.

Graphical Abstract

1. Introduction

Fast pyrolysis is a well-known method for converting solid, lignocellulosic biomass, such as wood and straw, into bio-oil, a potential liquid hydrocarbon fuel [1]. Different catalytic processes can be coupled with fast pyrolysis in order to improve particularly the heating value and the stability of bio-oil. Such catalytic upgrading can be integrated in the pyrolysis step as in catalytic fast pyrolysis or catalytic fast hydropyrolysis [2,3,4], and/or downstream as catalytic hydrodeoxygenation (HDO) [5,6]. This downstream hydroprocessing can be performed either on pyrolysis oil vapors or on the condensed bio-oil.
Several HDO studies on various model compounds, in particular phenolic compounds, have shown that a broad range of catalysts can be used for bio-oil HDO. An overview of these studies can be found in recent review articles [5,6,7]. In real biomass pyrolysis vapors and condensed bio-oil, aromatic and aliphatic compounds co-exist, exhibiting many different oxygen functionalities such as alcohol, aldehyde, ketone, ester, carboxylic acid groups or furans and phenols [8,9,10]. The reactivity, and hence also the instability, of these functionalities has been mapped out in various studies [5,11,12], indicating that the most reactive bio-oil constituents originate from the cellulosic part of biomass.
In a next step, it is particularly relevant to study the HDO of both cellulose- and lignin-derived model compounds to understand the competitive reactions occurring during HDO of real feedstocks. Dwiatmoko et al. [13] have shown that the HDO of guaiacol over a Ru/C catalyst in a batch autoclave at 270 °C was strongly suppressed by the presence of furfural, when the molar furfural/guaiacol ratio was increased above 0.47. This was explained by competitive adsorption, which was also observed for 5-hydroxymethylfurfural. Ryymin et al. [14] reported competitive adsorption of methyl heptanoate and phenol over a sulfided NiMo/Al2O3 catalyst operated at 250 °C in a batch reactor. Boscagli et al. [15] performed HDO of phenol and D-glucose in a batch autoclave at 340 °C over supported Ni and Ru catalysts. D-glucose was readily converted in water and in bio-oil. Phenol conversion, however, was strongly suppressed in bio-oil. Their results show that not only the activity, but also the selectivity to reaction products depended on the reaction medium. To investigate such interactions further, studies are required that are conducted in continuous flow and step by step allowing more complex reaction mixtures to process.
In this work, a sulfided NiMo catalyst with MgAl2O4 as water and sulfur tolerant support was used to study the HDO of cellulose and lignin type model compounds in a continuous flow, fixed bed reactor (EG: ethylene glycol, Cyc: cyclohexanol, Phe: phenol, and AcOH: acetic acid). Water tolerance is important, since oxygen is removed as water in HDO. Deoxygenation can alternatively also occur by other reactions such as decarbonylation or decarboxylation. Sulfur tolerance is important, as biomass contains sulfur [16,17], which is a known poison to transition metal-based catalysts. Macro-kinetic models were derived to quantify the reactivity and selectivity of the conversion of the C2 and C6 alcohols. The results show the importance of studying more complex reaction mixtures during HDO of oxygenated species when upgrading vapors or oils derived from fast pyrolysis of biomass.

2. Results

2.1. Reaction Thermodynamics

HDO reactions are typically exothermic, with a significant contribution from hydrogenation reactions. This is also the case for the HDO of phenol into cyclohexane (ΔH = −290 kJ/mol at 380–450 °C), of ethylene glycol into ethane (ΔH = −190 kJ/mol at 380–450 °C), and of cyclohexanol into cyclohexane (ΔH = −84 kJ/mol at 380–450 °C), calculated with HSC Chemistry v. 9.4.1. The theoretical adiabatic temperature rise that would occur from these reactions in the given experiments would be 165–195 °C from ethylene glycol HDO (Phe/EG, EG), 45 °C from phenol HDO (Phe/EG), and 15–50 °C from cyclohexanol HDO (Cyc/EG, Cyc). The reactor temperature did in fact increase rapidly (by up to 16 °C) when the liquid feed was started (Figure S3). The temperature could, however, be controlled, as the reactor was not operated adiabatically, and to some extent also due to deactivation and occurrence of endothermic reactions, such as cracking.

2.2. Reaction Schemes

Based on the experimental results for conversion of ethylene glycol over sulfided catalysts, the HDO reaction pathway for ethylene glycol has been assumed to consist of a series of consecutive dehydration and hydrogenation reactions (Scheme 1). Acetaldehyde is expected to form via the tautomerization of ethenol (vinyl alcohol), and both compounds can be hydrogenated to form ethanol. In other experiments, where an extended gas analysis was performed, acetaldehyde was detected in the product gas from ethylene glycol HDO over sulfided catalysts. CO and CH4 can form from the decarbonylation of acetaldehyde, but cracking of ethylene glycol also occurred, giving a yield ratio of CO/CH4 >1. CO2 can form from the water gas shift (WGS) reaction. The MgAl2O4 support catalyzes dehydration and alcohol condensation reactions [18].
Based on the results from the activity tests, the conversion of cyclohexanol was assumed to follow a dehydration step forming cyclohexene, which could then be hydrogenated to cyclohexane (Scheme 2). Dehydrogenation into benzene was not observed, although it is thermodynamically favorable.

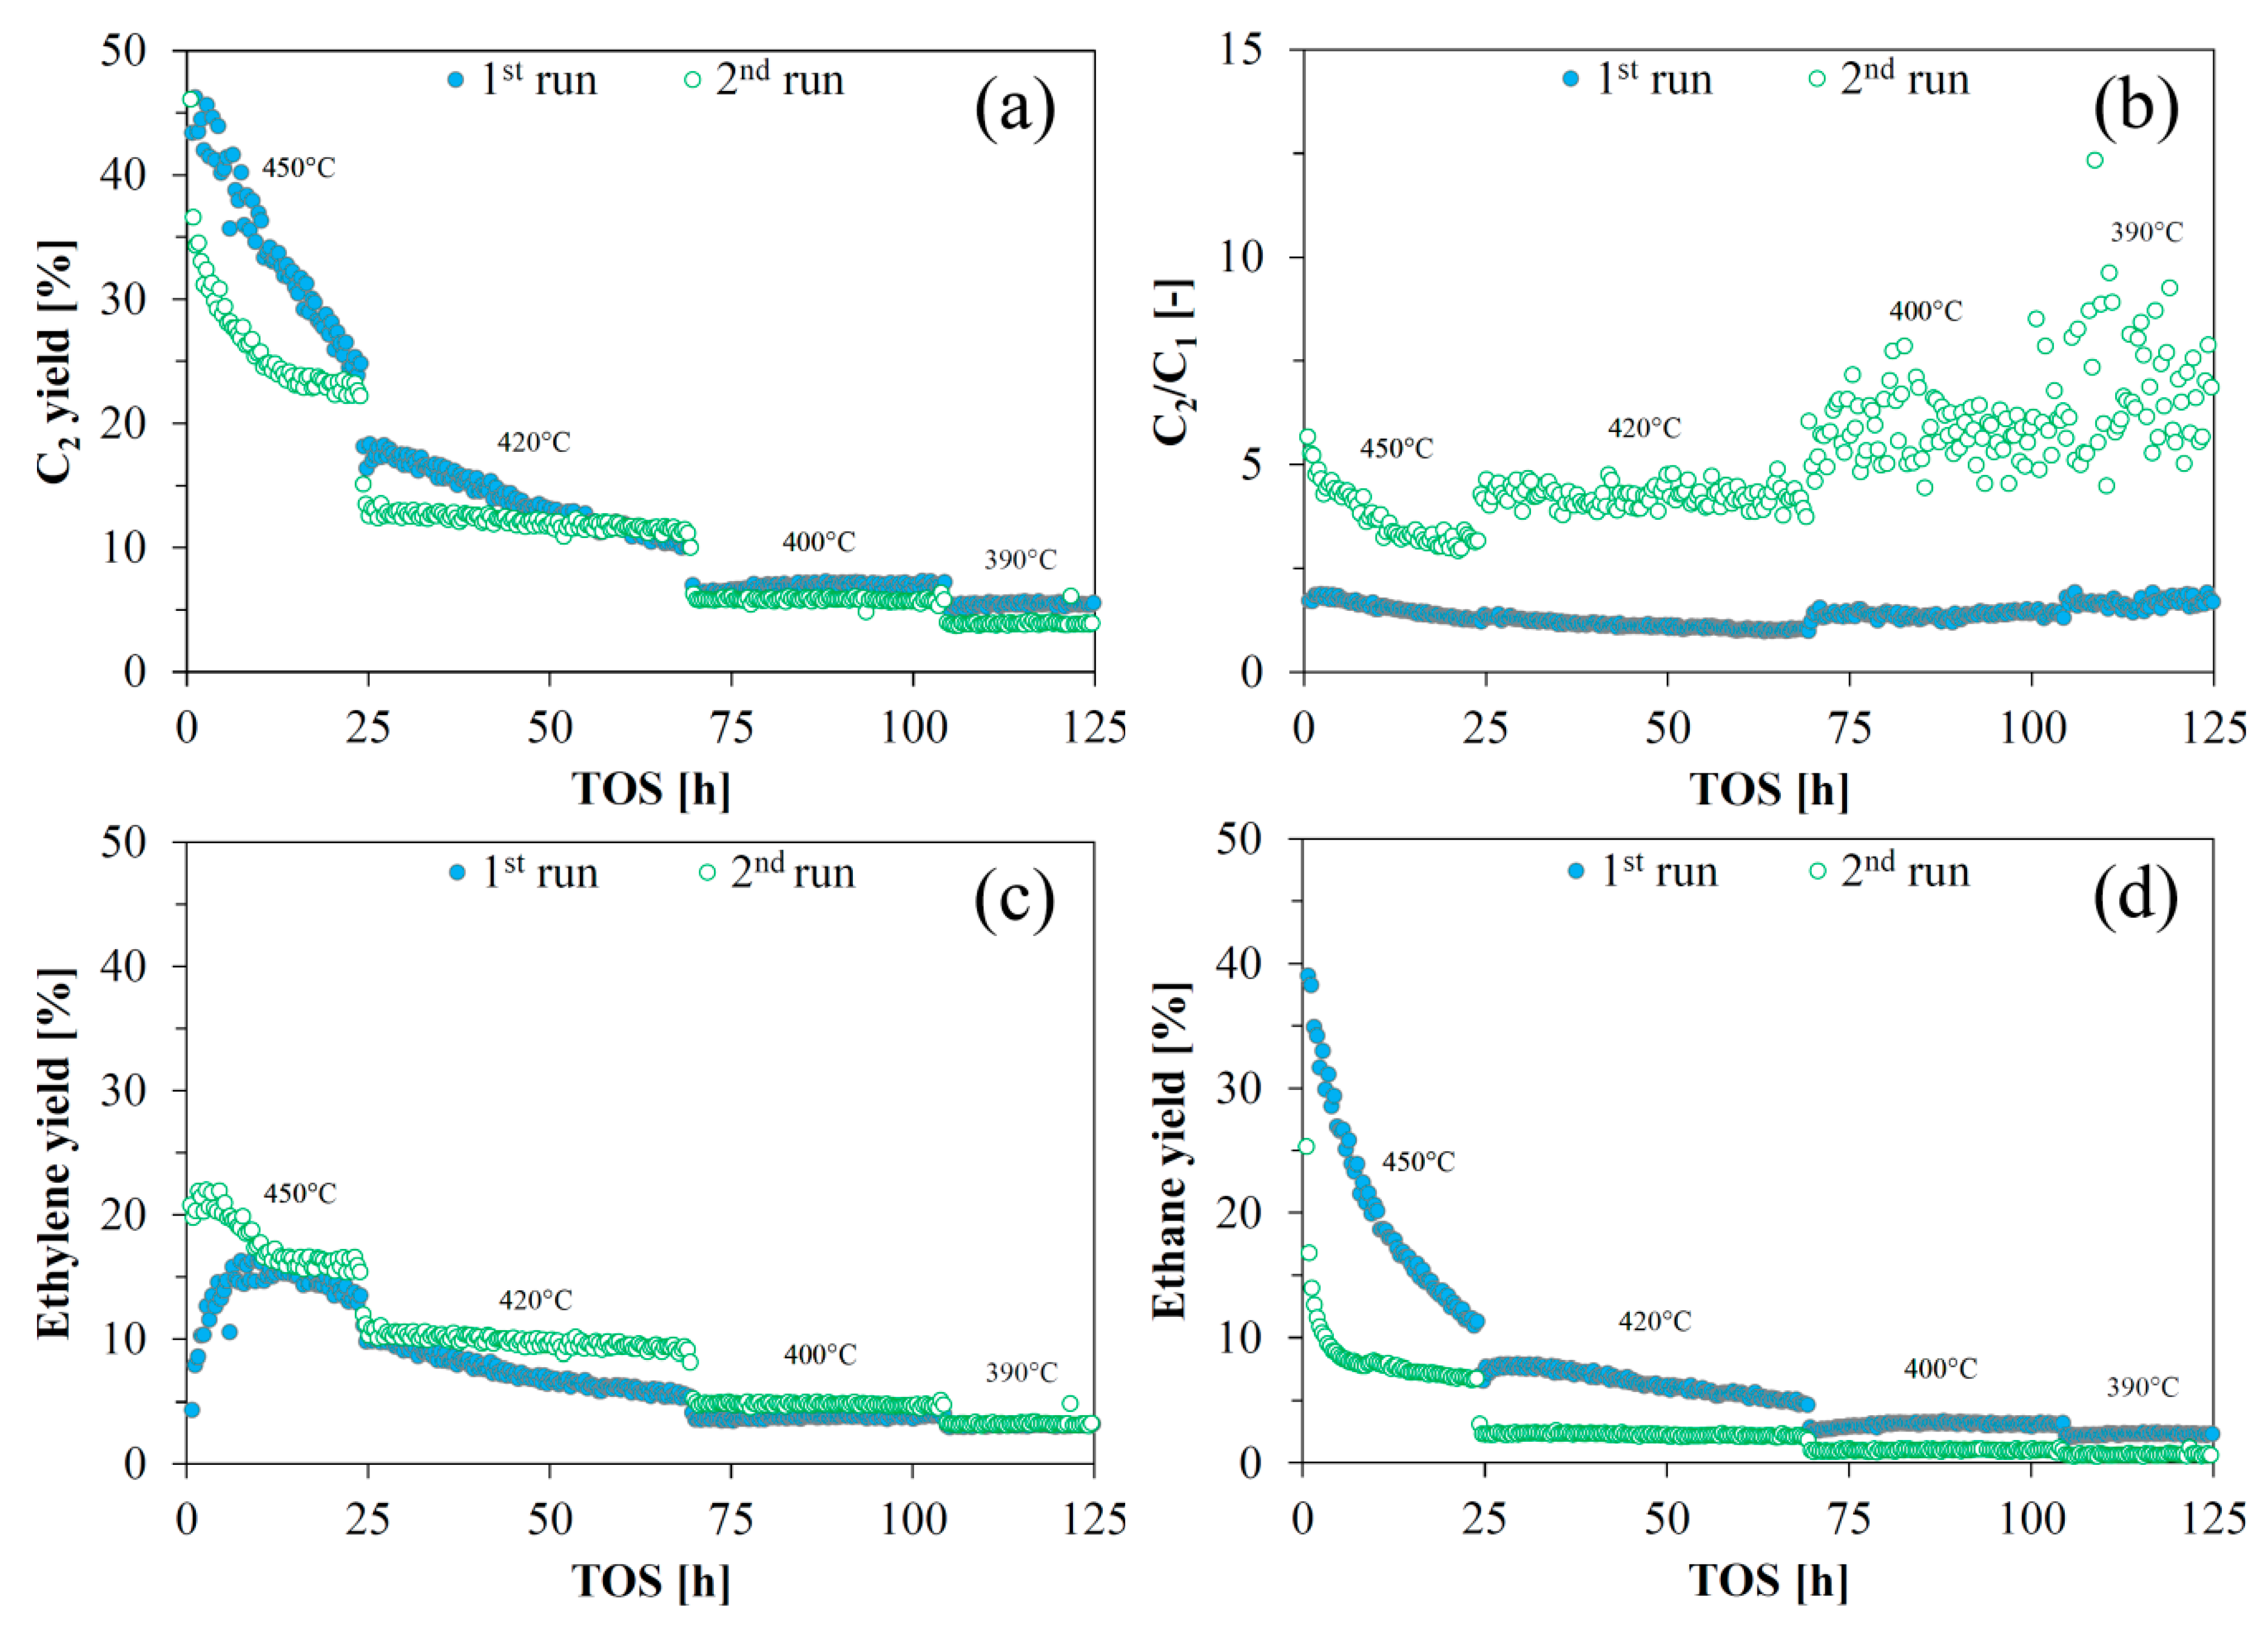
2.3. HDO of Ethylene Glycol

HDO of pure ethylene glycol and mixtures of phenol/ethylene glycol and cyclohexanol/ethylene (EG, Phe/EG, Cyc/EG), and that of the phenol/ethylene glycol mixture after catalyst reactivation (Phe/EG-ReAct, see Section 2.4), was performed in a continuous flow, fixed bed reactor at 40 barg and 380–450 °C (see Section 4). The conversion of ethylene glycol (Figure 1) was close to 100% at 450 °C in the beginning of each experiment, except for the reactivated catalyst, where it was 86%. Deactivation however occurred, and a decrease in conversion was observed before the temperature was decreased to 420 °C (at time on stream (TOS) = 24 h). Steady state activity was obtained at the subsequent temperature set points of 400, 390, and 380 °C. Increasing the temperature from 380 °C to 410 °C after 170 h (EG and Phe/EG), did not allow for steady state operation in terms of product yields, and continuous deactivation was observed (Figure 2). As the temperature was brought back to the initial set point of 450 °C, the conversion increased to 88–95%. It was, thus, slightly lower than the initially obtained conversion and continued deactivation was evident from the product yields (Figure 2).
The reaction temperature was identical (within <2 °C) for the experiments with pure ethylene glycol and the phenol/EG mixture. The temperature was, however, notably lower (up to 10 °C) when cyclohexanol was present in the feed, which affected the conversion and yields accordingly. This lower temperature was due to the endothermic dehydration of cyclohexanol.
Figure 2 shows the yields of C1-C2 gas products. The yield of CO2 was ≈1–5% during the initial deactivation period and <0.5% at the subsequent steady states. There was an initial (TOS <10 h) decrease in the yield of ethane and a corresponding increase in ethylene (Figure 2a,b). This initial deactivation in hydrogenation activity was presumably caused by the loss of SH-groups from the active edges of the promoted MoS2 particles [19], while carbon deposition also contributed to the overall deactivation. During steady state operation at 380–400 °C, the yields of ethane and ethylene, respectively, were below 5%. The yields obtained immediately after returning to 450 °C at 200 h were approximately the same as those obtained at 24 h, at the end of the initial 450 °C operation period, supporting the observation that steady state activity was obtained during 70–170 h on stream with little further deactivation during this period.
CO was the main cracking product formed (Figure 2c,d). The C2/C1 yield ratio obtained in the experiments (Figure 3) increased linearly with decreasing temperature, showing the enhanced cracking at elevated temperature. The higher variations in the C2/C1 ratio at lower temperatures was caused by greater relative fluctuations in the measured concentration of C1 products.
The combined yield of propane and propylene was ≤10% during the initial deactivation period (450–420 °C, 0–70 h). However, at the subsequent steady state period (380–400 °C, 70–170 h), this number was less than 1%, and it remained low (≤2%) during the remainder of the activity tests, indicating that active sites (probably acid sites) responsible for carbon–carbon bond formation had been deactivated.
Calculated first order rate constants for each reaction temperature and fitted Arrhenius parameters based on these rate constants (for reactions 1a and 2a) are listed in Table 1, see Section 4.5 for the macro-kinetic model. Based on the evaluation of the Mears’ criterion and the effectiveness factor [20] (Figure S4), it was concluded that the experiments were conducted without significant external or internal diffusion limitations.
The thermodynamic equilibrium of reactions 1a and 2a is fully shifted towards the product side at the applied operating conditions (calculated with HSC Chemistry v. 9.4.1.). Incomplete conversion of ethylene glycol was, however, obtained during steady state operation and ethylene and ethane were formed at similar yields (Figure 1 and Figure 2). Thus, the reaction mixture was far from equilibrium, possibly partly due to the initial loss of hydrogenation activity. The hydrogenation of ethylene had a low apparent activation energy of 2.4–32 kJ/mol and a rate constant, k′2a,mean, which for the fresh catalysts was 18-22 times larger than that of the initial dehydration and hydrogenation of oxygenates into ethylene, k′1a,mean. Although this fast hydrogenation of ethylene was probably affected by some mass transfer limitations, giving a low apparent activation energy, the trend in reactivity remains unaffected.
The kinetics of ethylene glycol HDO were rather similar for ethylene glycol as pure feed or in the presence of phenol or cyclohexanol, especially for the first dehydration and hydrogenation step where k′1a,mean = 14–16 × 10−3 L/(min·g) and Ea,1a = 85–96 kJ/mol, suggesting that no inhibition of ethylene glycol HDO from phenol or cyclohexanol occurred (Figure S5a). The hydrogenation of ethylene was more affected by the presence of phenol or cyclohexanol (Figure S5b). Cyclohexanol seemed to have a slight promoting effect, while phenol seemed to have a slight inhibiting effect. Phenol is expected to adsorb strongly onto the support [21,22], which may block the accessibility to active edge sites responsible for hydrogenation and deoxygenation (brim sites and vacancies) [23,24,25], and thereby limit this activity. Cyclohexanol dehydration is suggested to occur over the acid sites of the support, and it is possible that this occupation of acid sites has prevented coke formation, keeping hydrogenation sites accessible.
The reactivated catalyst showed a decreased hydrogenation rate and a significantly higher barrier for the initial ethylene glycol dehydration and hydrogenation, as k′2a,mean decreased from 248–332 × 10−3 L/(min·g) to 83 × 10−3 L/(min·g) and Ea,1a increased from 85–96 kJ/mol to 141 kJ/mol (Table 1). This may be due to changes in the active phase (see below).

2.4. Catalyst Reactivation

If HDO of biomass feedstocks occurs during pyrolysis (as in catalytic fast hydropyrolysis), the operating temperature should not be increased markedly, as this would favor gas formation and limit the oil yield [1]. This means that catalyst reactivation cannot be performed analogously to conventional hydrotreating, in which catalyst activity can be maintained by continuously increasing the reaction temperature until the end of run temperature (the upper limit allowed by the equipment) is reached [26]. If HDO, on the other hand, is carried out downstream of a pyrolysis unit, it allows for a greater flexibility in the choice of operating temperature, as this step is decoupled from the pyrolysis.
At the end of a catalytic cycle in conventional hydrotreating it is possible to regenerate the spent catalyst ex situ by combustion of deposited coke and reload it into the reactor [27]. Such an ex situ regeneration could be particularly suitable for HDO catalysts, where deactivation is faster. To test this, the catalyst tested for HDO of the phenol/ ethylene glycol mixture was reactivated in situ in the reactor setup. Deposited carbon was removed in an oxidation step (545 °C in 7.6% O2 in N2, Figure S9), which left the active sulfide phase in a partially oxidized state requiring a re-sulfidation step to convert the resulting MoOxSy phase back into the active MoS2 phase. The concentrations of NOx (negligible), CO, CO2, O2, and SO2 where monitored using an Emerson NGA 2000 gas analyzer. The carbon deposition on the catalyst was calculated based on the flow of N2 and O2 into the system and the measured concentrations of oxidation products and O2, giving a carbon deposition of 15.4 wt %. After re-sulfidation, the catalytic activity was measured again (EG/Phe-ReAct, Figure 1 and Figure 4).
Overall, reactivation of the catalyst was possible, as the yield of deoxygenated C2 species of the reactivated catalyst (second run) was similar to the yield of the fresh catalyst (first run). However, the reactivated catalyst showed a different rate of deactivation (especially at <50 h). After a period of around 50 h with deactivation, the C2 yields from the first and second run were similar (Figure 4a). The reactivated catalyst showed a different product selectivity with less cracking (Figure 4b) and less hydrogenation (Figure 4c,d). Hydrogenation activity was markedly lower for the reactivated catalyst. The reactivated catalyst’s poorer activity for ethylene glycol HDO was evidenced by the increase in activation energy for the initial dehydration/hydrogenation, Ea,1a, from 96 to 141 kJ/mol, and by the decrease in the rate constant for hydrogenation, k′2a,mean, from 248 × 10−3 to 83 × 10−3 L/(min·g) (Table 1).
The size distribution of the active MoS2 particles was obtained from analyses of TEM images (Figure 5 and Figure 6) of the spent catalysts from the experiment with pure ethylene glycol (EG) and with the phenol/EG mixture including the reactivation step (Phe/EG-ReAct). The results indicate that some degree of sintering occurred during the reactivation process. In line with previous results [19], the observed average length (Figure 6a) and stacking (Figure 6b) for both spent catalysts were 5.1–5.3 nm and 1.2–1.4 nm, respectively. The majority of the observed sulfide particles in the spent catalyst samples were distributed as short monolayer slabs. The maximum degree of stacking was 3 for the non-reactivated catalyst, while several multilayer slabs with stacking degrees of 4–10 were observed in the reactivated spent sample (Figure 6b). These multilayer slabs were also longer than in the non-reactivated sample, as evidenced from the longer tail at >10 nm (Figure 6a).
As a result of the apparent sintering during catalyst reactivation, the concentration of active edge sites and brim sites (present at the top layer) decreased, while the concentration of MoS2 present in inactive bulk and basal plane positions increased.
The composition of the catalysts from the EG and Phe/EG-ReAct experiments is shown in Table 2. The molar Ni/Mo ratio was 0.3 (same as the fresh catalyst) in the non-reactivated spent catalyst from the EG experiment, whereas it had increased to 0.5 for the reactivated catalyst, indicating loss of Mo. MoO3, which is formed during the initial oxidation stage of the regeneration, can be converted into volatile molybdenum hydroxy oxides in the presence of water [27,28]. Therefore, the oxidation conditions should be carefully controlled (low heating rate and high air flow) to limit the surface concentration of water formed during the combustion of carbonaceous materials from the catalyst. Especially the loss of brim sites along with the loss of Mo explains the loss of hydrogenation activity in the reactivated catalyst.

2.5. HDO of Cyclohexanol

HDO of cyclohexanol was performed on both the pure compound (Cyc) and as a cyclohexanol/ethylene glycol mixture (Cyc/EG), see Figure 7.
Pure cyclohexanol was almost fully converted (XCyc ≥99.5%) during the entire duration of the activity test at 390–450 °C and a WHSV of 18 h−1 (Figure 7a). Cyclohexene and cyclohexane were the dominant products, only trace amounts of cyclohexanone were detected (not shown). The yield of cyclohexene was 60–80% and that of cyclohexane was 14–30%. There was an initial decrease in the yield of cyclohexane and increase in cyclohexene indicating some deactivation of hydrogenation activity as observed for the conversion of ethylene glycol. The first dehydration step of cyclohexanol into cyclohexene (reaction 1b) was very fast with a conversion above 90% (Table 3). The measured rate may, therefore, be affected by mass transfer limitations.
In the presence of ethylene glycol (Figure 7b), a >90% conversion of cyclohexanol was initially obtained, decreasing to approximately 70% after 30–65 h on stream, where an approximate steady state was obtained at 413 °C. As the temperature was decreased to the set point of 400 °C, the conversion continued to decrease reaching 49% at 82 h on stream. Shortly after, setup issues forced termination of the experiment. The product composition from this experiment was comprised of cyclohexene, cyclohexane, cyclohexanone, and 1,4-dioxaspiro[4.5]decane (a ketal coupling product from cyclohexanone and ethylene glycol). The yield of HDO products were 4.5–16% cyclohexene and 0.7–2.5% cyclohexane at TOS >30 h. The yields of byproducts were significant: 5.7–11% 1,4-dioxaspiro[4.5]decane, and 6.8–19% cyclohexanone in the same time period.
As the conversion of cyclohexanol in the presence of ethylene glycol was performed at a four times higher residence time compared to the experiment with pure cyclohexanol, these results show that ethylene glycol inhibited the conversion of cyclohexanol significantly. This was also reflected by the rate constants (Table 3). With ethylene glycol present in the feed, the rate constant, k1b, decreased from ≥524 × 10−3 L/(min·g) (independent on temperature) to 10–21 × 10−3 L/(min·g), and there was a notable activation energy of 121 kJ/mol. This detrimental effect was explained by deactivation of acidic active sites by a competitive adsorption of ethylene glycol derived compounds (HDO intermediates and side products) as well as carbon deposition. The hydrogenation of cyclohexene was also affected by the presence of ethylene glycol, which caused the activation energy, Ea,2b, to double, while the rate constant remained more constant (at the reference temperature of 395 °C). This could be caused by the competition for hydrogenation active sites.
As mentioned, the hydrogenation of ethylene (reaction 2a) was the fastest step in ethylene glycol HDO. For pure cyclohexanol, the initial dehydration to cyclohexene was the fastest step with k′2b/k1b ≤0.1. This further indicates that the conversion of ethylene glycol and cyclohexanol takes place on different active sites. Full deoxygenation of cyclohexanol can occur on acid sites supplied by the support without interaction with the MoS2 active phase, whereas ethylene glycol HDO depends on MoS2 for hydrogenation of ethenol/acetaldehyde. The equilibrium of the reactions in Scheme 2 is fully shifted towards cyclohexane and benzene (Figure S6) at the applied reaction conditions. Cyclohexene is thermodynamically expected to occur in minute concentrations. Since benzene was not detected in the liquid product, and cyclohexene was a dominant product, hydrogenation/dehydrogenation activity was the limiting factor, possibly due to coking of Ni-MoS2 active sites.

2.6. HDO of Phenol

Phenol, which was fed in a mixture with ethylene glycol, was not converted at the applied conditions over the sulfided NiMo catalyst. The only products detected in low yields from phenol were alkyl substituted phenols and coupling products (primarily 2-ethylphenol, 3-methylphenol, and benzofuran), which were ascribed to the catalytic activity of the support acid sites [18]. These non-deoxygenated coupling products were mainly formed during the first 30 h on stream at a total phenol-based carbon yield of up to 12%. After 30 h, this yield was 0.4–3.7%.
The lack of ring hydrogenation could explain the lack of phenol conversion. A NiMo catalyst was chosen over a CoMo catalyst due to its known hydrogenation activity [29,30]. Ni-MoS2 has been reported to promote phenol HDO by aromatic ring hydrogenation (HYD) prior to breakage of the C-O bond, whereas direct deoxygenation (DDO) can be performed with Co-MoS2 [31,32,33,34]. Hydrogenation of the aromatic ring is however limited by thermodynamics (Figures S6 and S7) and favored only at temperatures well below 300 °C. The temperature was therefore decreased to 280 °C (at 170–200 h) for the reactivated catalyst (Phe/EG-ReAct), based on the work of Mortensen et al. [35], who reported ≈20–55% phenol conversion over a Ni-MoS2/ZrO2 catalyst tested in the same flow reactor setup for a TOS of 100 h at 280 °C, 100 bar, ≈283 vol ppm H2S and a WHSV of 4.0 h−1 of 50 g/L phenol in 1-octanol. No conversion of either ethylene glycol or phenol was however observed at 280 °C.
Mechanistic effects may have contributed significantly to the lack of ring hydrogenation. It has been proposed that HDO of phenolic species over Ni-MoS2 requires a flat ring adsorption onto the slab surface [33,36], which facilitates ring hydrogenation. If most active sites were occupied by ethylene glycol, its derivatives, or coke, these species could sterically hinder flat ring adsorption of phenol. Ryymin et al. [14] reported a slight suppression of methyl heptanoate HDO in the presence of phenol at 250 °C and 75 bar using a commercial NiMo/Al2O3 catalyst in a batch reactor at reaction times lower than 50 minutes. At the same time, they reported a notable inhibition of phenol HDO in the presence of methyl heptanoate during the entire reaction time of ≈4.5–5 h, and suggested that the inhibiting effect of the ester on phenol conversion was caused by a competition for active sites. This is in line with the findings of Boscagli et al. [15], who showed that phenol HDO over Ni and Ru catalysts was strongly inhibited in the presence of a light phase pyrolysis oil, mainly containing cellulose derivatives. An additional possibility could be that the H2S concentration, being a known inhibitor in phenol HDO [32], was too high for phenol conversion in the current experiments.

2.7. HDO of Acetic Acid

The HDO of acetic acid was briefly tested at 450 °C with a feed of ≈0.06–0.13 mL/min acetic acid corresponding to 1.0–2.3 mmol/min. After 2 h on stream, a coke plug developed in the reactor inlet (above the catalyst bed), resulting in a pressure drop of 48 bar. This experiment clearly illustrated the issues of heating reactive oxygenates, which others also have faced when using bio-oil for HDO studies [37,38,39]. The short TOS resulted in the gas product yields summarized in Table 4, which compares the yields with those from the conversion of pure ethylene glycol at similar conditions.
Acetic acid can undergo different reactions such as decarboxylation to form CH4 and CO2, decarbonylation (of two acetic acid molecules) to form ethylene, CO, and water, and ketonization (of two acetic acid molecules) to form acetone, CO2, and water [40]. It is also possible that acetic acid can be converted by HDO to acetaldehyde and water, allowing for similar reactions as for ethylene glycol. The formation of acetone could be the reason for the high yield of propane and propylene formed from acetic acid compared to ethylene glycol, which indicated the higher propensity for carboxylic acids to polymerize. The ethane/ethylene ratio was higher (at ≈10) for acetic acid HDO compared to ethylene glycol HDO (at ≈3), which could be due to differences in the mechanism for ethylene formation. The higher yield of C1 and coke from acetic acid HDO also indicated a higher degree of cracking of acetic acid compared to ethylene glycol, which was partly caused by an up to 13 °C higher reaction temperature (Figure S3).

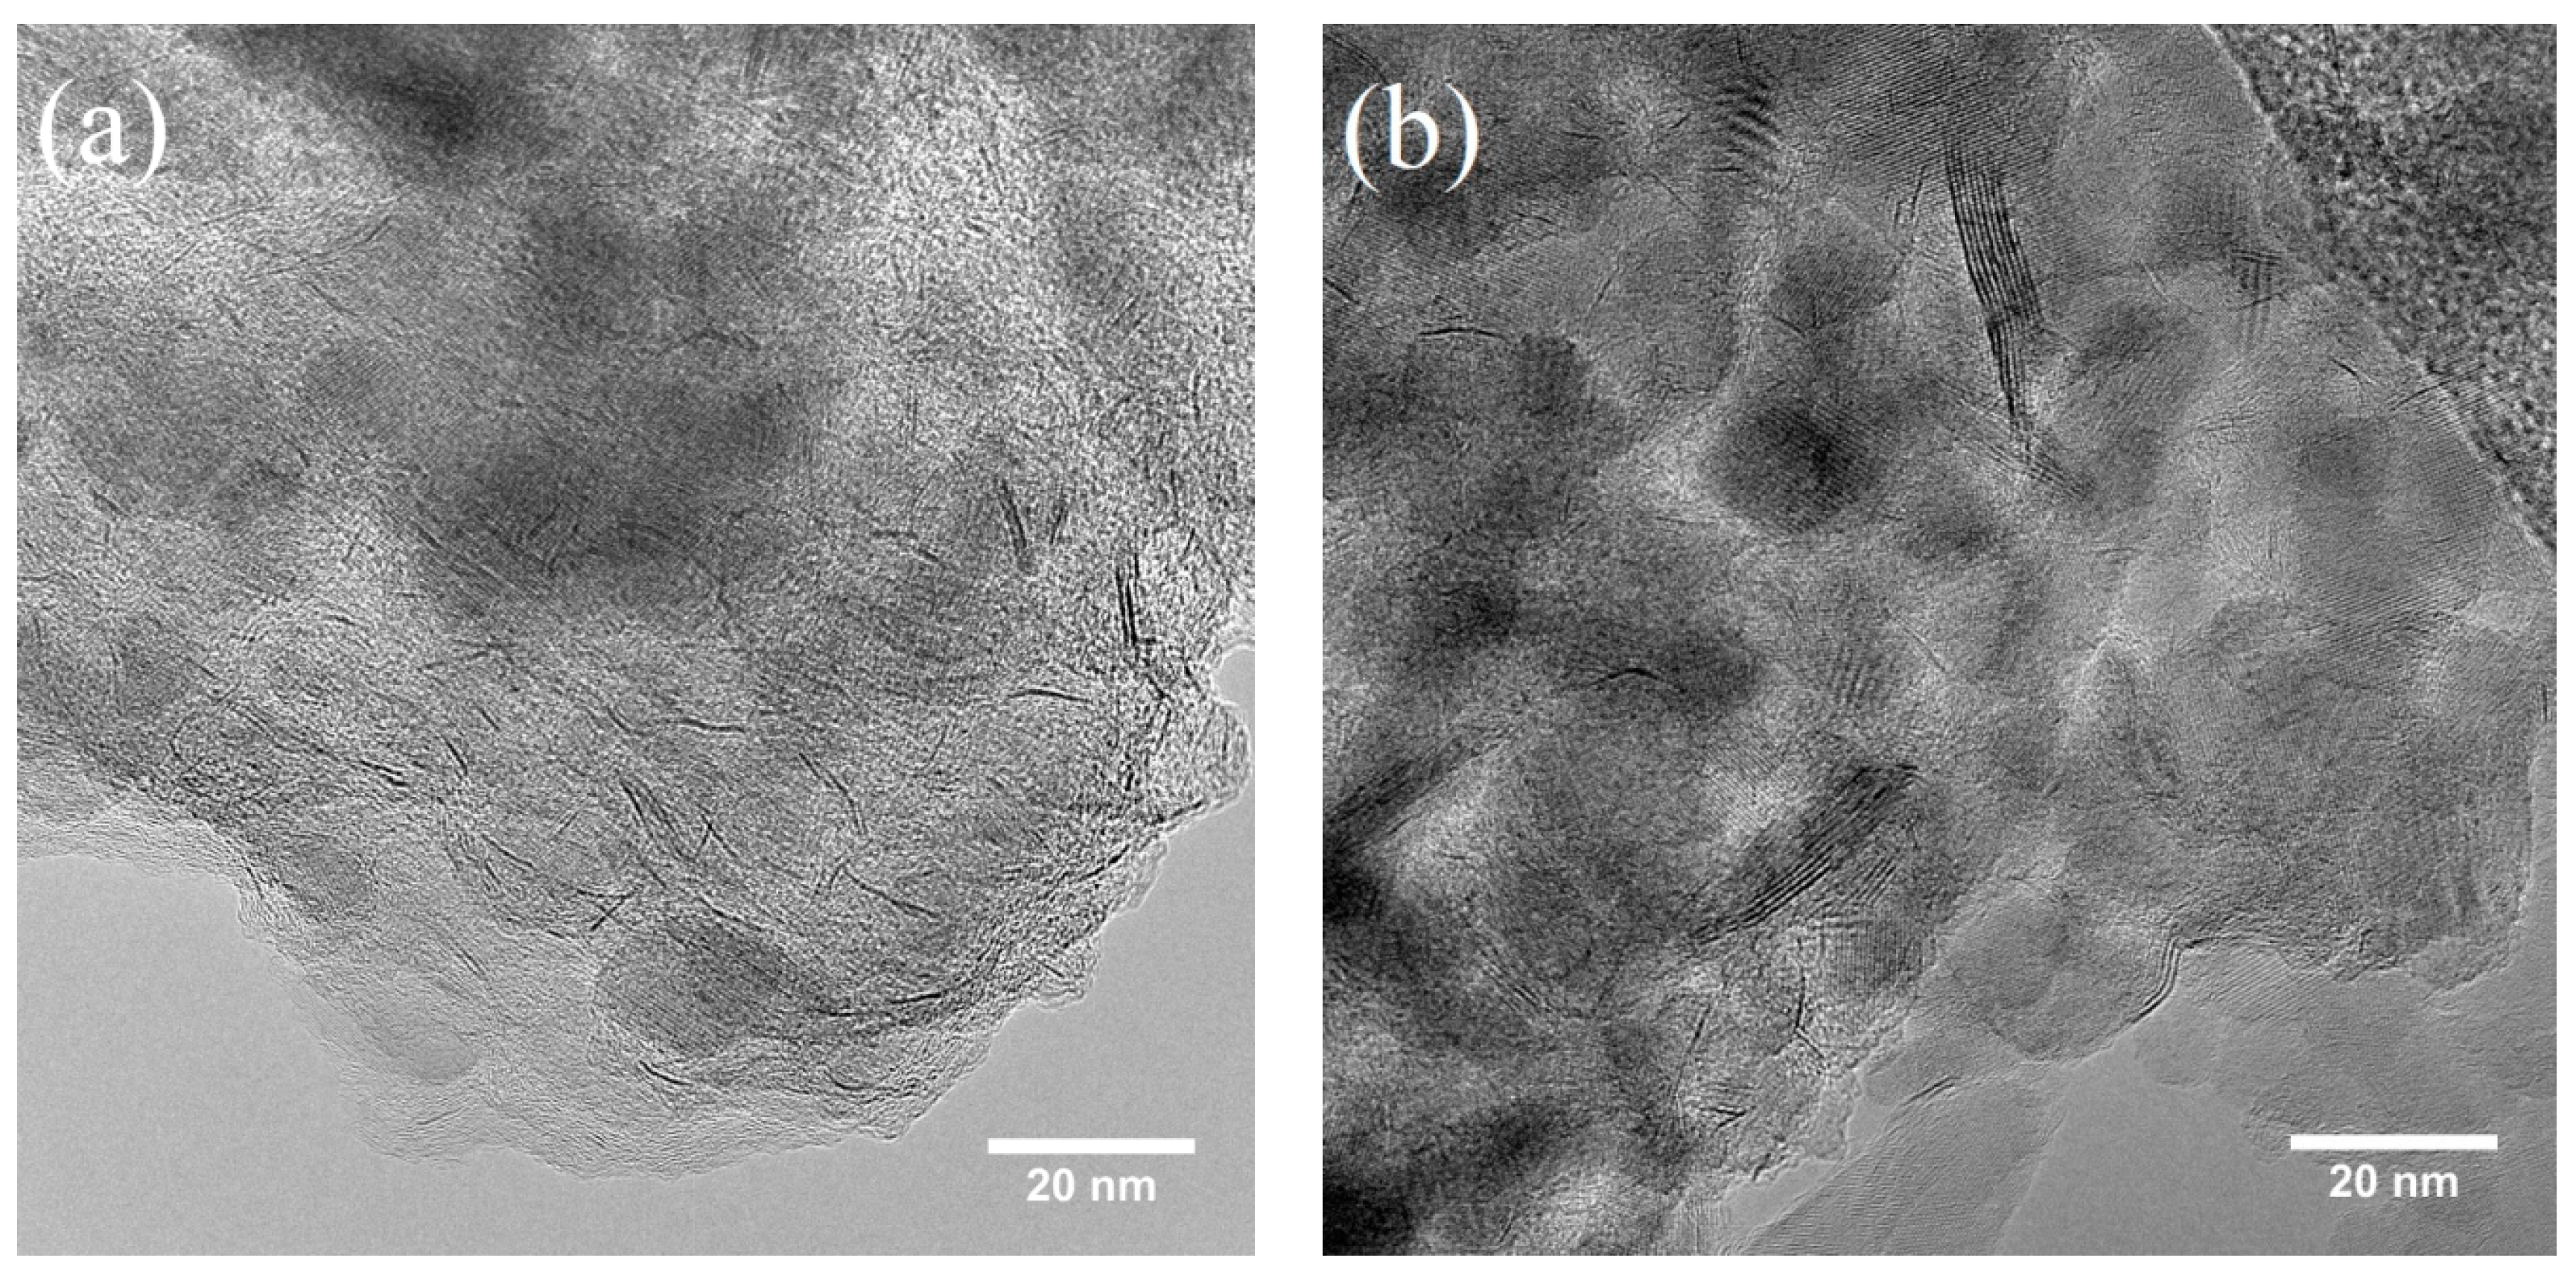
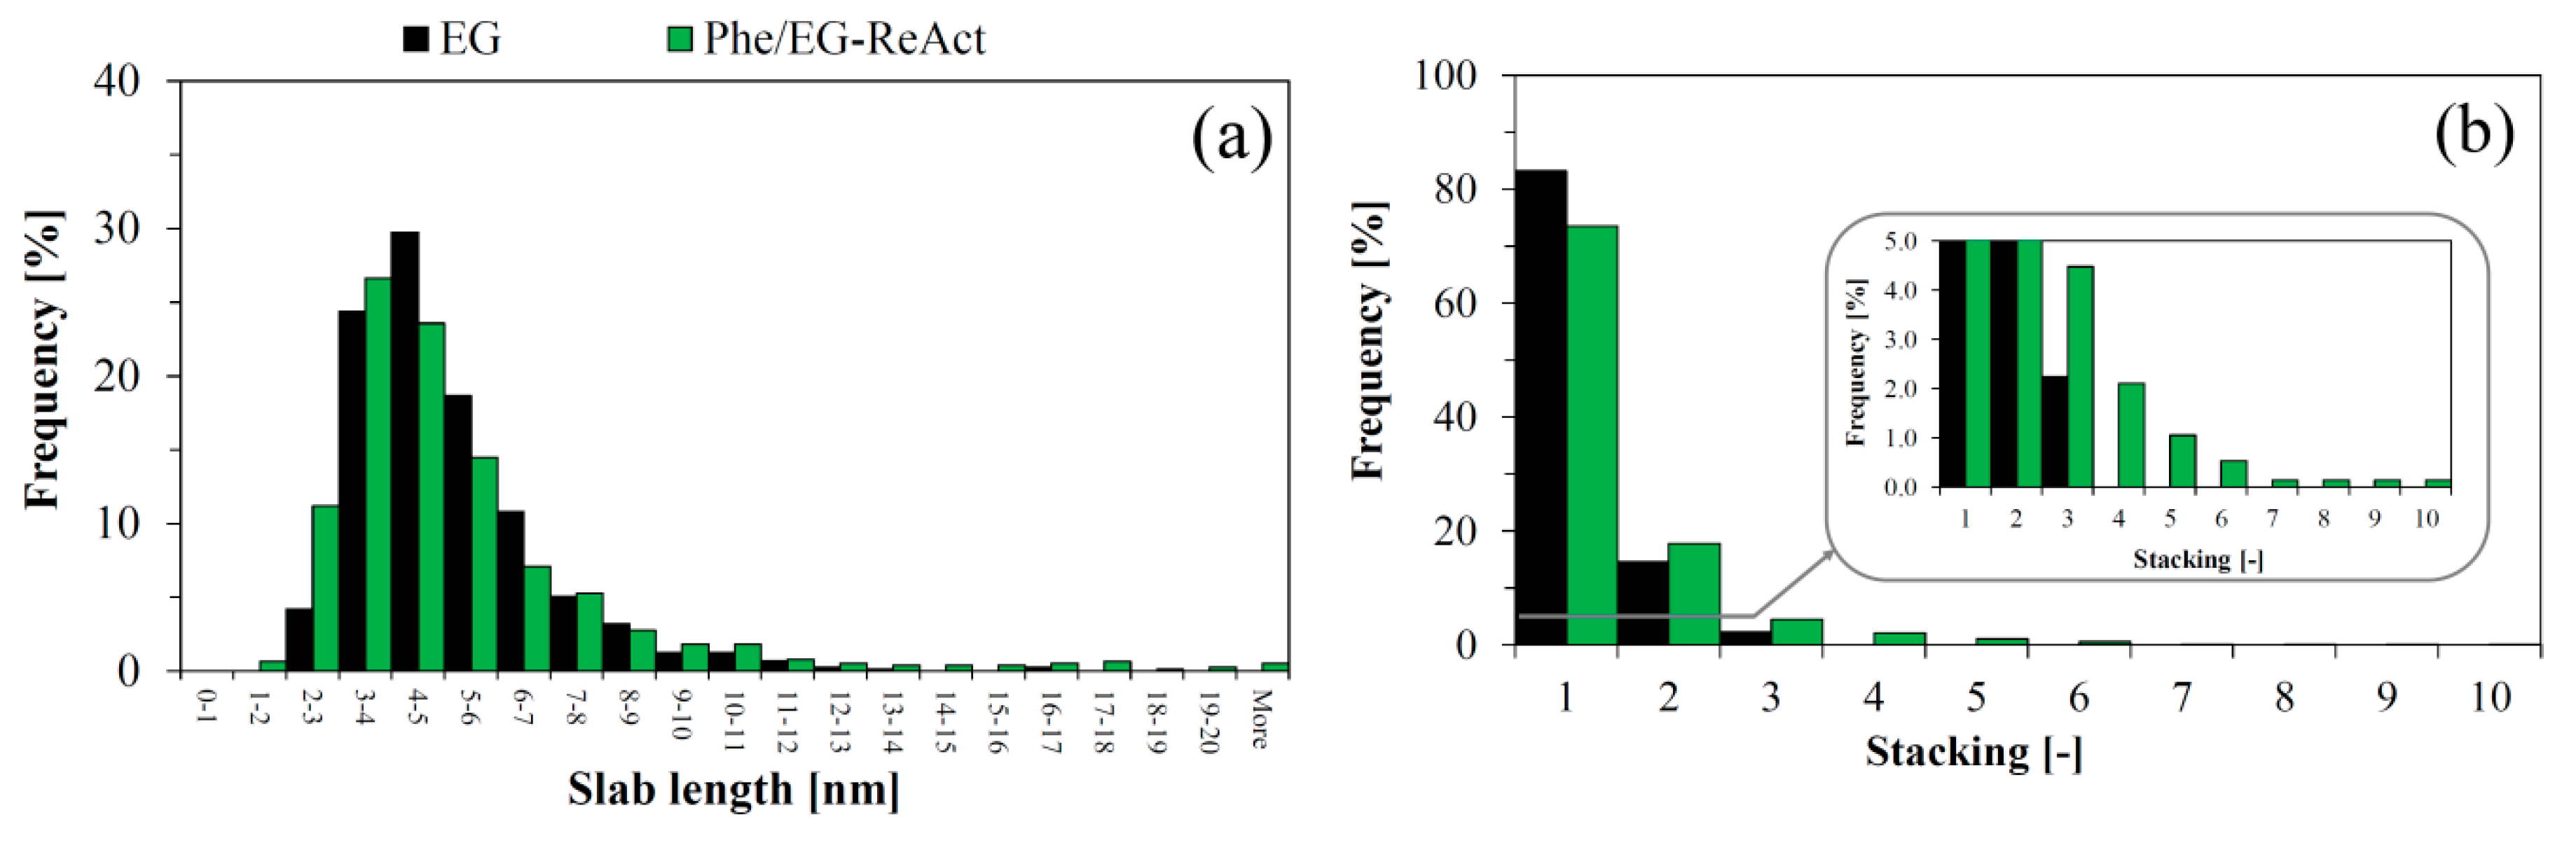
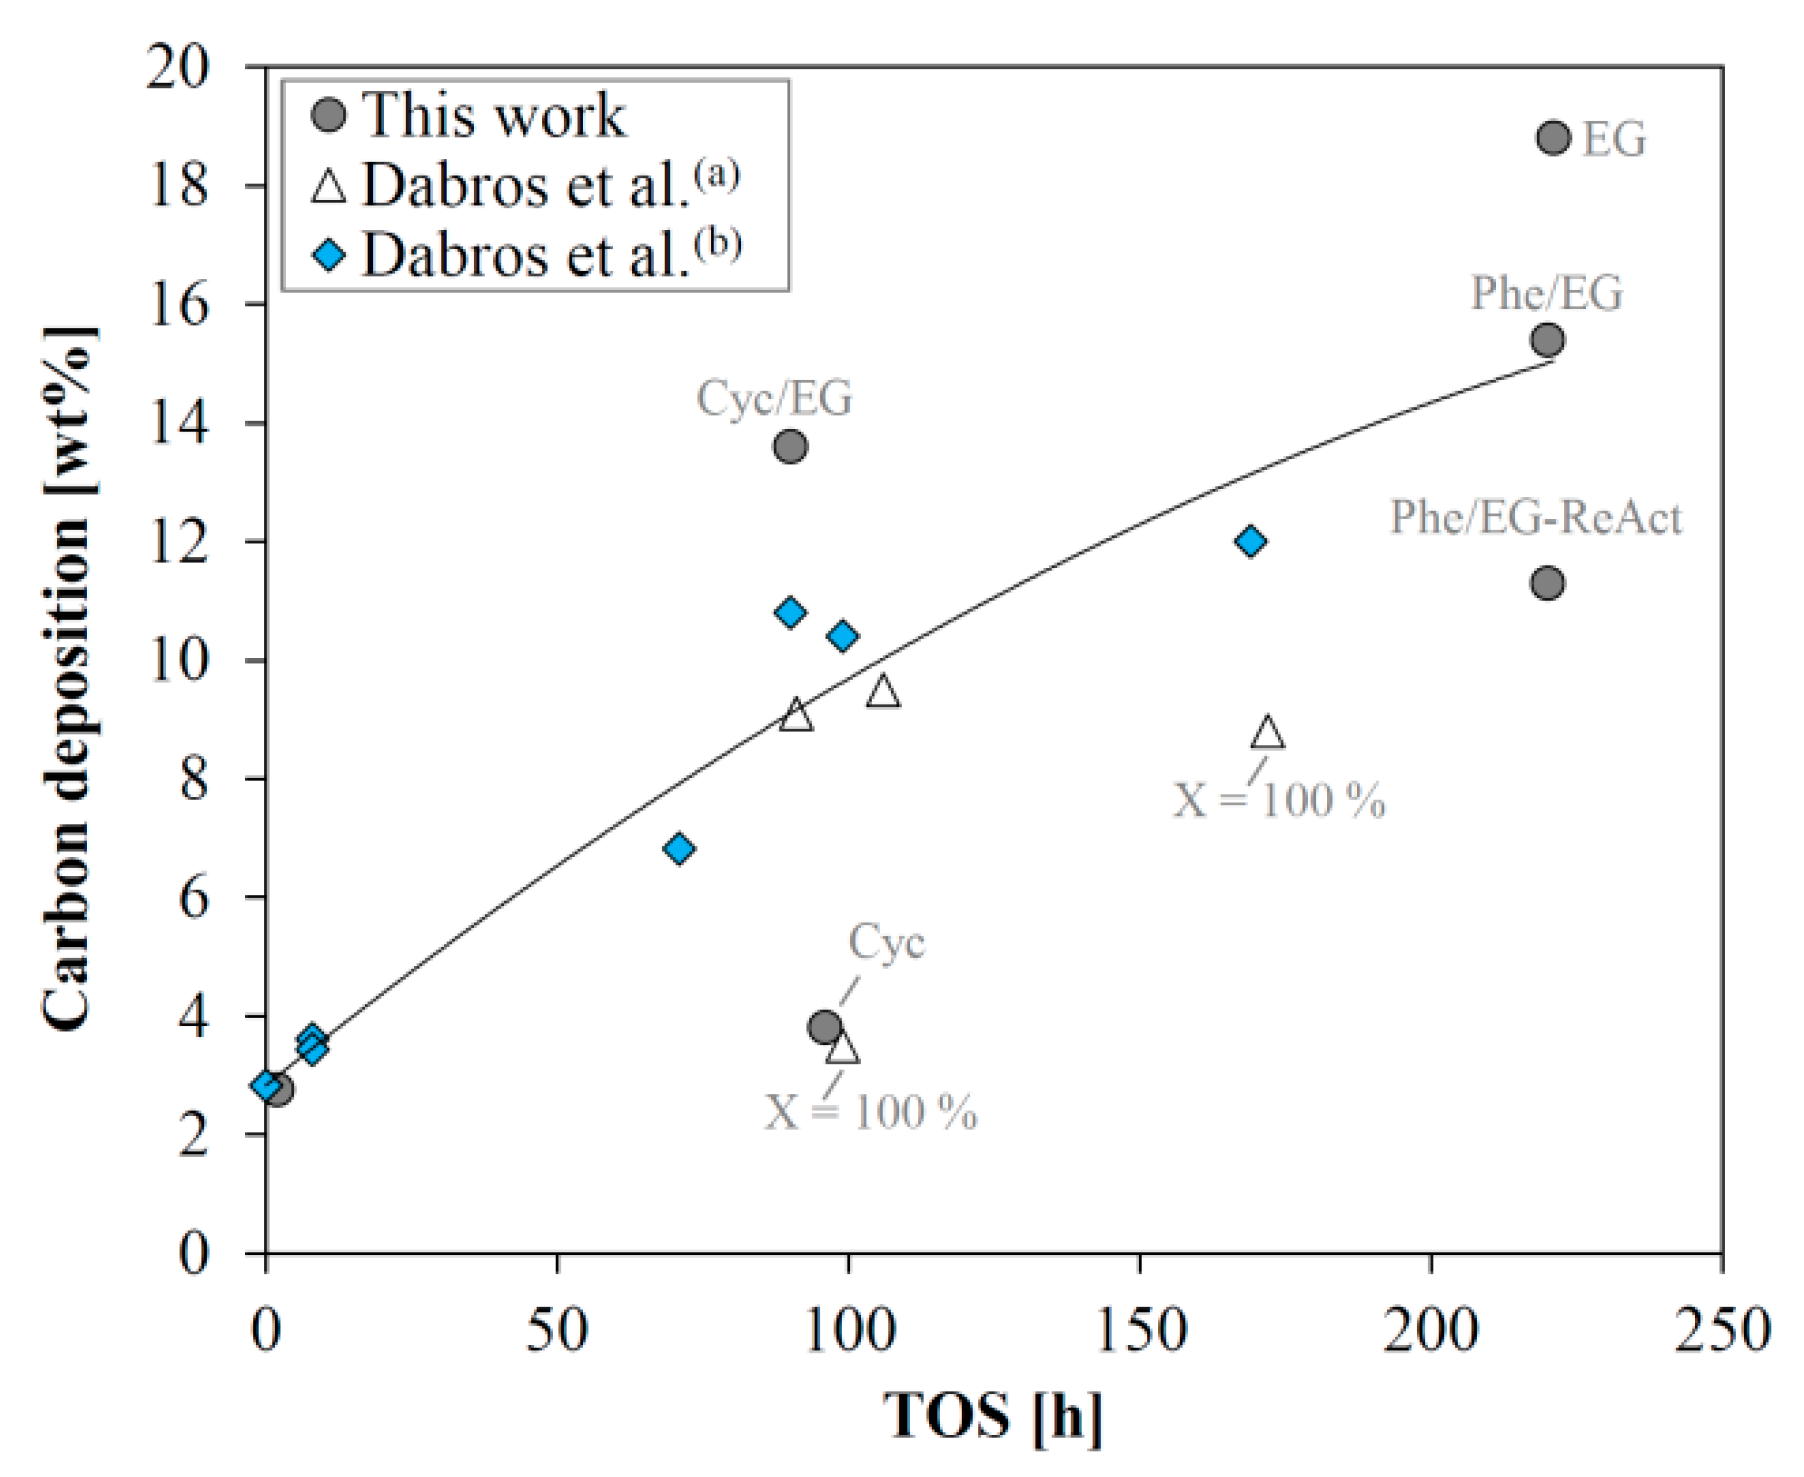
2.8. Investigation of Catalyst Deactivation

In order to gain more insight into the deactivation routes, the spent catalysts were investigated in more detail. The composition of spent catalysts from several experiments is shown in Table 5 and it should be noted that the Ni/Mo ratio was constant at 0.3 indicating no loss of Mo or Ni (see also Table 2).
The amount of carbon deposited strongly depends on the time on stream (Figure 8). In line with previous reports [18,19], this is probably the main cause of deactivation. The severe carbon deposition is partly caused by a very high space velocity, which was chosen to facilitate steady state activity with a conversion below 100%. If the liquid hourly space velocity (LHSV) is decreased to obtain full conversion, the carbon deposition is expected to occur at a lower rate than observed here, based on the results from previous work [18]. The high amount of carbon (13.6 wt %) deposited on the catalyst from the experiment with the cyclohexanol/ethylene glycol mixture, was affected by the lack of N2 flushing at reaction temperature, as the experiment was terminated abruptly due to equipment malfunction.
TEM (Figure S8) indicated that the deposited carbon was present throughout the spent catalysts, which is in agreement with previous findings [41]. The carbon appeared crystalline in agreement with Raman spectroscopy data on similar catalysts [18]. The lattice distances were analyzed by performing fast Fourier transforms of several crystalline areas in the TEM images of spent catalysts, which showed the presence of the MgAl2O4 support, and indicated the presence of crystalline carbon as well.

3. Discussion

This work clearly demonstrates the present and future challenges of bio-oil HDO. The different reactivity and competitive adsorption of different oxygenate functionalities present in bio-oil make catalytic HDO difficult as a one-step upgrading technique. While many HDO studies have demonstrated promising reactivity of single model compounds over various catalyst systems, studies on one-step upgrading of condensed bio-oil have revealed the challenge of dealing with complex compound mixtures [37,38,39]. Model compound studies should therefore be used to provide valuable insights by considering the interaction between several compounds with different functionalities, to better understand the comprehensive network of reactions and interactions, such as competitive inhibition and carbon deposition, which influence the activity and stability of the working catalyst during HDO. Moreover, advanced preparation [42,43] and characterization [44] techniques continues provide relevant contributions to the understanding and optimization of HDO over sulfided catalysts.
More advanced techniques than one-step bio-oil upgrading are more promising. One option is to perform the HDO step in situ during fast pyrolysis as catalytic fast hydropyrolysis in a fluid bed reactor [4,16,45,46,47,48,49]. In this way, reactive oxygenates can be upgraded immediately once they are formed, and more stable compounds such as phenols, can be deoxygenated downstream.
Another option, which is in line with the idea of local fast pyrolysis and centralized bio-oil upgrading, for example, at a petrochemical refinery, is to perform multistage HDO of condensed bio-oil [11,12,50,51,52,53]. Here, HDO is carried out in several stages at increasing temperature. In this way, the most reactive cellulose derived compounds can be hydrogenated at low temperatures of 80–180 °C in the first stage. The temperature is gradually increased in the subsequent stages to treat the more refractory compounds, ending at a final temperature of 300–400 °C, which is suitable for hydrocracking and deoxygenation of polyaromatics and heavy organic acids, which otherwise are disturbed by the more reactive constituents [12]. The hydrogenation of carbonyls and polyols first appears to be a good strategy, since no inhibition of ethylene glycol HDO by cyclohexanol or phenol was observed, while strong inhibition of cyclohexanol and phenol HDO by ethylene glycol and rapid coking of acetic acid was observed.
Catalyst deactivation is a critical challenge for all catalytic HDO techniques. Carbon deposition should be minimized by operating at a high hydrogen pressure, a high hydrogen to bio-oil ratio and a low bio-oil space velocity. Herein, it has been demonstrated that sulfide-based catalysts can be reactivated with appreciable activity and selectivity. As an important next step, we propose to determine the true catalyst lifetime as well as whether the reactivation process is feasible at large scale.

4. Materials and Methods

4.1. Catalyst Preparation and Characterization

Chemicals were purchased from Sigma-Aldrich (St. Louis, MO, USA). A NiMo catalyst was prepared by sequential incipient wetness impregnation of 300–600 μm sieve fraction of the MgAl2O4 support (prepared by calcination of Al2O3·MgO supplied by Sasol [19]). The first impregnation was performed with an aqueous solution of ammonium heptamolybdate hexahydrate (Fluka, ≥99.0%). The second impregnation was performed with an aqueous solution of nickel nitrate hexahydrate (Sigma-Aldrich, ≥97%). Each impregnation was followed by drying overnight at 110 °C. Finally, the catalyst was calcined in a flow of 2.5 NL/min 20% O2 in N2 by heating with a ramp of 5 °C/min to 500 °C and holding for 3 h.
The fresh catalyst was characterized by inductively coupled plasma optical emission spectroscopy (ICP-OES) and N2-physisorption (BET). ICP-OES was performed using an Agilent (Santa Clara, CA, USA) 720 ES ICP-OES analyzer or a Perkin Elmer (Waltham, MA, USA) 7300DV analyzer. Spent catalyst samples were additionally characterized by transmission electron microscopy (TEM) and elemental C and S analysis. The latter was performed using a Leco (Saint Joseph, MI, USA) CS230 instrument by combustion and infrared (IR) detection and quantification of the combustion products (CO2 and SO2). N2-physisorption was performed using a QuantaChrome (Boyton Beach, FL, USA) Autosorb iQ2 or Monosorb MS-21 gas sorption analyzer at liquid nitrogen temperature (−196 °C). Catalyst outgassing was performed prior to N2-physisorption for 2 h at 350 °C under vacuum. TEM was done using an aberration corrected FEI (Eindhoven, Netherlands) Titan 80-300 operated at 300 kV.
The calcined oxide phase catalyst contained 3.33 wt % Mo and 0.66 wt % Ni (molar Ni/Mo ratio = 0.33). The specific surface BET area (SSA) was 77 m2/g.

4.2. Activity Testing

A high pressure fixed bed reactor setup (Figure S1) was used for the catalytic activity tests. The experimental procedure is described in the Electronic Supplementary Material (Figures S1 and S2). Catalyst activation was performed in the catalytic activity setup at close to atmospheric pressure in a flow of 10–12 vol % H2S. In activity tests, both the liquid model compound, or compound mixtures, and gas mixture (H2, N2, and H2S/H2) were fed to the reactor. The reactor effluent was separated into gas and liquid. The gas was analyzed online with gas chromatography (GC) using a thermal conductivity detector (TCD)). The liquid was collected and analyzed offline with GC using a flame ionization detector (FID) and mass spectrometry (MS), using effective carbon numbers for quantification [54]. Experiments were terminated by flushing the reactor with N2 at ambient pressure and ≥400 °C for 30 min to desorb any condensed species from the catalyst pores.

4.3. Calculations

The conversion, X, of model compound A was calculated based on the molar flow in, F A , f e e d , and out, F A , o u t , of the system:
X A = F A , f e e d F A , o u t F A , f e e d · 100 %
The carbon based yield, Y, of product i was calculated as
Y i = F i · ν C , i F A , f e e d · ν C , A · 100 %
where Fi is the molar flow rate of compound i, and νC,i is the number of carbon atoms in compound i. The product composition from each experiment showed that C1-C3 products were formed from ethylene glycol and not from cyclohexanol. Thus, in experiments with ethylene glycol, the yield of these compounds was calculated based on the ethylene glycol feed, and the yield ratio of desired HDO products (ethane and ethylene) to CO, CO2, and CH4 was used as a measure of selectivity:
C 2 C 1 = Y C 2 H 6 + Y C 2 H 4 Y C O + Y C O 2 + Y C H 4
The yields of cyclic C6 products from experiments with cyclohexanol were calculated on a cyclohexanol basis. In an experiment with both ethylene glycol and cyclohexanol in the feed, 1,4-dioxaspiro[4.5]decane (C8H14O2) was formed. The yield of this compound was based on the cyclohexanol feed by multiplication of the molar flow of C8H14O2 with 6/8 to disregard the carbon derived from ethylene glycol.
The model compound conversion as well as the yields of liquid products (e.g., cyclohexane and cyclohexene) was generally subject to larger fluctuations than the yields of gaseous products. This was caused by a longer stabilization time (from a low volumetric flow rate), a lower frequency in the product analysis, and a less stable pressure reduction in the liquid product collection compared to the gas product analysis (online GC-TCD measurements every 30 minutes). Typically, around 40 mL liquid product was collected over the course of 5 hours, giving one data point, compared to around 10 GC-TCD measurements of the gaseous products within the same period of time.

4.4. Reaction Conditions

The conversion of acetic acid (AcOH, Sigma-Aldrich, ≥99.5%), ethylene glycol (EG, Sigma-Aldrich, ≥99.8%), phenol (Phe, Sigma-Aldrich, ≥99%), and cyclohexanol (Cyc, Sigma-Aldrich, ≥99%) in pure and mixed solutions was investigated using 0.5 g NiMo catalyst at 380–450 °C and 40 barg with 27 bar H2 and 550 vol ppm H2S (total gas feed: 1550 NmL/min). The partial pressures of the model compounds and products were low enough to keep them in the gas phase during reaction.
The conversion of pure ethylene glycol (experiment: EG) was compared with that of an ethylene glycol feed containing either phenol (Phe/EG) or cyclohexanol (Cyc/EG). In these experiments, a constant oxygen molar feed flow of 4.9 mmol/min was targeted (Table 6). An experiment with pure cyclohexanol (Cyc) was performed to assess if cyclohexanol HDO had been affected by the presence of ethylene glycol. In this experiment, the volumetric feed flow (0.16 mL/min) was used as design parameter instead of the oxygen flow.
The activity tests were conducted for up to 220 h on stream. An initial accelerated deactivation (at 420–450 °C) was performed (until 70 h) to avoid further loss of activity at 380–400 °C, which would otherwise be observed [19]. The cyclohexanol/ethylene glycol experiment (Cyc/EG) was abruptly terminated after 90 hours on stream due to equipment malfunction. For comparison, the pure cyclohexanol experiment (Cyc) was also run for 90 hours on stream, followed by 10 hours at 450 °C before experiment termination.

4.5. Macro-Kinetic Model

Due to the lack of oxygenate quantification in the product gas and incomplete condensation of acetaldehyde/ethenol and ethanol in the liquid products, the macro-kinetic model was set up with a lumped C2,ox term covering ethylene glycol, ethenol, acetaldehyde, and ethanol as indicated in Scheme 1. The kinetic model was based on the assumption of a constant hydrogen pressure (large excess) and first order kinetics for the remaining species. All species were assumed to be in the gas phase, and the total volumetric flow rate was assumed constant, which is a valid approximation for the highly diluted feed (see Table 6). The reactions included were the joint dehydration and hydrogenation of C2,ox into ethylene and the subsequent hydrogenation of ethylene into ethane (see Scheme 1):
  • Reaction 1a:
    C 2 , o x + H 2 k 1 C 2 H 4 + 2 H 2 O
    Δ H = 47   kJ / mol ,   at   380 450   ° C   for   C 2 , ox = EG
  • Reaction 2a:
    C 2 H 4 + H 2 k 2 C 2 H 6
    Δ H = 141   kJ / mol ,   at   380 450   ° C
The reaction rate, r, of reaction 1a and 2a was set up using lumped rate constants k′ and the concentration, C, of the lumped C2,ox compounds and ethylene (ETY):
r 1 a = k 1 a × C C 2 , o x
r 2 a = k 2 a × C E T Y
The packed bed reactor model was used to set up molar flow balances for C2,ox, ethylene, and ethane (ETA) based on reactions 1a and 2a:
d F C 2 , o x d W = r 1 a = k 1 a × C C 2 , o x
d F E T Y d W = r 1 a r 2 a = k 1 a × C C 2 , o x k 2 a × C E T Y
d F E T A d W = r 2 a = k 2 a × C E T Y
where W is the catalyst mass and F is the molar flow rate. The concentration was determined from the total gaseous volumetric flow rate, v, as Ci = Fi/v. The rate constants were parameterized at a mean temperature, Tmean, of 395 °C in order to decouple the activation energy and the pre-exponential factor:
k = k m e a n × e x p ( E a R ( 1 T 1 T m e a n ) )
where T is the temperature in K, Ea is the apparent activation energy in kJ/mol and R is the gas constant (8.314 × 10⁻³ kJ/(K·mol)). The inlet molar flows of ethylene glycol ( F C 2 , o x , 0 = F C E G , 0 ), ethylene (zero), and ethane (zero), were used as initial conditions for the system of differential equations, which was solved, while kmean and Ea were fitted.
The macro-kinetic model for HDO of cyclohexanol into cyclohexene (CEN) and cyclohexane (CAN) (see Scheme 2) was derived similarly as to that for ethylene glycol. Hydrogen is not a reactant in reaction 1b, but in reaction 2b it is included in the lumped rate constant, k′2b, with the assumption of being present in large excess:
d F C y c d W = r 1 b = k 1 b × C C y c
d F C E N d W = r 1 b r 2 b = k 1 b × C C y c k 2 b × C C E N
d F C A N d W = r 2 b = k 2 b × C C E N
Only steady state data at each temperature were used, and for each steady state, the data used were the average from the final 5 hours at the given steady state.

5. Conclusions

The HDO of different biomass derived model compounds was investigated at 380–450 °C, 27 bar H2, and 550 vol ppm H2S over a Ni-MoS2/MgAl2O4 catalyst. The results demonstrate a pronounced different reactivity of the compounds in HDO, ranging from the highly reactive acetic acid, which rapidly coked up the reactor inlet, to phenol, which only underwent limited alkyl substitution reactions with low yields. In addition, the HDO reactions were strongly influenced by the presence of several compounds. Ethylene glycol was readily converted in the presence and absence of cyclohexanol and phenol without significant influence on the macro-kinetic parameters. However, cyclohexanol deoxygenation was strongly inhibited by ethylene glycol, due to competitive adsorption and carbon deposition on acid sites.
This study proves the necessity of investigating HDO of mixed cellulose and lignin derived model compounds in the attempt to understand the reactions occurring during upgrading of real biomass-based feeds. The results indicate that immediate stabilization of reactive cellulose fragments, that is, before condensation, may be beneficial in order to reduce catalyst coking and avoid inhibition of the HDO of less reactive oxygenates. Alternatively, pyrolysis oil upgrading could be performed in several steps: First, removing the most reactive compounds, then the less reactive ones. The industrial potential of sulfide-based catalysts for HDO was strengthened by the possibility for regenerating the applied Ni-MoS2 catalyst. Deposited carbon could be removed from a spent catalyst by oxidation and re-sulfidation.
Future steps in the assessment of the commercial viability of the Ni-MoS2/MgAl2O4 HDO catalyst should focus on bridging the gap between more complex model compound mixtures and real feeds as well as assessing the industrial catalyst lifetime and optimizing the reactivation conditions.

Supplementary Materials

The following are available online at https://www.mdpi.com/2073-4344/9/6/521/s1, Figure S1: Simplified process diagram of the continuous flow fixed bed reactor setup. P: pump. MFC: Mass flow controller. PIC: Pressure indicator and controller. S1: Separator. dP: Differential pressure cell. C1: Condenser. V1-V8: Magnetic valves, Figure S2: Schematic drawing of reactor design including pressure shell, internal reactor, and thermo pocket. The gas and liquid inlets are shown. The insert to the right shows the gas and liquid feed flow paths at the internal reactor tube inlet, Figure S3: Initial temperature profiles. In the experiment with acetic acid (AcOH), the acetic acid feed was stopped at TOS ≈2.2 h, Figure S4: Effectiveness factor estimated for the fastest reaction in the conversion of ethylene glycol (dashed line) and cyclohexanol (solid line) as a function of catalyst particle radius. The actual particle radius used in HDO activity tests (150–300 μm) is shaded, Figure S5: Arrhenius plots for the rate constants presented in the main manuscript (Table 1). (a) k′1a: Initial dehydration and hydrogenation of C2,ox intro ethylene. (b) k′2a: Hydrogenation of ethylene into ethane, Figure S6: Equilibrium composition during cyclohexanol HDO calculated with HSC Chemistry v. 9.4.1.Feed composition: 2.1 kmol cyclohexanol, 66.1 kmol H2, and 31.8 kmol N2. Products included: H2O, cyclohexane, cyclohexene, and benzene. The concentration of cyclohexene is multiplied with 100 for visualization, Figure S7: Equilibrium composition during phenol HDO calculated with HSC Chemistry v. 9.4.1.Feed composition: 0.55 kmol phenol, 65 kmol H2, and 31.2 kmol N2. Products included: H2O, cyclohexane, benzene, Figure S8: TEM image of spent catalyst from the experiment: EG, Figure S9: Off-gas concentration profiles and temperature profile from carbon burnoff from the spent catalyst after experiment Phe/EG (before Phe/EG-ReAct). Performed in situ with 1 NL/min 7.6% O2 in N2.

Author Contributions

Conceptualization, M.H., J.G., J.-D.G. and A.D.J.; Funding acquisition, M.H., J.G., J.-D.G. and A.D.J.; Investigation, T.M.H.D., M.L.A., S.B.L. and T.W.H.; Project administration, M.H., J.G., J.-D.G. and A.D.J.; Supervision, M.H., J.G., J.-D.G. and A.D.J.; Writing—original draft, T.M.H.D.; Writing—review and editing, T.M.H.D., M.H., J.-D.G. and A.D.J.

Funding

This research was funded by The Danish Council for Strategic Research (now Innovation Fund Denmark) project 1305-00015B, The Programme Commission on Sustainable Energy and Environment.

Acknowledgments

This work is part of the H2CAP (hydrogen assisted catalytic pyrolysis for green fuels) project conducted at The Department of Chemical and Biochemical Engineering at DTU, Denmark. The technicians and workshop at DTU Chemical and Biochemical Engineering are acknowledged for the construction and maintenance of the experimental setup.

Conflicts of Interest

The authors declare no conflict of interest. The sponsors or other funding bodies had no role in the design, execution, interpretation, or writing of the study.

References

  1. Bridgwater, A.V. Review of fast pyrolysis of biomass and product upgrading. Biomass Bioenergy 2012, 38, 68–94. [Google Scholar] [CrossRef]
  2. Stummann, M.Z.; Høj, M.; Hansen, A.B.; Davidsen, B.; Wiwel, P.; Gabrielsen, J.; Jensen, P.A.; Jensen, A.D. New insights into the effect of pressure on catalytic hydropyrolysis of biomass. Fuel Process. Technol. 2019, 193, 392–403. [Google Scholar] [CrossRef]
  3. Venderbosch, R.H. A critical view on catalytic pyrolysis of biomass. Chem. Sus. Chem. 2015, 8, 1306–1316. [Google Scholar] [CrossRef]
  4. Resende, F.L.P. Recent advances on fast hydropyrolysis of biomass. Catal. Today. 2016, 269, 148–155. [Google Scholar] [CrossRef]
  5. Furimsky, E. Catalytic hydrodeoxygenation. Appl. Catal. A Gen. 2000, 199, 147–190. [Google Scholar] [CrossRef]
  6. Dabros, T.M.H.; Stummann, M.Z.; Høj, M.; Jensen, P.A.; Grunwaldt, J.-D.; Gabrielsen, J.; Mortensen, P.M.; Jensen, A.D. Transportation fuels from biomass fast pyrolysis, catalytic hydrodeoxygenation, and catalytic fast hydropyrolysis. Prog. Energy Combust. Sci. 2018, 68, 268–309. [Google Scholar] [CrossRef]
  7. Wang, H.; Male, J.; Wang, Y. Recent advances in hydrotreating of pyrolysis bio-oil and its oxygen-containing model compounds. ACS Catal. 2013, 3, 1047–1070. [Google Scholar] [CrossRef]
  8. Azeez, A.M.; Meier, D.; Odermatt, J.; Willner, T. Fast pyrolysis of African and European lignocellulosic biomasses using Py-GC/MS and fluidized bed reactor. Energy Fuels 2010, 24, 2078–2085. [Google Scholar]
  9. Mante, O.D.; Babu, S.P.; Amidon, T.E. A comprehensive study on relating cell-wall components of lignocellulosic biomass to oxygenated species formed during pyrolysis. J. Anal. Appl. Pyrolysis 2014, 108, 56–67. [Google Scholar] [CrossRef]
  10. Oasmaa, A.; Kuoppala, E.; Solantausta, Y. Fast pyrolysis of forestry residue. 2. Physicochemical composition of product liquid. Energy Fuels 2003, 17, 433–443. [Google Scholar]
  11. Elliott, D.C. Historical developments in hydroprocessing bio-oils. Energy Fuels 2007, 21, 1792–1815. [Google Scholar]
  12. Yin, W.; Kloekhorst, A.; Venderbosch, R.H.; Bykova, M.V.; Khromova, S.A.; Yakovlev, V.A.; Heeres, H.J. Catalytic hydrotreatment of fast pyrolysis liquids in batch and continuous set-ups using a bimetallic Ni–Cu catalyst with a high metal content. Catal. Sci. Technol. 2016, 6, 5899–5915. [Google Scholar] [CrossRef]
  13. Dwiatmoko, A.A.; Lee, S.; Ham, H.C.; Choi, J.-W.; Suh, D.J.; Ha, J.-M. Effects of carbohydrates on the hydrodeoxygenation of lignin- derived phenolic compounds. ACS Catal. 2015, 5, 433–437. [Google Scholar] [CrossRef]
  14. Ryymin, E.-M.; Honkela, M.L.; Viljava, T.-R.; Krause, A.O.I. Competitive reactions and mechanisms in the simultaneous HDO of phenol and methyl heptanoate over sulphided NiMo/γ-Al2O3. Appl. Catal. A Gen. 2010, 389, 114–121. [Google Scholar] [CrossRef]
  15. Boscagli, C.; Raffelt, K.; Grunwaldt, J.-D. Reactivity of platform molecules in pyrolysis oil and in water during hydrotreatment over nickel and ruthenium catalysts. Biomass Bioenergy 2017, 106, 63–73. [Google Scholar] [CrossRef]
  16. Stummann, M.Z.; Høj, M.; Schandel, C.B.; Hansen, A.B.; Wiwel, P.; Gabrielsen, J.; Jensen, P.A.; Jensen, A.D. Hydrogen assisted catalytic biomass pyrolysis. Effect of temperature and pressure. Biomass Bioenergy 2018, 115, 97–107. [Google Scholar] [CrossRef]
  17. Trinh, T.N.; Jensen, P.A.; Dam-Johansen, K.; Knudsen, N.O.; Sørensen, H.R.; Hvilsted, S. Comparison of lignin, macroalgae, wood, and straw fast pyrolysis. Energy Fuels 2013, 27, 1399–1409. [Google Scholar]
  18. Dabros, T.M.H.; Kramer, H.; Høj, M.; Sprenger, P.; Gabrielsen, J.; Grunwaldt, J.-D.; Jensen, A.D. The influence of active phase loading on the hydrodeoxygenation (HDO) of ethylene glycol over promoted MoS2/MgAl2O4 catalysts. Top. Catal. 2019. [Google Scholar] [CrossRef]
  19. Dabros, T.M.H.; Gaur, A.; Pintos, D.G.; Sprenger, P.; Høj, M.; Hansen, T.W.; Studt, F.; Gabrielsen, J.; Grunwaldt, J.-D.; Jensen, A.D. Influence of H2O and H2S on the composition, activity, and stability of sulfided Mo, CoMo, and NiMo supported on MgAl2O4 for hydrodeoxygenation of ethylene glycol. Appl. Catal. A Gen. 2018, 551, 106–121. [Google Scholar] [CrossRef]
  20. Fogler, S.H. Elements of Chemical Reaction Engineering, 4th ed.; Pearson Education International, Prentice Hall: Westford, MA, USA, 2010. [Google Scholar]
  21. Popov, A.; Kondratieva, E.; Goupil, J.M.; Mariey, L.; Bazin, P.; Gilson, J.-P.; Travert, A.; Maugé, F. Bio-oils hydrodeoxygenation: Adsorption of phenolic molecules on oxidic catalyst supports. J. Phys. Chem. C 2010, 114, 15661–15670. [Google Scholar] [CrossRef]
  22. Popov, A.; Kondratieva, E.; Mariey, L.; Goupil, J.M.; El Fallah, J.; Gilson, J.-P.; Travert, A.; Maugé, F. Bio-oil hydrodeoxygenation: Adsorption of phenolic compounds on sulfided (Co)Mo catalysts. J. Catal. 2013, 297, 176–186. [Google Scholar] [CrossRef]
  23. Bruix, A.; Füchtbauer, H.G.; Tuxen, A.K.; Walton, A.S.; Andersen, M.; Porsgaard, S.; Besenbacher, F.; Hammer, B.; Lauritsen, J.V. In situ detection of active edge sites in single-layer MoS2 catalysts. ACS Nano. 2015, 9, 9322–9330. [Google Scholar] [CrossRef] [PubMed]
  24. Grønborg, S.S.; Šarić, M.; Moses, P.G.; Rossmeisl, J.; Lauritsen, J.V. Atomic scale analysis of sterical effects in the adsorption of 4,6-dimethyldibenzothiophene on a CoMoS hydrotreating catalyst. J. Catal. 2016, 344, 121–128. [Google Scholar] [CrossRef]
  25. Šarić, M.; Rossmeisl, J.; Moses, P.G. Modeling the adsorption of sulfur containing molecules and their hydrodesulfurization intermediates on the Co-promoted MoS2 catalyst by DFT. J. Catal. 2018, 358, 131–140. [Google Scholar] [CrossRef]
  26. Furimsky, E.; Massoth, F.E. Deactivation of hydroprocessing catalysts. Catal. Today 1999, 52, 381–495. [Google Scholar] [CrossRef]
  27. Dufresne, P. Hydroprocessing catalysts regeneration and recycling. Appl. Catal. A Gen. 2007, 322, 67–75. [Google Scholar] [CrossRef]
  28. Smolik, G.R.; Petti, D.A.; Schuetz, S.T. Oxidation, volatilization, and redistribution of molybdenum from TZM alloy in air. INEEL/EXT-99-01353; Idaho National Engineering and Environmental Laboratory, 2000. Available online: https://inldigitallibrary.inl.gov/sites/sti/sti/3318122.pdf (accessed on 9 June 2019).
  29. Schachtl, E.; Yoo, J.S.; Gutiérrez, O.Y.; Studt, F.; Lercher, J.A. Impact of Ni promotion on the hydrogenation pathways of phenanthrene on MoS2/γ-Al2O3. J. Catal. 2017, 352, 171–181. [Google Scholar] [CrossRef]
  30. Prins, R. Chapter 13.2: Hydrotreating. In Handbook of Heterogeneous Catalysis; Wiley-VCH Verlag GmbH & Co. KGaA: Weinheim, Germany, 2008; pp. 2695–2718. [Google Scholar]
  31. Bui, V.N.; Laurenti, D.; Afanasiev, P.; Geantet, C. Hydrodeoxygenation of guaiacol with CoMo catalysts. Part I: Promoting effect of cobalt on HDO selectivity and activity. Appl. Catal. B Environ. 2011, 101, 239–245. [Google Scholar] [CrossRef]
  32. Şenol, O.İ.; Ryymin, E.-M.; Viljava, T.-R.; Krause, A.O.I. Effect of hydrogen sulphide on the hydrodeoxygenation of aromatic and aliphatic oxygenates on sulphided catalysts. J. Mol. Catal. A Chem. 2007, 277, 107–112. [Google Scholar] [CrossRef]
  33. Bouvier, C.; Romero, Y.; Richard, F.; Brunet, S. Effect of H2S and CO on the transformation of 2-ethylphenol as a model compound of bio-crude over sulfided Mo-based catalysts: propositions of promoted active sites for deoxygenation pathways based on an experimental study. Green Chem. 2011, 13, 2441–2451. [Google Scholar] [CrossRef]
  34. Gonçalves, V.O.O.; Brunet, S.; Richard, F. Hydrodeoxygenation of cresols over Mo/Al2O3 and CoMo/Al2O3 sulfided catalysts. Catal. Letters 2016, 146, 1562–1573. [Google Scholar] [CrossRef]
  35. Mortensen, P.M.; Gardini, D.; Damsgaard, C.D.; Grunwaldt, J.-D.; Jensen, P.A.; Wagner, J.B.; Jensen, A.D. Deactivation of Ni-MoS2 by bio-oil impurities during hydrodeoxygenation of phenol and octanol. Appl. Catal. A Gen. 2016, 523, 159–170. [Google Scholar] [CrossRef]
  36. Romero, Y.; Richard, F.; Brunet, S. Hydrodeoxygenation of 2-ethylphenol as a model compound of bio-crude over sulfided Mo-based catalysts: Promoting effect and reaction mechanism. Appl. Catal. B Environ. 2010, 98, 213–223. [Google Scholar] [CrossRef]
  37. Baldauf, W.; Balfanz, U.; Rupp, M. Upgrading of flash pyrolysis oil and utilization in refineries. Biomass Bioenergy 1994, 7, 237–244. [Google Scholar] [CrossRef]
  38. Elliott, D.C.; Hart, T.R.; Neuenschwander, G.G.; Rotness, L.J.; Zacher, A.H. Catalytic hydroprocessing of biomass fast pyrolysis bio-oil to produce hydrocarbon products. Environ. Prog. Sustain. Energy 2009, 28, 441–449. [Google Scholar] [CrossRef]
  39. Cordero-Lanzac, T.; Palos, R.; Arandes, J.M.; Castaño, P.; Rodríguez-Mirasol, J.; Cordero, T.; Bilbao, J. Stability of an acid activated carbon based bifunctional catalyst for the raw bio-oil hydrodeoxygenation. Appl. Catal. B Environ. 2017, 203, 389–399. [Google Scholar] [CrossRef]
  40. Lemonidou, A.A.; Kechagiopoulos, P.; Heracleous, E.; Voutetakis, S. Chapter 14: Steam reforming of bio-oils to hydrogen. In The Role of Catalysis for the Sustainable Production of Bio-Fuels and Bio-Chemicals; Triantafyllidis, K., Lappas, A., Stöcker, M., Eds.; Elsevier: Amsterdam, The Netherlands, 2013; pp. 467–493. [Google Scholar]
  41. Van Doorn, J.; Moulijn, J.A.; Djéga-Mariadassou, G. High-resolution electron microscopy of spent Ni-Mo/Al2O3 hydrotreating catalysts. Appl. Catal. 1990, 63, 77–90. [Google Scholar] [CrossRef]
  42. Liu, G.; Robertson, A.W.; Li, M.M.-J.; Kuo, W.C.H.; Darby, M.T.; Muhieddine, M.H.; Lin, Y.-C.; Suenaga, K.; Stamatakis, M.; Warner, J.H.; et al. MoS2 monolayer catalyst doped with isolated Co atoms for the hydrodeoxygenation reaction. Nat. Chem. 2017, 9, 810–816. [Google Scholar] [CrossRef] [PubMed]
  43. Song, W.; Nie, T.; Lai, W.; Yang, W.; Jiang, X. Tailoring the morphology of Co-doped MoS2 for enhanced hydrodeoxygenation performance of p-cresol. Cryst. Eng. Comm. 2018, 20, 4069–4074. [Google Scholar] [CrossRef]
  44. Gaur, A.; Dabros, T.M.H.; Høj, M.; Boubnov, A.; Prüssmann, T.; Jelic, J.; Studt, F.; Jensen, A.D.; Grunwaldt, J.-D. Probing the active sites of MoS2 based hydrotreating catalysts using modulation excitation spectroscopy. ACS Catal. 2019, 9, 2568–2579. [Google Scholar] [CrossRef]
  45. Marker, T.L.; Felix, L.G.; Linck, M.B.; Roberts, M.J. Integrated hydropyrolysis and hydroconversion (IH2) for the directproduction of gasoline and diesel fuels or blending components from biomass, part 1: Proof of principle testing. Environ. Prog. Sustain. Energy 2012, 31, 191–199. [Google Scholar] [CrossRef]
  46. Marker, T.L.; Felix, L.G.; Linck, M.B.; Roberts, M.J.; Ortiz-toral, P.; Wangerow, J. Integrated hydropyrolysis and hydroconversion (IH2) for the directproduction of gasoline and diesel fuels or blending components from biomass, part 2: Continuous testing. Environ. Prog. Sustain. Energy 2014, 33, 762–768. [Google Scholar] [CrossRef]
  47. Stummann, M.Z.; Hansen, A.B.; Hansen, L.P.; Davidsen, B.; Rasmussen, S.B.; Wiwel, P.; Gabrielsen, J.; Jensen, P.A.; Jensen, A.D.; Høj, M. Catalytic hydropyrolysis of biomass using molybdenum sulfide based catalyst. Effect of promoters. Energy Fuels 2019, 33, 1302–1313. [Google Scholar]
  48. Stummann, M.Z.; Høj, M.; Davidsen, B.; Hansen, A.B.; Hansen, L.P.; Wiwel, P.; Schandel, C.B.; Gabrielsen, J.; Jensen, P.A.; Jensen, A.D. Effect of the catalyst in fluid bed catalytic hydropyrolysis. Catal. Today 2019, in press. [Google Scholar] [CrossRef]
  49. Dayton, D.C.; Hlebak, J.; Carpenter, J.R.; Wang, K.; Mante, O.D.; Peters, J.E. Biomass hydropyrolysis in a fluidized bed reactor. Energy Fuels 2016, 30, 4879–4887. [Google Scholar]
  50. Routray, K.; Barnett, K.J.; Huber, G.W. Hydrodeoxygenation of pyrolysis oils. Energy Technol. 2017, 5, 80–93. [Google Scholar] [CrossRef]
  51. Elliott, D.C.; Neuenschwander, G.G.; Hart, T.R. Hydroprocessing bio-oil and products separation for coke production. ACS Sustain. Chem. Eng. 2013, 1, 389–392. [Google Scholar] [CrossRef]
  52. Zacher, A.H.; Elliott, D.C.; Olarte, M.V.; Santosa, D.M.; Preto, F.; Iisa, K. Pyrolysis of woody residue feedstocks: Upgrading of bio-oils from mountain-pine-beetle-killed trees and hog fuel. Energy Fuels 2014, 28, 7510–7516. [Google Scholar]
  53. Olarte, M.V.; Padmaperuma, A.B.; Ferrell, J.R., III; Christensen, E.D.; Hallen, R.T.; Lucke, R.B.; Burton, S.D.; Lemmon, T.L.; Swita, M.S.; Fioroni, G.; et al. Characterization of upgraded fast pyrolysis oak oil distillate fractions from sulfided and non-sulfided catalytic hydrotreating. Fuel 2017, 202, 620–630. [Google Scholar] [CrossRef]
  54. Schofield, K. The enigmatic mechanism of the flame ionization detector: Its overlooked implications for fossil fuel combustion modeling. Prog. Energy Combust. Sci. 2008, 34, 330–350. [Google Scholar] [CrossRef]
Scheme 1. Different reaction paths for the conversion of ethylene glycol into various C1, C2, and C3+ products; in blue are target reactions and in red are side reactions. Δ indicates additional heat. C2,ox is used as a lumped term for ethylene glycol, ethenol, acetaldehyde, and ethanol. Reactions 1a and 2a are included in the macro-kinetic model, see Section 4.5.
Catalysts 09 00521 sch001
Scheme 2. Possible reactions of cyclohexanol hydrodeoxygenation (HDO). ΔH = 41 kJ/mol (reaction 1b) and −124 kJ/mol (reaction 2b) at 380–450 °C. Reactions 1b and 2b are included in the macro-kinetic model, see Section 4.5.
Catalysts 09 00521 sch002
Figure 1. Conversion of ethylene glycol, XEG, from experiments with pure ethylene glycol and mixtures of cyclohexanol/EG and phenol/EG, and with the phenol/EG mixture after catalyst reactivation (Phe/EG-ReAct, see Section 2.4). Set point temperatures are shown. For Phe/EG-ReAct, the step at 390 °C was extended by 15 h (not indicated in the figure for simplicity), until a step at 280 °C was introduced.
Catalysts 09 00521 g001
Figure 2. Carbon based yields of (a) ethane; (b) ethylene; (c) CO; and (d) CH4 from the conversion of ethylene glycol in experiments with pure ethylene glycol and mixtures of cyclohexanol/EG and phenol/EG. Set point temperatures are shown (see also Figure 1).
Catalysts 09 00521 g002
Figure 3. Selectivity towards HDO compared to cracking expressed as the C2/C1 gaseous product ratio as a function of measured reaction temperature from the conversion of ethylene glycol in experiments with pure ethylene glycol and mixtures of cyclohexanol/EG and phenol/EG. Data taken from the final 5 h of each operating temperature. Error bars show two standard deviations.
Catalysts 09 00521 g003
Figure 4. Carbon based (a) C2 yield; (b) C2/C1 ratio; (c) ethylene yield, and (d) ethane yield for the first 125 h on stream, where the reaction temperature was the same. Based on ethylene glycol first run (Phe/EG) and second run (reactivated catalyst, Phe/EG-ReAct). Set point temperatures are shown (see also Figure 1). For conversion, see Figure 1.
Catalysts 09 00521 g004
Figure 5. TEM images of the sulfided NiMo/MgAl2O4 catalyst after the experiments: (a) EG; (b) Phe/EG-ReAct.
Catalysts 09 00521 g005
Figure 6. Particle size distribution for spent catalysts from experiments EG and Phe/EG-ReAct: (a) Slab length; (b) stacking. Based on >700 slabs in >40 TEM images for each sample.
Catalysts 09 00521 g006
Figure 7. Carbon based product yields from the conversion of (a) pure cyclohexanol (Cyc); and (b) a cyclohexanol/ethylene glycol mixture (Cyc/EG). Based on cyclohexanol. The conversion of cyclohexanol for the pure compound (a) was ≥99.5% during the entire time on stream and is therefore not shown. Set point temperatures are shown.
Catalysts 09 00521 g007
Figure 8. Carbon deposition as a function of time on stream. From HDO tests performed at 380–450 °C. Data from this work (Table 2 and Table 5, circles: text denotes experiment name), Dabros et al.(a) [18] (Table 3, triangles, X = 100% denotes experiments with full conversion), and Dabros et al.(b) [19] (Table 2, diamonds).
Catalysts 09 00521 g008
Table 1. First order rate constants as a function of reaction temperature, and apparent activation energies and rate constants at the mean temperature of 395 °C for the conversion of ethylene glycol (reactions 1a and 2a) as pure compound and in mixture with phenol and cyclohexanol.
ExperimentTOSTk′1a × 103k′2a × 103Ea,1aEa,2ak′1a,mean × 103k′2a,mean × 103
[h][°C][L/(min·g)][kJ/mol][L/(min·g)]
EG90–10439916.427193.38.1515.0269
134–13938812.4264
165–1703779.41258
Phe/EG99–10439714.225095.922.113.6248
134–13938610.8235
165–1703768.15220
Phe/EG-ReAct 1148–15338812.678.414132.316.483.3
173–1783778.1971.1
Cyc/EG64–6941322.233685.42.4314.8332
85–9039013.3331
1 After catalyst reactivation, see Section 2.4.
Table 2. Composition of the spent catalyst after long term experiments.
ExperimentTOSMoNiNi/MoSCS/Mo
[h][wt%][wt%][molar][wt%][wt%][molar]
EG2212.550.460.291.7118.82.00
Phe/EG-ReAct 1220(2nd)1.450.440.492.4011.34.96
1 After catalyst reactivation.
Table 3. First order rate constants as a function of reaction temperature, and apparent activation energies and rate constants at the mean temperature of 395 °C for the conversion of cyclohexanol (reactions 1b and 2b) as pure compound and in mixture with ethylene glycol. For macro-kinetic model, see Section 4.5.
ExperimentTOSTk1b × 103k′2b × 103Ea,1bEa,2bk1b,mean × 103k′2b,mean × 103
[h][°C][L/(min·g)][kJ/mol][L/(min·g)]
Cyc53–63413≥524 155.1-43.3-45.2
78–88391≥524 143.5
Cyc/EG54–6441321.474.412182.912.150.3
74–8439010.344.9
1 Due to full conversion of cyclohexanol in this experiment, kinetic parameters were not fitted for reaction 1b. k1b was calculated as k 1 b = v W l n ( 1 X 1 b ) , with X1b = (FCEN + FCAN)/FCyc,feed, see Section 4.5.
Table 4. Gas product yields at TOS = 0–2 h for the conversion of ethylene glycol (EG) and acetic acid (AcOH) at 450 °C.
ExperimentCH4 [%]CO [%]CO2 [%]Ethylene [%]Ethane [%]Propylene [%]Propane [%]Total Carbon in Gas Phase [%]
EG8–912–134–58–1128–294–7367–74
AcOH17–2117–207–8221–248–119–1183–93
Table 5. Composition of spent catalysts.
ExperimentTOSMoNiNi/MoSCS/Mo
[h][wt%][wt%][molar][wt%][wt%][molar]
Phe/EG220(1st)----15.4-
Cyc/EG902.630.420.261.6913.61.92
Cyc962.960.510.282.183.812.51
AcOH23.090.520.272.032.761.96
Table 6. Average model compound feed flow rates. Operating conditions: 27 bar H2, 550 vol ppm H2S, 40 barg total pressure (balance N2). WHSV: Weight hourly space velocity in gmodel compound/(gcat·h). The total flow of N2, H2, and H2S was 69 mmol/min (1550 NmL/min).
Experiment/ParameterEGPhe/EGPhe/EG-ReActCyc/EGCyc
Molar Flow Rates [mmol/min]
Ethylene glycol2.52.22.22.20
Phenol00.40.400
Cyclohexanol0000.41.5
Oxygen4.94.94.94.81.5
Carbon4.96.96.96.79.0
Total flow rate [mL/min]0.140.160.160.160.16
Total WHSV [h−1]1921212118

