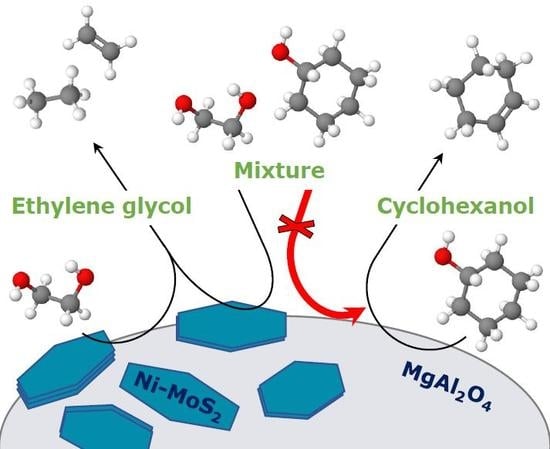
2.3. HDO of Ethylene Glycol
HDO of pure ethylene glycol and mixtures of phenol/ethylene glycol and cyclohexanol/ethylene (EG, Phe/EG, Cyc/EG), and that of the phenol/ethylene glycol mixture after catalyst reactivation (Phe/EG-ReAct, see
Section 2.4), was performed in a continuous flow, fixed bed reactor at 40 barg and 380–450 °C (see
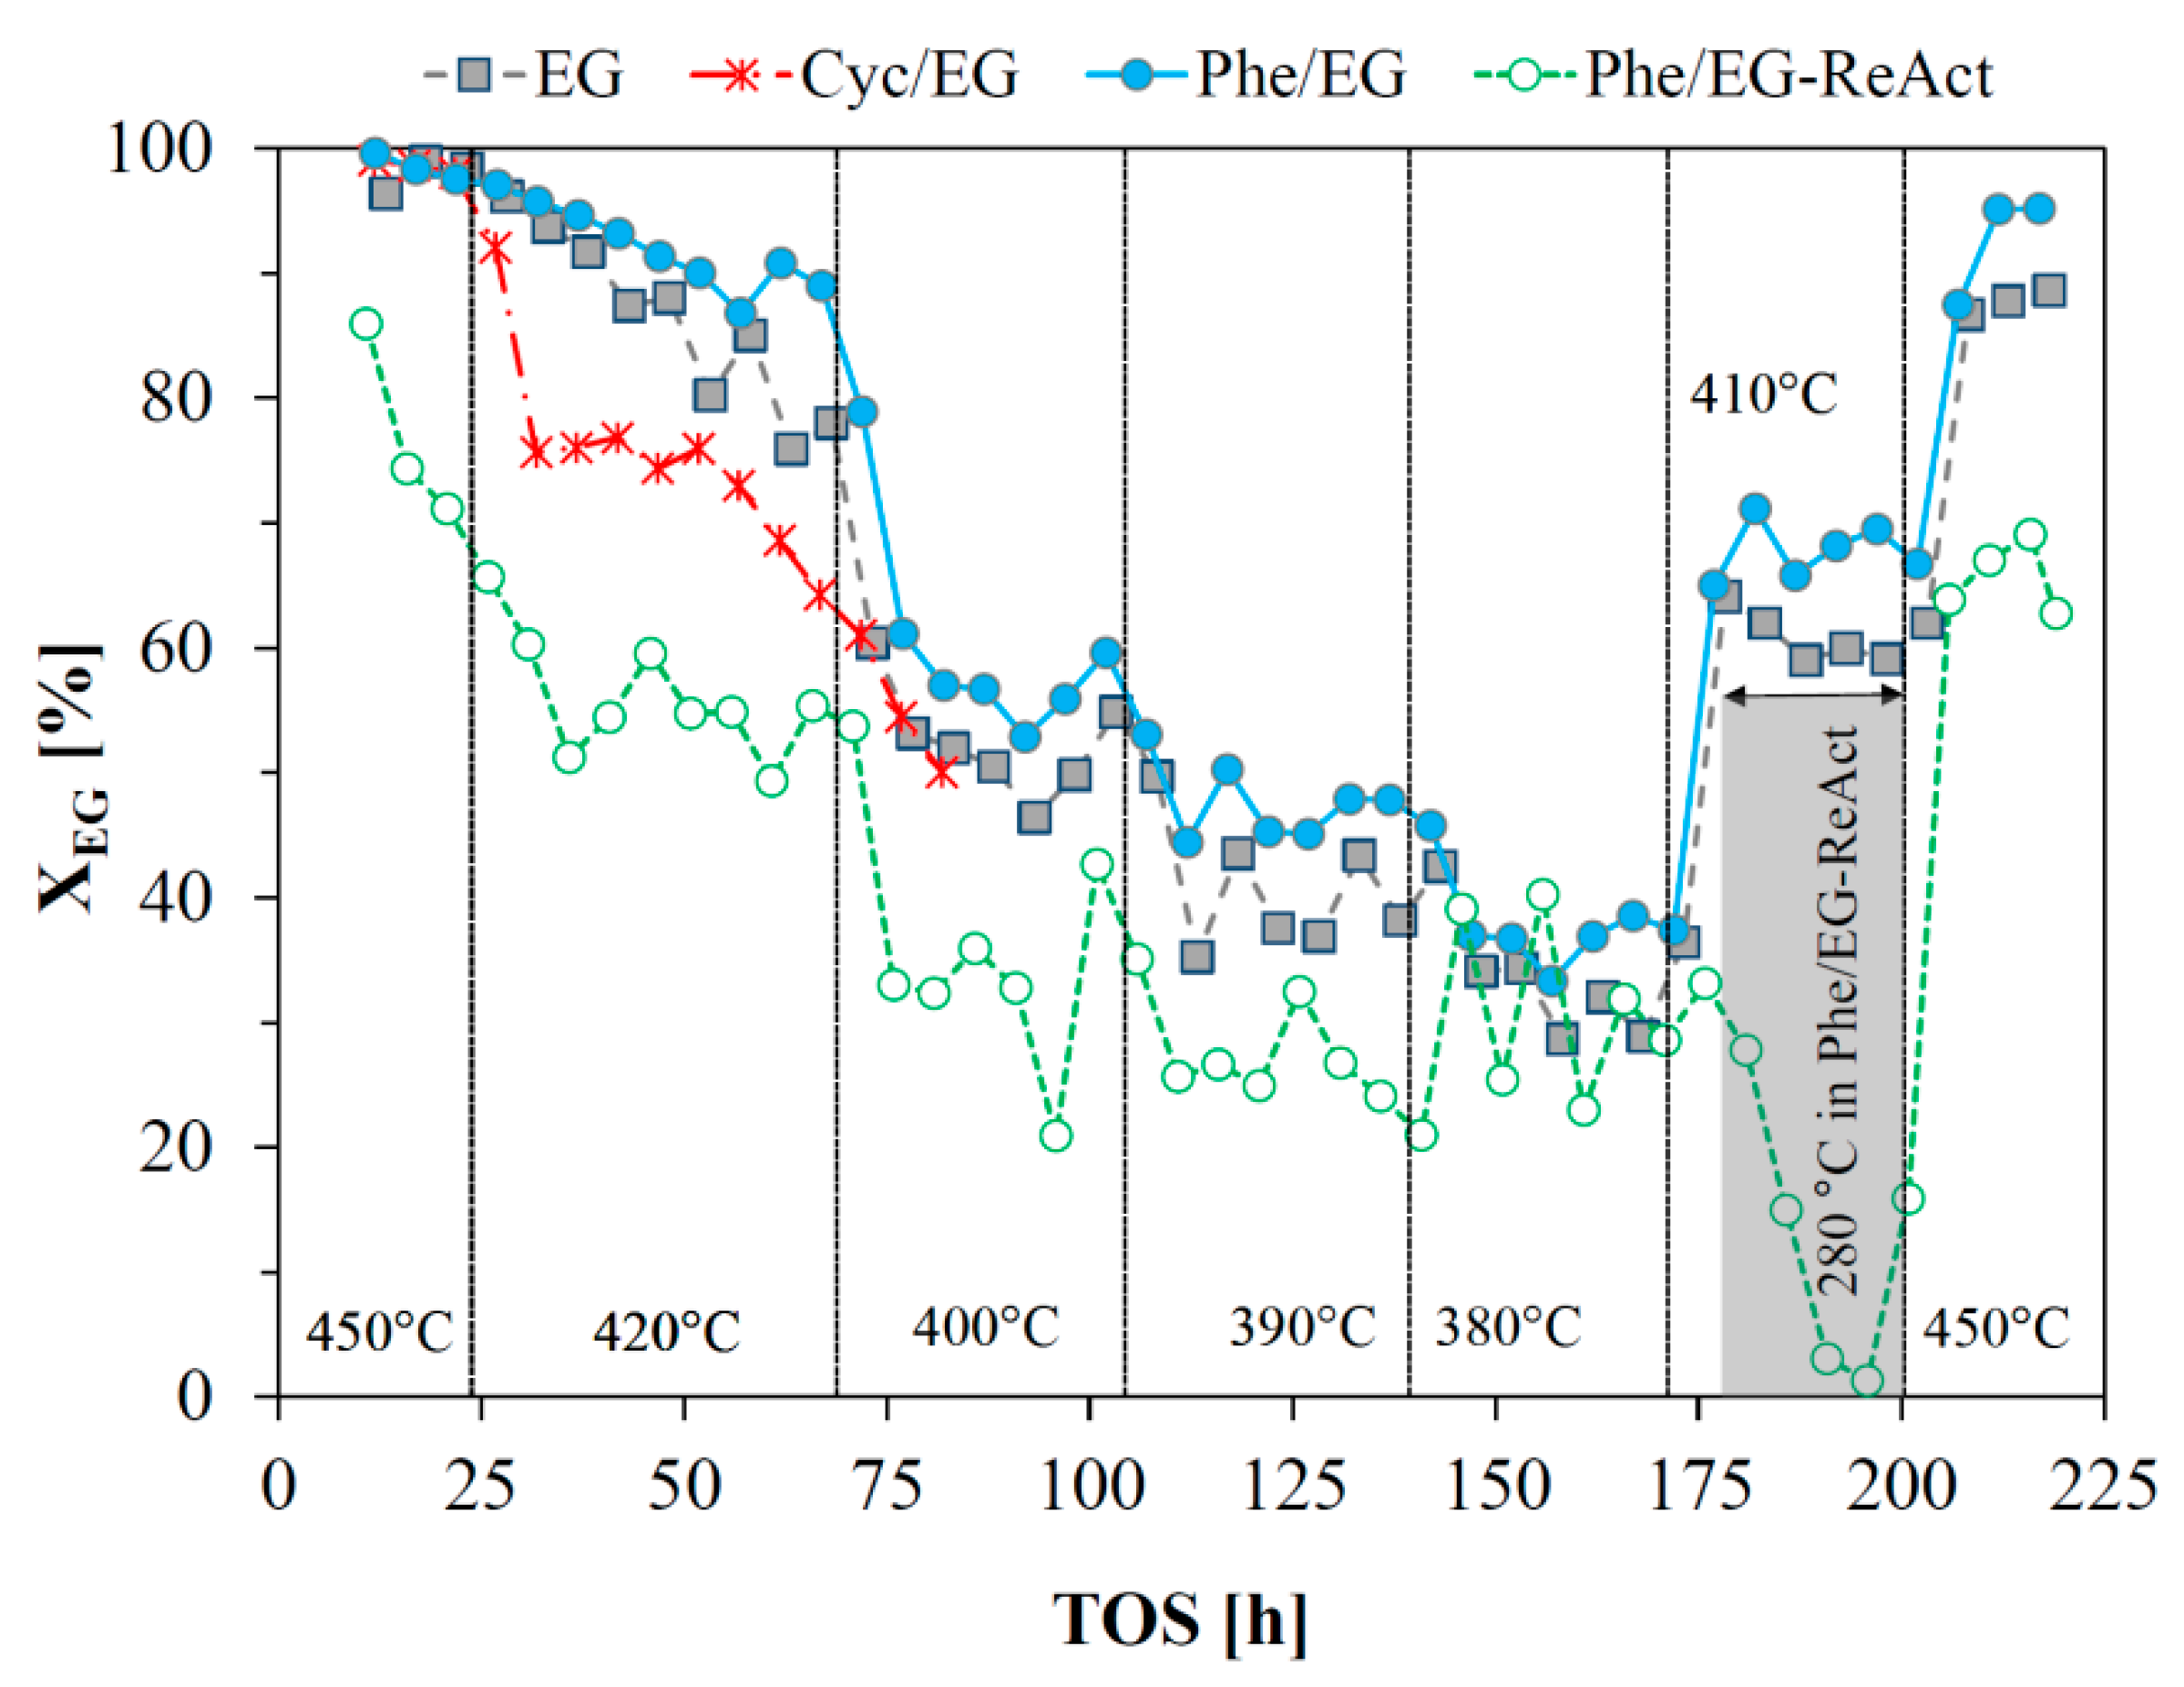
Section 4). The conversion of ethylene glycol (
Figure 1) was close to 100% at 450 °C in the beginning of each experiment, except for the reactivated catalyst, where it was 86%. Deactivation however occurred, and a decrease in conversion was observed before the temperature was decreased to 420 °C (at time on stream (TOS) = 24 h). Steady state activity was obtained at the subsequent temperature set points of 400, 390, and 380 °C. Increasing the temperature from 380 °C to 410 °C after 170 h (EG and Phe/EG), did not allow for steady state operation in terms of product yields, and continuous deactivation was observed (
Figure 2). As the temperature was brought back to the initial set point of 450 °C, the conversion increased to 88–95%. It was, thus, slightly lower than the initially obtained conversion and continued deactivation was evident from the product yields (
Figure 2).
The reaction temperature was identical (within <2 °C) for the experiments with pure ethylene glycol and the phenol/EG mixture. The temperature was, however, notably lower (up to 10 °C) when cyclohexanol was present in the feed, which affected the conversion and yields accordingly. This lower temperature was due to the endothermic dehydration of cyclohexanol.
Figure 2 shows the yields of C
1-C
2 gas products. The yield of CO
2 was ≈1–5% during the initial deactivation period and <0.5% at the subsequent steady states. There was an initial (TOS <10 h) decrease in the yield of ethane and a corresponding increase in ethylene (
Figure 2a,b). This initial deactivation in hydrogenation activity was presumably caused by the loss of SH-groups from the active edges of the promoted MoS
2 particles [
19], while carbon deposition also contributed to the overall deactivation. During steady state operation at 380–400 °C, the yields of ethane and ethylene, respectively, were below 5%. The yields obtained immediately after returning to 450 °C at 200 h were approximately the same as those obtained at 24 h, at the end of the initial 450 °C operation period, supporting the observation that steady state activity was obtained during 70–170 h on stream with little further deactivation during this period.
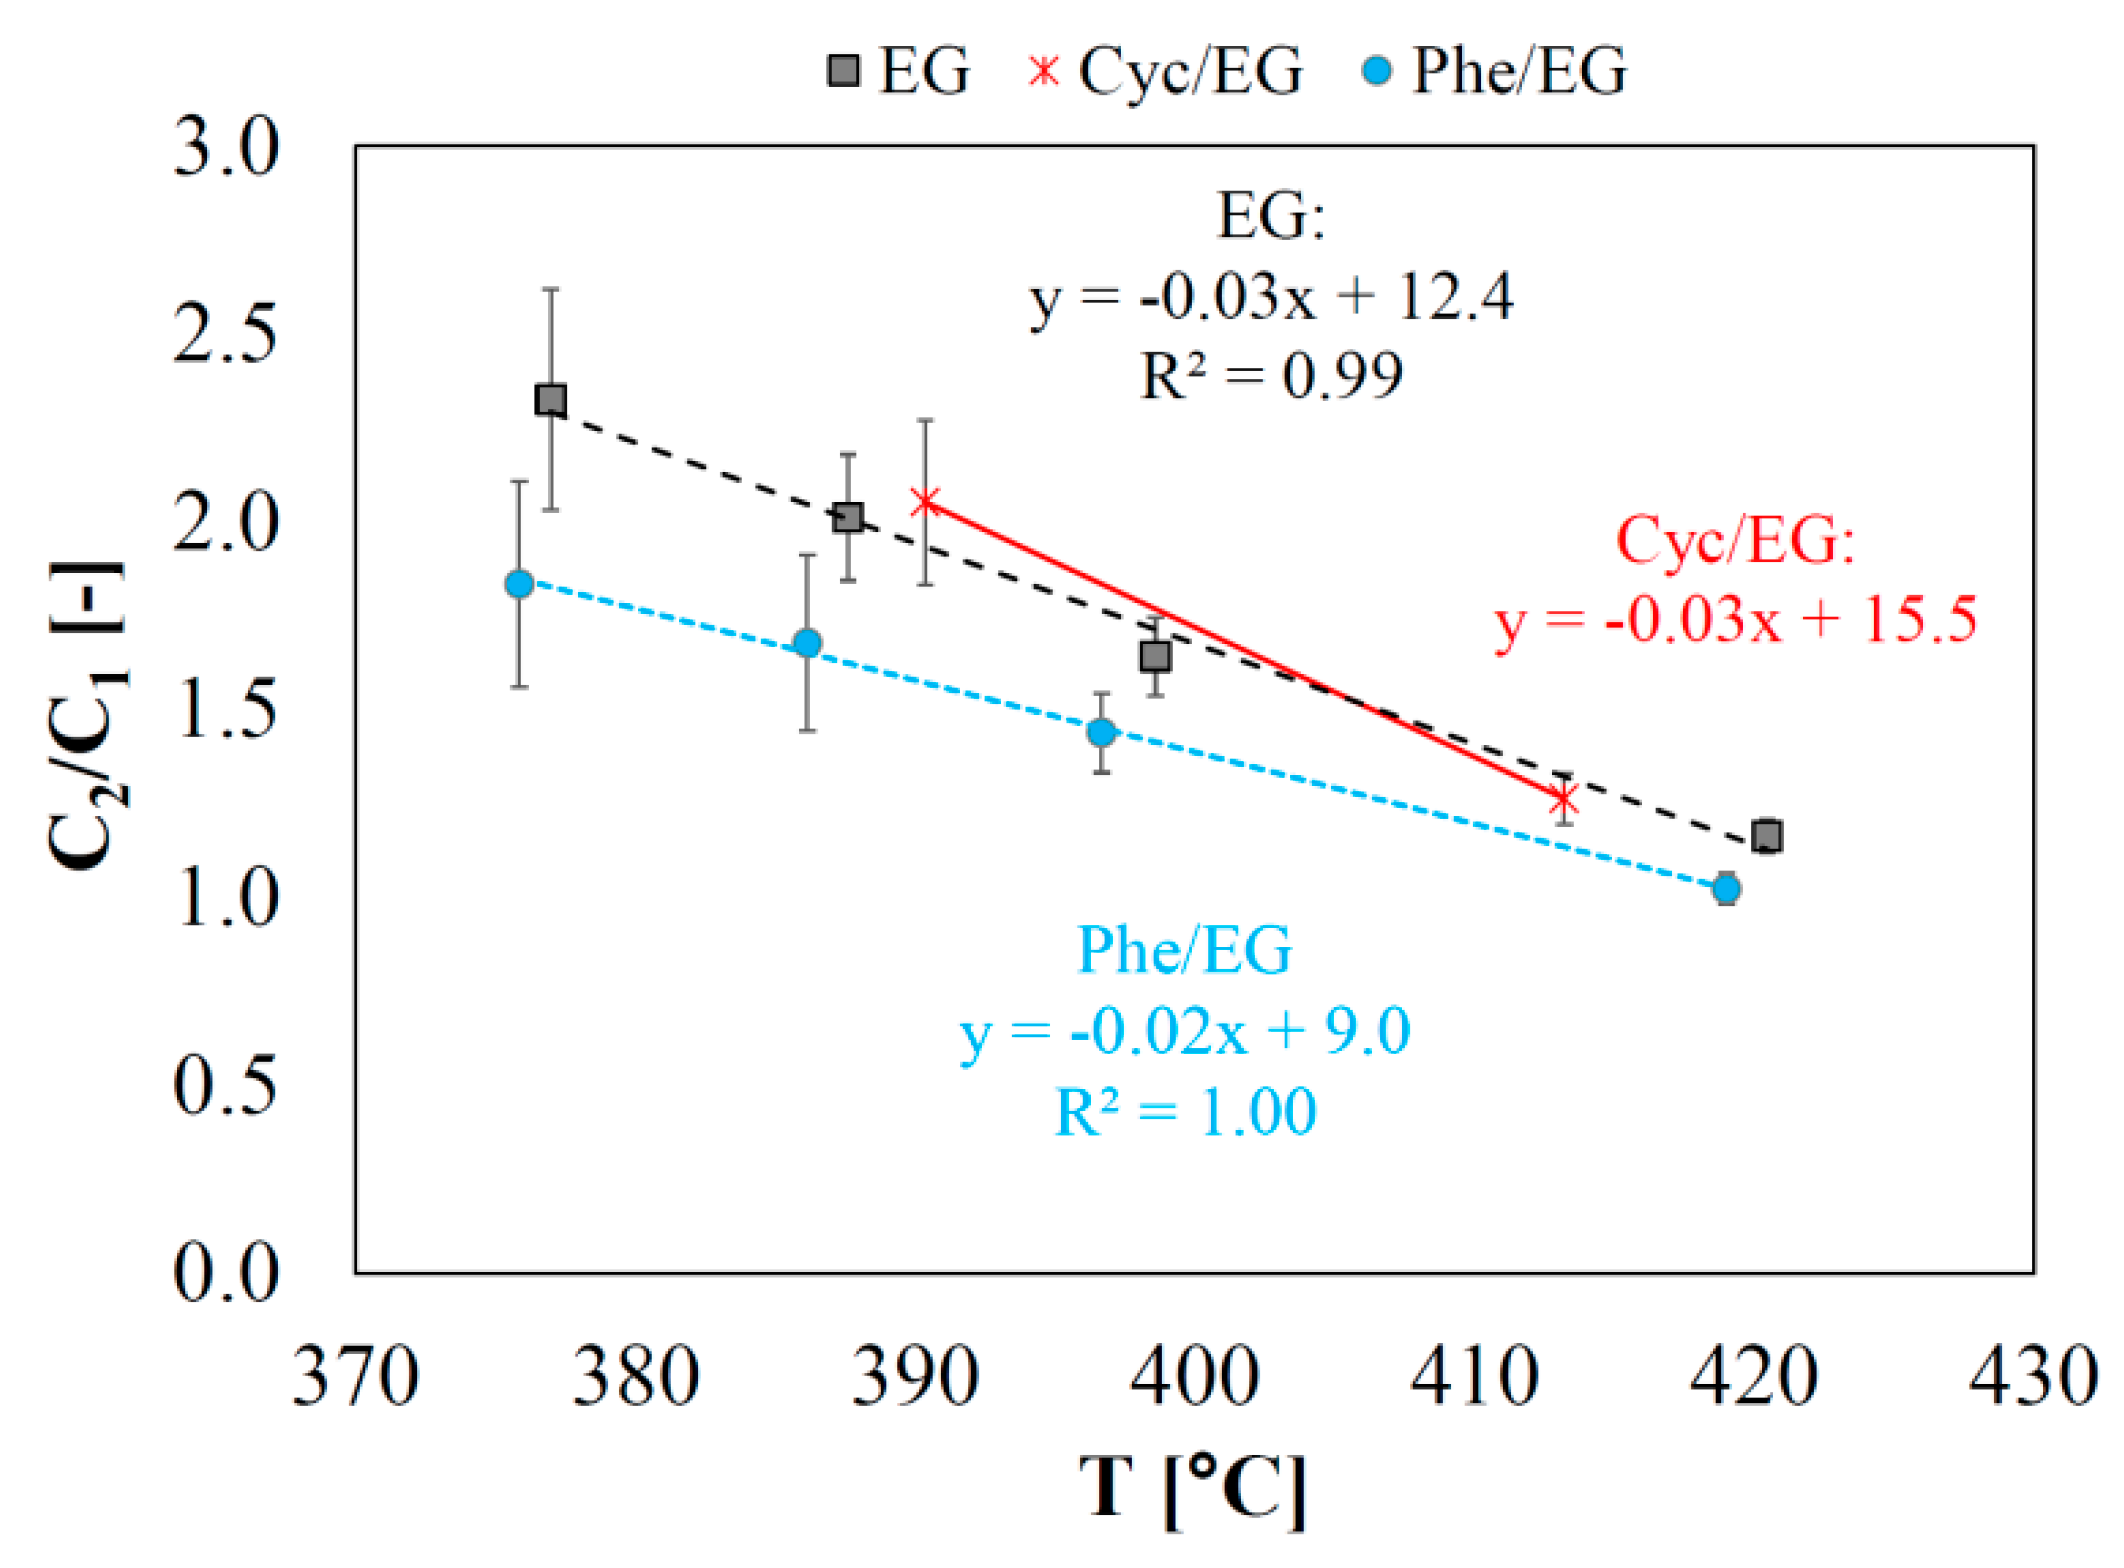
CO was the main cracking product formed (
Figure 2c,d). The C
2/C
1 yield ratio obtained in the experiments (
Figure 3) increased linearly with decreasing temperature, showing the enhanced cracking at elevated temperature. The higher variations in the C
2/C
1 ratio at lower temperatures was caused by greater relative fluctuations in the measured concentration of C
1 products.
The combined yield of propane and propylene was ≤10% during the initial deactivation period (450–420 °C, 0–70 h). However, at the subsequent steady state period (380–400 °C, 70–170 h), this number was less than 1%, and it remained low (≤2%) during the remainder of the activity tests, indicating that active sites (probably acid sites) responsible for carbon–carbon bond formation had been deactivated.
Calculated first order rate constants for each reaction temperature and fitted Arrhenius parameters based on these rate constants (for reactions 1
a and 2
a) are listed in
Table 1, see
Section 4.5 for the macro-kinetic model. Based on the evaluation of the Mears’ criterion and the effectiveness factor [
20] (
Figure S4), it was concluded that the experiments were conducted without significant external or internal diffusion limitations.
The thermodynamic equilibrium of reactions 1
a and 2
a is fully shifted towards the product side at the applied operating conditions (calculated with HSC Chemistry v. 9.4.1.). Incomplete conversion of ethylene glycol was, however, obtained during steady state operation and ethylene and ethane were formed at similar yields (
Figure 1 and
Figure 2). Thus, the reaction mixture was far from equilibrium, possibly partly due to the initial loss of hydrogenation activity. The hydrogenation of ethylene had a low apparent activation energy of 2.4–32 kJ/mol and a rate constant,
k′2a,mean, which for the fresh catalysts was 18-22 times larger than that of the initial dehydration and hydrogenation of oxygenates into ethylene,
k′1a,mean. Although this fast hydrogenation of ethylene was probably affected by some mass transfer limitations, giving a low apparent activation energy, the trend in reactivity remains unaffected.
The kinetics of ethylene glycol HDO were rather similar for ethylene glycol as pure feed or in the presence of phenol or cyclohexanol, especially for the first dehydration and hydrogenation step where
k′1a,mean = 14–16 × 10
−3 L/(min·g) and
Ea,1a = 85–96 kJ/mol, suggesting that no inhibition of ethylene glycol HDO from phenol or cyclohexanol occurred (
Figure S5a). The hydrogenation of ethylene was more affected by the presence of phenol or cyclohexanol (
Figure S5b). Cyclohexanol seemed to have a slight promoting effect, while phenol seemed to have a slight inhibiting effect. Phenol is expected to adsorb strongly onto the support [
21,
22], which may block the accessibility to active edge sites responsible for hydrogenation and deoxygenation (brim sites and vacancies) [
23,
24,
25], and thereby limit this activity. Cyclohexanol dehydration is suggested to occur over the acid sites of the support, and it is possible that this occupation of acid sites has prevented coke formation, keeping hydrogenation sites accessible.
The reactivated catalyst showed a decreased hydrogenation rate and a significantly higher barrier for the initial ethylene glycol dehydration and hydrogenation, as
k′2a,mean decreased from 248–332 × 10
−3 L/(min·g) to 83 × 10
−3 L/(min·g) and
Ea,1a increased from 85–96 kJ/mol to 141 kJ/mol (
Table 1). This may be due to changes in the active phase (see below).
2.4. Catalyst Reactivation
If HDO of biomass feedstocks occurs during pyrolysis (as in catalytic fast hydropyrolysis), the operating temperature should not be increased markedly, as this would favor gas formation and limit the oil yield [
1]. This means that catalyst reactivation cannot be performed analogously to conventional hydrotreating, in which catalyst activity can be maintained by continuously increasing the reaction temperature until the end of run temperature (the upper limit allowed by the equipment) is reached [
26]. If HDO, on the other hand, is carried out downstream of a pyrolysis unit, it allows for a greater flexibility in the choice of operating temperature, as this step is decoupled from the pyrolysis.
At the end of a catalytic cycle in conventional hydrotreating it is possible to regenerate the spent catalyst ex situ by combustion of deposited coke and reload it into the reactor [
27]. Such an ex situ regeneration could be particularly suitable for HDO catalysts, where deactivation is faster. To test this, the catalyst tested for HDO of the phenol/ ethylene glycol mixture was reactivated in situ in the reactor setup. Deposited carbon was removed in an oxidation step (545 °C in 7.6% O
2 in N
2,
Figure S9), which left the active sulfide phase in a partially oxidized state requiring a re-sulfidation step to convert the resulting MoO
xS
y phase back into the active MoS
2 phase. The concentrations of NO
x (negligible), CO, CO
2, O
2, and SO
2 where monitored using an Emerson NGA 2000 gas analyzer. The carbon deposition on the catalyst was calculated based on the flow of N
2 and O
2 into the system and the measured concentrations of oxidation products and O
2, giving a carbon deposition of 15.4 wt %. After re-sulfidation, the catalytic activity was measured again (EG/Phe-ReAct,
Figure 1 and
Figure 4).
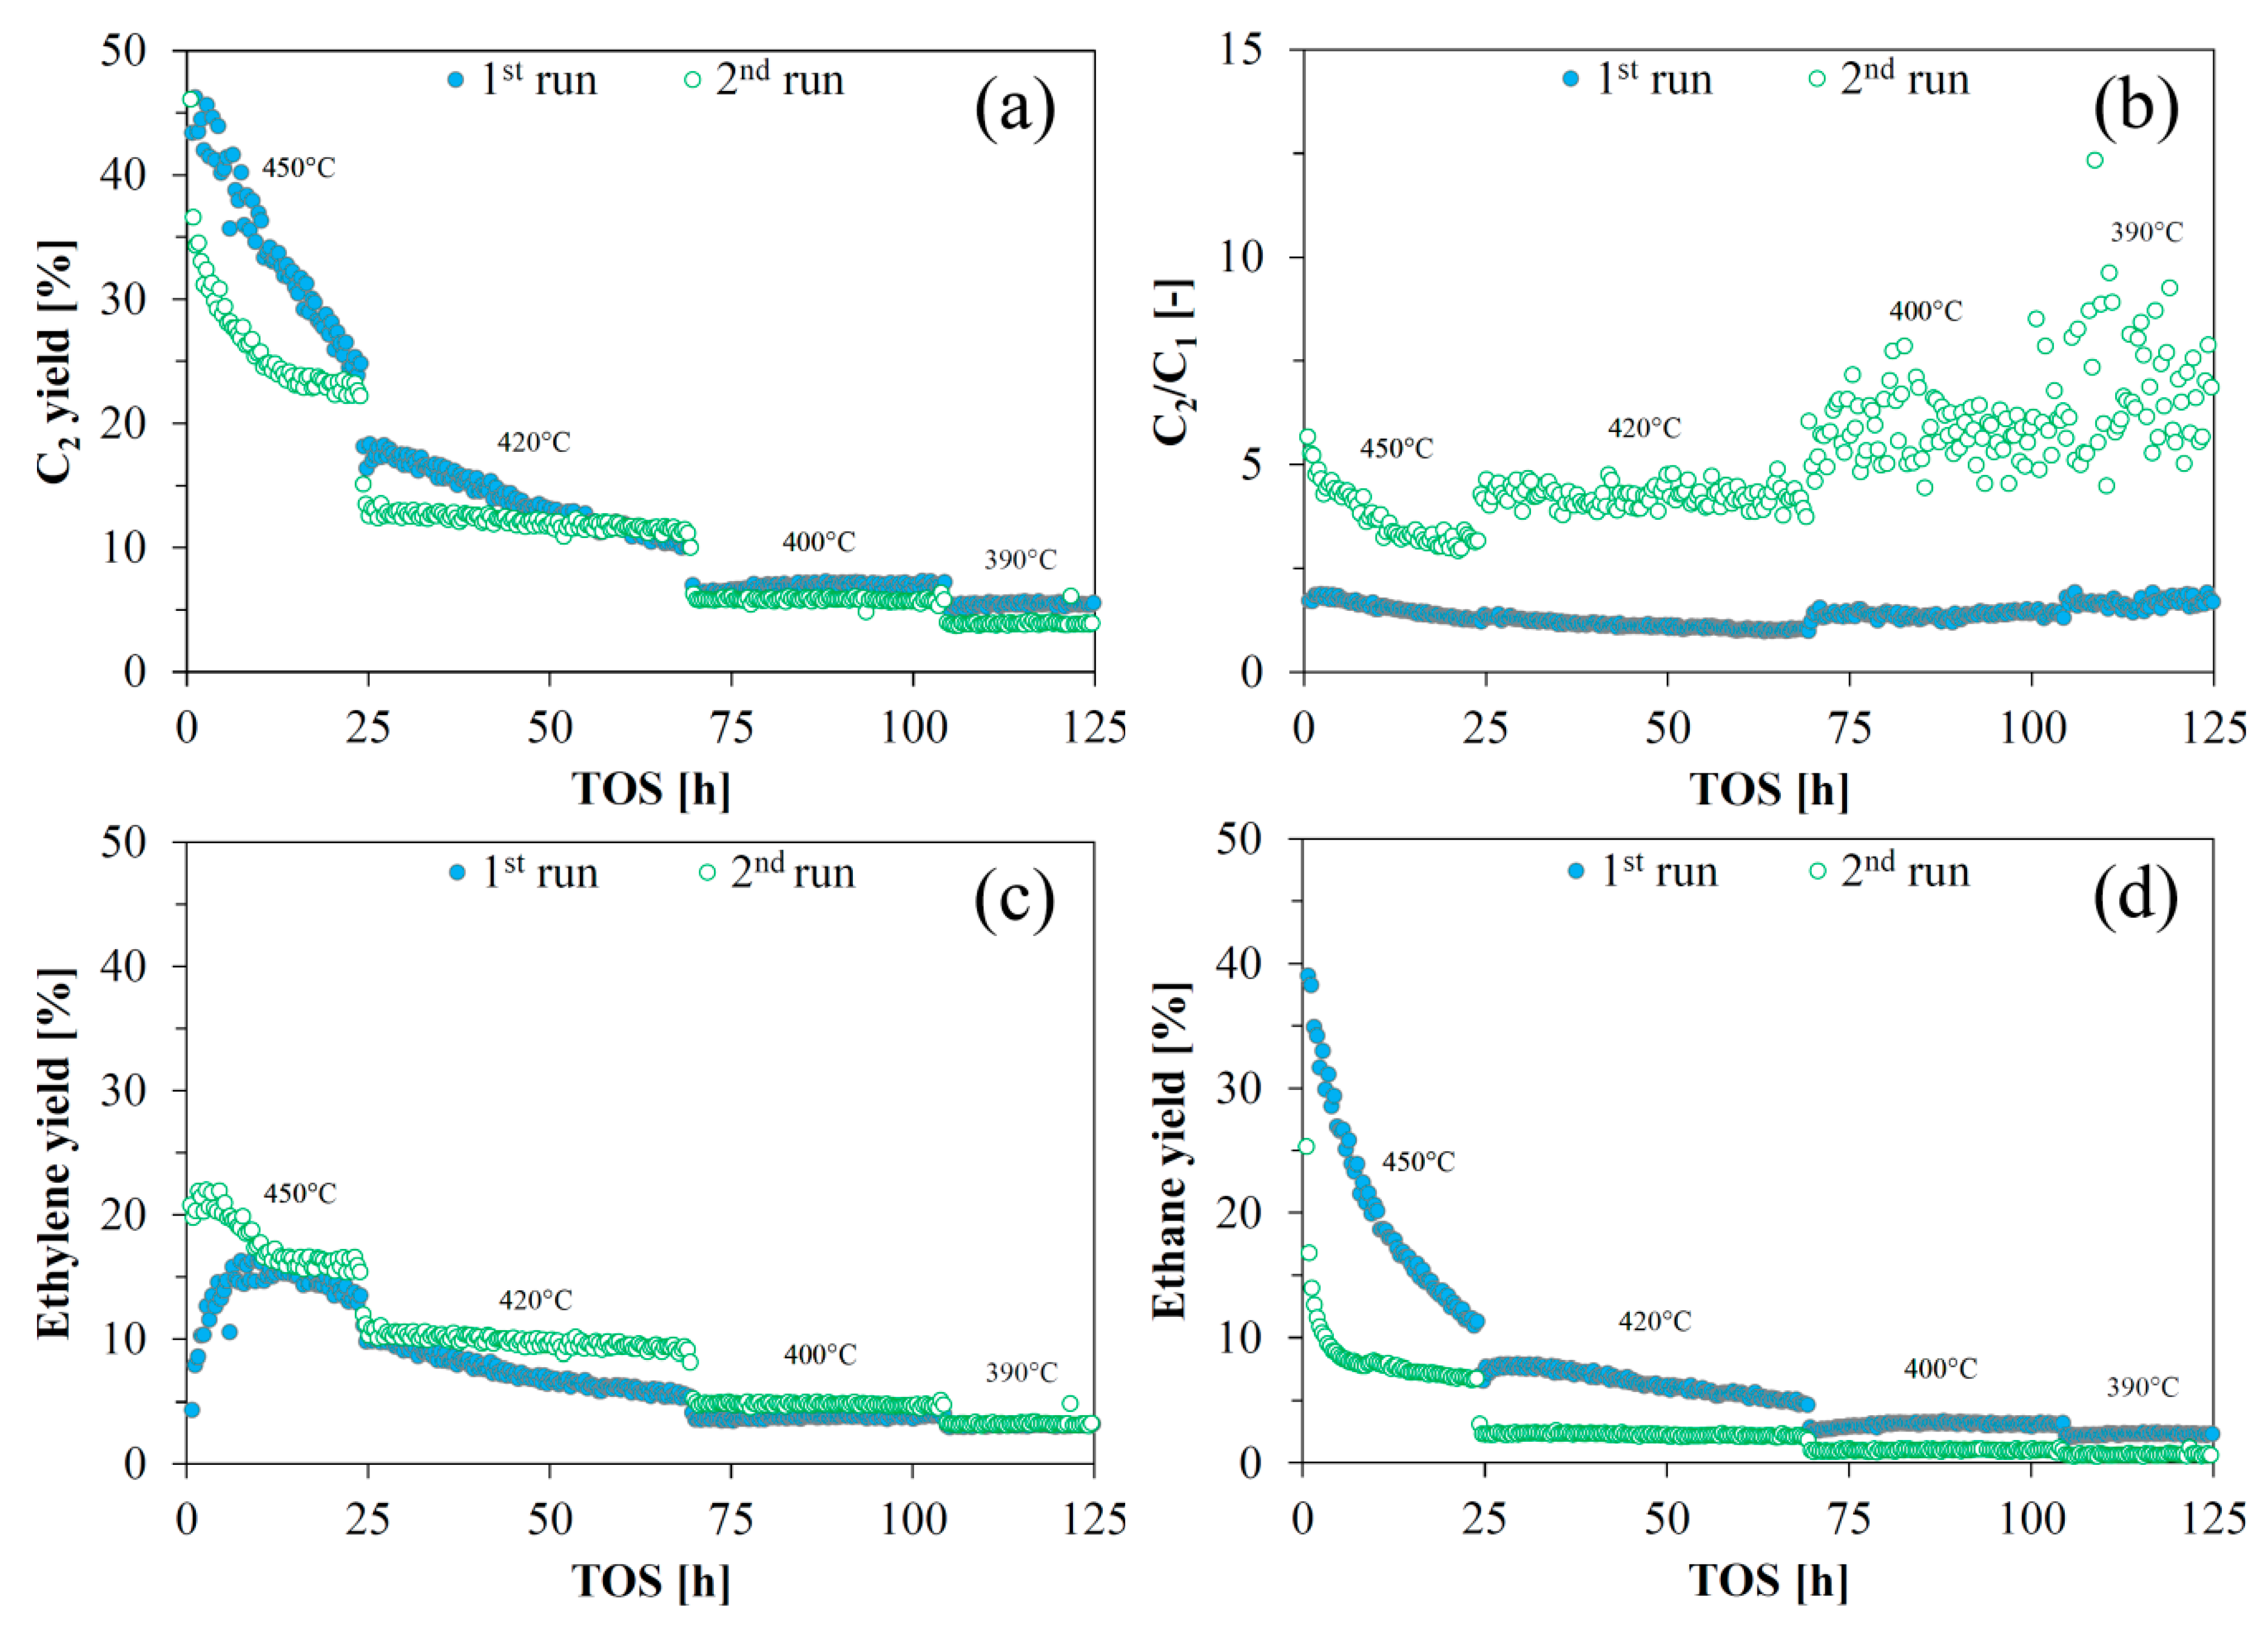
Overall, reactivation of the catalyst was possible, as the yield of deoxygenated C
2 species of the reactivated catalyst (second run) was similar to the yield of the fresh catalyst (first run). However, the reactivated catalyst showed a different rate of deactivation (especially at <50 h). After a period of around 50 h with deactivation, the C
2 yields from the first and second run were similar (
Figure 4a). The reactivated catalyst showed a different product selectivity with less cracking (
Figure 4b) and less hydrogenation (
Figure 4c,d). Hydrogenation activity was markedly lower for the reactivated catalyst. The reactivated catalyst’s poorer activity for ethylene glycol HDO was evidenced by the increase in activation energy for the initial dehydration/hydrogenation,
Ea,1a, from 96 to 141 kJ/mol, and by the decrease in the rate constant for hydrogenation,
k′2a,mean, from 248 × 10
−3 to 83 × 10
−3 L/(min·g) (
Table 1).
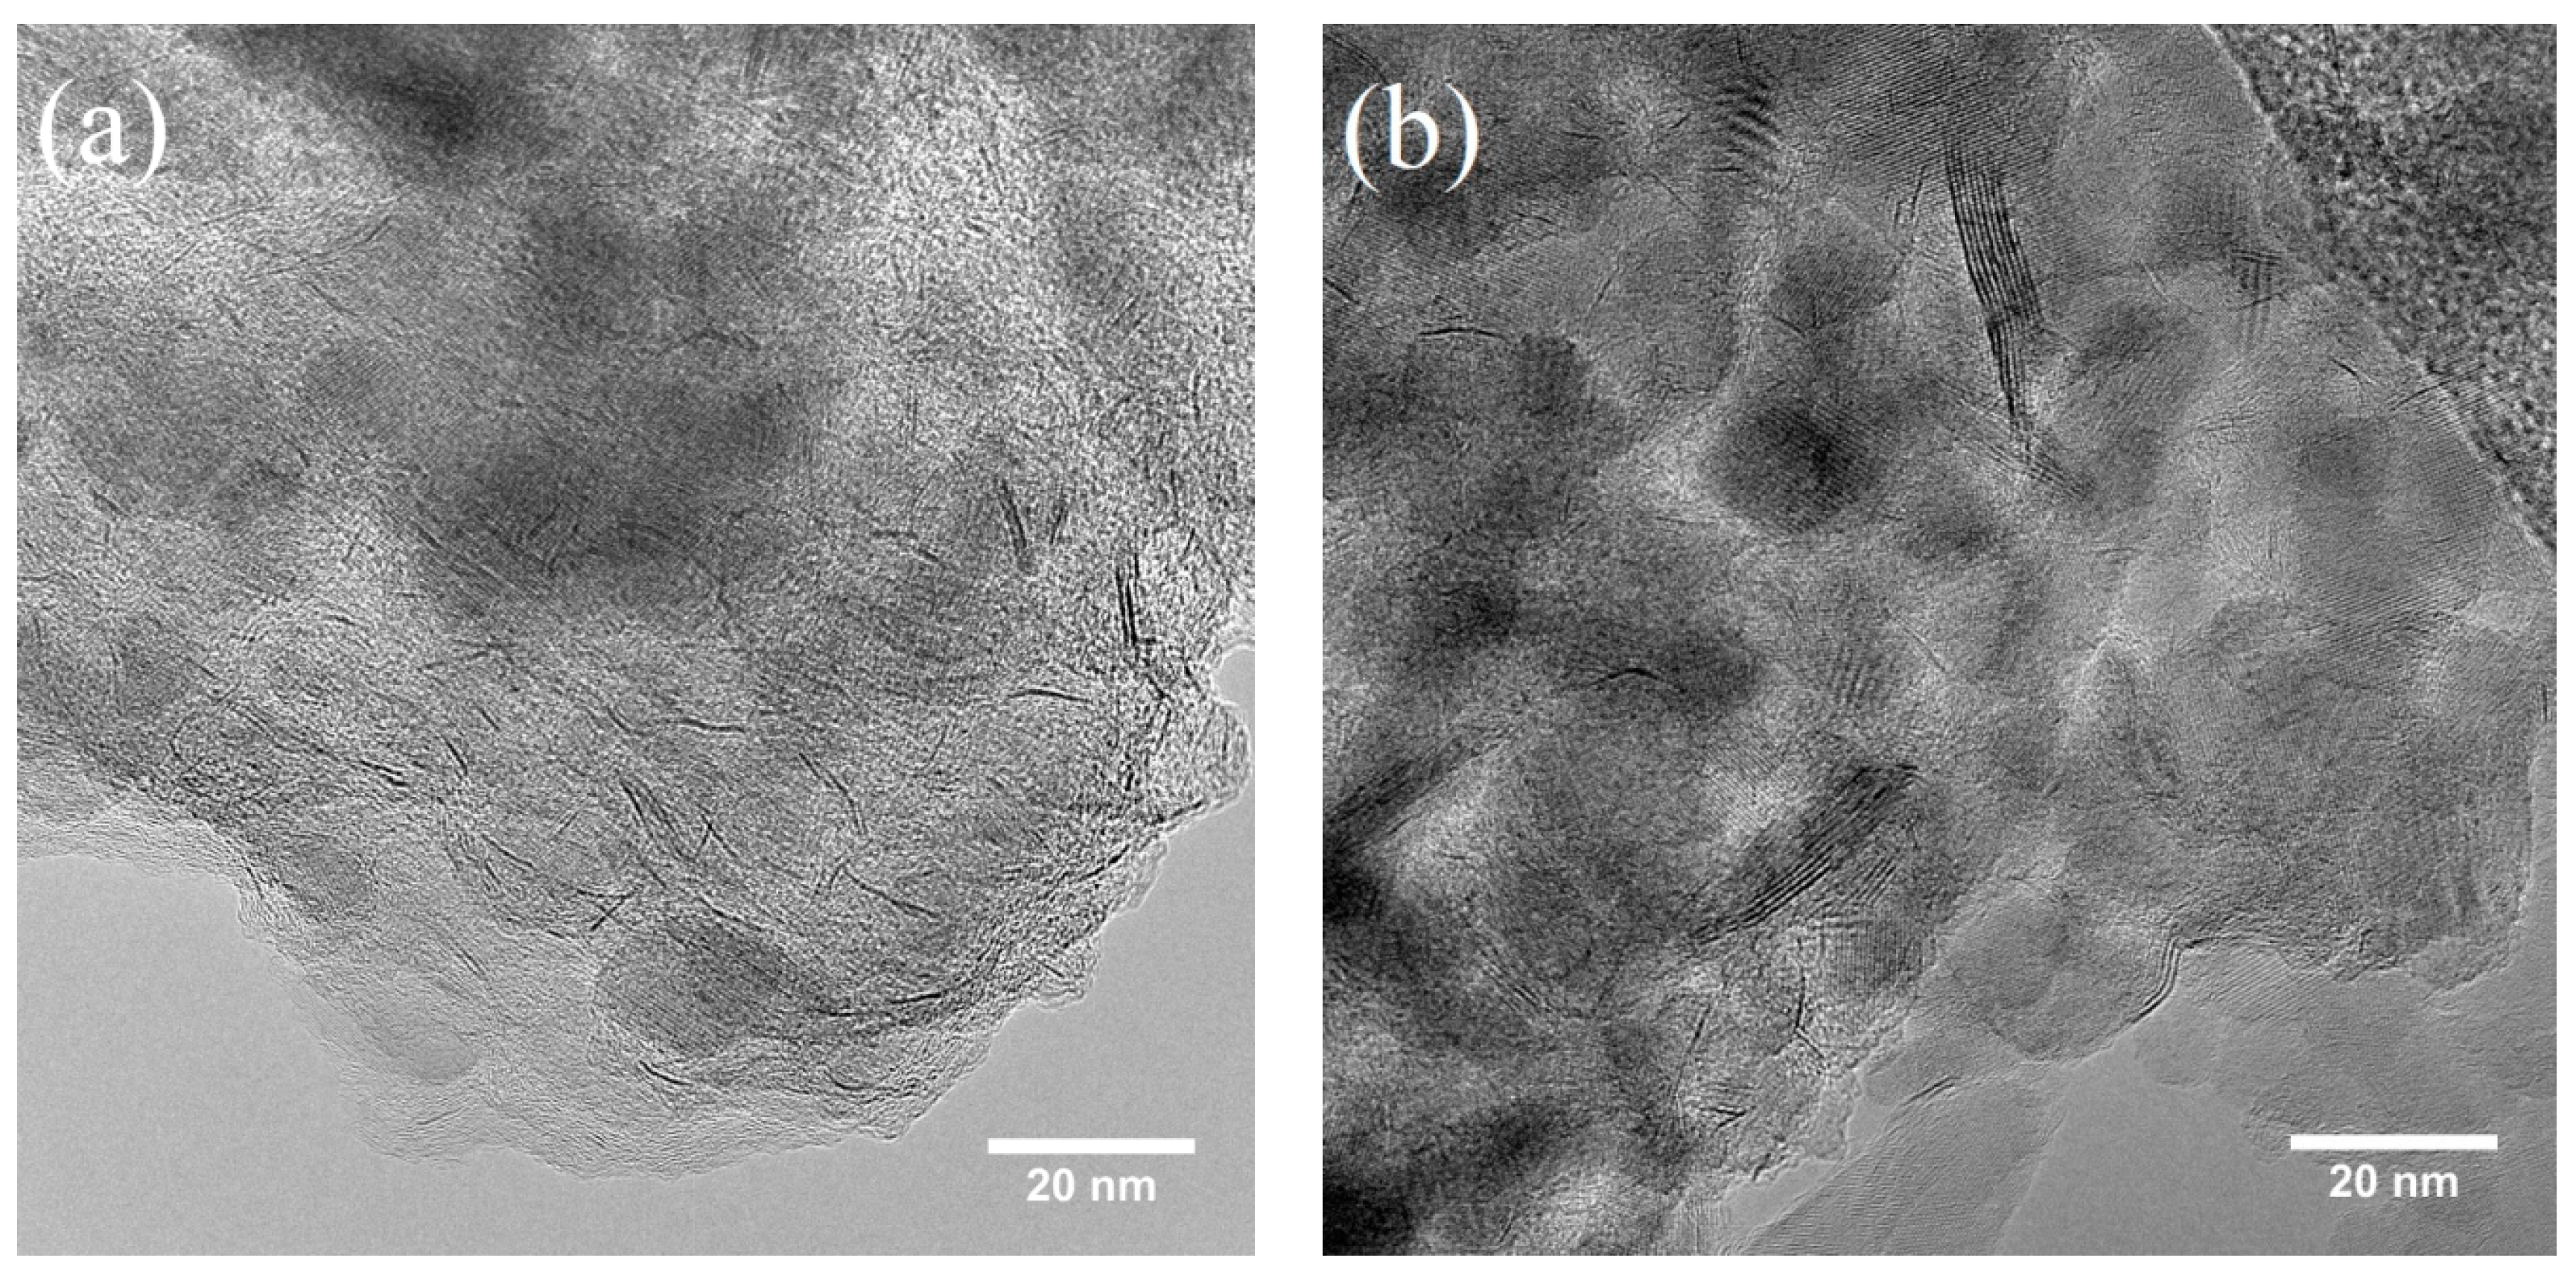
The size distribution of the active MoS
2 particles was obtained from analyses of TEM images (
Figure 5 and
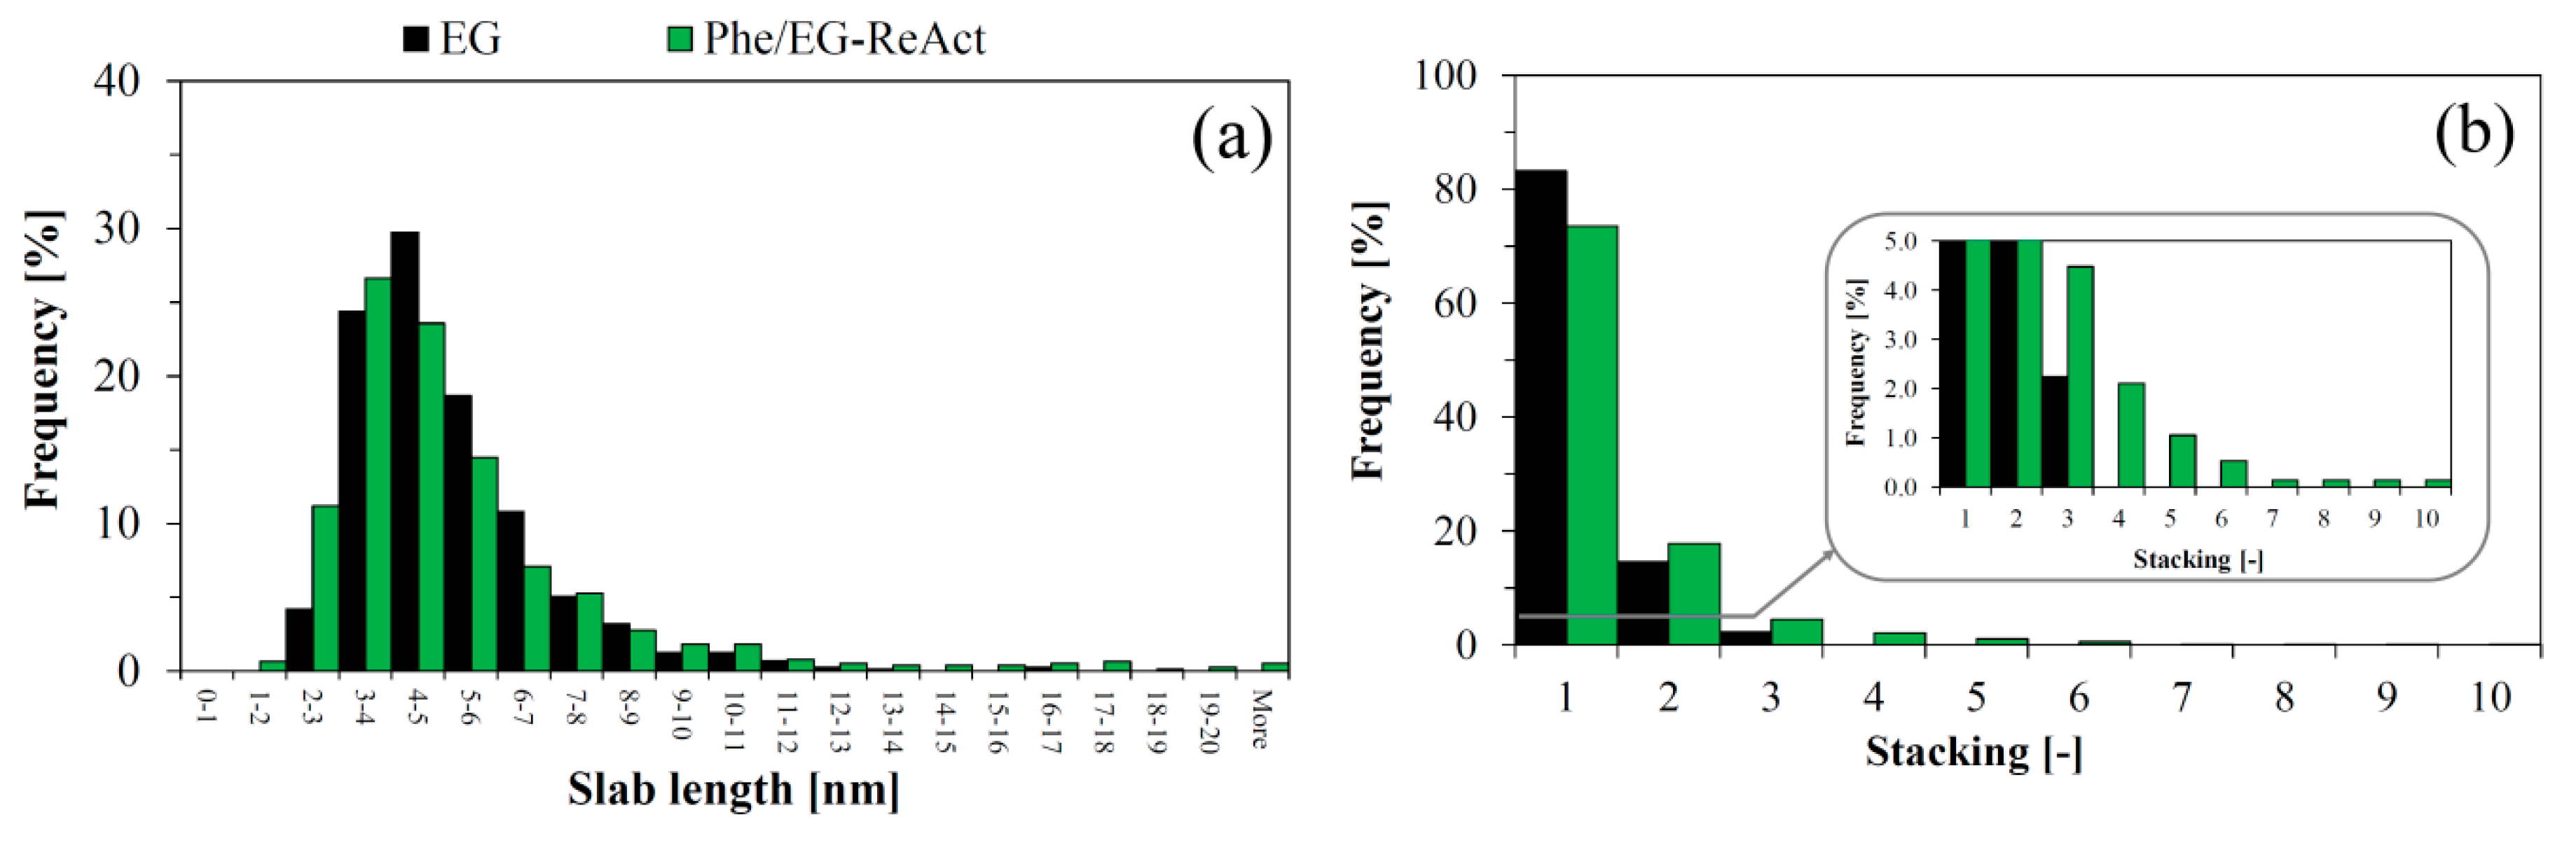
Figure 6) of the spent catalysts from the experiment with pure ethylene glycol (EG) and with the phenol/EG mixture including the reactivation step (Phe/EG-ReAct). The results indicate that some degree of sintering occurred during the reactivation process. In line with previous results [
19], the observed average length (
Figure 6a) and stacking (
Figure 6b) for both spent catalysts were 5.1–5.3 nm and 1.2–1.4 nm, respectively. The majority of the observed sulfide particles in the spent catalyst samples were distributed as short monolayer slabs. The maximum degree of stacking was 3 for the non-reactivated catalyst, while several multilayer slabs with stacking degrees of 4–10 were observed in the reactivated spent sample (
Figure 6b). These multilayer slabs were also longer than in the non-reactivated sample, as evidenced from the longer tail at >10 nm (
Figure 6a).
As a result of the apparent sintering during catalyst reactivation, the concentration of active edge sites and brim sites (present at the top layer) decreased, while the concentration of MoS2 present in inactive bulk and basal plane positions increased.
The composition of the catalysts from the EG and Phe/EG-ReAct experiments is shown in
Table 2. The molar Ni/Mo ratio was 0.3 (same as the fresh catalyst) in the non-reactivated spent catalyst from the EG experiment, whereas it had increased to 0.5 for the reactivated catalyst, indicating loss of Mo. MoO
3, which is formed during the initial oxidation stage of the regeneration, can be converted into volatile molybdenum hydroxy oxides in the presence of water [
27,
28]. Therefore, the oxidation conditions should be carefully controlled (low heating rate and high air flow) to limit the surface concentration of water formed during the combustion of carbonaceous materials from the catalyst. Especially the loss of brim sites along with the loss of Mo explains the loss of hydrogenation activity in the reactivated catalyst.
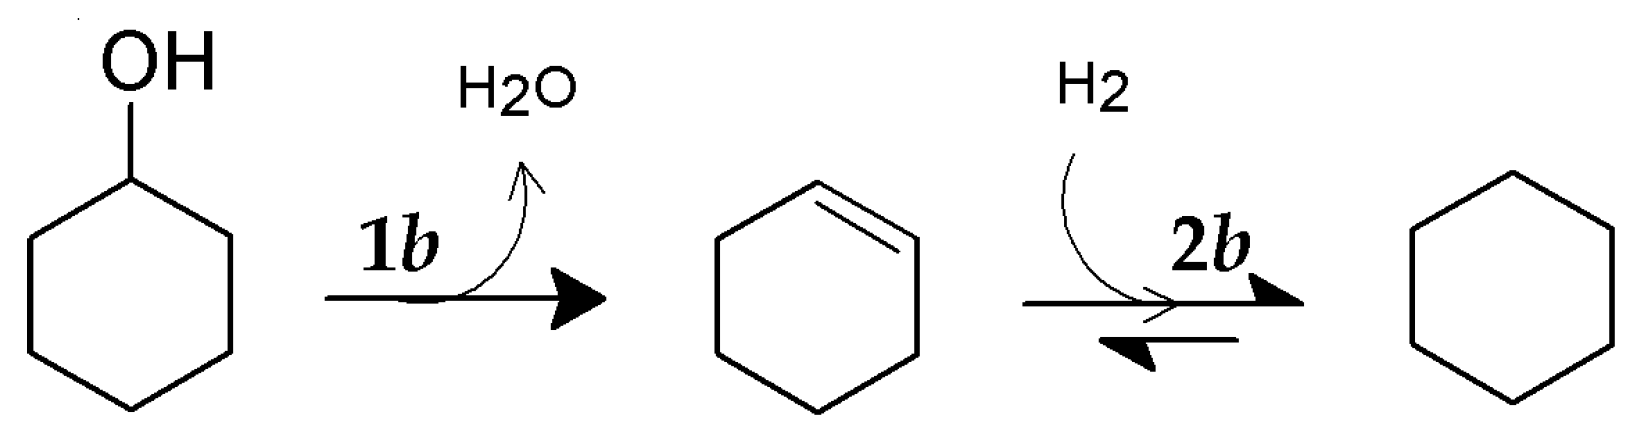
2.5. HDO of Cyclohexanol
HDO of cyclohexanol was performed on both the pure compound (Cyc) and as a cyclohexanol/ethylene glycol mixture (Cyc/EG), see
Figure 7.
Pure cyclohexanol was almost fully converted (X
Cyc ≥99.5%) during the entire duration of the activity test at 390–450 °C and a WHSV of 18 h
−1 (
Figure 7a). Cyclohexene and cyclohexane were the dominant products, only trace amounts of cyclohexanone were detected (not shown). The yield of cyclohexene was 60–80% and that of cyclohexane was 14–30%. There was an initial decrease in the yield of cyclohexane and increase in cyclohexene indicating some deactivation of hydrogenation activity as observed for the conversion of ethylene glycol. The first dehydration step of cyclohexanol into cyclohexene (reaction 1
b) was very fast with a conversion above 90% (
Table 3). The measured rate may, therefore, be affected by mass transfer limitations.
In the presence of ethylene glycol (
Figure 7b), a >90% conversion of cyclohexanol was initially obtained, decreasing to approximately 70% after 30–65 h on stream, where an approximate steady state was obtained at 413 °C. As the temperature was decreased to the set point of 400 °C, the conversion continued to decrease reaching 49% at 82 h on stream. Shortly after, setup issues forced termination of the experiment. The product composition from this experiment was comprised of cyclohexene, cyclohexane, cyclohexanone, and 1,4-dioxaspiro[4.5]decane (a ketal coupling product from cyclohexanone and ethylene glycol). The yield of HDO products were 4.5–16% cyclohexene and 0.7–2.5% cyclohexane at TOS >30 h. The yields of byproducts were significant: 5.7–11% 1,4-dioxaspiro[4.5]decane, and 6.8–19% cyclohexanone in the same time period.
As the conversion of cyclohexanol in the presence of ethylene glycol was performed at a four times higher residence time compared to the experiment with pure cyclohexanol, these results show that ethylene glycol inhibited the conversion of cyclohexanol significantly. This was also reflected by the rate constants (
Table 3). With ethylene glycol present in the feed, the rate constant,
k1b, decreased from ≥524 × 10
−3 L/(min·g) (independent on temperature) to 10–21 × 10
−3 L/(min·g), and there was a notable activation energy of 121 kJ/mol. This detrimental effect was explained by deactivation of acidic active sites by a competitive adsorption of ethylene glycol derived compounds (HDO intermediates and side products) as well as carbon deposition. The hydrogenation of cyclohexene was also affected by the presence of ethylene glycol, which caused the activation energy,
Ea,2b, to double, while the rate constant remained more constant (at the reference temperature of 395 °C). This could be caused by the competition for hydrogenation active sites.
As mentioned, the hydrogenation of ethylene (reaction 2
a) was the fastest step in ethylene glycol HDO. For pure cyclohexanol, the initial dehydration to cyclohexene was the fastest step with
k′2b/
k1b ≤0.1. This further indicates that the conversion of ethylene glycol and cyclohexanol takes place on different active sites. Full deoxygenation of cyclohexanol can occur on acid sites supplied by the support without interaction with the MoS
2 active phase, whereas ethylene glycol HDO depends on MoS
2 for hydrogenation of ethenol/acetaldehyde. The equilibrium of the reactions in
Scheme 2 is fully shifted towards cyclohexane and benzene (
Figure S6) at the applied reaction conditions. Cyclohexene is thermodynamically expected to occur in minute concentrations. Since benzene was not detected in the liquid product, and cyclohexene was a dominant product, hydrogenation/dehydrogenation activity was the limiting factor, possibly due to coking of Ni-MoS
2 active sites.
2.6. HDO of Phenol
Phenol, which was fed in a mixture with ethylene glycol, was not converted at the applied conditions over the sulfided NiMo catalyst. The only products detected in low yields from phenol were alkyl substituted phenols and coupling products (primarily 2-ethylphenol, 3-methylphenol, and benzofuran), which were ascribed to the catalytic activity of the support acid sites [
18]. These non-deoxygenated coupling products were mainly formed during the first 30 h on stream at a total phenol-based carbon yield of up to 12%. After 30 h, this yield was 0.4–3.7%.
The lack of ring hydrogenation could explain the lack of phenol conversion. A NiMo catalyst was chosen over a CoMo catalyst due to its known hydrogenation activity [
29,
30]. Ni-MoS
2 has been reported to promote phenol HDO by aromatic ring hydrogenation (HYD) prior to breakage of the C-O bond, whereas direct deoxygenation (DDO) can be performed with Co-MoS
2 [
31,
32,
33,
34]. Hydrogenation of the aromatic ring is however limited by thermodynamics (
Figures S6 and S7) and favored only at temperatures well below 300 °C. The temperature was therefore decreased to 280 °C (at 170–200 h) for the reactivated catalyst (Phe/EG-ReAct), based on the work of Mortensen et al. [
35], who reported ≈20–55% phenol conversion over a Ni-MoS
2/ZrO
2 catalyst tested in the same flow reactor setup for a TOS of 100 h at 280 °C, 100 bar, ≈283 vol ppm H
2S and a WHSV of 4.0 h
−1 of 50 g/L phenol in 1-octanol. No conversion of either ethylene glycol or phenol was however observed at 280 °C.
Mechanistic effects may have contributed significantly to the lack of ring hydrogenation. It has been proposed that HDO of phenolic species over Ni-MoS
2 requires a flat ring adsorption onto the slab surface [
33,
36], which facilitates ring hydrogenation. If most active sites were occupied by ethylene glycol, its derivatives, or coke, these species could sterically hinder flat ring adsorption of phenol. Ryymin et al. [
14] reported a slight suppression of methyl heptanoate HDO in the presence of phenol at 250 °C and 75 bar using a commercial NiMo/Al
2O
3 catalyst in a batch reactor at reaction times lower than 50 minutes. At the same time, they reported a notable inhibition of phenol HDO in the presence of methyl heptanoate during the entire reaction time of ≈4.5–5 h, and suggested that the inhibiting effect of the ester on phenol conversion was caused by a competition for active sites. This is in line with the findings of Boscagli et al. [
15], who showed that phenol HDO over Ni and Ru catalysts was strongly inhibited in the presence of a light phase pyrolysis oil, mainly containing cellulose derivatives. An additional possibility could be that the H
2S concentration, being a known inhibitor in phenol HDO [
32], was too high for phenol conversion in the current experiments.
2.7. HDO of Acetic Acid
The HDO of acetic acid was briefly tested at 450 °C with a feed of ≈0.06–0.13 mL/min acetic acid corresponding to 1.0–2.3 mmol/min. After 2 h on stream, a coke plug developed in the reactor inlet (above the catalyst bed), resulting in a pressure drop of 48 bar. This experiment clearly illustrated the issues of heating reactive oxygenates, which others also have faced when using bio-oil for HDO studies [
37,
38,
39]. The short TOS resulted in the gas product yields summarized in
Table 4, which compares the yields with those from the conversion of pure ethylene glycol at similar conditions.
Acetic acid can undergo different reactions such as decarboxylation to form CH
4 and CO
2, decarbonylation (of two acetic acid molecules) to form ethylene, CO, and water, and ketonization (of two acetic acid molecules) to form acetone, CO
2, and water [
40]. It is also possible that acetic acid can be converted by HDO to acetaldehyde and water, allowing for similar reactions as for ethylene glycol. The formation of acetone could be the reason for the high yield of propane and propylene formed from acetic acid compared to ethylene glycol, which indicated the higher propensity for carboxylic acids to polymerize. The ethane/ethylene ratio was higher (at ≈10) for acetic acid HDO compared to ethylene glycol HDO (at ≈3), which could be due to differences in the mechanism for ethylene formation. The higher yield of C
1 and coke from acetic acid HDO also indicated a higher degree of cracking of acetic acid compared to ethylene glycol, which was partly caused by an up to 13 °C higher reaction temperature (
Figure S3).
2.8. Investigation of Catalyst Deactivation
In order to gain more insight into the deactivation routes, the spent catalysts were investigated in more detail. The composition of spent catalysts from several experiments is shown in
Table 5 and it should be noted that the Ni/Mo ratio was constant at 0.3 indicating no loss of Mo or Ni (see also
Table 2).
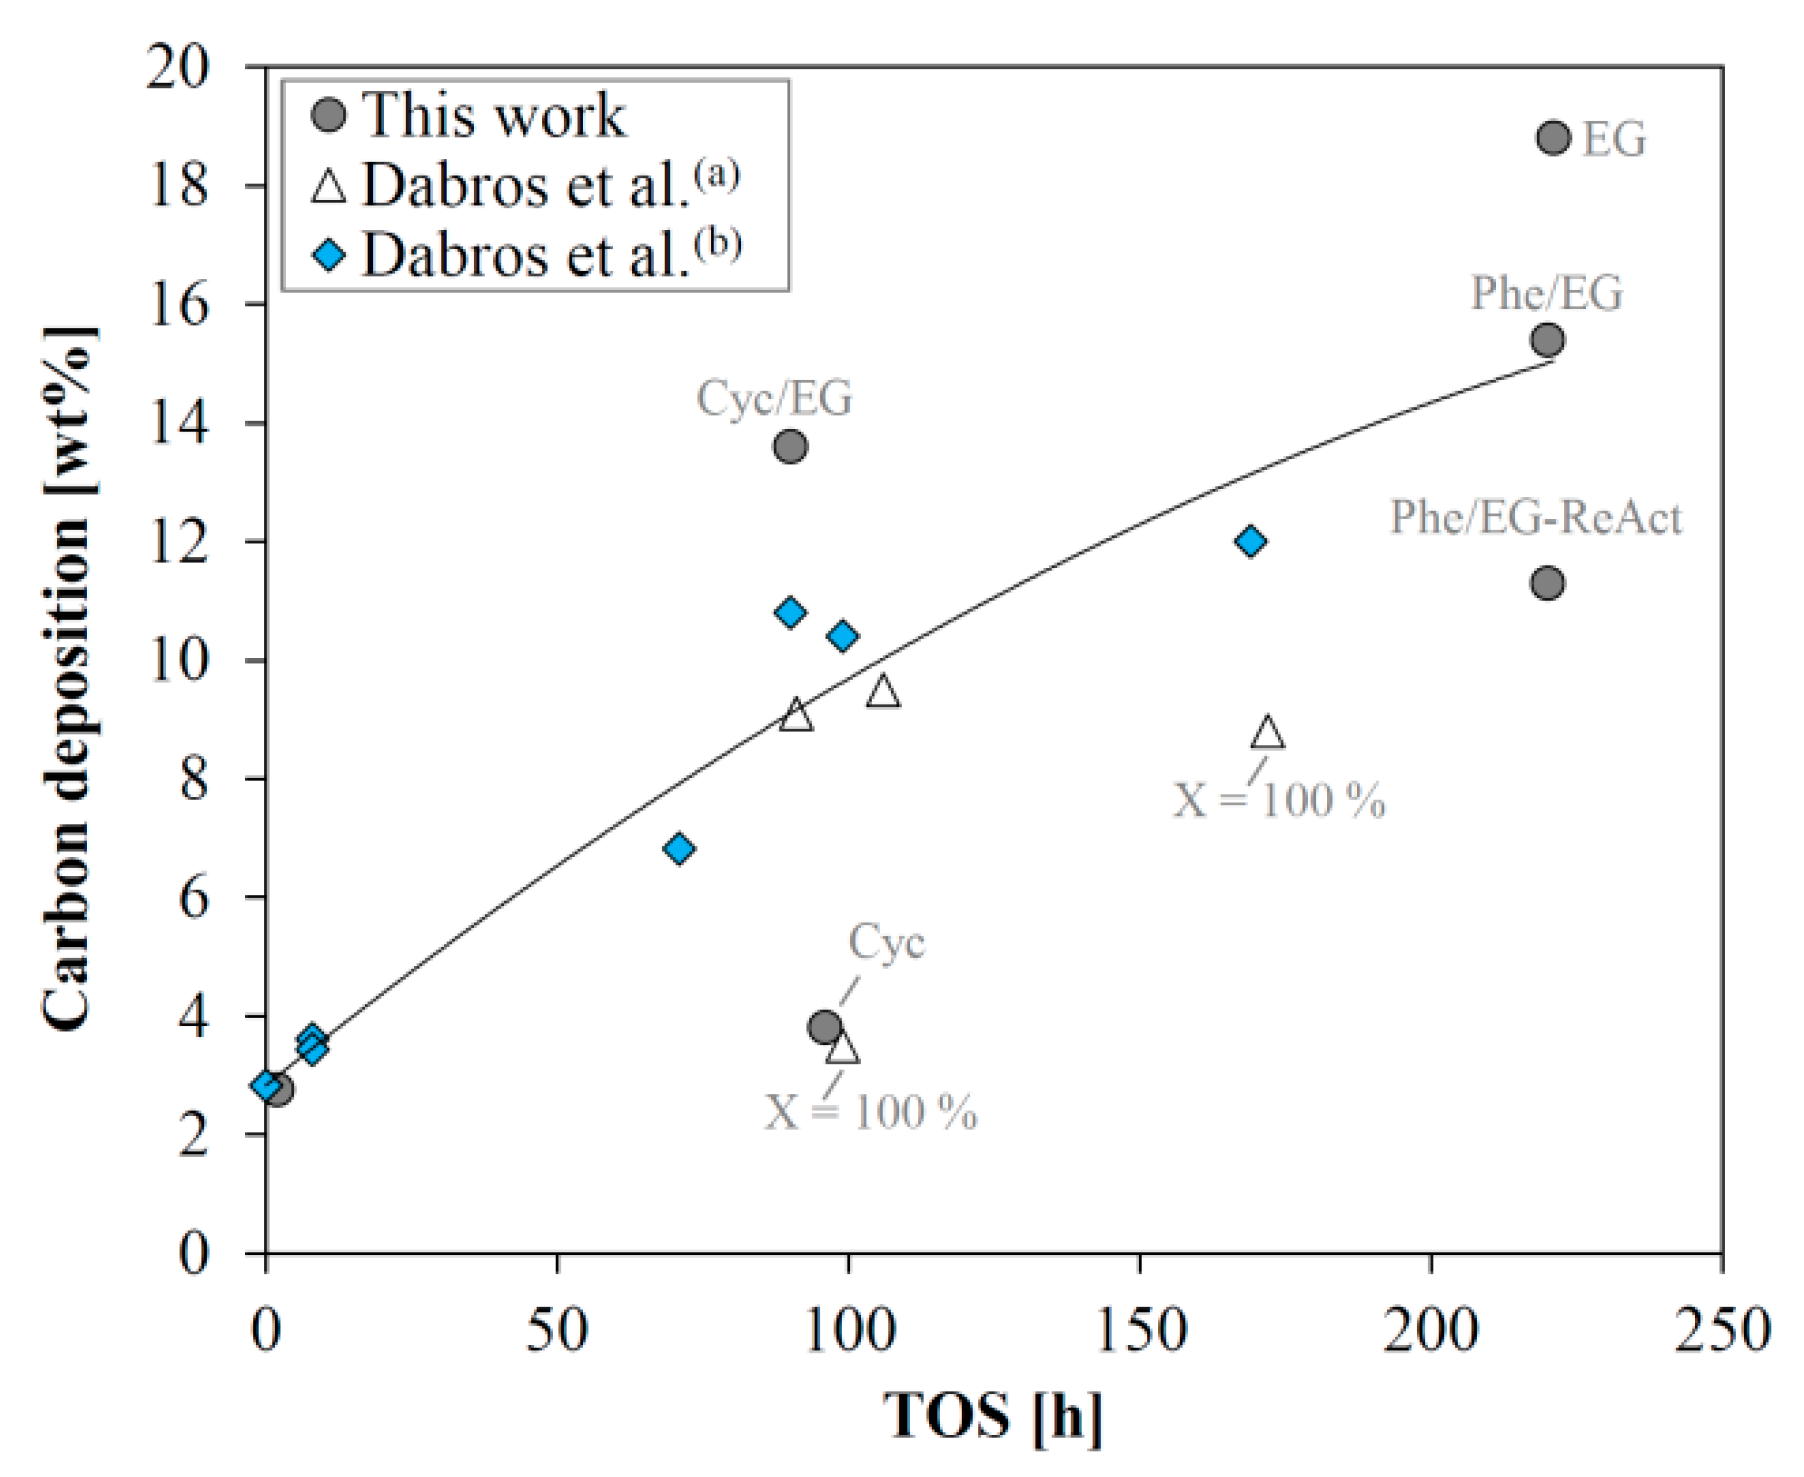
The amount of carbon deposited strongly depends on the time on stream (
Figure 8). In line with previous reports [
18,
19], this is probably the main cause of deactivation. The severe carbon deposition is partly caused by a very high space velocity, which was chosen to facilitate steady state activity with a conversion below 100%. If the liquid hourly space velocity (LHSV) is decreased to obtain full conversion, the carbon deposition is expected to occur at a lower rate than observed here, based on the results from previous work [
18]. The high amount of carbon (13.6 wt %) deposited on the catalyst from the experiment with the cyclohexanol/ethylene glycol mixture, was affected by the lack of N
2 flushing at reaction temperature, as the experiment was terminated abruptly due to equipment malfunction.
TEM (
Figure S8) indicated that the deposited carbon was present throughout the spent catalysts, which is in agreement with previous findings [
41]. The carbon appeared crystalline in agreement with Raman spectroscopy data on similar catalysts [
18]. The lattice distances were analyzed by performing fast Fourier transforms of several crystalline areas in the TEM images of spent catalysts, which showed the presence of the MgAl
2O
4 support, and indicated the presence of crystalline carbon as well.

 ,
, 


