Abstract
This work investigated the microstructural effect on stretch flangeability of ferrite–martensite dual-phase (DP) steels. Three types of DP steels with various martensitic structures were prepared for the research: fibrous martensite in water-quenched (WQ) sample, chained martensite in air-quenched (AQ) sample, and coarse martensite in step-quenched (SQ) sample. The WQ specimen exhibited the highest mechanical strength and hole expansion ratio compared to the AQ and SQ samples despite their similar fraction of martensite. Such a result was explained in view of uniform distribution of fine martensite and high density of geometrically necessary dislocations in the WQ specimen. Meanwhile, most cracks initiated at either rolling or transverse direction during the stretch flangeability test regardless of the martensitic morphology. It was attributed to the highest average normal anisotropy in the direction of 45° to rolling direction.
1. Introduction
Dual-phase (DP) steels composed of hard martensitic particles and soft ferritic matrix have received great attention for automotive applications due to their good combination of strength and elongation [1]. The mechanical properties of ferrite–martensite DP steels strongly depend on the volume fraction and morphology (e.g., size, shape, distribution, continuity) of martensitic constituent. Kim and Thomas [2] compared uniaxial tensile properties of DP steels with various martensitic microstructures, such as fine fibrous martensite induced by intermediate quenching, fine globular martensite by intercritical annealing, and coarse martensite by step quenching. In their work, the tensile strength increased with increasing fraction of martensite following the rule of mixture. The coarse martensitic structure exhibited the lowest elongation due to the occurrence of cleavage fracture in the ferritic matrix. Chang and Preban [3] described tensile properties of DP steel in terms of a ferritic grain size and martensitic volume fraction. Mediratta et al. [4] ascribed the fine dispersion of martensite to homogeneous deformation during low-cycle fatigue tests. Molaei and Ekrami [5] observed the higher fatigue strength of DP steels with fibrous martensite (i.e., the structure composed of parallel and narrow laths [6]) in comparison to the alloy with networked martensite (i.e., the structure connected through a phase interface [6]) due to the tortuous crack propagation in the former microstructure. According to the work of Suh et al. [7], microcracks uniformly propagate in the intermediate-quenched microstructure along the longitudinal and transverse directions during uniaxial tensile tests, whereas strain localization gives rise to poor ductility in the step-quenched microstructure. Kim and Lee [8] reported the change of fracture mode based on the martensitic structure under dynamic loading condition. Das and Chattopadhyay [9] confirmed the lowest yield ratio and highest work-hardening rate in the intermediate-quenched microstructure. Park et al. [10], however, reported a low drawability after this quenching process due to easy initiation and propagation of cracks at uniformly distributed ferrite–martensite interfaces.
Various studies have investigated tensile and fracture properties of DP steels, including the literature mentioned above. In contrast, stretch flangeability of DP steels has received less attention in spite of its importance in the automotive industry, especially for a wheel-forming process where punched holes are expanded to fabricate a designed wheel. Hole expansion ratio (HER) of steel plate is measured to evaluate stretch flangeability in general. Researchers have tried to predict the stretch flangeability of a material using other mechanical properties. For example, HER and ultimate tensile strength (UTS) were reported to follow the inversely proportional relation [11,12]. Comstock et al. [13] concluded that HER was proportional to average normal anisotropy of sheet materials. However, these previous works focused on relatively indirect methods (e.g., regression analysis) to study stretch flangeability of DP steel.
The direct investigation of microstructural influence on stretch flangeability has rarely attracted attention. Yoon et al. [14] recently clarified the relationship between stretch flangeability and microstructural features of ultrahigh-strength DP steel. Although their study provided a meaningful insight for the academia, they investigated only one type of martensitic morphology. There still has been no study focusing on the effect of extensive microstructural factors (e.g., the martensitic morphology) on the stretch flangeability of DP steels. Therefore, the present study investigates such an issue using three types of DP steels possessing totally different martensitic morphologies. The results demonstrated a peculiar tendency that was inconsistent with the previous conclusions. Such a discrepancy was explained by adopting a constitutive analysis.
2. Materials and Methods
DP590 steel was hot-rolled to a thickness of 3 mm for the present study. The material was austenitized at 1000 °C for 1 h, and then processed with three different cooling methods in order to change the martensitic structure. First, sections of the austenitized samples were water-quenched, and then soaked in a furnace at 785 °C for 1 h. Second, sections were air-quenched from the austenitizing temperature, followed by the same heat treatment of intercritical annealing. The final sections were cooled from the austenitizing temperature to 750 °C and then held for 1 h. These samples are denoted as water-quenched (WQ), air-quenched (AQ), and step-quenched (SQ) specimens, respectively.
To characterize microstructure, mirror-polished samples were etched in 2% nital solution and then analyzed using optical microscope (OM) and scanning electron microscope (SEM) in three planes: rolling direction–normal direction (RD-ND) plane, rolling direction–transverse direction (RD-TD) plane, and transverse direction–normal direction (TD-ND) plane. Meanwhile, kernel average misorientation map was obtained using an electron backscatter diffraction (EBSD) analysis. The specimens for this analysis were prepared by electropolishing at 30 V in mixed solution of 95% acetic acid and 5% perchloric acid.
Uniaxial tensile tests were conducted with dog-bone-shaped specimens at constant crosshead speed with an initial strain rate of 5 × 10⁻³ s−1 using a hydraulic mechanical testing machine. The samples were deformed along RD. The normal anisotropy was calculated by measuring the displacement fields on the specimen surface using the digital image correlation technique. Two 2448 × 2048 pixels 14-bit charge coupled device cameras were used to measure the stain along RD and TD simultaneously. Hardness of constituent phases was measured using the nanoindentation method with a Berkovich-type diamond tip. The indentation was performed at a tip speed of approximately 10−5 mm∙s−1 to a depth of 2 μm of the etched specimens. The dwell time was 10 s at the peak load.
The hole expansion test was performed using 90 mm × 90 mm × 1.7 mm specimens with a hole 10 mm in diameter machined at the center. An Erichsen machine equipped with 60° conical punch was used to expand the center hole until the observation of the first through-thickness crack at the hole edge. Specimen holding force was 400 kN and punch speed was 0.25 mm∙s−1. The tests were repeated five times for each material for data reproducibility. The fracture surface of each specimen after the hole-expansion test was investigated by SEM.
3. Results
Table 1 summarizes the microstructural and mechanical data of the investigated DP steels. Although the volume fraction of martensite was comparable among the specimens, the cooling rate exerted a significant influence on the other microstructural characteristics. This is consistent with the OM micrographs of the investigated steels (Figure 1). The water quenching from the austenitizing temperature (i.e., 1000 °C) gave rise to full martensitic microstructure, which was then decomposed into ferrite and austenite during the intercritical annealing. The austenite was transformed into martensite again in the second water quenching from 785 °C, resulting in the fibrous martensitic structure for the WQ specimen (Figure 1a). Meanwhile, austenite transformed into ferrite and pearlite during the cooling from 1000 °C in the ambient atmosphere; the ferrite was formed in the prior austenite grains, while the pearlite preferentially nucleated at the prior austenite grain boundaries. The pearlite was transformed into austenite and then martensite through the subsequent intercritical annealing and water quenching processes. As a result, the chained martensitic structure was formed in the AQ specimen (Figure 1b). The SQ specimen showed the coarse martensite with the largest size of phase constituents (i.e., 19.6 μm). In addition, the specimen exhibited an inhomogeneous distribution of ferrite and martensite in RD-ND and TD-ND planes (Figure 1c).

Table 1.
Microstructural parameters and mechanical properties of dual-phase (DP) steel specimens.
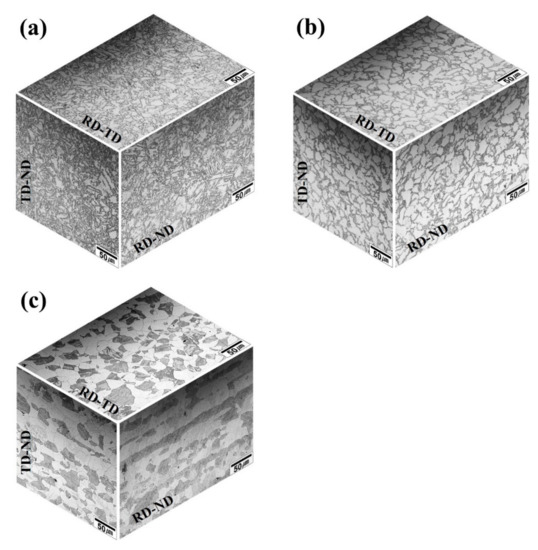
Figure 1.
Optical microscope (OM) image of the investigated DP steels in three different planes. (a) WQ specimen, (b) AQ specimen, and (c) SQ specimen.
The investigated specimens showed typical mechanical features of DP steels including continuous yielding and high strain-hardening rate (Figure 2). Although the elongation to failure (EL) showed no significant difference, yield strength (YS) and UTS were strongly affected by the cooling methods and resultant microstructures as summarized in Table 1. The WQ specimen exhibited the highest strengths, while the SQ specimen possessed the lowest values in spite of the comparable volume fraction of martensite.
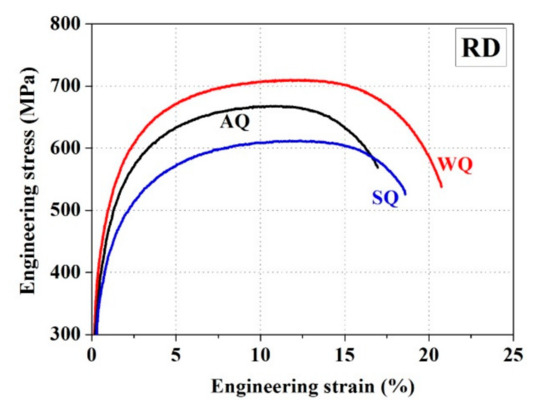
Figure 2.
Engineering stress–strain curve for the investigated DP steels measured along RD.
HER values (λ) were determined from five repetitive tests using the following equation:
where h0 of 10 mm is the initial hole diameter and h1 is the final hole diameter immediately after the initiation of through-thickness crack. Previous works reported the inversely proportional HER–UTS relation, as remarked in Section 1. However, the present results showed the direct proportion between the two properties; the WQ specimen exhibited the highest HER value as well as UTS among the investigated steels, followed by the AQ and SQ specimens (Figure 3). Such a unique tendency will be discussed further in Section 4.
λ = (h1 − h0)/h0
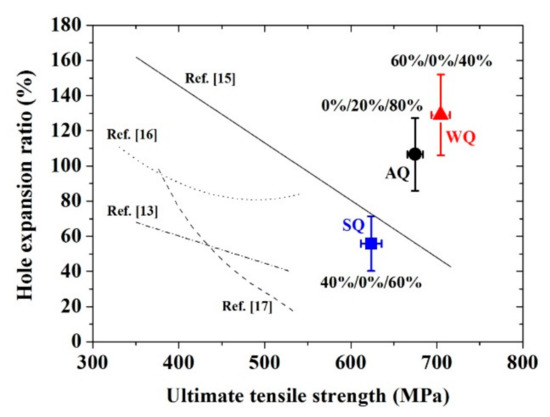
Figure 3.
HER–UTS relation of DP steels in the present study as well as the literature. The number in percent indicates the probability of through-thickness crack formed along RD, 45° to RD, and TD, respectively.
Average normal anisotropy (rm) was determined as follows:
where r0, r45, and r90 indicate the normal anisotropy of RD, 45° to RD, and TD, respectively. It should be noted that the WQ and AQ specimens showed similar average normal anisotropy, even though they exhibited the different HER values proportional to their UTS (Table 1). The SQ specimen showed the lowest average normal anisotropy due to the inhomogeneous distribution of ferrite and martensite. With respect to the directions, the highest normal anisotropy was the value measured in the direction of 45° to RD (i.e., r45) regardless of martensitic morphology. The high r45 values indicate the resistance to thinning under deformation in the direction of 45° to RD [12], suggesting the retarded necking and suppressed initiation of through-thickness crack during hole expansion. Indeed, 93% of cracks were initiated either at RD or TD direction that possessed the low normal anisotropy (Figure 3).
rm = (r0 + 2 r45 + r90)/4
4. Discussion
Mechanical strength of DP steel is generally explained in terms of the rule of mixture of ferrite and martensite, because the property increases with increasing fraction of martensitic phase [2]. However, it was shown in this work that the WQ specimen possessed the highest YS and UTS in spite of the similar volume fraction of martensite among the investigated alloys, implying that other factors contributed to the mechanical strength. The yielding of DP steels preferentially occurs in soft ferritic phase rather than hard martensite. Therefore, YS of the investigated DP steels can be analyzed using the following equations with microstructural parameters of ferritic phase [15]:
where σ0 (=50 MPa) is the lattice friction stress, σs is the solid-solution hardening, σgb is the grain-boundary hardening, σdisl is the dislocation hardening, and δr is the factor for residual-stress effects. G (=80 GPa) is the shear modulus, v is the Poisson’s ratio, w is the dislocation width, and b (=2.5 × 10⁻¹⁰ m) is the Burger’s vector. [wt.%X] indicates the mass percentage of element X, among which [wt.%C] was assumed to be the supersaturated carbon content in ferrite at 770 °C [16]. ky (=0.55 MPa· m0.5) is a Hall–Petch coefficient for high-strength low-alloy steels [16], α (=0.33) is a material constant, df is the average ferrite grain size, M (=3) is the Taylor factor, ρ is the dislocation density in ferritic phase, fM is the volume fraction of martensite, and ff is the volume fraction of ferrite.
YS = [σ02 + σs2 + σgb2 + σdisl2]0.5 − δr
σ0 = [2G/(1 − ν)] exp(−2πw/b)
σs = 4560[wt.%C] + 83[wt.%Si] + 37[wt.%Mn] + 60[wt.%Cr]
σgb = kydf−0.5
σdisl = αMGbρ0.5
δr = 8fM 2/ ff 2
Table 2 summarizes the hardening coefficients of the investigated materials, attributing the difference in YS to two factors: grain-boundary hardening and dislocation hardening. Mechanical properties of DP steel is indeed directly affected by the grain size of ferritic phase as well as the volume fraction of martensite [3]. The finest ferritic grains in the WQ specimen led to the significant Hall–Petch strengthening. In addition, the WQ specimen possessed the highest dislocation hardening; this hardening constituent was determined from the measured YS and the other estimated constituents (i.e., σ0, σs, σgb, and δr). Ferritic grains are plastically deformed due to the volume expansion of martensite during the martensitic transformation [17]. This gives rise to the formation of geometrically necessary dislocations (GNDs) in the ferritic phase to maintain lattice continuity at ferrite–martensite interfaces [18]. As a result, dislocation density in the vicinity of the interface is higher than that in a ferritic grain. Kernel average misorientation maps demonstrate such a tendency obviously (Figure 4). The SQ specimen with the lowest fraction of ferrite–martensite interfaces exhibited the radical change of dislocation density. The WQ specimen, however, showed uniform distribution of high dislocation density due to the finely distributed martensite. Calcagnotto et al. [19] also reported consistent results where a dislocation density was measured to be 2.5 × 10¹³ m−2 in a ferritic grain and 2.5 × 10¹⁴ m−2 in ferritic area near the ferrite–martensite interface. In conclusion, the uniformly distributed fine martensite resulted in high GNDs and resultant dislocation hardening in the WQ specimen.
Table 2.
Hardening constituents in the constitutive model and calculated dislocation density in ferritic phase.
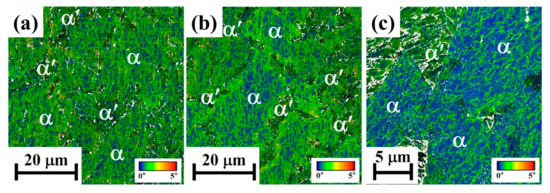
Figure 4.
Kernel average misorientation maps for (a) WQ specimen, (b) AQ specimen, and (c) SQ specimen; 0° and 5° are set to be the minimum and maximum misorientation angles, respectively.
A constitutive analysis of strain-hardening behavior provided further insight into the contribution of dislocation hardening to plastic deformation. Three approaches have been commonly used to describe strain hardening of materials: the Hollomon analysis [20], the Crussard–Jaoul (C-J) analysis [21] based on the Ludwik equation [22], and the modified C-J analysis [9,23] on the basis of the Swift equation [24]. This work adopted the modified C-J analysis as this method can clearly explain the hardening behavior of DP steels with various microstructural parameters [23]. The modified C-J analysis is expressed as follows:
where m is the strain-hardening exponent and ks is a material constant.
ln(dσ/dε) = (1 − m)lnσ − ln(ksm)
The investigated DP steels showed the two-stage strain-hardening behavior where the slope changed at a transition strain (Figure 5). In DP steel, plastic deformation is accommodated in soft ferrite first (stage I) and then the hard martensite starts deforming plastically with ferritic phase (stage II) [23,25]. The WQ specimen exhibited the highest strain-hardening exponent at stage I (mI): 4.2 for WQ, 3.8 for AQ, and 2.8 for SQ. This implies the largest strain hardening in the ferritic phase due to high density of GNDs. This is consistent with the results as aforementioned in Table 2. The SQ specimen possessed the doubled transition strain (i.e., 2.9%) in comparison to the values of the other two materials (1.5% for WQ and 1.4% for AQ). This is attributed to the low density of GNDs in ferritic grains of the SQ specimen that required a higher amount of plastic deformation to reach the transition strain [23]. In contrast to the mI values, the investigated materials exhibited comparable results with respect to the strain-hardening exponent at stage II (mII): 7.0 for WQ, 6.8 for AQ, and 6.7 for SQ. Tomita and Okabayashi [25] compared experimentally obtained mII values with the calculation based on the rule of mixture. Interestingly, these values showed a good agreement even though the authors did not consider a martensitic morphology. Son et al. [23] reported comparable mII values between coarse- and ultrafine-grained DP steels. Therefore, mII value of DP steel is determined by phase compositions and mechanical properties of each phase constituent, rather than the martensitic morphology and size, which provides a good explanation for the similar mII values confirmed in WQ, AQ, and SQ specimens.
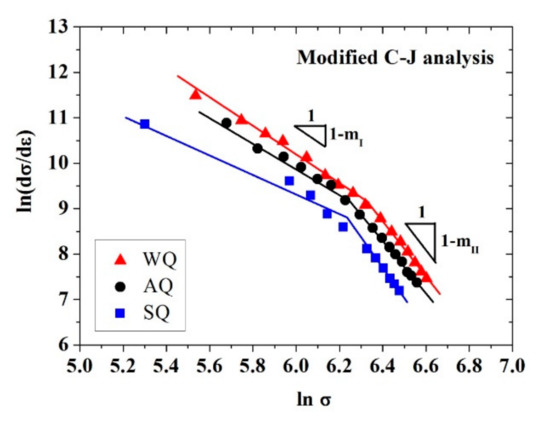
Figure 5.
The modified C-J analysis of the investigated DP steels.
It is necessary to consider the influence of sample preparation method prior to discussing the effect of microstructure on HER results. The center hole of HER specimen can be fabricated by either punching or machining process. The interaction between tool and material generates a number of defects on the sheared edge and microcracks in the vicinity of the hole during the punching process, which considerably degrades the stretch flangeability [13,26]. The center hole of HER specimens was fabricated by wire-cut machining in this work to exclude unexpected factors generated from the punching process. Hence, the difference in HER values is considered to arise from microstructural characteristics.
Cracks were initiated at the ferrite–martensite interfaces during the hole-expansion tests in all specimens (Figure 6a–c). This result stemmed from the large difference in hardness between the two phases. There have been many efforts to reduce this gap of hardness. For example, researchers alternated martensitic constituent of DP steel into bainite with lower hardness [27]. In this work, such an effect was achieved by increasing hardness of ferritic phase due to the enhanced dislocation hardening in the WQ specimen, while the hardness of martensite was unchanged (Figure 6d). It is also noted that the deviation of hardness of ferrite was significantly reduced in the WQ specimen in contrast to the SQ specimen. Since GNDs in the matrix cause the local hardening, the hardness could be uniformly increased in the WQ specimen due to its homogeneous distribution of fine martensite as discussed above. In addition to the hardness discrepancy, the fine martensite retarded the crack initiation, as supported by significantly short length of crack in the WQ specimen (Figure 6e).
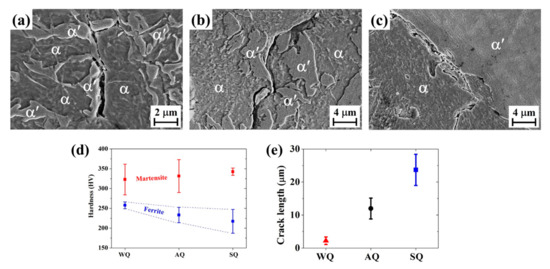
Figure 6.
SEM micrograph of (a) WQ specimen, (b) AQ specimen, and (c) SQ specimen near the hole; (d) phase hardness and (e) crack length for the investigated specimens after the hole-expansion test.
The AQ specimen exhibited the lower HER in spite of its average normal anisotropy similar to the WQ specimen. This can be explained by the martensitic morphology as well as the aforementioned two factors (i.e., the larger discrepancy in hardness between the two phases and larger grain size). The rapid increment of microvoids at the joint between martensite reduces the necking formability in the AQ specimen composed of the chained morphology [28]. This gave rise to the lowest post-uniform elongation (PUE). Chen et al. [26] reported the lower HER of twinning-induced plasticity (TWIP) steels than that of interstitial-free steel despite the higher elongation of the TWIP steels. They attributed such results to the absence of PUE resulting from a negative strain-rate sensitivity of TWIP steels. Thus, the low PUE contributed to the low HER of the AQ specimen to some extent.
5. Conclusions
The present work investigated the effect of microstructure on the stretch flangeability of ferrite–martensite DP steels with various martensitic structures. WQ, AQ, SQ specimens were composed of the fibrous, chained, and coarse martensitic structures, respectively. Although the investigated DP steels possessed the comparable fraction of martensite, the WQ specimen exhibited the highest tensile strength and HER value. The improved mechanical strength is attributed to the Hall–Petch strengthening and dislocation hardening induced by homogeneous distribution of fine martensite as well as high PUE. The enhanced stretch flangeability of the WQ specimen, characterized by its high HER value, resulted from the microstructural homogeneity that retarded the crack initiation and propagation. The high r45 values shown in all DP steels indicate the strong resistance to thinning, which well explains the suppressed crack initiation along the 45° direction.
Author Contributions
Conceptualization, J.H.K., T.L., and C.S.L.; investigation, J.H.K. and T.L.; resources, C.S.L.; writing—original draft preparation, J.H.K. and T.L.; writing—review and editing, T.L. and C.S.L.; supervision, C.S.L. All authors have read and agreed to the published version of the manuscript.
Funding
This work was supported by the National Research Foundation of Korea (NRF) grant funded by the Korean government (Ministry of Science and ICT) (No. 2018R1C1B6002068 & 2020R1A4A3079417).
Conflicts of Interest
The authors declare no conflict of interest.
References
- Jha, G.; Das, S.; Lodh, A.; Haldar, A. Development of hot rolled steel sheet with 600MPa UTS for automotive wheel application. Mater. Sci. Eng. A 2012, 552, 457–463. [Google Scholar] [CrossRef]
- Kim, N.J.; Thomas, G. Effects of morphology on the mechanical behavior of a dual phase Fe/2Si/0.1C steel. Met. Mater. Trans. A 1981, 12, 483–489. [Google Scholar] [CrossRef]
- Peng-Heng, C.; Preban, A. The effect of ferrite grain size and martensite volume fraction on the tensile properties of dual phase steel. Acta Met. 1985, 33, 897–903. [Google Scholar] [CrossRef]
- Mediratta, S.; Ramaswamy, V.; Rao, P. Influence of ferrite-martensite microstructural morphology on the low cycle fatigue of a dual-phase steel. Int. J. Fatigue 1985, 7, 107–115. [Google Scholar] [CrossRef]
- Molaei, M.; Ekrami, A. The effect of dynamic strain aging on fatigue properties of dual phase steels with different martensite morphology. Mater. Sci. Eng. A 2009, 527, 235–238. [Google Scholar] [CrossRef]
- Türkmen, M.; Gündüz, S. Martensite morphology and strain aging behaviours in intercritically treated low carbon steel. Ironmak. Steelmak. 2011, 38, 346–352. [Google Scholar] [CrossRef]
- Suh, D.; Kwon, D.; Lee, S.; Kim, N.J. Orientation dependence of microfracture behavior in a dual-phase high-strength low-alloy steel. Met. Mater. Trans. A 1997, 28, 504–509. [Google Scholar] [CrossRef]
- Kim, S.; Lee, S. Effects of martensite morphology and volume fraction on quasi-static and dynamic deformation behavior of dual-phase steels. Met. Mater. Trans. A 2000, 31, 1753–1760. [Google Scholar] [CrossRef]
- Das, D.; Chattopadhyay, P.P. Influence of martensite morphology on the work-hardening behavior of high strength ferrite–martensite dual-phase steel. J. Mater. Sci. 2009, 44, 2957–2965. [Google Scholar] [CrossRef]
- Park, K.S.; Park, K.-T.; Lee, D.L.; Lee, C.S. Effect of heat treatment path on the cold formability of drawn dual-phase steels. Mater. Sci. Eng. A 2007, 449, 1135–1138. [Google Scholar] [CrossRef]
- Chatterjee, S.; Bhadeshia, H.K.D.H. Stretch-flangeability of strong multiphase steels. Mater. Sci. Technol. 2007, 23, 606–609. [Google Scholar] [CrossRef]
- Narayanasamy, R.; Sathiyanarayanan, C.; Padmanabhan, P.; Venugopalan, T. Effect of mechanical and fractographic properties on hole expandability of various automobile steels during hole expansion test. Int. J. Adv. Manuf. Technol. 2009, 47, 365–380. [Google Scholar] [CrossRef]
- Comstock, R.J.; Scherrer, D.K.; Adamczyk, R.D. Hole Expansion in a Variety of Sheet Steels. J. Mater. Eng. Perform. 2006, 15, 675–683. [Google Scholar] [CrossRef]
- Yoon, J.I.; Jung, J.; Lee, H.H.; Kim, J.Y.; Kim, H.S. Relationships Between Stretch-Flangeability and Microstructure-Mechanical Properties in Ultra-High-Strength Dual-Phase Steels. Met. Mater. Int. 2019, 25, 1161–1169. [Google Scholar] [CrossRef]
- Kang, Y.-L.; Han, Q.-H.; Zhao, X.-M.; Cai, M.-H. Influence of nanoparticle reinforcements on the strengthening mechanisms of an ultrafine-grained dual phase steel containing titanium. Mater. Des. 2013, 44, 331–339. [Google Scholar] [CrossRef]
- Mazaheri, Y.; Kermanpur, A.; Najafizadeh, A. Strengthening Mechanisms of Ultrafine Grained Dual Phase Steels Developed by New Thermomechanical Processing. ISIJ Int. 2015, 55, 218–226. [Google Scholar] [CrossRef]
- Kadkhodapour, J.; Schmauder, S.; Raabe, D.; Ziaei-Rad, S.; Weber, U.; Calcagnotto, M. Experimental and numerical study on geometrically necessary dislocations and non-homogeneous mechanical properties of the ferrite phase in dual phase steels. Acta Mater. 2011, 59, 4387–4394. [Google Scholar] [CrossRef]
- Nye, J. Some geometrical relations in dislocated crystals. Acta Met. 1953, 1, 153–162. [Google Scholar] [CrossRef]
- Calcagnotto, M.; Ponge, D.; Demir, E.; Raabe, D. Orientation gradients and geometrically necessary dislocations in ultrafine grained dual-phase steels studied by 2D and 3D EBSD. Mater. Sci. Eng. A 2010, 527, 2738–2746. [Google Scholar] [CrossRef]
- Movahed, P.; Kolahgar, S.; Marashi, S.; Pouranvari, M.; Parvin, N. The effect of intercritical heat treatment temperature on the tensile properties and work hardening behavior of ferrite–martensite dual phase steel sheets. Mater. Sci. Eng. A 2009, 518, 1–6. [Google Scholar] [CrossRef]
- Jin, J.-E.; Lee, Y.-K. Strain hardening behavior of a Fe–18Mn–0.6C–1.5Al TWIP steel. Mater. Sci. Eng. A 2009, 527, 157–161. [Google Scholar] [CrossRef]
- Markandeya, R.; Nagarjuna, S.; Satyanarayana, D.; Sarma, D. Correlation of structure and flow behaviour of Cu–Ti–Cd alloys. Mater. Sci. Eng. A 2006, 428, 233–243. [Google Scholar] [CrossRef]
- Son, Y.I.; Lee, Y.K.; Park, K.-T.; Lee, C.S.; Shin, D.H. Ultrafine grained ferrite–martensite dual phase steels fabricated via equal channel angular pressing: Microstructure and tensile properties. Acta Mater. 2005, 53, 3125–3134. [Google Scholar] [CrossRef]
- Swift, H. Plastic instability under plane stress. J. Mech. Phys. Solids 1952, 1, 1–18. [Google Scholar] [CrossRef]
- Tomita, Y.; Okabayashi, K. Tensile stress-strain analysis of cold worked metals and steels and dual-phase steels. Met. Mater. Trans. A 1985, 16, 865–872. [Google Scholar] [CrossRef]
- Chen, L.; Kim, J.-K.; Kim, S.-K.; Kim, G.-S.; Chin, K.-G.; De Cooman, B.C. Stretch-Flangeability of High Mn TWIP steel. Steel Res. Int. 2010, 81, 552–568. [Google Scholar] [CrossRef]
- Sudo, M.; Iwai, T. Deformation Behavior and Mechanical Properties of Ferrite-Bainite-Martensite (Triphase) Steel. Trans. Iron Steel Inst. Jpn. 1983, 23, 294–302. [Google Scholar] [CrossRef]
- Park, K.; Nishiyama, M.; Nakada, N.; Tsuchiyama, T.; Takaki, S. Effect of the martensite distribution on the strain hardening and ductile fracture behaviors in dual-phase steel. Mater. Sci. Eng. A 2014, 604, 135–141. [Google Scholar] [CrossRef]


Publisher’s Note: MDPI stays neutral with regard to jurisdictional claims in published maps and institutional affiliations. |
© 2020 by the authors. Licensee MDPI, Basel, Switzerland. This article is an open access article distributed under the terms and conditions of the Creative Commons Attribution (CC BY) license (http://creativecommons.org/licenses/by/4.0/).