Article

Spectroscopic, Raman, EMPA, Micro-XRF and Micro-XANES Analyses of Sulphur Concentration and Oxidation State of Natural Apatite Crystals

1
State Key Laboratory of Geological Processes and Mineral Resources, China University of Geosciences, Beijing 100083, China
2
School of Earth, Atmosphere and the Environment, Monash University, Clayton, VIC 3800, Australia
*
Author to whom correspondence should be addressed.
Crystals 2020, 10(11), 1032; https://doi.org/10.3390/cryst10111032
Submission received: 2 October 2020 / Revised: 7 November 2020 / Accepted: 9 November 2020 / Published: 12 November 2020

Abstract

:
Sulphur is the third most abundant volatile element in deep Earth systems. Analytical methods for accurately and efficiently determining the sulphur content and oxidation state in natural minerals are still lacking. Natural apatite is widely distributed in the Earth and incorporates a large amount of sulphur. Therefore, apatite is an ideal mineral for performing sulphur measurements. Here, we used spectroscopic, Raman, X-ray diffraction, laser ablation inductively coupled plasma mass spectrometry (LA-ICP-MS), electron microprobe (EMPA) and micro-X-ray fluorescence spectrometry (micro-XRF) analysis techniques and developed a new analytical approach (i.e., micro-X-ray absorption near-edge structure (micro-XANES) analysis of the sulphur K-edge) to investigate the chemical characteristics of natural apatite. These multiple methods were developed to measure in situ sulphur concentration and S oxidation states and to assess a potential natural apatite reference material. Apatite contains chemically homogeneous sulphur, with micro-XANES located at the peak energies corresponding to S6+ (sulphate; ~2482 eV), S4+ (sulfite; ~2478 eV), and S2− (sulphide; ~2467, 2470 and 2474 eV). The Durango apatite contains total S presented as SO3 at amount of 0.332 ± 0.012 wt.% (1σ), with a large amount of S6+ and a small contribution of S4+. The Kovdor apatite contains 44–100 ppm of S and is dominated by S6+. These results indicate that the Durango apatite crystallised under relative oxidising conditions, and the Kovdor apatite has a higher oxygen fugacity than Durango. In addition, this study indicates the potential use of the natural apatite reference material with its S composition and S oxidation state.

1. Introduction

Sulphur is the third most abundant volatile element in Earth systems [1] and is a significant component in metal complexes in magmatic ore systems, which are the major sources of copper, gold, and molybdenum in the world [2,3]. Methods for accurately and efficiently measuring the sulphur content and oxidation state are essential for understanding volatile evolution and related magmatic mineralisation processes. Natural apatites contain large amounts of sulphur and are widely distributed in the Earth [4]. Sulphur with different oxidation states (e.g., S2−, S4+ and S6+) can greatly affect metal solubility in parental melts and partitioning of ore metals between melts and ore-forming fluids [4]. Thus, apatite is an ideal sample for investigating S concentration and S oxidation state. In addition, establishing multiple methods for analysing natural apatite minerals (including major elements and the oxidation state of S in fluorapatite, hydroxylapatite and chlorapatite) is prerequisite for analytical research [5,6]. In this study, we used X-ray diffraction, infrared spectroscopy, Raman spectroscopy, electron microprobe (EMPA), laser ablation inductively coupled plasma mass spectrometry (LA-ICP-MS), micro-X-ray fluorescence spectrometry (micro-XRF) and in situ sulphur X-ray absorption near-edge structure (micro-XANES) analyses to study chemical and S oxidation states in apatite from Durango, Mexico, and Kovdor, Russia. The data were also used to build natural apatite reference materials of major elements and S oxidation states.

2. Standards and Natural Apatite

The apatite group are the most common phosphate minerals, with the general formula of U10[VO4]6W2, where U is a divalent cation represented by Ca2+ and Ba2+, and Sr2+, Mg2+, Fe2+, Ce3+ and Mn2+ are also incorporated as isomorphs (Figure 1). In addition, alkali ions K+ and Na+ can easily enter the apatite structure by coupling isomorphism. [VO4] is mainly [PO4]3−, which can be substituted by [SO4]6−, [VO4]3−, [CO3]2−, [AsO4]3−, [SiO4]4− and other complex anions. The anion W in the formula is commonly F, Cl, S2−, Br and OH. Natural apatites crystallize in the hexagonal system, commonly in the centrosymmetric space group P63/m, although there are examples of monoclinic P21/b chlorapatite and hydroxylapatite end-members [7]. The P63/m apatite structure has two non-equivalent cationic sites: Ca1 with nine coordination numbers and Ca2 with seven coordination numbers. The Durango apatite grains from Cerro de Mercado, Mexico [8] are normally used as standards during analytical research [9]. The DUR apatite sample used is gem-quality apatite with uniform colour distribution (lightly yellow colour), with chemical formula of (Ca, Na)5(PO4, SO4, SiO4,)3(F, Cl). The blue Kovdor apatite formed in the carbonatites in the francolite deposit in Murmansk Oblast, Russia. This Kovdor apatite crystal, (Ca, Na) (PO4, SO4, SiO4,)3(F, OH), appears to be overall homogenous with some carbonatites, and has relatively lower sulphur content (0.007 ± 0.002 wt.%) than the Durango apatite (0.133 ± 0.005 wt.%) [10].
In addition, we use other natural minerals as reference materials during XANES measurements. Natural alabandite, scapolite, lazurite, pyrite, gypsum and sodium sulfite are used as standards during analysis. The chemical formula of scapolite is Na4[AlSi3O8]3(Cl, OH)-Ca4[Al2Si2O8]3(CO3, SO4), and the main component of gypsum is CaSO4. These minerals contain S6+. The chemical formula of lazurite is generally (Na, Ca)7~8(Al, Si)12(O, S)24[SO4, Cl2(OH)2], and lazurite contains S6+ and S2− [11,12]. Pyrite (FeS) and alabandite (MnS) are used as the peak of S2− [13]. The chemical formula of sodium sulfite is Na2SO3, containing S4+.

3. Experiment

3.1. X-ray Diffraction (XRD)

The powder crystal X-ray diffraction (XRD) of the samples was acquired using a D8 Advance X-ray diffractometer (Bruker Scientific Instruments, China) at the China University of Geosciences, Beijing. The testing voltage was 40 KV, the current was 100 mA, the scanning pace was 8°/min. Furthermore, the test used continuous scanning mode with 2θ scanning of 10–70°. The results are listed in Table 1.

3.2. Infrared Spectra

The infrared spectra of analysed samples were performed at the China University of Geosciences, Beijing by using the Tensor 27 Infrared Spectrometer produced by Germany. During the test, the temperature in the laboratory was controlled at 16–18 °C and the relative humidity was 36–38%. The voltage is 220–240 V, the frequency is 56–60 Hz, and the power is 250 W.

3.3. Raman Spectra

The Raman spectra of the Durango apatite were acquired using a Raman spectrometer (HR-Evolution, HORIBA) at the China University of Geosciences, Beijing, and the spectrometer was equipped with a 50×objective. The spectrometer used a 600-lines-per-millimetre diffraction grating and a Peltier-cooled, Si-based CCD detector, and a solid-state 100-mW 532-nm laser was used as the excitation source. The spectra were collected in the range of 200–2100 cm−1 (10-s accumulation time, 3 scans). The instrument was calibrated by a silicon and synthetic standard.

3.4. EMPA

The major elements of apatite, presented in Table 2, were determined using an electron probe (EMPA) at the Institute of Geology, Chinese Academy of Geological Sciences, with a JEOL JXA-8800R microprobe. The representative points with different grains were analysed with a 2–5-microm beam diameter at 15-kV voltage and 20-nA beam current. Detection limits of oxides are below 0.01 wt.%.

3.5. LA-ICP-MS

The Durango and Kovdor apatite were examined to determine their Sr element content by using an Agilent 7900 ICP-MS with a NWR193UC Elemental Scientific Lasers at the Chinese Academy of Geological Sciences. The spot size was 25 μm, the laser energy density 2.5 J/cm2, and the repetition rate 10 Hz. 43Ca was used as the internal standard to calculate the trace-element compositions of unknown samples. The raw data were processed using the online software program GLITTER 4.4. The data are presented in Table 3.

3.6. Micro-XRF Elemental Mapping

The elemental mapping of the Durango apatite was performed using a micro-XRF spectrometer (BRUKER) at Macquarie University, Australia. The spectrometer was equipped with an X-ray tube and a vacuum pump and was operated at 50-kV voltage and 600-µA current. The data were processed using the mineral analyser software from BRUKER.

3.7. Sulphur X-ray Absorption Near-Edge Structure Spectroscopy (S XANES)

In situ sulphur XANES measurements at the K-edge were performed on the I-13 beamline at the Diamond Light Source (UK national synchrotron). XANES measurements were performed in a He atmosphere using a 6 × 6-µm, 3-keV beam, and the fluorescence spectra were acquired using a Vortex silicon drift detector and quantified using the PyMca software. For each sample, we also collected XRF maps at 3 keV, i.e., above the Cl K-edge but below the Ar K-edge, and P was used as an internal reference for S/Cl quantification. These conditions were optimised for S/Cl quantification because Ar is always present in a He atmosphere but in variable quantities; therefore, it affects the quantification [14].

4. Results and Discussion

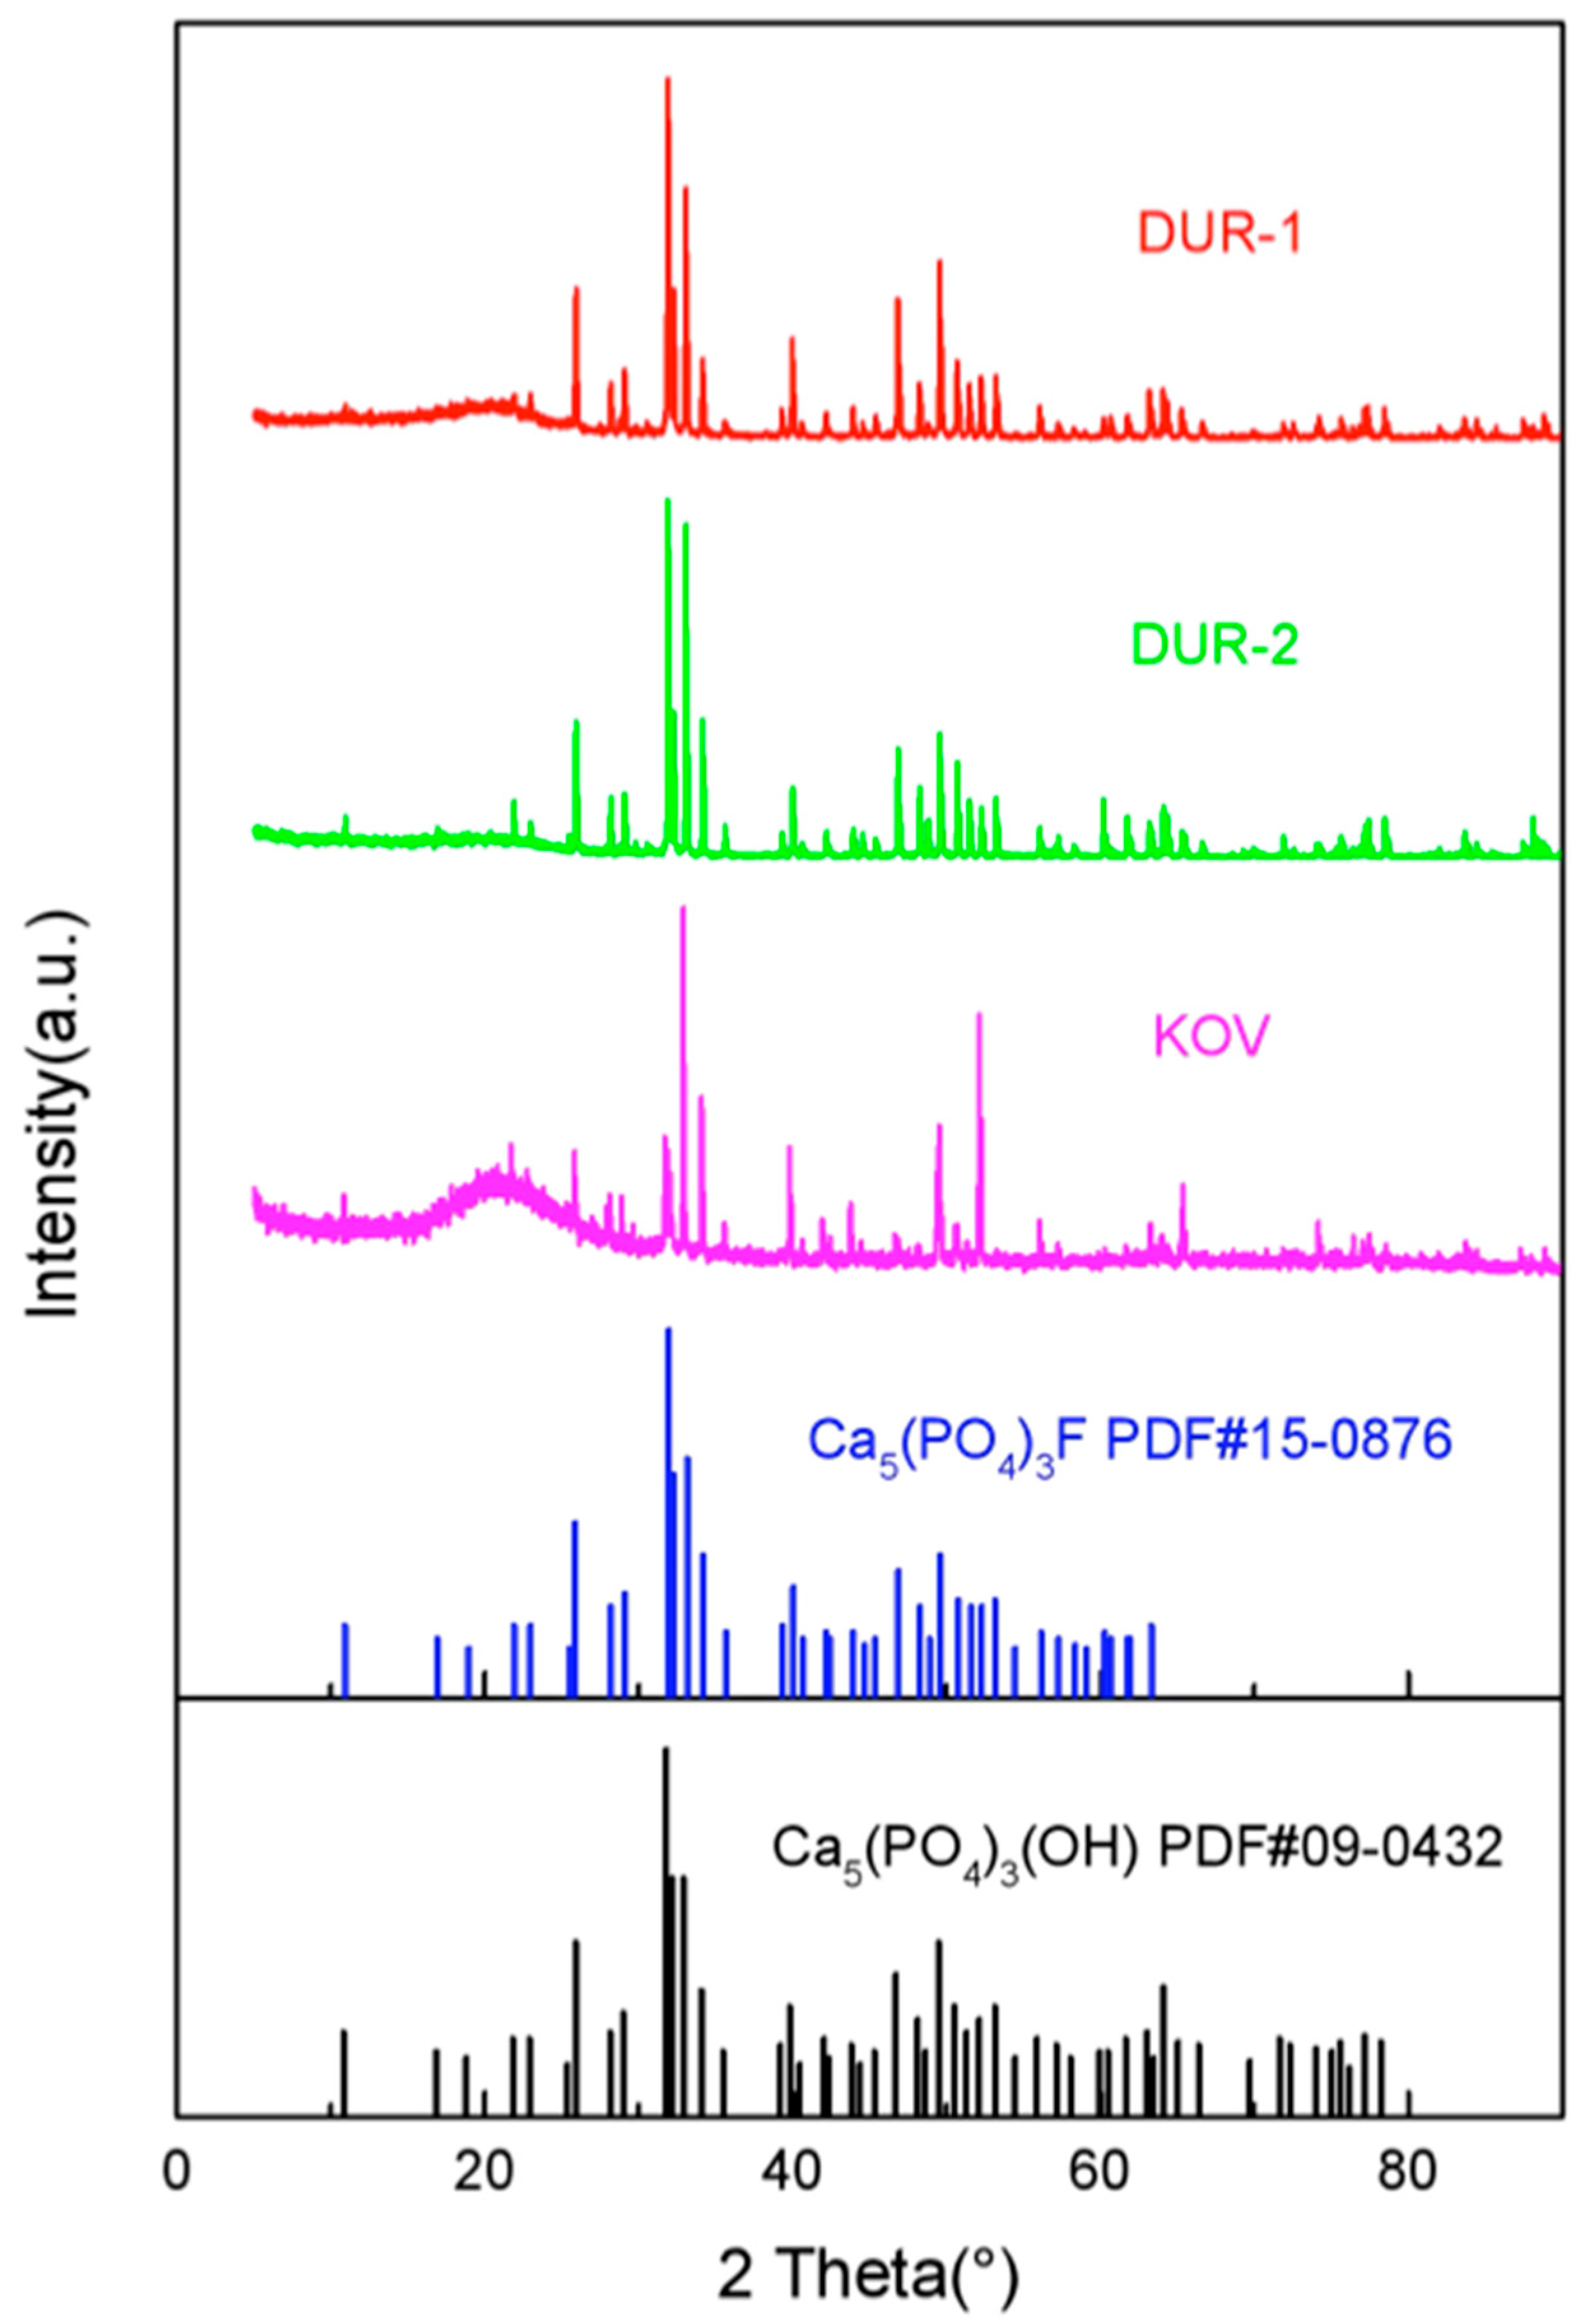
4.1. X-ray Diffraction (XRD)

The unit-cell parameters of Durango apatite a = 9.3657(77)–9.3659(74) Å, c = 6.8984(1)–6.8685(16) Å. The unit-cell parameters of Kovdor apatite a = 9.3892(25) Å, c = 6.8891(1) Å (Table 1). Compared with PDF cards: 09-0432 (Ca5(PO4)3(OH)) and 15-0876 (Ca5(PO4)3F), the unit-cell parameters of two Durango apatite are consistent with Ca5(PO4)3F, while Kovdor apatite is more inclined to Ca5(PO4)3(OH) (Table 1, Figure 2).

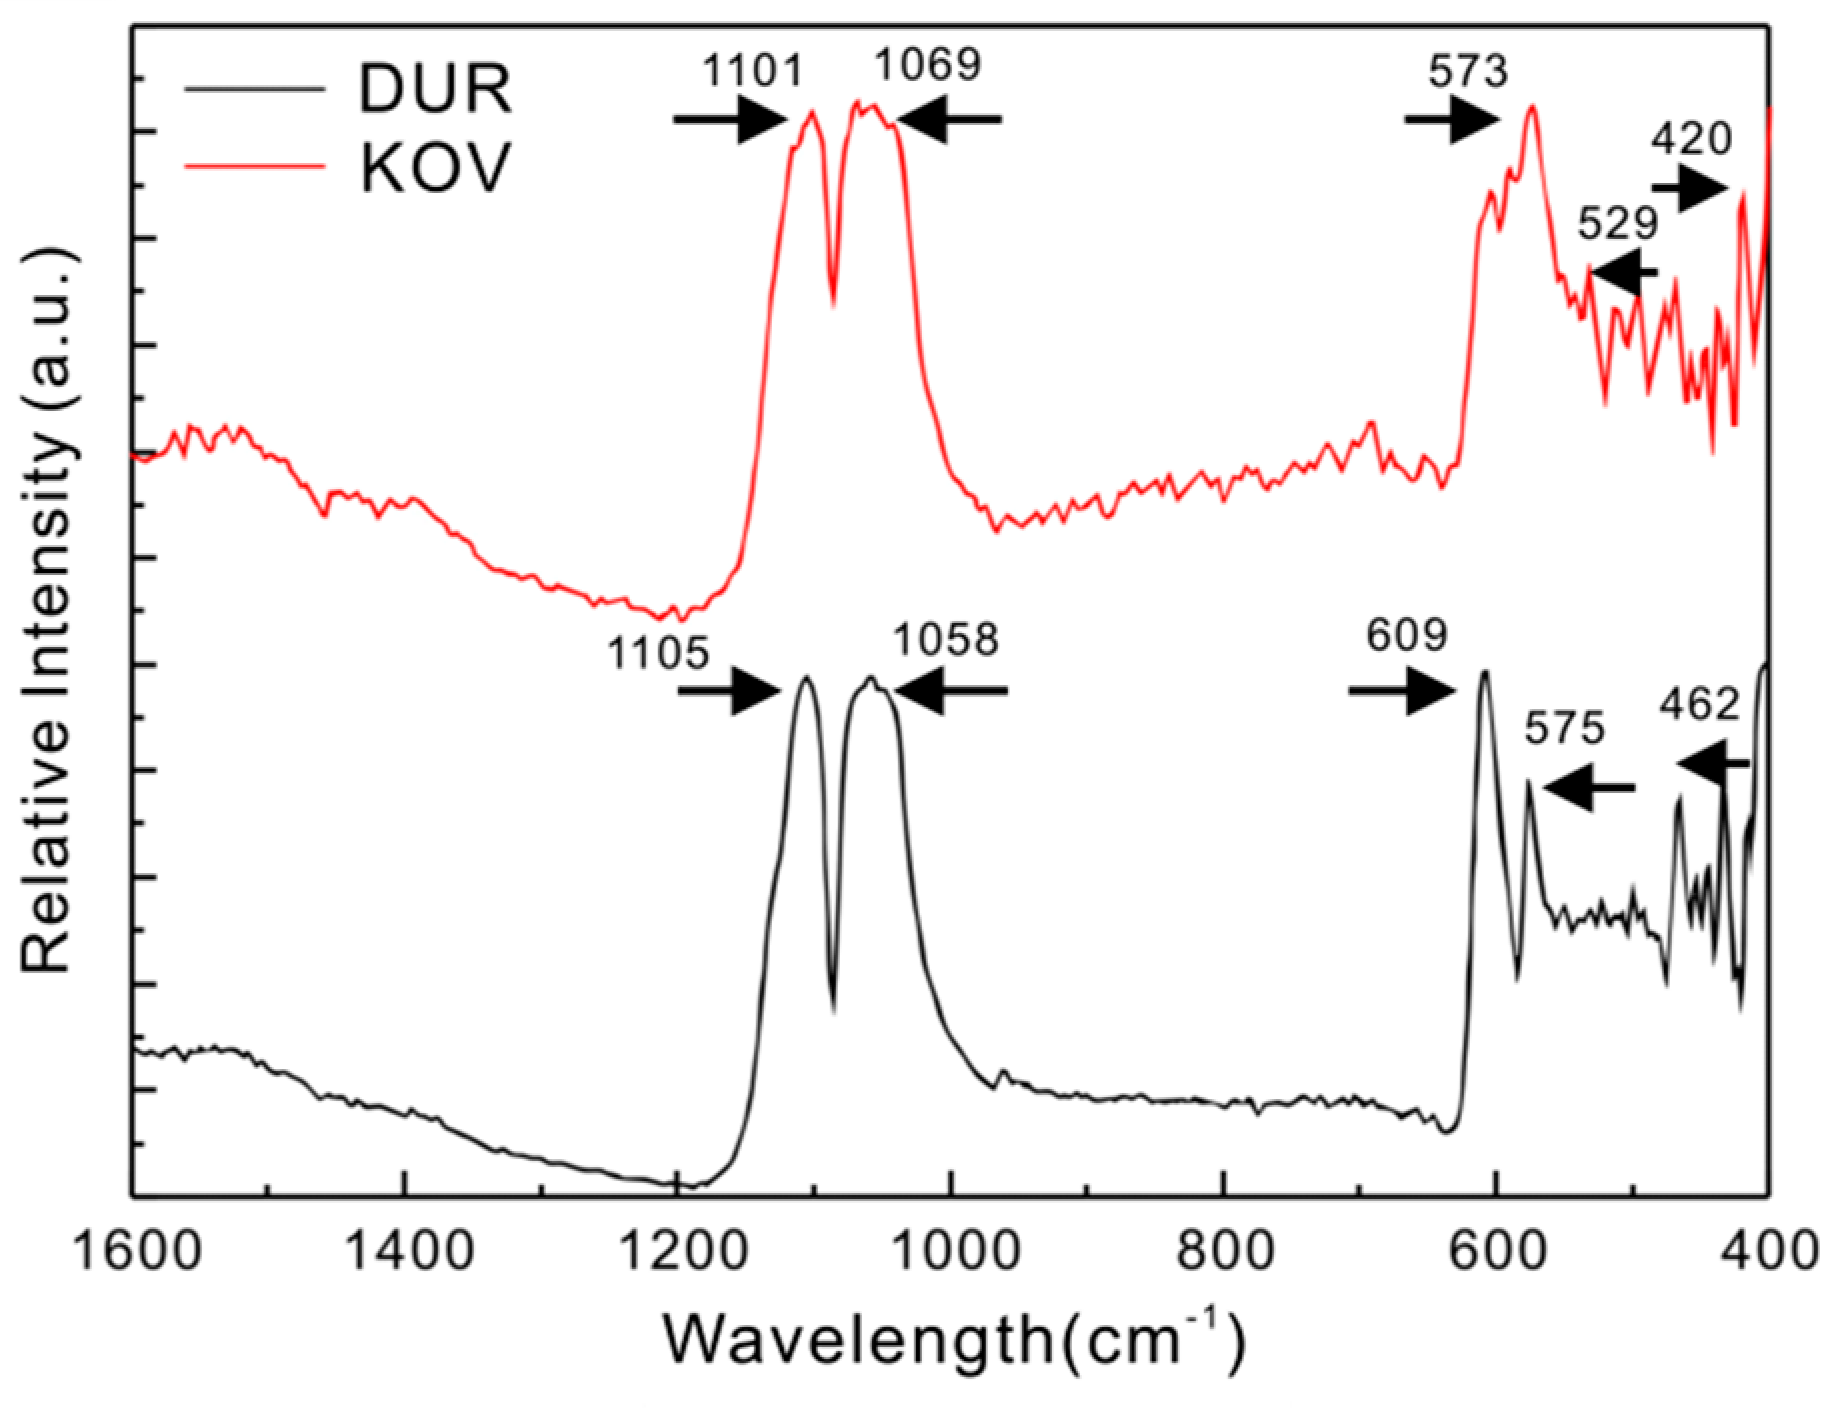
4.2. Infrared Spectra

Typical infrared reflectance spectra for apatite are shown in Figure 3. DUR and KOV apatites exhibit peaks at 431, 465, 575, 607, 962, 1058, and 1105 cm−1. The strong bands near 600 and 575 cm−1, which are present in the infrared reflectance spectra of all apatite samples, are due to the bending vibration of PO43−. The weak bands at 950–960 cm−1 are due to the symmetrical stretching vibration of PO43−. The shoulder peaks near 1050–1060 and 1100 cm−1 are due to the anti-symmetric stretching vibration of PO43−. There was such small amount of SO42− vibration bands at 609 cm−1, as observed (Figure 3).

4.3. Raman Spectra

The Raman spectra of two apatite samples are shown in Figure 4. There are four major vibration peaks at 429–446, 588–579, 962–965, and 1048–1058 cm−1 for the Durango apatite. The peak at 962–965 cm−1 is a symmetrical stretching vibration of [PO4]3−, and it is the strongest characteristic peak of apatite [15]. The peaks at 1048–1058 and 588 cm−1 are the asymmetric stretching vibration and anti-symmetric bending vibration of [PO4]3−. A vibration of [SO4]2− should show peaks at 1005 cm−1 and 1123 cm−1, which did not appear in the DUR and KOV apatites as expected.

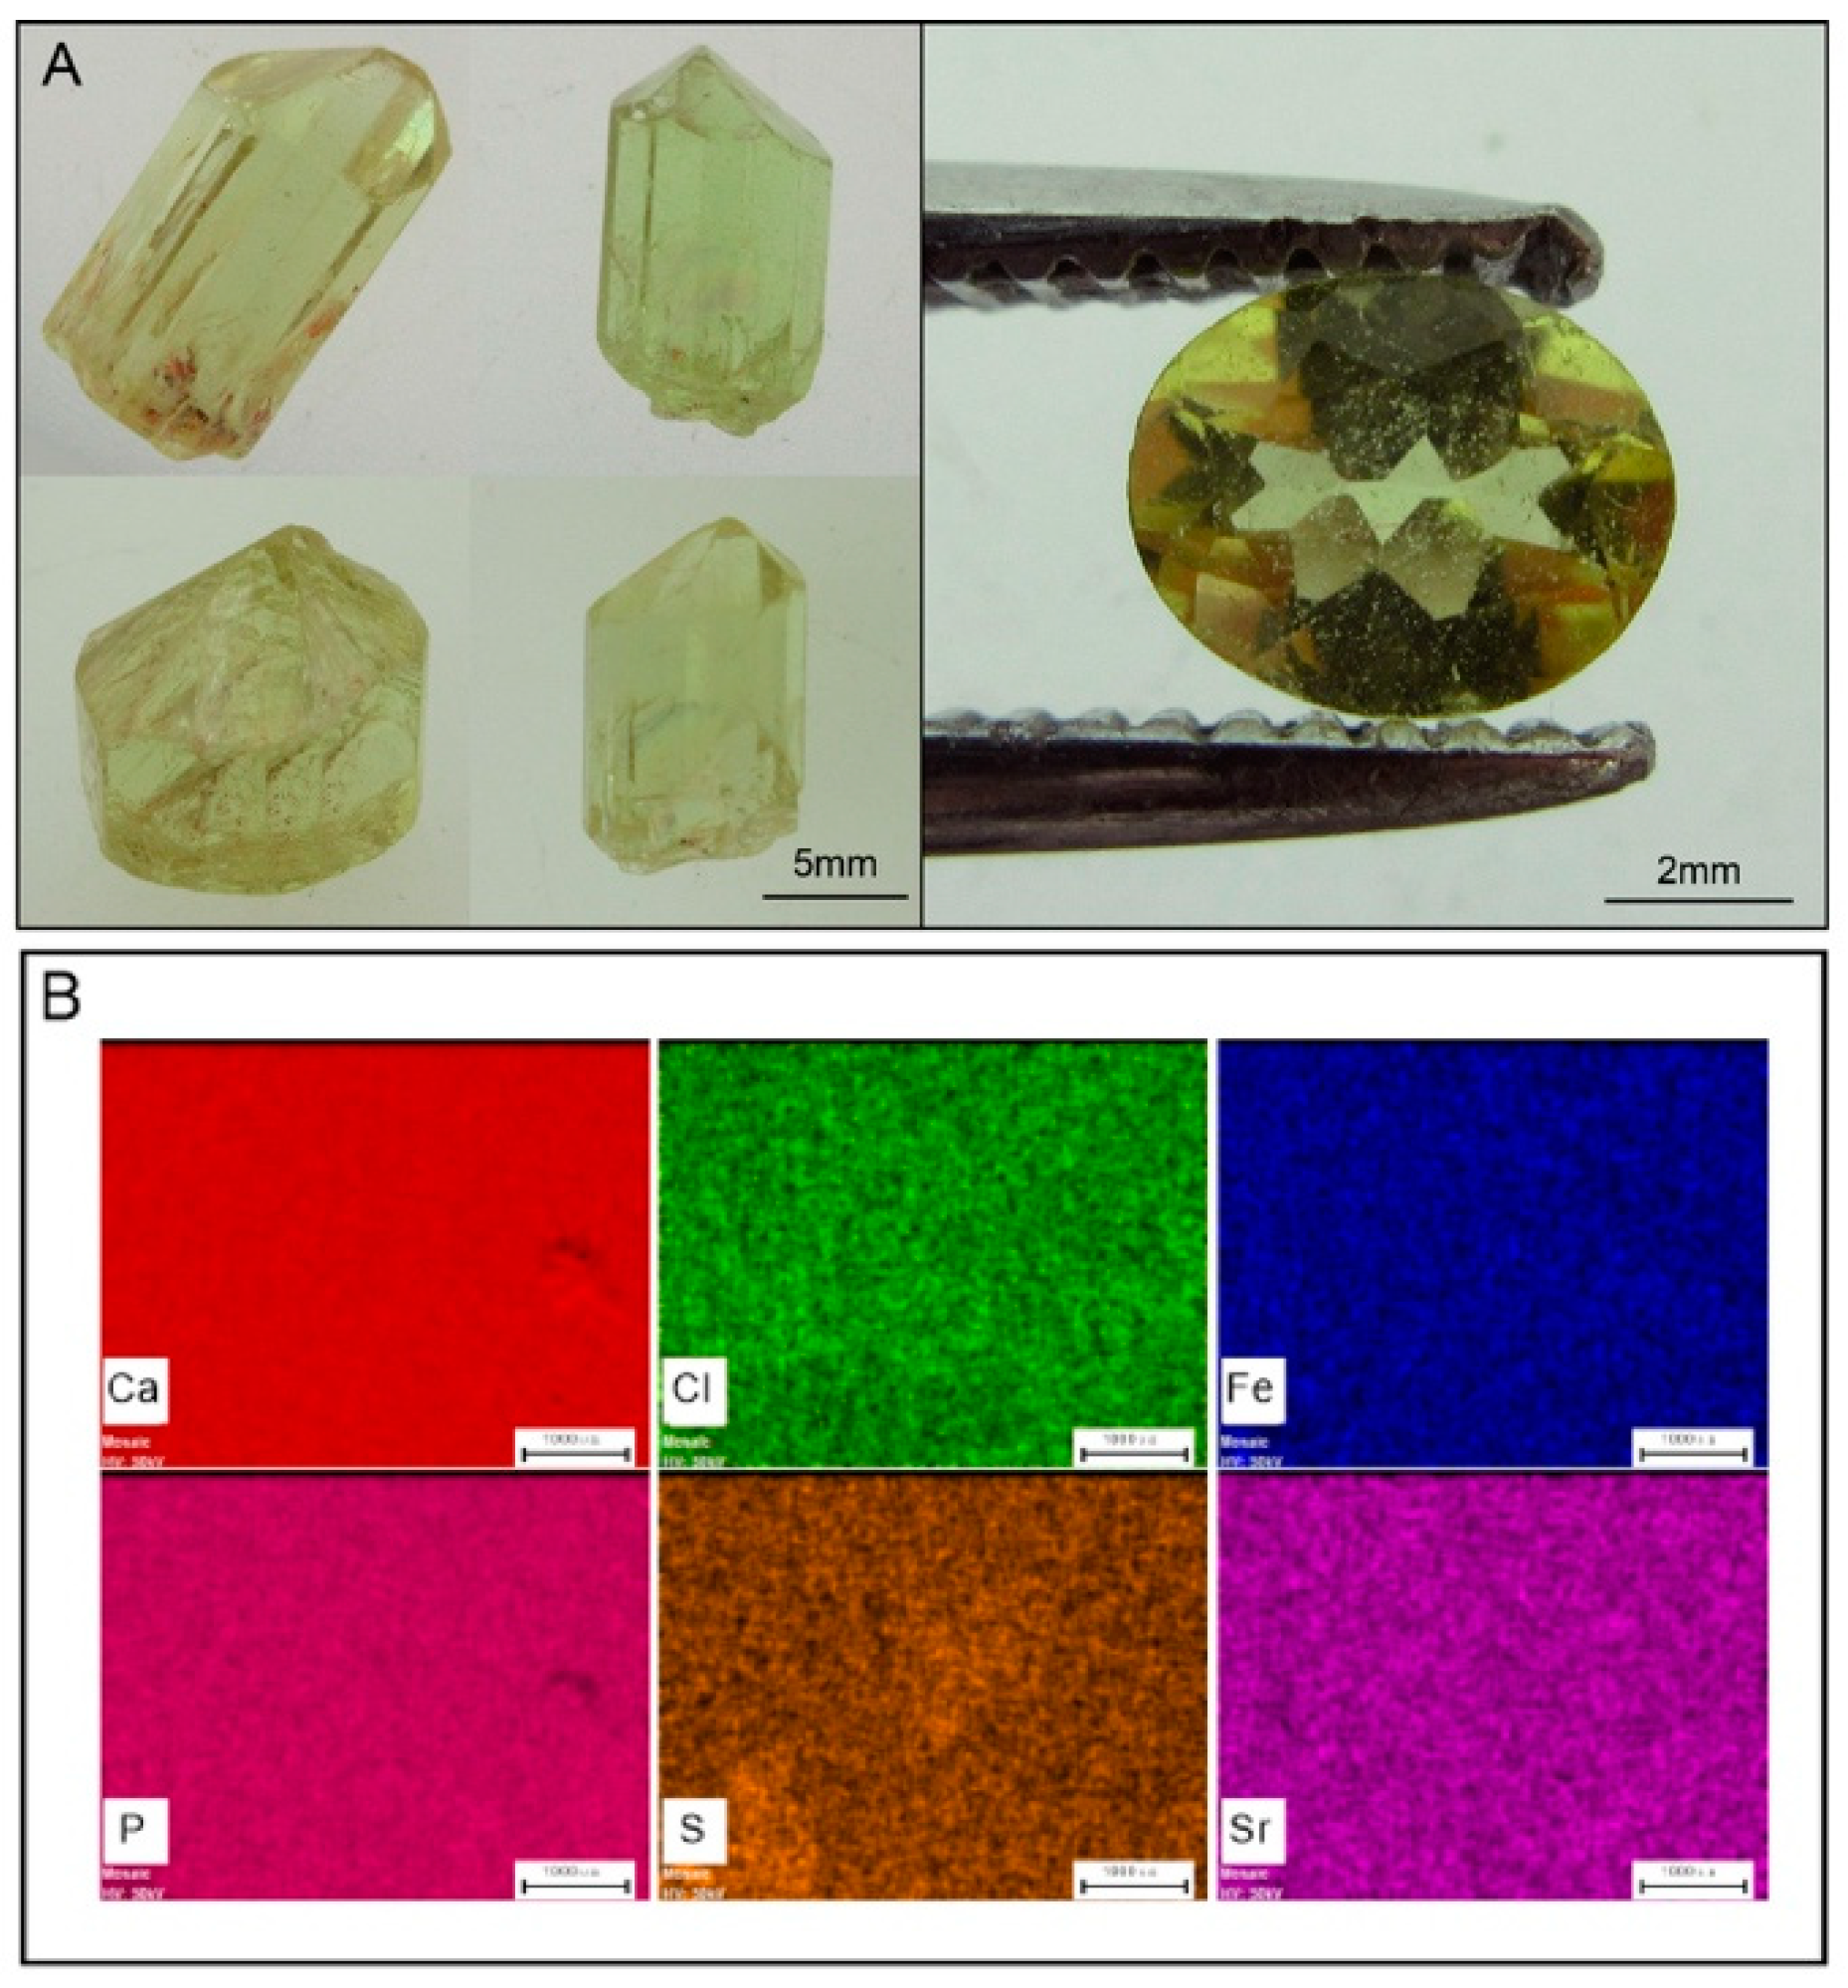
4.4. Elemental Maps by Micro-XRF Mapping and Major-, Trace-Element Compositions of Apatite

The elemental maps of apatite made by micro-XRF are shown in Figure 5. Iron, calcium, chlorine, phosphorus, sulphur and strontium are uniformly distributed in the samples, and all of the above-mentioned elements show the same distribution in the DUR apatite. The major elements compositions of the analysed Durango and Kovdor apatite are shown in Table 2. In general, the Durango apatite grains contain 39.97–41.18 wt.% of P2O5 and 53.60–54.55 wt.% of CaO. The SO3 concentration in Durango varies from 0.31 to 0.35 wt.%. The Kovdor apatite grains contain 39.27–40.22 wt.% of P2O5 and 52.01–52.45 wt.% of CaO. The concentration of SO3 in the Kovdor apatite ranges from 0.01 to 0.03 wt.%. The Sr and Y content of the Durango apatites range from 474.93–482.11 ppm (average: 478.99 ppm) and 549.08–577.63 ppm (average: 560.88 ppm). Meanwhile, the Kovdor apatite grains contain higher Sr (2601.36–2801.04 ppm, average: 2730.82 ppm) and lower Y (193.28–262.35 ppm, average: 226.39 ppm) than the Durango apatite (Table 3). The high S and low Y indicate the Kovdor apatite may be collected from carbonatites. On the contrary, the Durango apatite should be collected from pegmatite deposits.
In this study, all measurements were conducted in the parallel c-axis to avoid the effects of orientation. The Durango apatite samples with different points selected for this study were consistent (as determined by infrared reflectance and Raman spectra). The micro-XRF mapping of calcium, phosphorus and sulphur indicate the chemical homogeneity (Figure 5). Electron microprobe analyses (Table 2; Figure 5) were performed on selected single crystals and generally showed low-to-moderate variability for major and minor compositions within each mineral grain. The analyses of the Durango apatite grains (where the c-axis was parallel) yielded SO3 composition of 0.332 ± 0.012 wt.% (1σ), which suggested homogeneity in terms of sulphur distribution within a single grain. The Kovdor have SO3 of 0.017 ± 0.005 wt.% (1σ). These results indicate that Durango apatite have higher SO3 content, and may be more suitable than for those from Kovdor for sulphur reference materials.

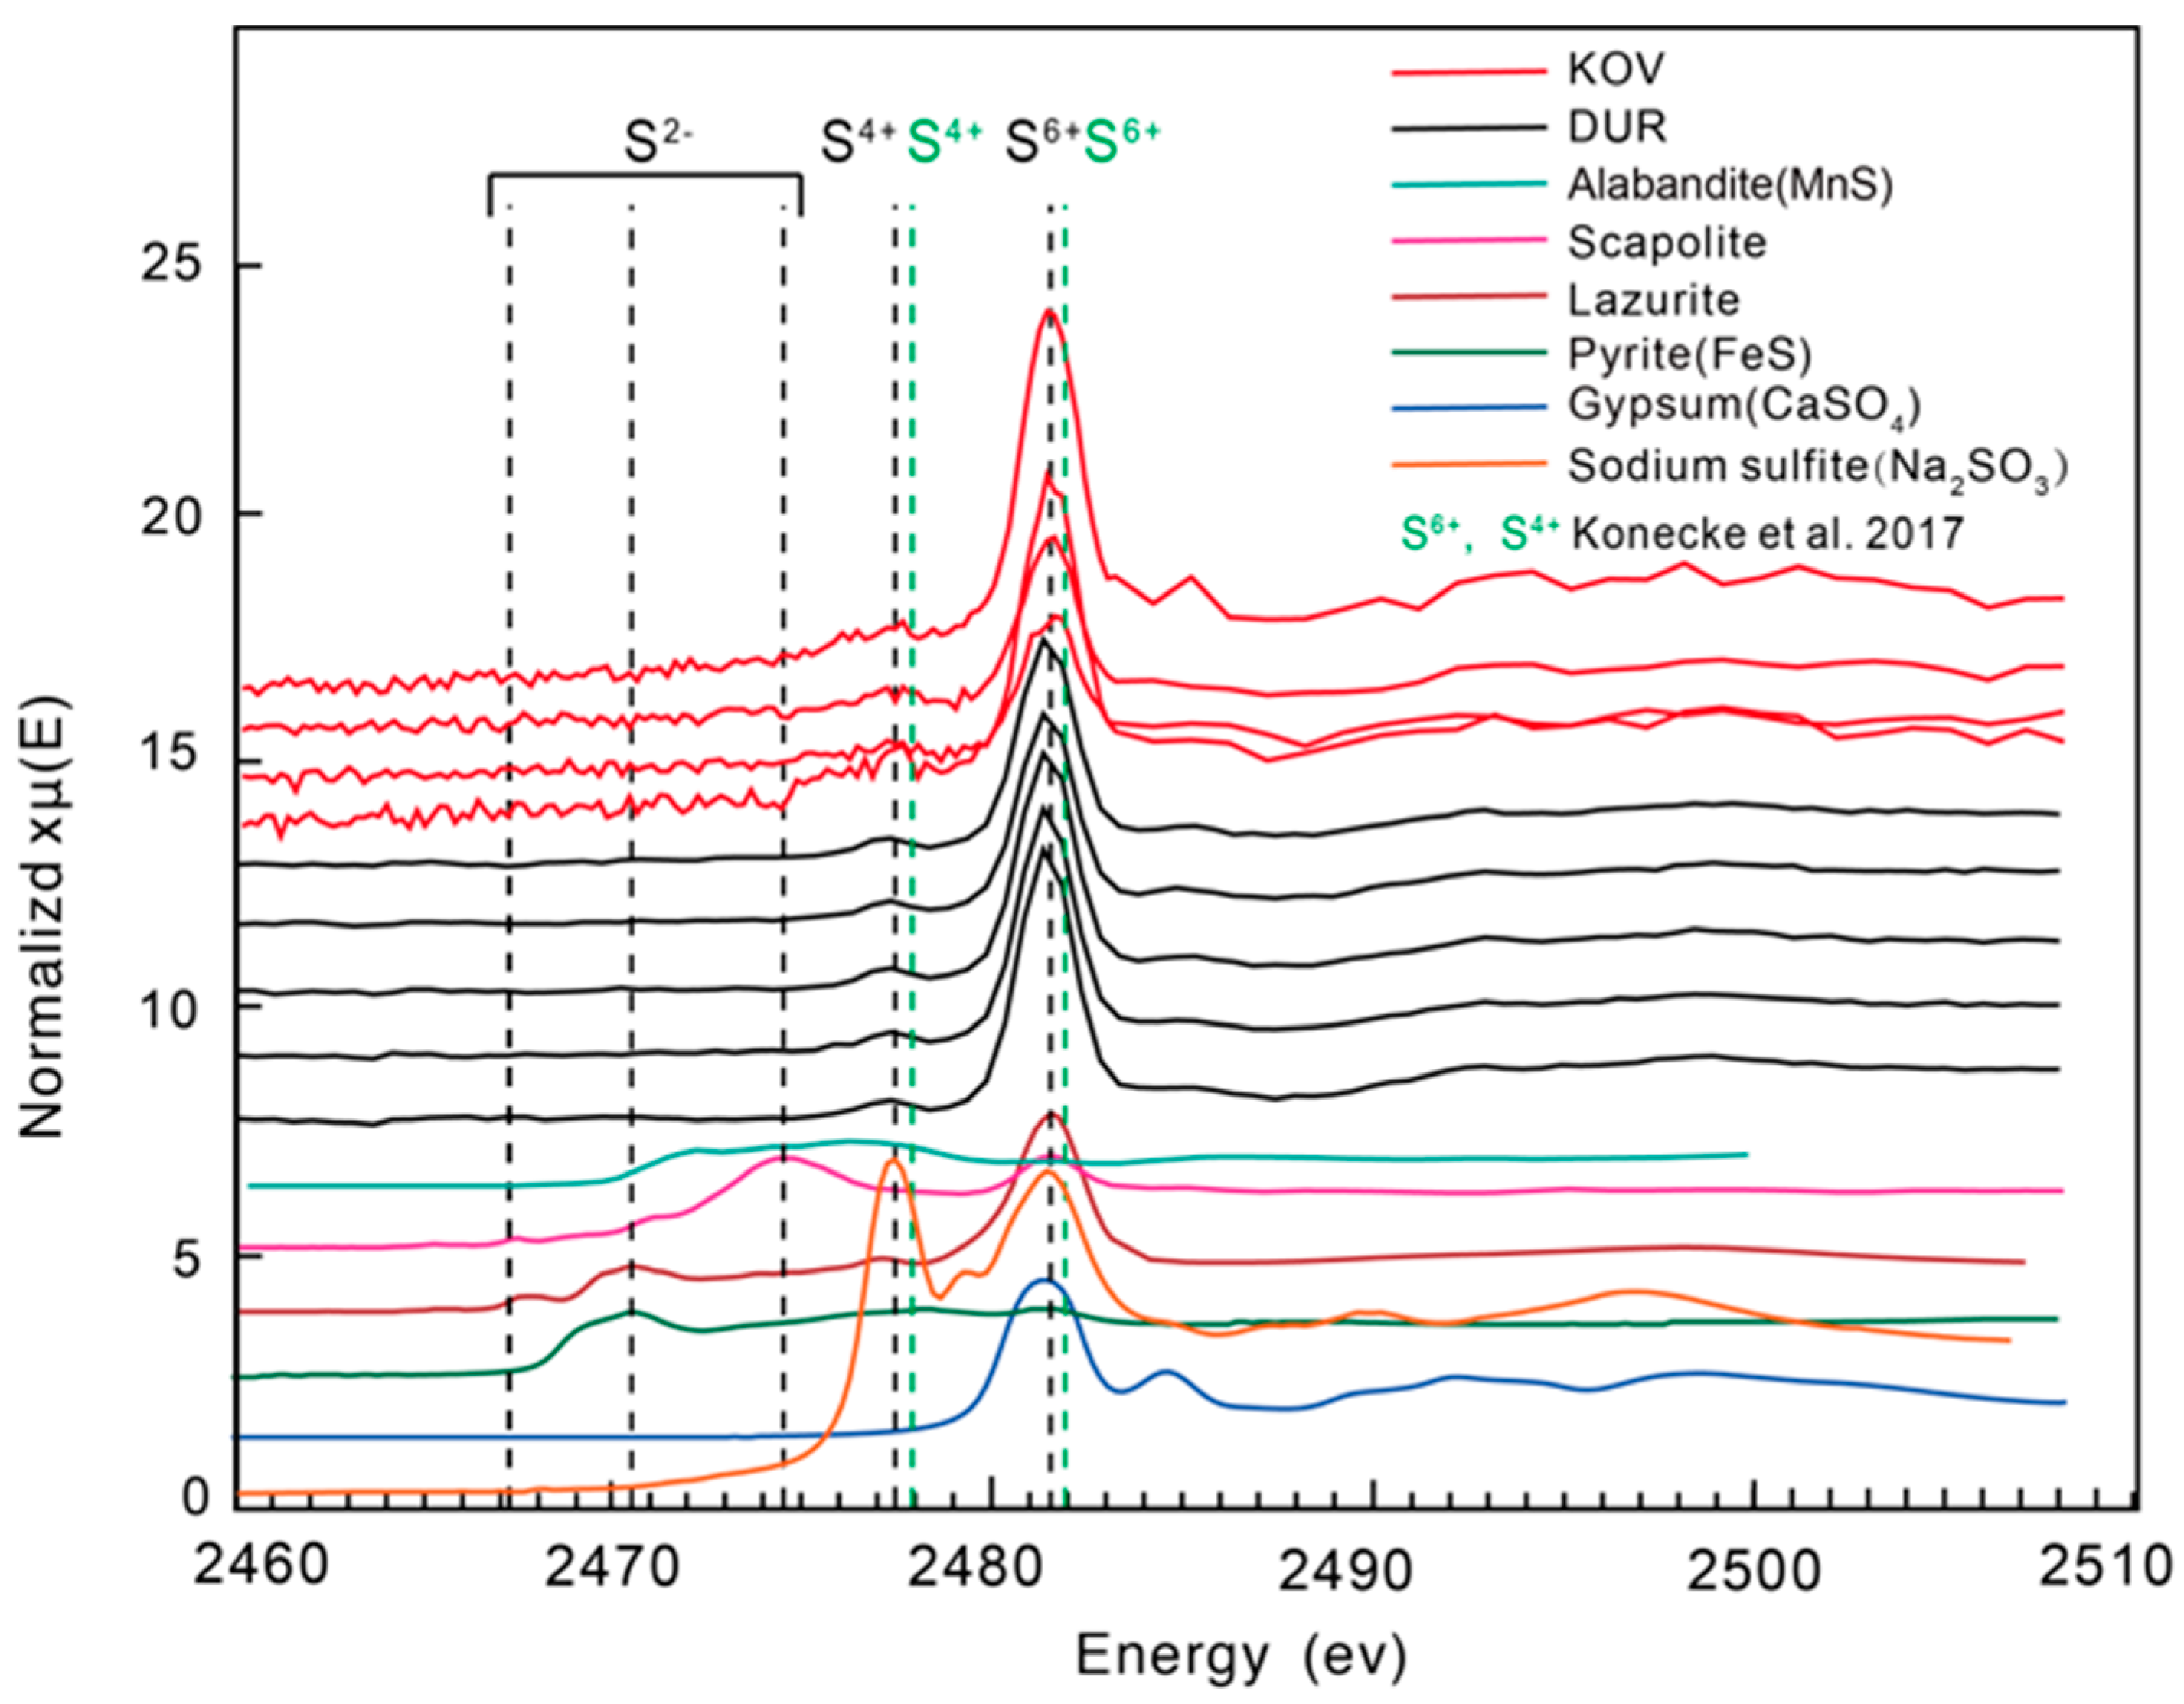
4.5. Sulphur X-ray Absorption Near-Edge Structure Spectroscopy (S XANES)

The measured S6+/ΣS ratios were consistent for five Durango apatite grains and four Kovdor apatite grains in mounts (Figure 6). Five standards with distinct peak energy are used to identify different valences of sulphur. The average XANES spectra for scapolite and gypsum contained dominant S6+ (~2482 eV) peaks. The average XANES spectra for sodium sulfite contained dominant S4+ (~2478 eV) peaks. The average XANES spectra for alabandite and pyrite contained dominant S2− (~2467 eV, 2470 eV and 2474 eV peak). The dominant peaks in lazurite were attributed to S6+ (~2483 eV) and S2− (~2467 eV, 2470 eV and 2474 eV peak). The Durango apatite contained peaks at ~2482 and ~2478 eV, which represented the characteristic spectral features of S6+ and spectral evidence for the presence of S4+, respectively, whilst the Kovdor apatite contained a peak at ~2482 eV, which was the characteristic spectral feature of S6+. In the studied Durango apatite, the intensity of the ~2482 eV peak of S6+ is significantly higher than that of the ~2478 eV peak. In this study, to evaluate the effect of beam damage during sulphur XANES measurements, we also analysed all sample line transects and time series. Time series measurements on studied samples using analytical durations ranging from 10 to 30 min per analytical spot produced an insignificant variation between spectra. Therefore, irradiation damage resulting in possible oxidation or reduction of sulphur in apatite during the analyses can be ruled out.

4.6. Homogeneous Chemistry and S Oxidation States, Implications for Potential Natural Apatite Reference Materials

An in situ apatite chemical study is a powerful tool for studying magmatic evolution [16,17,18] and is a potential method for mineral exploration [19,20,21]. However, natural apatite standards with multiple chemical and S oxidation states are the precondition for analyses. In this study, all measurements were performed at the parallel apatite c-axis to avoid the effect of orientation. From the chemical measurement, the Durango apatite samples have homogeneous sulphur data. It has been documented that apatite contains S2− but is dominated by S6+ [22]. Our study confirms that S6+ is dominant in the Durango and Kovdor apatites, but the Durango apatite still contains a minor amount of S4+ (Figure 6). The consistent nine XANES spectra with different area and time series suggest that the Durango and Kovdor apatites have homogeneous S oxidation states. This study is also consistent with the results that the higher sulphur content can be obtained from oxidised melts for which parental melts contain only S2− owing to the ability of S2− to partition into the apatite mineral structure [22,23]. Therefore, apatite sulphur oxidation states can be developed and applied to igneous rocks from various mineral systems. Sulphur is the most important metal complex in magmatic-hydrothermal ore deposits such as porphyry copper systems [24]. In 2017, Konecke [24] demonstrated that apatite contains different oxidation states of sulphur. Thus, sulphur XANES can be used as a function of the redox conditions of the magma. This study also indicates the substitution of S4+ and S6+ for P5+ in apatite. In this study, the co-variation of S content and S4+ and S6+ observed in the Durango and Kovdor apatites suggest that both of them are derived from an oxidised environment and metasomatised by SO2− fluids [25,26,27,28]. Thus, apatite coexisting with a given melt in the fO2 range is anticipated to contain both S6+ and S4+, and thus, it can be used to quantify the fO2 of the system at the time of apatite crystallisation during mineralization [29]. Therefore, our study presents the improvement of the Durango and Kovdor natural apatite standards based on the S6+/STotal of apatite and provides a new suit of data for additional analytical work.

5. Conclusions

A combination of spectroscopic, chemical and micro-XANES techniques allows an integrated chemical and S oxidation state characterisation of natural Durango and Kovdor apatite. The Durango apatite crystals show a variation of S of less than 5%. Therefore, Durango apatite can be attributed to reduced matrix effects during the analytical work. Synchrotron-based XANES reveals that Durango apatite is dominated by S6+ and contains a small amount of S4+ and Kovdor apatite is dominated by S6+, which indicates that it was crystallised from an oxidised environment. In addition, this study suggests that the micro-XANES technique can be used for the quantitative research of S oxidation states.

Author Contributions

Conceptualization, B.X.; methodology, B.X.; software, G.K., D.L.; writing—review and editing, B.X., B.E., J.B.; project administration, B.X.; funding acquisition, B.X. All authors have read and agreed to the published version of the manuscript.

Funding

This research was funded by National Key Technologies R&D Program 2019YFA0708602, National Natural Science Foundation of China (41803045), Young Talent Support Project of CAST, Fundamental Research Funds for the Central Universities and IGCP-662.

Acknowledgments

We acknowledge the handling of editor and constructive comments from three reviewers.

Conflicts of Interest

The authors declare no conflict of interest.

References

  1. Simon, A.C.; Ripley, E.M. The Role of Magmatic Sulfur in the Formation of Ore Deposits. Rev. Mineral. Geochem. 2011, 73, 513–578. [Google Scholar] [CrossRef]
  2. Gustafson, L.B.; Hunt, J.P. The porphyry copper deposit at El Salvador, Chile. Econ. Geol. 1975, 70, 857–912. [Google Scholar] [CrossRef]
  3. Richards, J.P.; López, G.P.; Zhu, J.J.; Creaser, R.A.; Locock, A.J.; Mumin, A.H. Contrasting tectonic settings and sulfur contents of magmas associated with cretaceous porphyry Cu ± Mo ± Au and intrusion-related iron oxide Cu-Au deposits in northern Chile. Econ. Geol. 2017, 112, 295–318. [Google Scholar] [CrossRef] [Green Version]
  4. Candela, P.; Piccoli, P. Magmatic processes in the development of porphyry-type ore systems. One Hundredth Anniv. Vol. 2005, 25–37. Available online: https://pubs.geoscienceworld.org/books/book/1940/chapter/107706468/Magmatic-Processes-in-the-Development-of-Porphyry (accessed on 12 November 2020). [CrossRef]
  5. Parat, F.; Holtz, F. Sulfur partitioning between apatite and melt and effect of sulfur on apatite solubility at oxidizing conditions. Contrib. Mineral. Petr. 2004, 147, 201–212. [Google Scholar] [CrossRef]
  6. Marks, M.A.; Wenzel, T.; Whitehouse, M.J.; Loose, M.; Zack, T.; Barth, M.; Markl, G. The volatile inventory (F, Cl, Br, S, C) of magmatic apatite: An integrated analytical approach. Chem. Geol. 2012, 291, 241–255. [Google Scholar] [CrossRef]
  7. Rossi, M.; Ghiara, M.R.; Chita, G.; Capitelli, F. Crystal-chemical and structural characterization of fluorapatites in ejecta from Somma-Vesuvius volcanic complex. Am. Mineral. 2011, 96, 1828–1837. [Google Scholar] [CrossRef]
  8. Young, J.O.; Hanes, D.M.; Tappel, A.L. Chromatography of lysosomal enzymes on hydroxylapatite. J. Chromatogr. 1969, 44, 133–140. [Google Scholar] [CrossRef]
  9. Jarosewich, E.; Nelen, J.A.; Norberg, J.A. Reference samples for electron microprobe analysis. Geostand. Newsl. 1980, 4, 43–47. [Google Scholar] [CrossRef]
  10. Lapin, A.V.; Lyagushkin, A.P. The Kovdor Apatite–Francolite Deposit as a Prospective Source of Phosphate. Geol. Ore Deposit. 2014, 56, 61–80. [Google Scholar] [CrossRef]
  11. Fleet, M.E.; Liu, X.; Harmer, S.L.; Nesbitt, H.W. Chemical state of sulfur in natural and synthetic lazurite by S K-edge XANES and X-ray photoelectron spectroscopy. Can. Mineral. 2005, 43, 1589–1603. [Google Scholar] [CrossRef] [Green Version]
  12. Fleet, M.E. Xanes Spectroscopy of Sulfur in Earth Materials. Can. Mineral. 2005, 43, 1811–1838. [Google Scholar] [CrossRef] [Green Version]
  13. Farrell, S.P.; Fleet, M.E.; Stekhin, I.E.; Kravtsova, A.; Soldatov, A.V.; Liu, X.Y. Evolution of local electronic structure in alabandite and niningerite solid solutions [(Mn,Fe)S, (Mg,Mn)S, (Mg,Fe)S] using sulfur K- and L-edge XANES spectroscopy. Am. Mineral. 2002, 87, 1321–1332. [Google Scholar] [CrossRef]
  14. Callegaro, S.; Baker, D.R.; Min, A.D.; Marzoli, A.; Geraki, K.; Bertrand, H. Microanalyses link sulfur from large igneous provinces and mesozoic mass extinctions. Geology 2014, 42, 895–898. [Google Scholar] [CrossRef]
  15. Han, J.Y.; Guo, L.H.; Chen, W.S. Raman Spectra Atlas of Minerals; Geological Publishing House: Beijing, China, 2016. [Google Scholar]
  16. Chu, M.F.; Wang, K.L.; Griffin, W.L.; Chung, S.L.; O’Reilly, S.Y.; Pearson, N.J.; Iizuka, Y. Apatite composition: Tracing petrogenetic processes in Transhimalayan granitoids. J. Petrol. 2009, 50, 1829–1855. [Google Scholar] [CrossRef]
  17. Boyce, J.W.; Hervig, R.L. Apatite as a monitor of late-stage magmatic processes at Volcán Irazú, Costa Rica. Contrib. Mineral. Petrol. 2009, 157, 135. [Google Scholar] [CrossRef]
  18. Economos, R.; Boehnke, P.; Burgisser, A. Sulfur isotopic zoning in apatite crystals: A new record of dynamic sulfur behavior in magmas. Geochim. Cosmochim. Acta 2017, 215, 387–403. [Google Scholar] [CrossRef]
  19. Rukhlov, A.S.; Plouffe, A.; Ferbey, T.; Mao, M.; Spence, J. Application of Trace-Element Compositions of Detrital Apatite to Explore for Porphyry Deposits in Central British Columbia. 2016. Available online: https://www.semanticscholar.org/paper/Application-of-trace-element-compositions-of-to-for-Rukhlov-Plouffe/e3ea8c079ca63d0f74e1ee6286bfb51bbff18efe (accessed on 12 November 2020).
  20. Mao, M.; Rukhlov, A.S.; Rowins, S.M.; Spence, J.; Coogan, L.A. Apatite trace element compositions: A robust new tool for mineral exploration. Econ. Geol. 2016, 111, 1187–1222. [Google Scholar] [CrossRef]
  21. Rojas, P.A.; Barra, F.; Reich, M.; Deditius, A.; Simon, A.; Uribe, F.; Rojo, M. A genetic link between magnetite mineralization and diorite intrusion at the El Romeral iron oxide-apatite deposit, northern Chile. Miner. Deposita 2018, 53, 947–966. [Google Scholar] [CrossRef]
  22. Konecke, B.A.; Fiege, A.; Simon, A.C.; Parat, F.; Stechern, A. Co-variability of S6+, S4+, and S2− in apatite as a function of oxidation state: Implications for a new oxybarometer. Am. Mineral. 2017, 102, 548–557. [Google Scholar] [CrossRef]
  23. Boyce, J.W.; Liu, Y.; Rossman, G.R.; Guan, Y.; Eiler, J.M.; Stolper, E.M.; Taylor, L.A. Lunar apatite with terrestrial volatile abundances. Nature 2010, 466, 466–469. [Google Scholar] [CrossRef] [PubMed] [Green Version]
  24. Tanner, D.; Henley, R.W.; Mavrogenes, J.A.; Holden, P. Sulfur isotope and trace element systematics of zoned pyrite crystals from the el indio au-cu-ag deposit, chile. Contrib. Mineral. Petrol. 2016, 171, 33. [Google Scholar] [CrossRef] [Green Version]
  25. Zajacz, Z.; Candela, P.A.; Piccoli, P.M.; Sanchez-Valle, C. The partitioning of sulfur and chlorine between andesite melts and magmatic volatiles and the exchange coefficients of major cations. Geochim. Cosmochim. Acta 2012, 89, 81–101. [Google Scholar] [CrossRef]
  26. Burgisser, A.; Alletti, M.; Scaillet, B. Simulating the behavior of volatiles belonging to the C-O-H-S system in silicate melts under magmatic conditions with the software D-Compress. Compu. Geosci. 2015, 79, 1–14. [Google Scholar] [CrossRef] [Green Version]
  27. Fiegea, A.; Holtza, F.; Behrensa, H.; Mandevilleb, C.W.; Shimizuc, N.; Credea, L.S.; Göttlicherd, J. Experimental investigation of the S and S-isotope distribution between H2O-S±Cl fluids and basaltic melts during decompression. Chem. Geol. 2015, 393–394, 36–54. [Google Scholar] [CrossRef]
  28. Harlov, D.E. Apatite: A Fingerprint for Metasomatic Processes. Elements 2015, 11, 171–176. [Google Scholar] [CrossRef]
  29. Tran, L.K.; Stepien, K.R.; Bollmeyer, M.M.; Yoder, C.H. Substitution of sulfate in apatite. Am. Mineral. 2017, 102, 1971–1976. [Google Scholar] [CrossRef]
Figure 1. Optimised crystal structure of apatite.
Crystals 10 01032 g001
Figure 2. XRD spectra of the Durango and Kovdor apatites.
Crystals 10 01032 g002
Figure 3. Infrared reflectance spectra of DUR and KOV apatite. The red line and black line represent Durango apatite and Kovdor apatite, respectively.
Crystals 10 01032 g003
Figure 4. Raman spectra from selected grains of Durango apatite.
Crystals 10 01032 g004
Figure 5. Durango apatites and elemental maps obtained by micro-XRF mapping: (A) The gem-like Durango apatite crystals; (B) the distribution of Ca, Cl, Fe, P, S and Sr is shown.
Crystals 10 01032 g005
Figure 6. Sulphur XANES spectra of selected apatite samples from Durango, Kovdor and standard samples.
Crystals 10 01032 g006
Table 1. Unit-cell parameters of Durango and Kovdor apatites.
SamplesUnit-Cell Parameters
a(Å)c(Å)
DUR-19.3657 (77)6.8685 (16)
DUR-29.3659 (74)6.8984 (1)
KOV9.3892 (25)6.8891(1)
Ca5(PO4)3(OH) PDF#09-04329.41806.8840
Ca5(PO4)3F PDF#15-08769.36906.8840
Table 2. Representative EMPA major-element composition of Durango and Kovdor apatite.
SampleNa2OSiO2CaOP2O5SO3FeOFClTotal
DUR-10.230.553.639.970.320.072.970.4399.04
DUR-20.270.5354.241.030.310.023.150.42100.81
DUR-30.280.5153.8240.260.320.013.050.4499.73
DUR-40.260.5753.95410.320.053.010.39100.48
DUR-50.280.4154.1540.990.320.073.170.43100.6
DUR-60.270.3454.2540.860.340.043.010.42100.4
DUR-70.250.4954.1240.660.320.023.030.4100
DUR-80.210.4454.2540.860.340.073.060.41100.34
DUR-90.250.4954.0740.620.340.033.080.42100.01
DUR-110.290.3754.3440.980.340.033.050.43100.52
DUR-120.280.3454.29410.330.043.030.42100.43
DUR-130.280.3854.5541.180.340.042.960.41100.92
DUR-140.260.4354.4440.670.350.033.010.41100.34
DUR-150.280.4254.4140.680.340.0430.41100.37
DUR-160.30.3654.4540.940.350.033.110.41100.69
KOV1-10.2690.29452.20840.1510.0150.0071.4960.01494.621
KOV1-20.3010.25952.37539.9790.025-1.5950.01394.694
KOV1-30.2270.47652.26639.830.0110.0091.5570.01394.676
KOV2-10.2720.6152.00739.2650.0190.0021.630.01894.065
KOV2-20.2510.55452.11139.7380.0160.031.6380.02794.738
KOV2-30.2310.57952.21139.7330.0250.0091.5720.01794.731
KOV3-10.2180.44752.44839.9410.017-1.6250.0294.92
KOV3-20.2340.52752.25940.2270.0130.0211.8770.01795.252
KOV3-30.2580.49552.11239.9680.0130.0281.8940.01794.923
Table 3. The Sr and Y content of apatites.
SamplesSr (ppm)Y (ppm)
DUR-01477.86555.13
DUR-02478.34556.79
DUR-03477.73574.91
DUR-04480.6577.63
DUR-05480.55577.54
DUR-06474.93558.05
DUR-07477.54560.46
DUR-08477.57560.44
DUR-09482.11550.49
DUR-10480.93549.23
DUR-11480.76549.08
KOV-012767.97222.11
KOV-022771.66222.77
KOV-032726.27261.3
KOV-042739.79262.33
KOV-052740.4262.35
KOV-062771.72229
KOV-072784.01229.8
KOV-082785.06229.85
KOV-092612.97194.45
KOV-102604.21193.44
KOV-112601.36193.28
KOV-122801.04230.65
KOV-132785.84228.78
KOV-142781.77228.53
KOV-152688.25207.2
Publisher’s Note: MDPI stays neutral with regard to jurisdictional claims in published maps and institutional affiliations.

