Article

Structural, Spectroscopic, and Chemical Bonding Analysis of Zn(II) Complex [Zn(sal)](H2O): Combined Experimental and Theoretical (NBO, QTAIM, and ELF) Investigation

1
Department of Chemistry, Aligarh Muslim University, Aligarh-202002, India
2
Department of Chemistry, College of Science, King Saud University, P.O. Box 2455, Riyadh 11451, Saudi Arabia
3
Department of Chemistry, Faculty of Science, King Khalid University, P.O. Box 9004, Abha 62529, Saudi Arabia
4
Department of Chemistry, Science and Arts College, Rabigh Campus, King Abdulaziz University, Jeddah 21911, Saudi Arabia
*
Author to whom correspondence should be addressed.
Crystals 2020, 10(4), 259; https://doi.org/10.3390/cryst10040259
Submission received: 18 February 2020 / Revised: 23 March 2020 / Accepted: 25 March 2020 / Published: 29 March 2020

Abstract

:
The Zn(II) complex of salen-like scaffold [Zn(sal)](H2O) was synthesized and characterized by elemental analysis, IR, UV–Vis, and 1H-NMR spectroscopic techniques. The structure of complex was confirmed by single crystal X-ray diffraction studies. In the complex, Zn (II) was placed in the inner N2O2 compartment of the salen scaffold in square planar geometry and crystallized in the monoclinic space group P21/n. DFT and TDDFT calculations were performed to reproduce the experimentally observed structural and spectroscopic (IR and UV–vis) findings. The bonding of the Zn(II) framework in the [Zn(sal)](H2O) complex was explored in depth. The theoretical approaches employed were perturbation theory within the context of the natural bond orbital (NBO) framework, and quantum theory of atoms in molecule (QTAIM) and electron localization function (ELF) analysis. The study begins by delineating the difference between the NBO and QTAIM approaches. This paper thus exhibits the supportive nature of NBO theory and QTAIM in discussion of the bonding in the [Zn(sal)](H2O) complex, when both the methodologies are used in combination.

1. Introduction

Among inorganic chemists, metal–ligand and metal–metal bonds have apprehended the hearts and minds since Warner’s and Cotton’s paramount discovery of coordination compounds and quadruple metal–metal bonds (σ + 2π + δ) in [Re2Cl8]2−, respectively [1,2,3,4,5]. Additional significant findings include Hoffman and Pyykko’s contribution regarding strong closed-shell metal–metal (d10–d10) interactions or metallophilic interactions [6,7,8,9,10,11]. The metallophilic interactions are a form of non-covalent M···M interactions that are usually attributed to dispersion forces magnified by relativistic effects [12,13]. While much effort has been devoted to the metal–ligand and M–M bonding, recently, the study of metallophilic interactions has emerged as a topical area of research [14,15,16,17,18]. Additionally, such kind of bonding plays a leading role in the formation of a diverse class of inorganic complexes, where an in-depth understanding of electronic structure is quite essential for the study of bonding and associated chemical and physical properties with them [19,20,21]. Recently, several homo- and hetero-metallic systems having the existence of metallophilic interaction between the d10 closed-shell metal atoms, viz. Ag, Au, Pt, Pd, and Hg, etc., have been reported [22,23]. As a part of our contribution to this general area, we focused our attention on Zn···Zn interactions, which have remained extremely rare and less explored [24,25]. The inorganic system selected for study is the zinc complex of a salen-scaffold of square planar geometry that crystallizes as a dimer. The inorganic system selected for study is the zinc complex of the salen-scaffold with square planar geometry. Salen and its metal complexes constitute a prosperous class of inorganic complexes that are known for many applications in the field of inorganic chemistry, catalysis [26,27], biomedical [28,29,30,31], and material applications [32,33,34,35]. Their incredible popularity comes from their modular synthesis, permitting a range of structural variations, and their potential to coordinate a terrifically wide variety of diverse metal ions. Additionally, the two phenoxide and imine functions present are evocative of the coordination geometry produced through two tyrosine and two histidine residues encountered in a number of metalloenzymes [36,37,38]. This research work, therefore, contrasts with the understanding of Zn(II) complex bonding that has been gained from the analysis of the natural bond orbital (NBO) approach and quantum theory of atoms in molecule (QTAIM) and electron localization function (ELF) methods.
The NBO valency and bonding approach [39] is based on primarily specific foundations compared to those supposed by Pauling [40,41,42,43], Heitler and London [44], Hund and Mulliken, and other pioneers [45,46,47] of the developmental era of quantum chemistry theory. The different modern-day viewpoints trace common heritage to key prequential concepts primarily based on Bohr’s atomic model [48,49] and Lewis’s shared electron-pair concept of chemical bonding [50,51]. NBO theory is based fundamentally on the wavefunction ψ and its practical evaluation via contemporary computational methods. The disparate traditional valence bond theory (VBT) and molecular orbital viewpoints, NBO theory does not make any assumptions about the mathematical description of wavefunction. Nevertheless, the bonding illustration of the NBO approach is derived from perturbative, variational, and DFT approximations.
Nowadays, two different theoretical methods have become increasingly popular for analyzing the difficult bonding situation in various metal complexes, namely the quantum theory of an atom in molecule (QTAIM) [52] or electron localization function (ELF) [53,54,55,56]. The QTAIM allows chemists to grasp, anticipate, and interpret the experimental chemistry findings. The QTAIM is based on the topological description of electron density, which is a measurable quantity. A comprehensive characterization of metal–ligand and metal–metal bonding has been carried out by examining the topology of electron density within the framework of QTAIM [57,58]. Moreover, it may also proceed with molecular orbital (MO) theory to establish novel bonding solutions to chemical problems [59]. Herein, we demonstrate the supportive nature of NBO theory and QTAIM collectively by bridging the two methods in a dialogue of Zn–ligand bonding and Zn···Zn interactions in a Zn(II) complex of a salen-scaffold.

2. Experimental

2.1. General Considerations

All chemicals were procured from Sigma-Aldrich (Billerica, MO, USA) and used as received. FT-IR spectra were performed on a Perkin-Elmer Model 1320 spectrometer (Waltham, MA, USA) while the NMR spectra were acquired at 298 K on a Bruker DRX-400 spectrometer (Billerica, MA, USA) with Me2SO-d6 (solvent). Elemental analysis was carried out on a PerkinElmer 2400 Series II CHNS/O system (Waltham, MA, USA), and the sample was prepared by grinding and drying in vacuum at 90 °C for 48 h. The electronic spectrum was carried out on a PerkinElmer UV–vis spectrophotometer (Waltham, MA, USA). Fluorescence measurements were obtained on a RF-5301 PC spectrofluorometer (Schimadzu, Riverwood Drive Columbia).

2.2. Synthesis

To the solution of o-vanillin (304 mg, 2 mmol) in methanol was added racemic (R,S/S,R) DACH (0.12 mL, 1 mmol). The reaction mixture was allowed to stir for 3 h at 70 °C to get a deep yellow solution. To the above reaction was added a solution of ZnCl2 (136 mg, 1 mmol) in methanol, refluxed for 2 h. Then the volume was reduced and filtered under cold conditions. Under slow evaporation of filtrate, light yellow colored crystals were obtained after 10–15 days. The crystals obtained were washed with acetone and air dried. Yield 409 mg (88%), M.P. 310 °C. Anal. Calc. for [C22H24N2O4Zn] (%): C, 59.27; H, 5.43; N, 6.28; Found: C, 59.14; H, 5.58; N, 6.21. 1H NMR (400 MHz, d6-DMSO, TMS): δ ppm 8.40 (s, 2H), 6.81–6.76 (m, 4H), 6.35–6.31 (m, 2H), 3.70 (s, 6H), 2.07 (d, 2H), 1.88 (s, 1H), 1.54 (d, 2H), 1.41 (m, 5H). UV–vis (1 × 10⁻⁴ M, MeOH, λmax nm): 242, 272, 368, 590 nm.

2.3. X-ray Diffraction Studies

Single crystal X-ray data were collected at 100 K using the Bruker SMART APEX CCD diffractometer on graphite monochromatic Mo Ka radiation (0.71073 Å). The International Table for X-ray crystallography was applied to the linear absorption coefficient, scattering factors for the atoms, and anomalous dispersion correction [60]. The data integration and reduction were worked out with SAINT software [61]. For the collected reflections with SADABS [62], empirical absorption correction was applied, and the space group was defined using XPREP [63].
The structure was solved and refined with the Olex2 1.3 [64,65] package. Only a few H atoms could be located in the difference Fourier maps in the structure. The remaining were positioned in calculated positions using idealized geometries (riding model) and assigned fixed isotropic displacement parameters. All non-H atoms were refined anisotropically. The refinement and crystal data are presented in Table 1. Selective bond distance and angles are given in Supplementary Materials Tables S1 and S2.

2.4. Computational Details

The DFT level of theory has been used to carry out geometry optimization with the help of Gaussian-09 [66] using the B97D functional [67]. The calculations were performed using cc-PVTZ basis sets [68] for all atoms. No symmetry restrictions were applied during geometry optimization. The self-consistent reaction field (SCRF) method was applied in all the geometry optimizations to consider the solvent effect (methanol was used as solvent). For the optimized structures, the Hessian matrix was calculated analytically in order to verify the location of correct minima (no imaginary frequencies). The TDDFT calculation was performed at the cam-B3LYP/cc-PVTZ level of theory on the optimized structures, also with the self-consistent reaction field (SCRF) method to consider solvent effect (methanol was used as solvent) [69]. The NBO calculations were performed with the NBO 3.1 package [70] on the experimental X-ray geometries using B97D functional and cc-PVTZ basis sets. The QTAIM and ELF analysis was performed with the Multiwfn software [71] on wave functions generated with Gaussian 09 at the same level of theory as used for NBO analysis.

3. Result and Discussion

3.1. Synthesis and Spectroscopic Characterization

The solid state IR spectrum (Figure 1) of [Zn(sal)](H2O) displayed a characteristic band at 1628 cm−1 due to the Zn(II) coordinated azomethine (C=N) group of the salen scaffold [72]. The bands due to C–H stretching vibrations appeared in the range of 2932–3050 cm−1 [73]. Another sharp and strong band at 1241 cm−1 was indicative of aliphatic C–N stretching vibrations [74]. A broad band at 3204 cm−1 pointed to the presence of the O–H stretching frequency of the water molecule in [Zn(sal)](H2O) [75]. Additionally, the IR spectrum was also computed using the B97D/DFT method to assign the vibrational bands (Figure 1). The computed IR spectrum reproduced major characteristic bands with slight deviation. This variation in bands was due to the fact that DFT based frequency measurements were done on an isolated molecule (gas-phase), whereas the experimental data were obtained from the solid state material. Additionally, the experimental frequencies contained both harmonic and anharmonic oscillations, whereas theoretical values contained only harmonic oscillations.
The electronic absorption spectra of [Zn(sal)](H2O) complex in methanol (MeOH) was recorded at room temperature (Figure 2). The solution spectrum of [Zn(sal)](H2O) displayed two absorption bands. The first absorption band centered in the range of 260–300 nm could be assigned to a π–π* transition of the aromatic part and n–π* electronic transitions of the nonbonding electrons of the azomethine nitrogen atoms [76]. The second absorption band in the range of 320–400 nm could be attributed to intermolecular metal–ligand interactions within the whole complex (metal–ligand (d–π*) charge transfer (MLCT band)) [77,78]. Moreover, TDDFT calculation were also performed to characterize electronic transition for the experimentally observed peaks. The UV–vis spectrum obtained by TDDFT was in good agreement with the UV–vis spectrum observed experimentally. Additionally, at room temperature, the luminescence nature of [Zn(sal)](H2O) in methanol was analyzed (Figure 2). The [Zn(sal)](H2O) was found to have an intense emission band at λem = 500 nm (λex = 280 nm) (Figure 2).
The 1H NMR spectrum (Figure S1) of [Zn(sal)](H2O) exhibited a characteristic multiplet aromatic signature of the coordinated ligand framework at 6.81–6.76 ppm [79]. A cyclohexane ring proton signature in the form of sharp multiplets at 2.07–1.41 ppm was attributed to the merging of axial and equatorial ring protons [80,81], as highly deshielded imine protons appeared in the form of a prominent singlet at 8.40 ppm. The signal for –OCH3 protons was observed at 3.70 ppm [79].

3.2. X-ray Structure Investigation

X-ray quality crystals of [Zn(sal)](H2O) were obtained by layering ether on a saturated methanolic solution of [Zn(sal)](H2O). The X-ray crystal structure determination revealed that compound [Zn(sal)](H2O) crystallized in monoclinic space group P21/n with two complexes in the asymmetric unit forming a head-to-tail dimer with an almost parallel arrangement (Figure 3). Table 1 contains crystallographic data and refinement details. In Table 2 and Supplementary Materials Tables S1 and S2 (ESI), the geometric parameters, viz. bond lengths and bond angles, are given.
The two independent complexes are close comparable except for the chirality at carbons of cyclohexyl rings (C9/C14 S; C31/C36 R) connected to N atoms. Due to similarity of complexes the structural description will be limited to complex Zn1. The central Zn2+ center is coordinated by the inner cis-N2O2 core (Zn1–N1 = 1.855(5) Å, Zn1–N2 = 1.856(5) Å, Zn1–O2 = 1.859(4) Å, Zn1–O3 = 1.851(4) Å) of the di-anionic deprotonated ligand (L)−2 (Figure 4). The N2O2 coordinated zinc center exhibits slightly distorted square planar geometry with N–Zn–O angles of 175.77(19)° and 175.70(19)°. The two H2O molecules are co-crystallized and bounded to each [Zn(L)] complex by forming bridging hydrogen bonds with the methoxy groups (–OCH3) of the salen scaffold. The crystal packing diagram suggested that molecules are in a parallel arrangement with each other in a head-to-tail fashion and assembled with by weak π–π stacking and Zn···Zn interactions (Figure S2). The centroid–centroid (C2–C7:C24–C29 and C16–C21:C38–C43) distances of the aromatic rings of the salen-scaffold is found to be 3.97 and 4.36 Å. The plane of the coordinated ligand is slightly twisted with 11.90° angle from the central Zn2+ (Figure S3). Further inspection of the structure indicates that the zinc atoms are separated to each other by 3.539 Å. However, the Zn···Zn distance is not significantly shorter than the sum of the van der Waals radii of the two zinc atoms, suggesting that the Zn···Zn interaction bears a small donor–acceptor component and are mostly of dispersive nature, further investigated through the DFT based NBO, QTAIM and ELF methods.

3.3. Zn–Ligand Bonding and Zn···Zn Interaction

3.3.1. Reproducing the Structures

DFT calculations were used to calculate the geometric parameters, viz. bond distances, bond angles, and Zn···Zn distance. Geometry optimization was performed without employing any constraint followed by harmonic frequency calculations, which revealed that calculated structures corresponded to minima (without any imaginary frequencies). The self-consistent reaction field (SCRF) method was applied in all the geometry optimizations to consider the solvent effect (methanol was used as solvent). The calculated geometric parameters were corroborated well with the corresponding experimental values (Figure S4, Table 2). The calculated bond angles showed more deviations in comparison to bond distances in the dimeric structure, while in the monomeric structure, larger deviations were encountered in bond distances due to the fact that the experimental data were obtained from the solid state of the compound. Additionally, the lattice within the crystal structure of the zinc complex resulted in intra- and intermolecular interactions, while the calculated values referred to a zinc complex molecule in the solvent phase with no interactions from neighboring atoms. Theory reproducing the structures is essential and is required in the beginning. However, it gives little information regarding the bonding. For deeper insight into the nature and strength of Zn–O/Zn–N and Zn···Zn (d10–d10) interactions, we carried out NBO, QTAIM, and ELF analysis in detail.

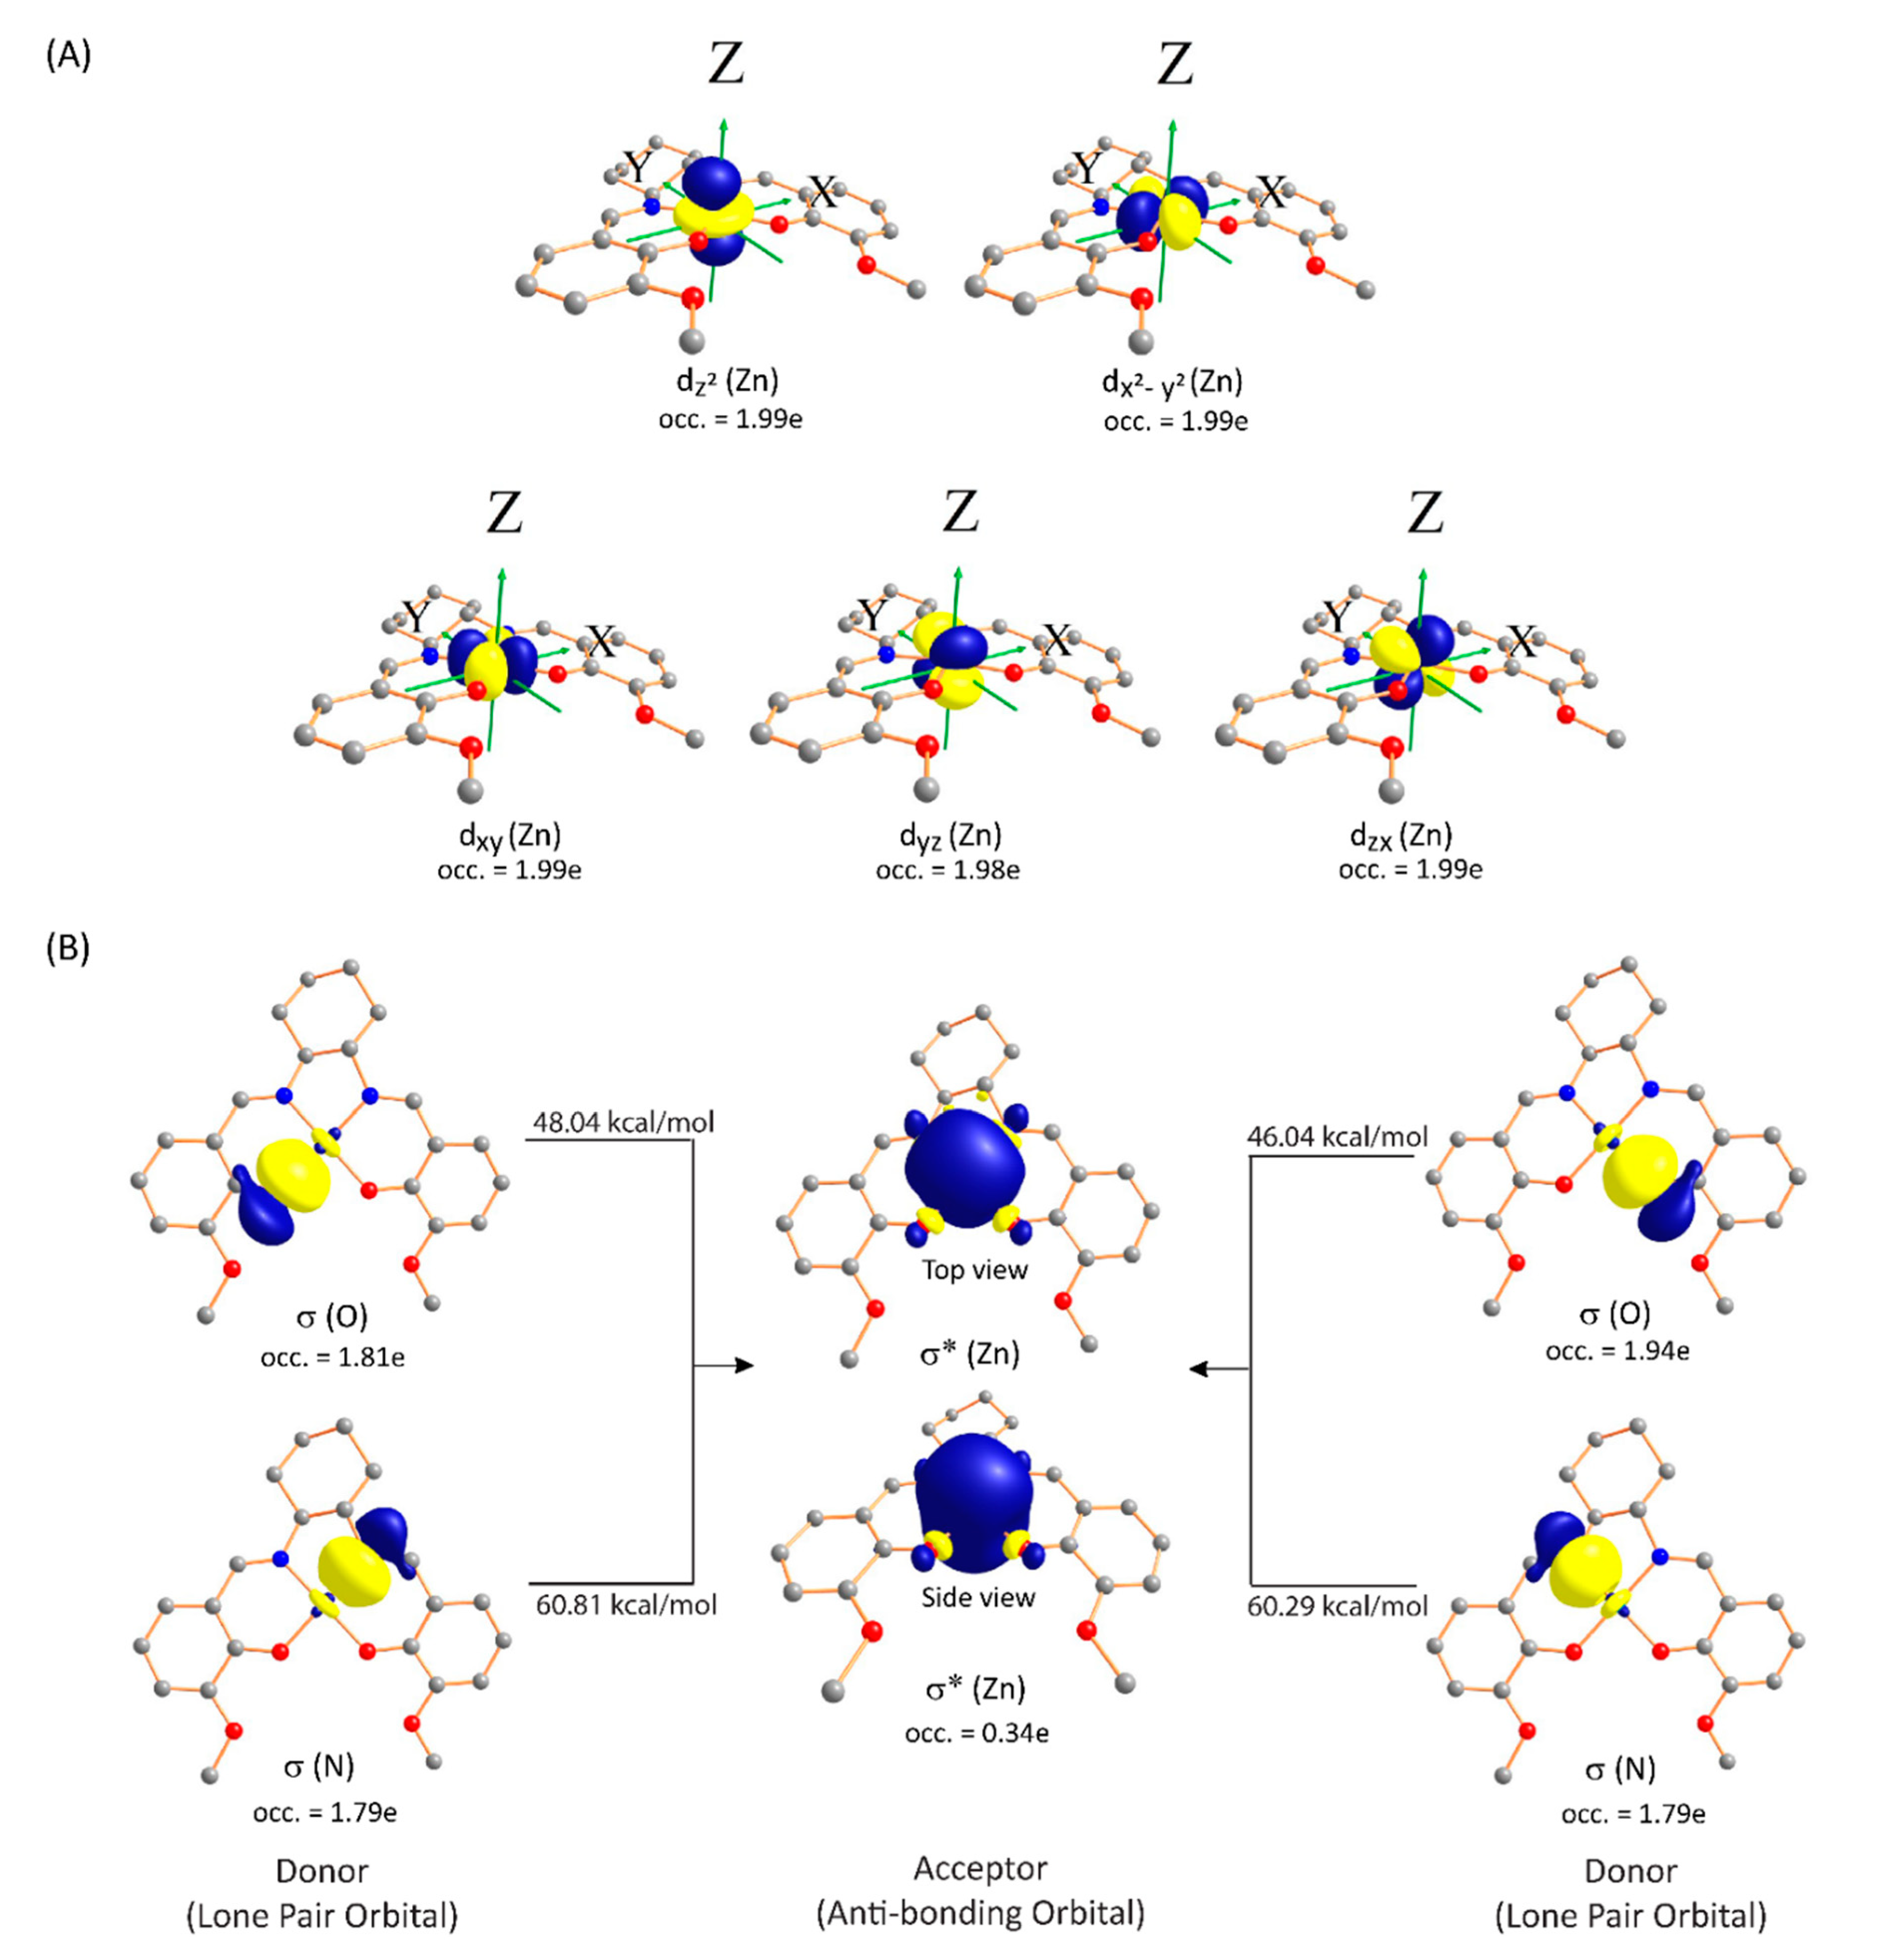
3.3.2. Natural Bond Orbital (NBO) Analysis

Natural Population Analysis

Wiberg bond indices (WBIs) were calculated to probe the nature of the Zn–O and Zn–N bonds, as depicted in Table 3. The WBI of the Zn–O bond was bigger than that of the Zn–N bond, indicating that the Zn–O bond was shorter than the Zn–N bond and showing a weakly covalent character. The calculated natural atomic charges (NAC), natural electron configuration (NEC) of the Zn, N, and O atoms on the zinc complex obtained from an NBO analysis, are reported in Table 3. The NEC of the Zn ion was 4s0.373d9.944p0.45, whereas the NEC of free Zn ion was 4s3d104p. Hence, the difference between the d-orbital occupancy of the Zn ion (3d9.94) after complexation and that in the free ion (3d10) was negligible. The s-orbital occupancy of Zn ion increased slightly when going from the free ion to the complex. Additionally, the natural charge on the Zn ion (+2.0 e) changed significantly after complexation (+1.23501 e), showing that electron transfer occurred from N (2s, 2p) and O (2s, 2p) orbitals to Zn orbitals (4s). For the dimeric structure, a similar interpretation of the NEC and NAC results was observed. Additionally, the Wiberg bond order for Zn1···Zn2 was found to be 0.0221, which supports the presence of weak intermetallic interactions.

Second Order Perturbation Theory Analysis of Fock Matrix in NBO Basis

Metal–ligand bonding (dative bonding) and metal–metal interactions were studied with NBO perturbation theory. There are different levels of localization within the NBO approach. One level is that of natural localized molecular orbitals (NLMO), which represents the first step in diagonalization of the density matrix (MO → NLMO). A Slater determinant of NLMOs is comparable to the determinant of the wave function of the canonical molecular orbitals. The next step of diagonalization establishes the relationship between NBO and the corresponding NLMOs to determine how well the chosen Lewis structure describes the electronic density of a given system. The NBO description of a target orbital for [Zn(sal)](H2O) corresponds to >90% of an NLMO. Thereby the nature of Zn–O/Zn–N bonding and Zn···Zn (d10–d10) interactions can be further investigated. With this methodology, more insight can be gained into the orbital interactions that affect the non-Lewis bonding. Herein, this type of interaction is denoted as “donor–acceptor”. The chemical strength of donor–acceptor interactions can be obtained by analyzing interactions between filled Lewis-type NBOs (lone-pair orbitals, filled) and empty (antibonding lone pair orbitals, empty) non-Lewis NBOs from the second-order perturbation theory analysis of the NBO based Fock matrix. As a result of these orbital interactions, localized NBOs of an idealized Lewis structure lose their occupancy to empty non-Lewis orbitals (and thus deviate from an idealized definition of Lewis structure); they are referred to as delocalization corrections to the zeroth-order natural Lewis structure (E(2)i→j). We found these to be useful analytical tools to describe the nature of metal–ligand bonding and metal–metal interactions [82].
The predominant donor–acceptor orbital interactions were found to be the metal–ligand bonds involving Zn–N and Zn–O, σ bonds, or Zn 3d-orbitals as Lewis base and a Zn–ligand antibonding orbital of a predominantly Zn 4s character, such as acid [83]. The spatial orientation of the Zn 3d orbitals and the Zn–N/Zn–O bonds of [Zn(sal)](H2O) are depicted in Figure 4. The acceptor orbital on the d10 metal fragment was generally recognized by the program as “lone vacancy” (LP*), i.e., an empty orbital, and herein denoted as σ*. In the [Zn(sal)](H2O), it was assigned to be an antibonding orbital between the metal and the ligand. Regardless of the notation given by the software, the acceptor orbital displayed a predominant 4s contribution. The vacant 4p orbitals on Zn were found as Rydberg states (RY*) and also showed similar interactions with the aforementioned donor orbitals as the LP did. The highly delocalized RY orbital was difficult to interpret from a chemically meaningful perspective, and as the interaction energies with such orbitals were generally substantially lower than with the LP orbitals; the RY states were not studied in detail. The interaction of the metal LP* orbital with the N/O LP orbitals was significant and 45–60% of the interaction energy of the Zn–N/Zn–O bonds with the LP*. The donor–acceptor orbital interaction energies are illustrated in Figure 4.
Furthermore, we also employed NBO methodology to elucidate whether the Zn···Zn interaction in the [Zn(sal)](H2O) dimer was metallophilic in nature or only weakly dispersive in nature [84,85,86]. The NBO analysis was investigated for all possible combinations of donor and acceptor orbitals between the Zn atoms. The orbital interaction between the bonding lone-pair orbitals (filled) of Zn1 and antibonding lone-pair orbitals (empty) of Zn2 and vice versa were observed and contributed to the Zn···Zn interaction. The effective interactions between d-type lone-pair orbitals (3dz2) and the σ* antibonding orbitals of Zn atoms were responsible for the presence of Zn···Zn interactions in the dimeric structure of the [Zn(sal)](H2O) complex. The donor–acceptor interactions 3dz2 (Zn1) → σ* (Figure 5). The values of the second order stabilization energy ΔE(2) and also the difference between (Zn2) and 3dz2 (Zn2) → σ* (Zn1) were stabilized by ΔE(2) of 0.93 and 0.96 kcal mol−1, respectively them were very small, which ruled out the existence of metallophilic interactions between the zinc atoms [87,88,89]. Hence, the small values of ΔE(2) indicated that the Zn···Zn interaction was attractive and dispersive in nature.

3.3.3. Quantum Theory of Atoms in Molecules (QTAIM) Analysis

Nowadays, Bader’s theory (QTAIM) has emerged as a powerful tool to explore different forms of chemical interactions on the basis of electron density topology [90,91]. These comprise ionic, covalent, and hydrogen bonds, and agnostic interactions. Now QTAIM is also employed to a greater extent for the analysis of various weaker types of interactions that are more complicated to be elucidated, viz. van der Waals or metal–metal interactions [92]. Generally, a benchmark criterion is based on the cross-atomic distances to characterize a weak interaction, and if this is less than the sum of the van der Waals radii, an interaction is likely to take place. However, this only gives a qualitative description, and more accurate and quantitative description of a specific interaction can be obtained within the framework of QTAIM analysis. QTAIM specifies that a bond path is a single maximum line of electron density that connects the nuclei of both atoms in an equilibrium configuration and where the potential energy is stabilized maximally, and a bond critical point is present in the bond path where the electron density gradient vanishes [93]. In addition, the nature of chemical bonding and interactions is evaluated in terms of the electron density ρ(r) and its Laplacian ∇2ρ(r), the ellipticity, Hessian eigen values, potential V(r), kinetic G(r), and total energy densities H(r) at the bond critical points (BCPs). Greater electron density at BCPs indicates greater structural stability. A closed shell interaction as found in ionic and hydrogen bonds is defined by a positive ∇2ρ(r) value at BCPs, while its negative value suggests shared interaction as covalent interactions [94]. The potential energy is dominant, and a negative charge is concentrated when the Laplacian value is negative, while the kinetic energy dominates, and depletion of negative charge occurs if the Laplacian value is positive. The virial theorem relates G(r) and V(r) of local electron to ∇2ρ(r) by the equation
2ρ(r)/4 = 2Gc + Vc
The sum of G(r) and V(r) is equivalent to total energy density H(r). Cremer and Kraka have advocated that the sign and magnitude of the total energy density H is a useful indicator of the nature of a bonded chemical interaction [94]. The negative H(r) indicates a covalent interaction, while the positive indicates an ionic interaction. Nonetheless, metal–ligand and metal–metal bonding, H(r) is typically negative and close to zero, whereas ∇2ρ(r) > 0. At BCPs, positive and negative ∇2ρ(r) values are indicative of closed-shell and shared-electron interactions, respectively [92].
Bianchi et al. refined this classification and suggested three bonding regimes based on the value of potential energy density (VBCP)/kinetic energy density (GBCP) [95]. According to Bianchi et al., if the VBCP/GBCP > 2, then a shared-shell area of covalent bonds is present, although if VBCP/GBCP < 1, a closed-shell region of ionic bond is present, and 1 < VBCP/GBCP < 2 suggests ionic bonds of a small amount of covalency and dative or coordinate bonds. A similar kind of conclusion was also drawn by Machi et al. based on the above criterion for the classification of chemical interactions [96].
Based on the above described various QTAIM parameters, all C–N, C–C, C–H, and C–O bonds in the free ligand have topological features of the electron density that are unfailing with a shared (covalent) interaction where the density potential energy dictates the density of kinetic energy. The electron density ρ(r) values at BCPs were found to be in the range of 0.327–0.334 a.u. for C–O bonds, 0.298–0.314 a.u. for C–C bonds, and 0.246–0.383 a.u. for C–N bonds (Table 4, Figure S5), indicating that the strength of these bond follow the trend C–C < C–O < C–N, even though the C–C, C–O, and C–N bond distances also follow the reverse trend C–C > C–O > C–N.
The coordination of Zn(II) with salen-scaffold induced the electron density redistribution at many critical points in the salen-scaffold as a result of the Zn(II) ion’s polarizing effect. There was a slight elongation of the C–O bond with concomitant increases in the bond critical point electron density, while the Laplacian of electron density was negative in both the cases, albeit smaller in magnitude in the free ligand as compared to [Zn(sal)](H2O). In the case of the C–N bond, slight compression was observed on the coordination of ligand to the zinc ion and related electron density and Laplacian of electron density decreased while the sign of ∇2ρ(r) was reversed. According to Machi’s recent classification, the bond critical point descriptors related to the four Zn–ligand bonds in the central coordination center are consistent with the existence of coordinate and/or dative Zn–ligand bonds (Table 4, Figure 6). The calculated topological parameters were coherent with the previously reported data for zinc complexes [97,98,99,100]. In such bonds, the VBCP/GBCP ratio indicates to the intermediate bond system (1 < VBCP/GBCP < 2); conferring to the previously described classification of Bianchi et al., it should be additional to those Zn–ligand bonds that unveil lower electron density values (0.09 < ρ(r) < 0.13 a.u.) and higher positive Laplacian values ∇2ρ(r), going from +0.54 a.u. to +0.60 a.u. Such parametric values are the typical signature of ionic bonding but show negative H(r) values at BCPs, which imply a degree of covalency is also present.
Moreover, the topological analysis of the electron density was also investigated in the dimeric form of the [Zn(sal)](H2O) as observed in the asymmetric unit of the crystal structure. In the dimeric structure, a number of BCPs were observed between the monomeric units with different values of the topological parameters (ρ(r), ∇2ρ(r), V(r), G(r), and H(r)) at BCPs for Zn–O and Zn–N bonds (Figure 6). Importantly, also observed was a bond critical point between the two zinc atoms (Zn1···Zn2), clearly suggesting the presence of Zn1···Zn2 interactions (Figure 7). Herein, we do not claim the metallophilic interaction between the Zn atoms, because the distance between them was slightly more than the addition of their van der Walls radii, but the existence of a BCP supports the presence of a weak Zn···Zn interaction. The electron density at BCP was small (0.00479 a.u.), and both ∇2ρ(r) (0.01073 a.u.) and H(r) (0.00035 a.u.) were positive, and the negative charge depletion was occurring as the kinetic energy was dominated over the potential energy, which indicated the closed shell interaction [101]. Additionally, there is scarce literature regarding the occurrence of Zn···Zn metallophilic interactions. Various other bond critical points were also observed amongst the two monomeric entities. The detailed description of the topological parameters, type, and strength of interactions is given in Table 4.

3.3.4. Electron Localization Function (ELF) Analysis

The electron localization function is currently being used to evaluate electron localization between the chemically bounded atoms, as a simple and useful quantum-mechanical method [102]. The ELF is mapped on the interval (0, 1) and describes the Pauli repulsion effect at a point where two atoms interact. The ELF value indicates the probability that two electrons with the same spin α will be found in the given space (Pauli repulsion). Hence, ELF could also be used as an effective tool for the characterization of the bonding, specifically metal–ligand bonding [103]. Purely ionic bonding produces high ELF values near the nuclei (approximately 1.0) and very low (approximately 0) in the interstitial region. For covalent bonding, depending on the bond’s strength, the ELF values that binds two atoms vary from 0.6 to 1.0 [101]. The ELF analysis of the [Zn(sal)]H2O complex exhibited clearly that the valence and core basins were located around Zn and N/O atoms, whereas absence of a di-synaptic basin in the region of interaction (lack of attraction in this region) revealed the absence of strong covalent interactions. However, the ELF analysis values at BCPs for the Zn–N and Zn–O bond were 0.19 and 0.14, respectively. A color-filled map of the ELF in the regions of interaction demonstrated almost no electron pairing density between Zn and N/O nuclei. Furthermore, in the dimeric form, the ELF value between the two Zn atoms was found to be 0.027, indicating the existence of weak Zn···Zn interactions, also reflected in the color-filled map (Figure 7).

4. Conclusions

We investigated Zn–ligand bonding and Zn···Zn interactions in both monomeric and dimeric structures of the [Zn(sal)](H2O) complex. The Zn(II) complex was obtained by the reaction of salen ligand and ZnCl2, which led to the species [Zn(sal)](H2O). The [Zn(sal)](H2O) was fully characterized by various spectroscopic techniques. In the complex, Zn (II) is placed in the inner N2O2 compartment of the salen scaffold in square planar geometry and crystallizes in the monoclinic space group P21/n (Z = 8). The dimeric species of [Zn(sal)](H2O) complex was made through self-assembly. The self-assembly is governed by intermolecular forces, principally by π–π stacking and Zn···Zn interactions.
To investigate the electronic, bonding, and spectroscopic properties of the [Zn(sal)](H2O) complex, a series of DFT measurements were carried out. The geometric parameters and IR spectrum simulated using B97D/cc-pVTZ method established a good match with the resulting experimental data. The electronic absorption spectrum of [Zn(sal)](H2O) complex was calculated by employing the TDDFT approach with cam-B3LYP/cc-pVTZ methods and reproduced the major spectral features of the experimentally observed spectrum. NBO analysis demonstrated that in the [Zn(sal)](H2O) complex, the Zn(II) ion coordinates to N and O atoms via donation of lone pair electrons from N and O atoms to the 4s orbital of the Zn(II) ion. The associated second order perturbation energies with the Zn–N and Zn–O coordination were found to be 60.0 and 46–48 kcal/mol, respectively, which indicated the Zn–N bond was stronger than the Zn–O bond, which also was supported by Wiberg bond indices analysis. The Wiberg bond index and donor–acceptor perturbation energy for Zn···Zn were found to be 0.0221 and 0.09–0.42 kcal/mol, respectively, which validated the presence of attractive Zn···Zn interactions. The QTAIM analysis revealed that the strength of Zn–N bond is greater than the Zn–O bond and mostly electrostatic in nature with a significant degree of covalency. In the dimeric structure, a bond critical point (BCP) was observed between the Zn(II) ions, which implies the presence of attractive Zn···Zn interactions that originate from the dispersive forces. All the bonding observations by NBO and QTAIM analysis were further supported by the ELF results.

Supplementary Materials

The following are available online at https://www.mdpi.com/2073-4352/10/4/259/s1, Figure S1: Figure S1. 1H NMR spectra (in d6-DMSO at 295 K) of [Zn(sal)](H2O). Figure S2. Diagram illustrating the molecular packing of [Zn(sal)](H2O) in the unit cell (H atoms have been omitted for clarity). Figure S3. Diagram illustrating the calculated angle θ between the least-square planes of C1C2C3C4C5C6C7C8O1O2N1 (red) and C22C20C19C18C17C16C15C21O3O4N2 (green) of ligand of [Zn(sal)](H2O) as a representative case. Figure S4. DFT optimized structures of (A) monomer and (B) dimer of the [Zn(sal)](H2O) at the B97D/cc-pVTZ level of theory. Figure S5. QTAIM analysis of free ligand: (A) molecular graph of free ligand, showing the bond path (BP) and electron density (ρ) computed at bond critical points (BCPs). (B) Contour line plots of the electron density ρ. (C) Contour line plots of the Laplacian distribution of electron density ∇2ρ(r); the solid (red) and dashed (blue) lines corresponds to positive and negative values of ∇2ρ(r) respectively. (D) Surface maps of electron localization function (ELF). Bond paths are shown as green lines, selected zero-flux surfaces or interbasin paths as blue lines, bond critical points, BCPs, (3, −1) are shown in blue. Table S1. Bond Lengths in Å for [Zn(sal)](H2O); Table S2. Bond Angles for [Zn(sal)](H2O).

Author Contributions

Conceptualization, M.U. and R.A.K.; Data curation, M.U. and A.A.; Formal analysis, M.U., A.A., W.A. and M.H.J.; Investigation, R.A.K., W.A., K.H.A., M.H.J. and M.A.K.; Methodology, R.A.K.; Project administration, A.A.; Supervision, R.A.K. and S.T.; Validation, K.H.A.; Writing—original draft, M.U. and R.A.K.; Writing—review and editing, R.A.K. and S.T. All authors have read and agreed to the published version of the manuscript.

Funding

The authors are grateful to the Deanship of Scientific Research, King Saud University, for funding this work through group no. 1438-006.

Acknowledgments

The authors are grateful to the Deanship of Scientific Research, King Saud University, for funding this work through group no. 1438-006. The authors also thank the Deanship of Scientific Research and RSSU at King Saud University for their technical support. The author M.U. is highly thankful to the computer center, IIT Kanpur, India, for providing the high performance computation (HPC) facility.

Conflicts of Interest

The authors declare no conflict of interest.

References

  1. Werner, A. About the spatial change of position when converting space isomeric compounds. Ber. Dtsch. Chem. Ges. 1911, 44, 873–882. [Google Scholar] [CrossRef] [Green Version]
  2. Kauffman, G.B. Foundation of nitrogen stereochemistry: Alfred Werner’s inaugural dissertation. J. Chem. Educ. 1966, 43, 155. [Google Scholar] [CrossRef]
  3. Constable, E.C.; Housecroft, C.E. Coordination chemistry: The scientific legacy of Alfred Werner. Chem. Soc. Rev. 2013, 42, 1429–1439. [Google Scholar] [CrossRef] [PubMed]
  4. Werner, H. Alfred Werner: A Forerunner to Modern Inorganic Chemistry. Angew. Chem. Int. Ed. 2013, 52, 6146–6153. [Google Scholar] [CrossRef]
  5. Cotton, F.A.; Curtis, N.F.; Harris, C.B.; Johnson, B.F.G.; Lippard, S.J.; Mague, J.T.; Robinson, W.R.; Wood, J.S. Mononuclear and polynuclear chemistry of rhenium (III): Its pronounced homophilicity. Science 1964, 145, 1305–1307. [Google Scholar] [CrossRef]
  6. Dedieu, A.; Hoffmann, R. Platinum (0)-platinum (0) dimers. Bonding relationships in a d10-d10 system. J. Am. Chem. Soc. 1978, 100, 2074–2079. [Google Scholar] [CrossRef]
  7. Jiang, Y.; Alvarez, S.; Hoffmann, R. Binuclear and polymeric gold (I) complexes. Inorg. Chem. 1985, 24, 749–757. [Google Scholar] [CrossRef]
  8. Merz, K.M.; Hoffmann, R. d10-d10 Interactions: Multinuclear copper (I) complexes. Inorg. Chem. 1988, 27, 2120–2127. [Google Scholar] [CrossRef]
  9. Pyykkö, P.; Li, J.; Runeberg, N. Predicted ligand dependence of the Au(I)···Au(I) attraction in (XAuPH3)2. Chem. Phys. Lett. 1994, 218, 133–138. [Google Scholar] [CrossRef]
  10. Pyykkö, P.; Mendizabal, F. Theory of the d10–d10 Closed-Shell Attraction: 2. Long-Distance Behaviour and Nonadditive Effects in Dimers and Trimers of Type [(x-Au-L)n](n = 2, 3; X = Cl, I, H; L = PH3, PMe3,-N≡ CH). Chem. Eur. J. 1997, 3, 1458–1465. [Google Scholar]
  11. Pyykkö, P. Strong closed-shell interactions in inorganic chemistry. Chem. Rev. 1997, 97, 597–636. [Google Scholar] [CrossRef] [PubMed]
  12. Pyykko, P. Theoretical chemistry of gold. Angew. Chem., Int. Ed. 2004, 43, 4412–4456. [Google Scholar] [CrossRef] [PubMed]
  13. Pyykko, P. Theoretical chemistry of gold. II. Inorg. Chim. Acta 2005, 358, 4113–4130. [Google Scholar] [CrossRef]
  14. Cotton, F.A.; Murillo, C.A.; Walton, R.A. (Eds.) Multiple Bonds between Metal Atoms, 3rd ed.; Springer: Berlin, Germany, 2005. [Google Scholar]
  15. Liddle, S.T. (Ed.) Molecular Metal-metal Bonds: Compounds, Synthesis, Properties; Wiley-VCH: Weinheim, Germany, 2015. [Google Scholar]
  16. Sculfort, S.; Braunstein, P. Intramolecular d10–d10 interactions in heterometallic clusters of the transition metals. Chem. Soc. Rev. 2011, 40, 2741–2760. [Google Scholar] [CrossRef] [PubMed] [Green Version]
  17. Jones, J.S.; Gabbai, F.P. Coordination-and redox-noninnocent behavior of ambiphilic ligands containing antimony. Acc. Chem. Res. 2016, 49, 857–867. [Google Scholar] [CrossRef]
  18. Tsipis, A.C. DFT challenge of intermetallic interactions: From metallophilicity and metallaromaticity to sextuple bonding. Coord. Chem. Rev. 2017, 345, 229–262. [Google Scholar] [CrossRef]
  19. Doyle, M.P.; Duffy, R.; Ratnikov, M.; Zhou, L. Catalytic carbene insertion into C− H bonds. Chem. Rev. 2010, 110, 704–724. [Google Scholar] [CrossRef]
  20. Georgiev, V.P.; Mohan, P.J.; DeBrincat, D.; McGrady, J.E. Low-symmetry distortions in Extended Metal Atom Chains (EMACs): Origins and consequences for electron transport. Coord. Chem. Rev. 2013, 257, 290–298. [Google Scholar] [CrossRef]
  21. Kampa, M.; Pandelia, M.E.; Lubitz, W.; van Gastel, M.; Neese, F. A metal–metal bond in the light-induced state of [NiFe] hydrogenases with relevance to hydrogen evolution. J. Am. Chem. Soc. 2013, 135, 3915–3925. [Google Scholar] [CrossRef]
  22. Xia, B.-H.; Zhang, H.-X.; Che, C.-M.; Leung, K.-H.; Phillips, D.L.; Zhu, N.; Shou, Z.-Y. Metal− Metal Interactions in Heterobimetallic d8−d10 Complexes. Structures and Spectroscopic Investigation of [M ‘M “(μ-dcpm)2 (CN)2]+(M‘ = Pt, Pd; M“ = Cu, Ag, Au) and Related Complexes by UV− vis Absorption and Resonance Raman Spectroscopy and ab Initio Calculations. J. Am. Chem. Soc. 2003, 125, 10362–10374. [Google Scholar]
  23. Lopez-de-Luzuriaga, J.M.; Monge, M.; Olmos, M.E.; Pascual, D. Experimental and Theoretical Comparison of the Metallophilicity between d10–d10 AuI–HgII and d8–d10 AuIII–HgII Interactions. Inorg. Chem. 2014, 53, 1275–1277. [Google Scholar] [CrossRef] [PubMed]
  24. Freitag, K.; Molon, M.; Jerabek, P.; Dilchert, K.; Rosler, C.; Seidel, R.W.; Gemel, C.; Frenking, G.; Fischer, R.A. Zn⋯ Zn interactions at nickel and palladium centers. Chem. Sci. 2016, 7, 6413–6421. [Google Scholar] [CrossRef] [PubMed] [Green Version]
  25. Singh, B.; Thakur, A.; Kumar, M.; Jasrotia, D. Metallophilic interactions and structure-stability relationship with secondary interactions in [ZnX]− based hybrid derivatives. Mater. Chem. Phys. 2017, 196, 52–61. [Google Scholar] [CrossRef]
  26. Katsuki, T. Unique asymmetric catalysis of cis-β metal complexes of salen and its related Schiff-base ligands. Chem. Soc. Rev. 2004, 33, 437–444. [Google Scholar] [CrossRef] [PubMed]
  27. Baleizo, C.; Garcia, H. Chiral salen complexes: An overview to recoverable and reusable homogeneous and heterogeneous catalysts. Chem. Rev. 2006, 106, 3987–4043. [Google Scholar] [CrossRef]
  28. Reed, J.E.; Arnal, A.A.; Neidle, S.; Vilar, R. Stabilization of G-quadruplex DNA and inhibition of telomerase activity by square-planar nickel (II) complexes. J. Am. Chem. Soc. 2006, 128, 5992–5993. [Google Scholar] [CrossRef]
  29. Glasner, H.; Tshuva, E.Y. A marked synergistic effect in antitumor activity of salan titanium (IV) complexes bearing two differently substituted aromatic rings. J. Am. Chem. Soc. 2011, 133, 16812–16814. [Google Scholar] [CrossRef]
  30. Hitomi, Y.; Iwamoto, Y.; Kashida, A.; Kodera, M. Mononuclear nonheme iron (III) complexes that show superoxide dismutase-like activity and antioxidant effects against menadione-mediated oxidative stress. Chem. Commun. 2015, 51, 8702–8704. [Google Scholar] [CrossRef]
  31. Pessoa, J.C.; Correia, I. Salan vs. salen metal complexes in catalysis and medicinal applications: Virtues and pitfalls. Coord. Chem. Rev. 2019, 388, 227–247. [Google Scholar] [CrossRef]
  32. Hui, J.K.H.; Yu, Z.; MacLachlan, M.J. Supramolecular Assembly of Zinc Salphen Complexes: Access to Metal-Containing Gels and Nanofibers. Angew. Chem. Int. Ed. 2007, 46, 7980–7983. [Google Scholar] [CrossRef]
  33. Darensbourg, D.J. Making plastics from carbon dioxide: Salen metal complexes as catalysts for the production of polycarbonates from epoxides and CO2. Chem. Rev. 2007, 107, 2388–2410. [Google Scholar] [CrossRef] [PubMed]
  34. Kleij, A.W. Zinc-centred salen complexes: Versatile and accessible supramolecular building motifs. Dalton Trans. 2009, 24, 4635–4639. [Google Scholar] [CrossRef] [PubMed]
  35. Crane, A.K.; MacLachlan, M.J. Portraits of Porosity: Porous Structures Based on Metal Salen Complexes. Eur. J. Inorg. Chem. 2012, 17–30. [Google Scholar] [CrossRef]
  36. Wang, Y.D.; DuBois, J.L.; Hedman, B.; Hodgson, K.O.; Stack, T.D.P. Catalytic galactose oxidase models: Biomimetic Cu(II)-phenoxyl-radical reactivity. Science 1998, 279, 537–540. [Google Scholar] [CrossRef]
  37. Ueno, T.; Koshiyama, T.; Ohashi, M.; Kondo, K.; Kono, M.; Suzuki, A.; Yamane, T.; Watanabe, Y. Coordinated design of cofactor and active site structures in development of new protein catalysts. J. Am. Chem. Soc. 2005, 127, 6556–6562. [Google Scholar] [CrossRef]
  38. Laskin, J.; Yang, Z.; Chu, I.K. Energetics and dynamics of electron transfer and proton transfer in dissociation of metalIII (salen)− peptide complexes in the gas phase. J. Am. Chem. Soc. 2008, 130, 3218–3230. [Google Scholar] [CrossRef]
  39. Weinhold, F.; Landis, C.R. Valency and Bonding: A Natural Bond Orbital Donor-acceptor Perspective; Cambridge UK Press: Cambridge, UK, 2005. [Google Scholar]
  40. Pauling, L. The Application of the Quantum Mechanics to the Structure of the Hydrogen Molecule and Hydrogen Molecule-Ion and to Related Problems. Chem. Rev. 1928, 28, 173–213. [Google Scholar] [CrossRef]
  41. Pauling, L. The nature of the chemical bond. Application of results obtained from the quantum mechanics and from a theory of paramagnetic susceptibility to the structure of molecules. J. Am. Chem. Soc. 1931, 53, 1367–1400. [Google Scholar] [CrossRef]
  42. Pauling, L.; Wheland, G.W. The nature of the chemical bond. V. The quantum-mechanical calculation of the resonance energy of benzene and naphthalene and the hydrocarbon free radicals. J. Chem. Phys. 1933, 1, 362–374. [Google Scholar] [CrossRef] [Green Version]
  43. Wheland, G.W.; Pauling, L. A quantum mechanical discussion of orientation of substituents in aromatic molecules. J. Am. Chem. Soc. 1935, 57, 2086–2095. [Google Scholar] [CrossRef]
  44. Heitler, W.; London, F. Interaction of neutral atoms and homeopolar bonding according to quantum mechanics. Z. Phys. 1927, 44, 455–472. [Google Scholar] [CrossRef]
  45. Hund, F. To interpret some phenomena in the molecular spectra. Z. Phys. 1926, 36, 657–674. [Google Scholar] [CrossRef]
  46. Mulliken, R.S. The assignment of quantum numbers for electrons in molecules. I. Phys. Rev. 1927, 32, 186. [Google Scholar] [CrossRef]
  47. Lennard-Jones, J.E. The electronic structure of some diatomic molecules. Trans. Faraday Soc. 1929, 25, 668–686. [Google Scholar] [CrossRef]
  48. Bohr, N. On the constitution of atoms and molecules. Philos. Mag. 1913, 26, 476–502. [Google Scholar] [CrossRef] [Green Version]
  49. Bohr, N. Theory of Spectra and Atomic Constitution, Essay 3; Cambridge U. Press: London, UK, 1922. [Google Scholar]
  50. Lewis, G.N. The atom and the molecule. J. Am. Chem. Soc. 1916, 38, 762–785. [Google Scholar] [CrossRef] [Green Version]
  51. Lewis, G.N. Valence and the Structure of Atom and Molecules; Chemical Catalog Co.: New York, NY, USA, 1923. [Google Scholar]
  52. Bader, R.F.W. Atoms in Molecules: A Quantum Theory; Oxford University Press: Oxford, UK, 1994. [Google Scholar]
  53. Becke, A.D.; Edgecombe, K.E. A simple measure of electron localization in atomic and molecular systems. J. Chem. Phys. 1990, 92, 5397–5403. [Google Scholar] [CrossRef]
  54. Silvi, B.; Savin, A. Classification of chemical bonds based on topological analysis of electron localization functions. Nature 1994, 371, 683–686. [Google Scholar] [CrossRef]
  55. Savin, A.; Silvi, B.; Coionna, F. Topological analysis of the electron localization function applied to delocalized bonds. Can. J. Chem. 1996, 74, 1088–1096. [Google Scholar] [CrossRef]
  56. Silvi, B. The synaptic order: A key concept to understand multicenter bonding. J. Mol. Struct. (THEOCHEM) 2002, 614, 3–10. [Google Scholar] [CrossRef]
  57. Matito, E.; Solà, M. The role of electronic delocalization in transition metal complexes from the electron localization function and the quantum theory of atoms in molecules viewpoints. Coord. Chem. Rev. 2009, 253, 647–665. [Google Scholar] [CrossRef]
  58. Lepetit, C.; Vabre, B.; Canac, Y.; Alikhani, M.E.; Zargarian, D. Pentacoordinated, square pyramidal cationic PCP Ni(II) pincer complexes: ELF and QTAIM topological analyses of nickel–triflate interactions. Theor. Chem. Acc. 2018, 137, 141. [Google Scholar] [CrossRef]
  59. Corté-Guzmán, F.; Bader, R.F.W. Complementarity of QTAIM and MO theory in the study of bonding in donor–acceptor complexes. Coord. Chem. Rev. 2005, 249, 633–662. [Google Scholar]
  60. Cromer, D.T.; Waber, J.T. International Tables for X-ray Crystallography, Kynoch. Birm. Engl. 1952, 3, 257–269. [Google Scholar]
  61. SAINT, Version 6.02, Bruker AXS: Madison, WI, USA, 1999.
  62. Sheldrick, G.M. SAINT (Version 6.02), SADABS (Version 2.03); Bruker AXS: Madison, WI, USA, 2002. [Google Scholar]
  63. Sheldrick, G.M. SAINT and XPREP, Version 5.1; Siemens Industrial Automation Inc.: Madison, WI, USA, 1995. [Google Scholar]
  64. Dolomanov, O.V.; Bourhis, L.J.; Gildea, R.J.; Howard, J.A.K.; Puschmann, H. OLEX2: A complete structure solution, refinement and analysis program. J. Appl. Cryst. 2009, 42, 339–341. [Google Scholar] [CrossRef]
  65. Bourhis, L.J.; Dolomanov, O.V.; Gildea, R.J.; Howard, J.A.K.; Puschmann, H. he anatomy of a comprehensive constrained, restrained refinement program for the modern computing environment–Olex2 dissected. Acta Cryst. A 2015, 71, 59–75. [Google Scholar] [CrossRef] [Green Version]
  66. Glendening, E.D.; Reed, A.E.; Carpenter, J.E.; Weinhold, F. NBO Version 3.1; Gaussian, Inc.: Wallingford, CT, USA, 2009; included in Gaussian 09. [Google Scholar]
  67. Frisch, M.J.T.; Trucks, G.W.; Schlegel, H.B.; Scuseria, G.E.; Robb, M.A.C.; Cheeseman, J.R.; Scalmani, G.; Barone, V.; Mennucci, G.A.N.B.; Petersson, H.; et al. Gaussian 09, Revision B.01; Gaussian, Inc.: Wallingford, CT, USA, 2010. [Google Scholar]
  68. Grimme, S. Semiempirical GGA-type density functional constructed with a long-range dispersion correction. J. Comput. Chem. 2006, 27, 1787–1799. [Google Scholar] [CrossRef]
  69. Dunning, T.H., Jr. Gaussian basis sets for use in correlated molecular calculations. I. The atoms boron through neon and hydrogen. J. Chem. Phys. 1989, 90, 1007. [Google Scholar] [CrossRef]
  70. Yanai, T.; Tew, D.P.; Handy, N.C. A new hybrid exchange–correlation functional using the Coulomb-attenuating method (CAM-B3LYP). Chem. Phys. Lett. 2004, 393, 51–57. [Google Scholar] [CrossRef] [Green Version]
  71. Lu, T.; Chen, F.-W. Multiwfn: A multifunctional wavefunction analyzer. J. Comput. Chem. 2012, 33, 580–592. [Google Scholar] [CrossRef]
  72. Usman, M.; Tabassum, S.; Arjmand, F.; Khan, R.A.; Ali, M.S.; Al-Lohedan, H.A.; Alsalme, A.; Farah, M.A.; Al-Anazi, K.M.; Ahmad, M. CuII-NaI heteronuclear complex as anticancer entity against human breast cancer cell lines: DNA binding, cleavage, and Computational studies. Inorg. Chim. Acta 2018, 479, 229–239. [Google Scholar] [CrossRef]
  73. Usman, M.; Arjmand, F.; Ahmad, M.; Khan, M.S.; Ahmad, I.; Tabassum, S. A comparative analyses of bioactive Cu (II) complexes using Hirshfeld surface and density functional theory (DFT) methods: DNA binding studies, cleavage and antibiofilm activities. Inorg. Chim. Acta 2016, 453, 193–201. [Google Scholar] [CrossRef]
  74. Nakamoto, K. Infrared and Raman Spectra of Inorganic and Coordination Compounds, 4th ed.; Wiley: New York, NY, USA, 1986. [Google Scholar]
  75. Arif, M.; Nazir, S.; Iqbal, M.S.; Anjum, S. Synthesis and characterization of transition metal fluoride complexes with imidazole: X-ray crystal structure reveals short hydrogen bonds between lattice water and lattice fluoride. Inorg. Chim. Acta 2009, 362, 1624–1628. [Google Scholar] [CrossRef]
  76. Dumur, F.; Contal, E.; Wantz, G.; Gigmes, D. Photoluminescence of Zinc complexes: Easily tunable optical properties by variation of the bridge between the imido groups of schiff base ligands. Eur. J. Inorg. Chem. 2014, 25, 4186–4198. [Google Scholar] [CrossRef]
  77. Houjou, H.; Motoyama, T.; Araki, K. Electronic spectra of mono-and dinuclear complexes of fully π-conjugated salphen Ligands synthesized by using 2, 6-Dihydroxynaphthalene carbaldehydes. Eur. J. Inorg. Chem. 2009, 533–538. [Google Scholar] [CrossRef]
  78. Houjou, H.; Ito, M.; Arak, K. Comparison of the spectroscopic properties of π-conjugated, fused salphen triads embedded with Zn-homo-, Ni-homo-, and Ni/Zn-heteronuclei. Inorg. Chem. 2011, 50, 5298–5306. [Google Scholar] [CrossRef]
  79. Consiglio, G.; Failla, S.; Finocchiaro, P.; Oliveri, I.P.; Bella, S.D. An unprecedented structural interconversion in solution of aggregate zinc (II) salen Schiff-base complexes. Inorg. Chem. 2012, 51, 8409–8418. [Google Scholar] [CrossRef]
  80. Rogachev, A.Y.; Hoffmann, R. Iodine (I2) as a Janus-faced ligand in organometallics. J. Am. Chem. Soc. 2013, 135, 3262–3275. [Google Scholar] [CrossRef]
  81. Gericke, R.; Bennett, M.A.; Priver, S.H.; Bhargava, S.K. Formation of Heterobimetallic Complexes by Addition of d10-Metal Ions to cis-[(dppe) M (κ C-2-C6F4PPh2) 2](M = Ni, Pd, and Pt). Organometallics 2017, 36, 3178–3188. [Google Scholar] [CrossRef]
  82. Paenurk, E.; Poranne, R.G.; Chen, P. Trends in metallophilic bonding in Pd–Zn and Pd–Cu complexes. Organometallics 2017, 36, 4854–4863. [Google Scholar] [CrossRef]
  83. Kim, M.; Taylor, T.J.; Gabbai, F.P. Hg (II)··· Pd (II) metallophilic interactions. J. Am. Chem. Soc. 2008, 130, 6332–6333. [Google Scholar] [CrossRef] [PubMed]
  84. Runeberg, N.; Schutz, M.; Werner, H.-J. The aurophilic attraction as interpreted by local correlation methods. J. Chem. Phys. 1999, 110, 7210–7215. [Google Scholar] [CrossRef]
  85. Mendizabal, F.; Pyykko, P.; Runeberg, N. Aurophilic attraction: The additivity and the combination with hydrogen bonds. Chem. Phys. Lett. 2003, 370, 733–740. [Google Scholar] [CrossRef]
  86. Grimme, S.; Djukic, J.-P. Cation− cation “attraction”: When London dispersion attraction wins over Coulomb repulsion. Inorg. Chem. 2011, 50, 2619–2628. [Google Scholar] [CrossRef] [PubMed]
  87. Murray, L.J.; Weare, W.W.; Shearer, J.; Mitchell, A.D.; Abboud, K.A. Isolation of a (dinitrogen) tricopper (I) complex. J. Am. Chem. Soc. 2014, 136, 13502–13505. [Google Scholar] [CrossRef]
  88. -Kanssen, I.F.; Austin, J.; Kerridge, A. Topological study of bonding in aquo and bis (triazinyl) pyridine complexes of trivalent lanthanides and actinides: Does covalency imply stability? Inorg. Chem. 2016, 55, 10034–10042. [Google Scholar] [CrossRef]
  89. Teixeira, F.; Mosquera, R.; Melo, A.; Freire, C.; Cordeiro, M.N.D.S. Roots of Acetate-Vanadium Linkage Isomerism: A QTAIM Study. Inorg. Chem. 2016, 55, 3653–3662. [Google Scholar] [CrossRef]
  90. Wu, L.C.; Thomsen, M.K.; Madsen, S.R.; Schmoekel, M.; Jørgensen, M.R.V.; Cheng, M.C.; Peng, S.M.; Chen, Y.S.; Overgaard, J.; Iversen, B.B. Chemical Bonding in a Linear Chromium Metal String Complex. Inorg. Chem. 2014, 53, 12489–12498. [Google Scholar] [CrossRef]
  91. Duan, M.; Li, P.; Zhao, H.; Xie, F.; Ma, J. Organic Compounds of Actinyls: Systematic Computational Assessment of Structural and Topological Properties in [AnO2 (C2O4) n](2 n− 2)–(An = U, Np, Pu, Am; n = 1–3) Complexes. Inorg. Chem. 2019, 58, 3425–3434. [Google Scholar] [CrossRef]
  92. Bader, R.F.W.; Matta, C.F. Bonding to titanium. Inorg. Chem. 2001, 40, 5603–5611. [Google Scholar] [CrossRef]
  93. Bader, R.F.W.; Essen, H. The characterization of atomic interactions. J. Chem. Phys. 1984, 80, 1943–1960. [Google Scholar] [CrossRef]
  94. Cremer, D.; Kraka, E. Chemical bonds without bonding electron density—does the difference electron-density analysis suffice for a description of the chemical bond? Angew. Chem. Int. Ed. Engl. 1984, 23, 627–628. [Google Scholar] [CrossRef]
  95. Bianchi, R.; Gervasio, G.; Marabello, D. Experimental electron density analysis of Mn2 (CO) 10: Metal− metal and metal− Ligand bond characterization. Inorg Chem. 2000, 39, 2360–2366. [Google Scholar] [CrossRef] [PubMed]
  96. Macchi, P.; Proserpio, D.M.; Sironi, A. Experimental electron density in a transition metal dimer: Metal− metal and metal− ligand bonds. J. Am. Chem. Soc. 1998, 120, 13429–13435. [Google Scholar] [CrossRef]
  97. Hosseinnejad, T.; Dehghanpour, S.; Hosseinjani, A. Quantum chemical investigation on the structural and electronic properties of zinc–salphen complex: DFT and QTAIM analysis. Comput. Theor. Chem. 2013, 1004, 31–37. [Google Scholar] [CrossRef]
  98. Pitchumani, C.; Mary, V.; Shankar, R.; Vijayakumar, S. Theoretical insights into the metal chelating and antimicrobial properties of the chalcone based Schiff bases. Mol. Simul. 2019, 45, 636–645. [Google Scholar] [CrossRef]
  99. Gusev, A.N.; Kiskin, M.A.; Braga, E.V.; Chapran, M.; Wiosna-Salyga, G.; Baryshnikov, G.V.; Minaeva, V.A.; Minaev, B.F.; Ivaniuk, K.; Stakhira, P.; et al. Novel Zinc Complex with an Ethylenediamine Schiff Base for High-Luminance Blue Fluorescent OLED Applications. J. Phys. Chem. C 2019, 123, 11850–11859. [Google Scholar] [CrossRef]
  100. Varadwaj, P.R.; Varadwaj, A.; Marques, H.M. DFT-B3LYP, NPA-, and QTAIM-based study of the physical properties of [M(II)(H2O)2 (15-crown-5)](M = Mn, Fe, Co, Ni, Cu, Zn) complexes. J. Phys. Chem. A 2011, 115, 5592–5601. [Google Scholar] [CrossRef]
  101. Li, X.; Huo, S.; Zeng, Y.; Sun, Z.; Zheng, S.; Meng, L. Metal–Metal and Metal–Ligand Bonds in (η5-C5H5) 2M2 (M = Be, Mg, Ca, Ni, Cu, Zn). Organometallics 2013, 32, 1060–1066. [Google Scholar] [CrossRef]
  102. Savin, A.; Nesper, R.; Wengert, S.; Fassler, T.F. ELF: The electron localization function. Angew. Chem. Int. Ed. Engl. 1997, 36, 1808–1832. [Google Scholar] [CrossRef]
  103. Jerabek, P.; von der Esch, B.; Schmidbaur, H.; Schwerdtfeger, P. Influence of Relativistic Effects on Bonding Modes in M (II) Dinuclear Complexes (M = Au, Ag, and Cu). Inorg. Chem. 2017, 56, 14624–14631. [Google Scholar] [CrossRef] [PubMed]
Figure 1. Experimental (red) and DFT simulated (blue) FTIR spectra of [Zn(sal)](H2O) complex.
Crystals 10 00259 g001
Figure 2. (A) UV–vis spectra (left axis, curved line) of [Zn(sal)](H2O) complex, in MeOH (1 × 10⁻⁴ M) and oscillator strengths (right axis, vertical line) obtained from time dependent DFT calculations. (B) Emission spectrum of [Zn(sal)](H2O) complex in MeOH.
Crystals 10 00259 g002
Figure 3. The single crystal X−ray structure of [Zn(sal)](H2O) complex. (A) Monomer, (B) dimer (top view), and (C) dimer (side view), along with labeling of atoms. Thermal ellipsoids were shown at 50% probability. Hydrogen atoms and solvate H2O molecules have been omitted for clarity.
Crystals 10 00259 g003
Figure 4. (A) Selected metal centered natural bond orbitals (NBOs) of [Zn(sal)](H2O), and (B) LP → LP* donor–acceptor orbitals interaction derived from NBO analysis of [Zn(sal)](H2O) (monomeric form). Hydrogen atoms are omitted for clarity (isovalue = 0.03).
Crystals 10 00259 g004
Figure 5. LP → LP* donor–acceptor orbitals interaction derived from NBO analysis of [Zn(sal)](H2O) (dimeric form). Hydrogen atoms are omitted for clarity (isovalue = 0.03).
Crystals 10 00259 g005
Figure 6. Quantum theory of atoms in molecule (QTAIM analysis) [Zn(sal)](H2O) (monomeric form): (A) molecular graph, showing the bond path and electron density (ρ) at bond critical points (BCPs). Purple circles indicate BCPs, and light green circles represent RCPs. (B) Contour line plots of the electron density ρ, (C) contour line plots of the Laplacian of electron density ∇2ρ(r), the solid (red) and dashed (blue) lines corresponds to positive and negative values of ∇2ρ(r) respectively, (D) surface maps of electron localization function (ELF). Bond paths are shown as black lines, selected zero-flux surfaces or interbasin paths as blue lines, bond critical points, BCPs (3, −1) are shown in blue.
Crystals 10 00259 g006
Figure 7. QTAIM analysis [Zn(sal)](H2O) (dimeric form): (A) molecular graph, showing the bond path and electron density (ρ) at BCP. (B) Contour line plots of the electron density ρ, (C) contour line plots of the Laplacian of electron density ∇2ρ(r), the solid (red) and dashed (blue) lines corresponds to positive and negative values of ∇2ρ(r) respectively, (D) surface maps of electron localization function (ELF). Bond paths are shown as green lines, selected zero-flux surfaces or interbasin paths as blue lines, bond critical points, BCPs (3, −1) are shown in blue.
Crystals 10 00259 g007
Table 1. Crystal data and structural refinement for the [Zn(sal)](H2O) complex.
Identification Code[Zn(sal)](H2O)
Empirical formulaC22H26N2O5Zn
Formula weight463.86
Temperature/K100(2)
Crystal systemMonoclinic
Space groupP21/n
a/Å8.6332(6)
b/Å21.0131(15)
c/Å22.2375(16)
α/°90
β/°97.101(2)
γ/°90
Volume/Å34003.2(5)
Z8
ρcalcg/cm31.5392
μ/mm−11.266
F(000)1939.3
Crystal size/mm30.31 × 0.22 × 0.15
RadiationMo Kα (λ = 0.71073)
2θ range for data collection/°4.88 to 50.1
Index ranges−11 ≤ h ≤ 11, −27 ≤ k ≤ 27, −29 ≤ l ≤ 29
Reflections collected62,209
Independent reflections7088 [Rint = 0.1165, Rsigma = 0.0873]
Data/restraints/parameters7088/0/551
Goodness-of-fit on F21.084
Final R indexes (I ≥ 2σ (I))R1 = 0.0666, wR2 = 0.1509
Final R indexes (all data)R1 = 0.0959, wR2 = 0.1705
Largest diff. peak/hole/e Å−31.64/−0.84
CCDCThe CCDC No. 1978769 (see Supplementary)
Table 2. Geometric parameters of selective experimental (single crystal X-ray diffraction, SCXRD) and calculated (DFT) values of bond distances (Å) and bond angles (°) for [Zn(sal)](H2O) complex.
BondsExperimental
(SCXRD)
Calculated
(DFT)
Calculated
(DFT)
AnglesExperimental
(SCXRD)
Calculated
(DFT)
Calculated
(DFT)
DimerMonomerDimerMonomer
Zn1–N11.855(5)1.879272.02935N1–Zn1–O286.1(2)91.5582694.59652
Zn1–N21.856(5)1.888352.02604N1–Zn1–O3174.62(19)162.62912179.01430
Zn1–O21.859(4)1.860042.00440N2–Zn1–O2174.93(19)172.33079179.33971
Zn1–O31.851(4)1.863652.00188N2–Zn1–O394.69(19)88.5965894.64959
Zn2–N31.858(5)1.85823-N1–Zn1–N286.1(2)80.7910585.60376
Zn2–N41.859(5)1.86134-O2–Zn1–O385.07(16)98.9599285.33979
Zn2–O61.851(4)1.86370-N3–Zn2–O694.73(19)91.32315-
Zn2–O71.861(3)1.87021-N3–Zn2–O7175.77(19)161.50932-
Zn1···Zn23.5393.54991-N4–Zn2–O6175.70(19)162.16173-
----N4–Zn2–O794.46(18)91.48183-
----N3–Zn2–N485.7(2)83.75503-
----O6–Zn2–O785.42(16)98.23381-
Table 3. The natural atomic charges (NACs), total natural populations (TNPs), natural electronic configurations (NECs), and Wiberg bond indices (WBIs) of selected atoms in the [Zn(sal)](H2O) complex, as calculated at the B97D/cc-pVTZ level of theory.
AtomChargeTNPNatural Electron Configuration BondWBI
Monomer
Zn11.2350128.76499Zn1[core]4s0.373d9.944p0.45--
N1−0.583527.58352N1[core]2s1.352p4.203S0.013p0.02Zn1–N10.3191
N2−0.580847.58084N2[core]2s1.352p4.203S0.013p0.02Zn1–N20.3171
O2−0.701418.70141O2[core]2s1.672p5.013p0.01Zn1–O20.3051
O3−0.709628.70962O3[core]2s1.682p5.013p0.01Zn1–O30.3024
Dimer
Zn11.3690828.63092Zn1[core]4s0.293d9.964p0.37Zn1···Zn20.0221
N1−0.648947.64894N1[core]2s1.352p4.283p0.01Zn1–N10.2349
N2−0.640397.64039N2[core]2s1.352p4.273p0.01Zn1–N20.2321
O2−0.793178.53347O2[core]2s1.672p5.113p0.01Zn1–O20.2288
O3−0.785758.78575O3[core]2s1.672p5.113p0.01Zn1–O30.2221
Zn21.3811828.61882Zn2[core]4s0.293d9.964p0.36--
N3−0.642027.64202N3[core]2s1.352p4.283p0.01Zn2–N30.2275
N4−0.646807.64680N4[core]2s1.352p4.293p0.01Zn2–N40.2269
O6−0.799878.79987O6[core]2s1.672p5.123p0.01Zn2–O60.2127
O7−0.811278.81127O7[core]2s1.682p5.123p0.01Zn2–O70.2190
Table 4. Topological parameters of electron density: electron density (ρ(r)), its Laplacian distribution (∇2ρ(r)), potential energy density (V(r)), kinetic energy density (G(r)), and electronic energy density (H(r)) at the bond critical points (3, −1) corresponding to non-covalent interactions in [Zn(sal)](H2O). Parameters are all in the atomic unit (a.u.).
Bondsρ(r)2ρ(r)V(r)G(r)H(r)
Free Ligand
O3–C150.33472−0.43827−0.956880.42365−0.53322
O1–C280.32705−0.47176−0.911700.39688−0.51482
N5–C210.38331−0.96352−0.972640.36588−0.60676
N5–C510.24651−0.54978−0.328270.95413−0.23285
N6–C430.24854−0.56114−0.333630.96675−0.23696
N6–C290.38390−0.96397−0.976020.36751−0.60851
C29–C270.29863−0.93736−0.399240.82453−0.31679
C27–C150.31448−0.99291−0.455690.10373−0.35195
C28–C310.31422−0.99078−0.454920.10361−0.35131
C31–C210.30494−0.98150−0.416730.85678−0.33105
Monomer
Zn1–N10.124890.54129−0.227620.18147−0.04614
Zn1–N20.124170.53805−0.225830.18017−0.04566
Zn1–O20.113180.60032−0.219930.18500−0.03492
Zn1–O30.110810.58531−0.213280.17980−0.03347
O4–C240.33012−0.64531−0.858010.34834−0.50967
O4–C120.33759−0.62583−0.901780.37266−0.52912
C24–C220.32137−0.10575−0.470800.10320−0.36760
C12–C230.31374−1.1002−0.448240.09876−0.34948
C22–C200.29922−0.92077−0.412410.09111−0.32130
C23–C180.29562−0.89616−0.402260.08911−0.31315
C20–N70.124170.53805−0.225830.18017−0.04566
C18–N60.37738−0.90728−0.981510.37734−0.60416
N7–C460.25215−0.60040−0.357840.10387−0.25397
N6–C340.25276−0.60561−0.360680.10463−0.25604
C46–C340.26776−0.73000−0.312280.64893−0.24739
Dimer
Zn1···Zn20.004790.01073−0.001960.002320.00035
Zn1–N10.124330.53525−0.225590.17970−0.04588
Zn1–N20.123690.53327−0.224260.17879−0.04547
Zn1–O20.113060.60029−0.219900.18498−0.03491
Zn1–O30.110480.58281−0.212410.17905−0.03335
Zn2–N30.125120.54051−0.227970.18154−0.04642
Zn2–N40.124470.53619−0.226010.18003−0.04598
Zn2–O60.110750.58587−0.213360.17991−0.03344
Zn2–O70.113150.60117−0.220150.18522−0.34930

