Abstract
The pitting corrosion resistance of S32750 super duplex stainless steel, annealing treated at temperatures of 950–1200 °C for 20–60 min, was investigated using potentiodynamic polarization tests. The results show that the volume fractions of ferrite in the S32750 duplex stainless steel increased from 48.9% to 68.4% as annealing temperatures increased from 950 to 1200 °C. The pitting potential of the sample increased first and then decreased from an annealing temperature of 950 to 1050 °C, and the highest pitting potential was observed after annealing at 1050 °C for 35 min. The pitting corrosion resistance of S32750 stainless steel is due to the combination of pitting resistance equivalent number (PREN) value, phase fraction and grain boundary area fraction, and the imbalance of corrosion potential.
1. Introduction
Duplex stainless steel (DSS) consists of ferrite and austenite, so DSS has the comprehensive advantages of ferritic and austenitic stainless steel, including high strength, good stress corrosion resistance, and excellent toughness, plasticity, and weld abilities [1,2,3,4,5,6].
The annealing treatment process significantly affects the corrosion resistance of DSS, which is closely related with its microstructure and especially the equilibrium partition of the alloy elements in two phases [7,8,9,10,11,12]. Generally, the pitting resistance equivalent number (PREN) is used to estimate the pitting corrosion resistance of stainless steel; the overall pitting corrosion resistance is determined by the phase with the lower PREN value and the difference in the PREN values in each phase [13,14,15]. Tan et al. investigated the pitting corrosion resistance of commercial super duplex stainless steels (UNS S32750) annealed at 1030–1200 °C. They found that the PREN curves of ferrite and austenite in S32750 intersect at 1080 °C, and S32750 stainless steel annealed at 1080 °C exhibits the best pitting corrosion resistance [16]. Hwang and Park examined the pitting corrosion resistance of 26.2Cr-6.99Ni-2.37Mo-2.88W-0.35N duplex stainless steel, and reported that the PREN difference between ferrite and austenite is the lowest when the stainless sample is annealed at 1090 °C, in which the pitting resistance of the stainless steel is high [17]. However, some scholars think that the theory that pitting resistance depends on PREN values is not always valid. Garfias-Mesias et al. reported that pitting initially occurs in the ferrite phase, despite the PREN value of austenite phase being lower than that of the ferrite phase [18]. Ha et al. measured the relationship between pitting corrosion resistance and the ferrite fraction of commercial 2205 duplex stainless steel, and they reported that the overall pitting corrosion resistance of the annealed DSS2205 steels could not be arbitrarily determined by PREN values [19]. For PREN = [Cr] + 3.3[Mo] + λ[N], where λ is the diffusion coefficient of [N], the diffusion coefficient varies. In some reports, the coefficient is 16 [18], whereas in others, 20 [10] or 30 [11] were used. Therefore, for different coefficients, the estimated pitting corrosion resistance may be different from that predicted by PREN values.
The aim of this study was to examine the relationship between annealing treatment temperature, annealing time, phase fraction, and pitting corrosion resistance, and determine the optimum annealing treatment parameters for pitting corrosion resistance.
2. Materials and Methods
The material employed in this study was S32750 duplex stainless steel, and its main chemical composition in wt % was 63.4Fe-24.88Cr-6.61Ni-3.47Mo-0.69Mn-0.59Si. Figure 1 shows a starting alloy microstructure. We cut 10 × 10 × 8 mm cuboid specimens from the hot rolled sheets, and then, the samples were annealed at various temperatures, 950, 1000, 1050, 1100, 1150, and 1200 °C, for 35 min, followed by quenching in water at room temperature. To study the effect of annealing time on the pitting corrosion of stainless steel, different annealing times (20, 30, 40, 60 min) were used at 1050 °C.
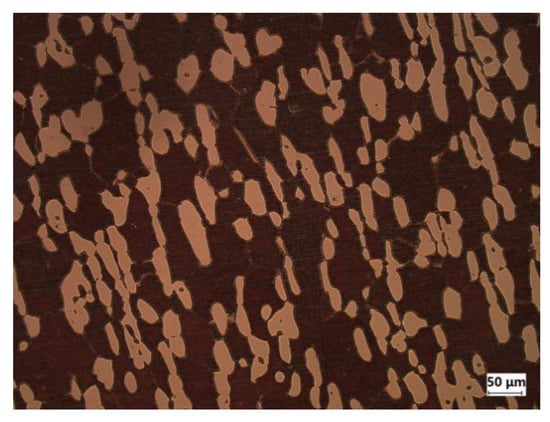
Figure 1.
Optical micrograph of S32750 stainless steel (the dark region is ferrite and the bright region is austenite).
The starting microstructure was investigated using a metallographic microscope (OLYMPUS, Japan). For microscopic analysis, the surface of the samples was wet ground with SiC paper, mechanically polished using a diamond suspension to 1 μm, and then chemically etched in a K2S2O5 solution (1 g K2S2O5 + 20 mL HCl + 0.3 g CuCl2 + 100 mL H2O).
The microstructures and compositions of the ferrite and austenite phases were examined using a Sirion Field scanning electron microscope (SEM, FEI, Netherlands) equipped with an electron backscattered diffraction (OIM 4000, FEI, Netherlands) and an energy dispersive spectrometer (EDS, GENESIS 60S, FEI, Netherlands). For the electron backscattered diffraction (EBSD) test, the samples were electropolished in a mixed solution of 20 vol % perchloric acid and 80 vol % ethanol at 20 V for 45 s after mechanical polishing. The phase fractions of the samples were quantitatively characterized by EBSD maps using an OIM analysis system (FEI, Netherlands). The partition of the alloying elements in the ferrite and austenite phases of each sample was investigated using an energy dispersive spectrometer (EDS).
Electrochemical measurements were performed on a CHI660E (Shanghai Chen Hua, China) electrochemical workstation. For this test, the S32750 stainless steel samples, Pt sheet, and saturated calomel electrode were the working electrodes, the counter electrode, and the reference electrode, respectively, and the electrolyte solution was 3.5% (mass fraction) NaCl solution. To obtain the stable open circuit potential values (OCP), the stainless steel samples were etched in the solution for 60 min, and then electrochemical impedance spectroscopy (EIS) was conducted using AC signals with an amplitude of 5 mV in the frequency range from 100 kHz to 10 mHz. The measured EIS data were fitted using ZsimDemo software (Shanghai Chen Hua, China). The polarization tests were implemented from a potential −1.3 to 1.2 V at a scan rate of 1.0 mV s−1, and the pitting morphology was characterized by SEM after the tests. The pitting potential (Epit) and corrosion current density (icorr) were obtained from the polarization curves.
3. Results
3.1. Microstructure
The microstructures of the S32750 stainless steel annealed at different temperatures are displayed in Figure 2. The ferrite phase is always continuous, and the austenite phase, which disperses in the ferrite phase region, is visible in islands or strips. The austenite phase islands gradually refine and the fraction of austenite phase decrease with increasing annealing temperature. Correspondingly, the ferrite and austenite phase fractions of the annealed sample at different temperature are depicted in Figure 3. The ferrite phase fractions increase from 48.9% at 950 °C to 68.4% at 1200 °C, while the austenite phase fractions decrease from 51.1% to 31.6%. The ratio of austenite and ferrite remains almost the same when the annealing temperature is about 970 °C, accounting for 50% each. An equilibrium phase diagram of the S32750 stainless steel calculated using JMatPro software (Sente Software Ltd., Guildford, England) is shown in Figure 4. The temperature of the equal two-phase fraction calculated by the software is about 1100 °C, which is different from the experimental results. This may be caused by the uneven distribution of elements in the experiment and calculation, or by inclusions.
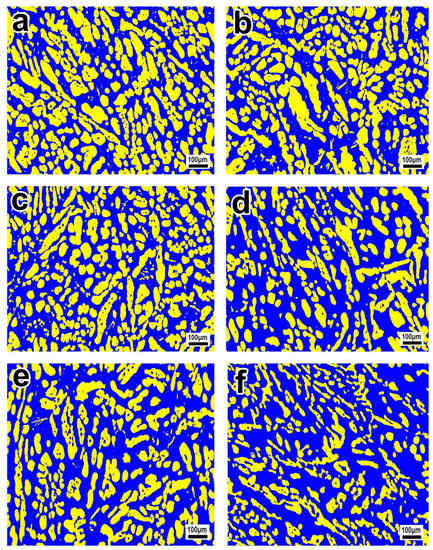
Figure 2.
Electron backscattered diffraction (EBSD) phase maps of S32750 stainless steel sample at different annealing temperatures for 35 min: (a) 950, (b) 1000, (c) 1050, (d) 1100, (e) 1150, and (f) 1200 °C. The blue region is ferrite and the yellow region is austenite.
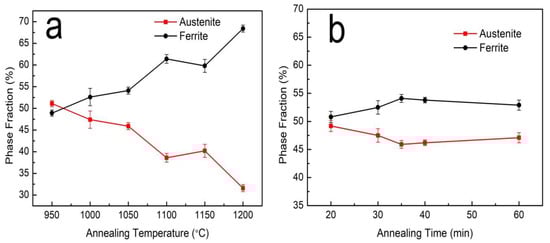
Figure 3.
The ferrite and austenite phase fraction at different annealing (a) temperatures and (b) times. The average and standard deviation values (scatter band) of the phase fraction were obtained from 5 experiments.
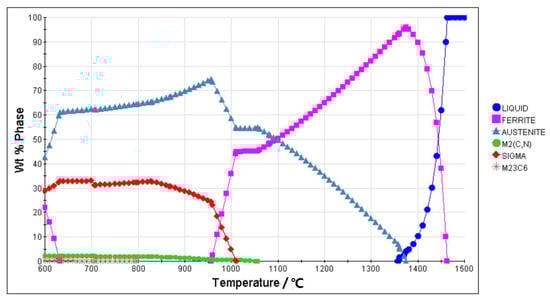
Figure 4.
Equilibrium phase diagram of the S32750 stainless steel calculated using JMatPro software (Sente Software Ltd., Guildford, England).
Figure 5 shows the EBSD phase maps of S32750 stainless steel sample after different annealing times at 1050 °C. We found that the austenite phase is distributed in the ferrite phase in long strips or islands with short annealing times (Figure 5a). With the prolongation of annealing time, the austenite phase gradually transforms into an island distribution. The results showed that with the increase in annealing time, the austenite phase gradually fragments and the phase boundaries between the two phases increase. Figure 3b shows that when the annealing time increases from 20 to 35 min, the ferrite phase fraction increases slightly and the austenite phase fraction decreases slightly. Compared with the effect of annealing temperature, annealing time has less of an effect on the fraction of the two phases.
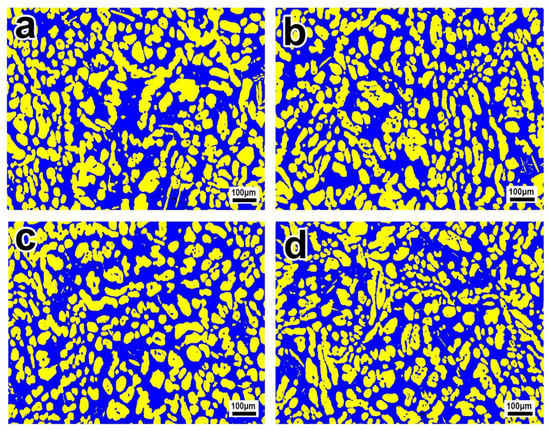
Figure 5.
EBSD phase maps of S32750 stainless steel sample at different annealing times at 1050 °C: (a) 20, (b) 30, (c) 40, and (d) 60 min. The blue region is ferrite and the yellow region is austenite.
3.2. Alloying Elements Partitioning
Table 1 shows the concentration of alloying elements at different annealing temperatures examined using an energy dispersive spectrometer. Cr and Mo are enriched in ferrite, whereas Ni and Mn are enriched in austenite. With increasing annealing temperature, the concentrations of Cr, Mo, Ni, and Mn in the austenite phase decrease slightly. The solubility of N in the body-centered cubic structure is less than 0.1 wt %, which is much lower than in the face-centered cubic structure. Therefore, most N elements are enriched in austenite with a face-centered cubic structure rather than ferrite with a body-centered cubic structure. Table 2 lists the concentrations of alloying elements at different annealing times. Similarly, Cr and Mo are enriched in the ferrite phase, while Ni and Mn are enriched in the austenite phase.

Table 1.
Annealing temperature, phase fraction, element composition and pitting resistance equivalent number (PREN) values of the ferrite (α) and austenite (γ) phases of S32750 stainless steel annealed samples. PRENα = [Cr] + 3.3[Mo], PRENγ-16 = [Cr] + 3.3[Mo] + 16[N] – [Mn] [18].
Table 2.
Annealing time, element composition, and PREN values of the ferrite (α) and austenite (γ) phases of S32750 stainless steel annealed samples. PRENα = [Cr] + 3.3[Mo], PRENγ-16 = [Cr] + 3.3[Mo] + 16[N] – [Mn] [18].
3.3. Resistance to Pitting Corrosion
The polarization curves of the S32750 stainless steel samples at different annealing temperatures are illustrated in Figure 6. All the samples showed obvious passivation zones, indicating that S32750 stainless steel exhibits good corrosion resistance due to the formation of a passivation film. According to the polarization curves, corrosion current density (icorr) and pitting potential (Epit) as functions of the annealing temperature are shown in Figure 7. Pitting potential (Epit) increased to maximum when the annealing temperature was 1050 °C, and then decreased with the annealing temperature. The corrosion current density (icorr) shows a completely opposite trend. Correspondingly, the numerical results are provided in Table 3. We concluded that the optimum pitting corrosion resistance of S32750 stainless steel is obtained after annealing at 1050 °C.
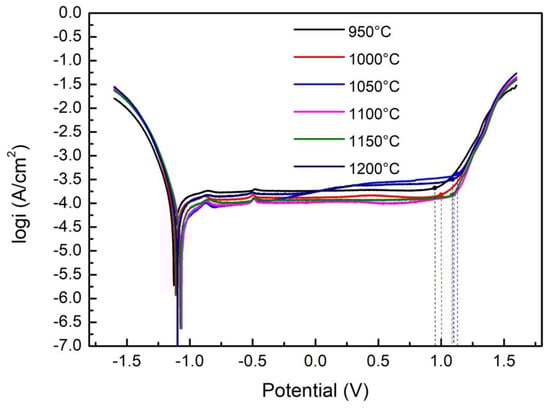
Figure 6.
Polarization curves of S32750 stainless steel at different annealing temperatures.
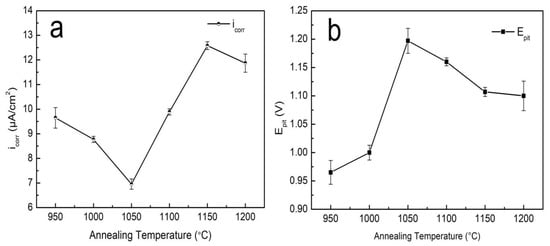
Figure 7.
(a) Corrosion current density and (b) pitting potential of S32750 stainless steel at different annealing temperatures.
Table 3.
Corrosion current density (icorr)and pitting potential (Epit) values (average ± standard deviation) of S32750 stainless steel at different annealing temperatures. The average and standard deviation values were obtained from 5 experiments.
Figure 8 demonstrates the Nyquist curves of EIS in NaCl solution. We found that the Nyquist curves of S32750 stainless steel show capacitive semicircle loops, which indicate that a complete passive film formed on the surface of the samples. With increasing annealing temperature, the radius of the overall capacitive semicircle loops firstly increased and then decreased, and the capacitive semicircle loops of S32750 stainless steel treated at 1050 °C was the largest. Generally, large capacitive semicircle loops indicate a highly stable passive film formed on the surface of samples, leading to strong pitting resistance.
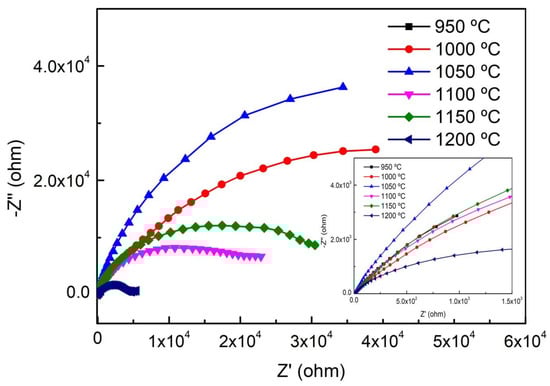
Figure 8.
Nyquist curves of S32750 stainless steel at different annealing temperature.
The equivalent circuit (EC) used for fitting the EIS data using ZsimDemo software is presented in Figure 9. The fitting results of each component are shown in Table 4. According to the fitting data in Table 4, as for the evolution of the radius of the overall capacitive semicircle loops, the resistance of charge transfer (RCT) of the passive film firstly increased and then decreased. The RCT of S32750 stainless steel annealed at 1050 °C was the largest. So, the passive film on S32750 stainless steel treated at 1050 °C is hard to destroy.
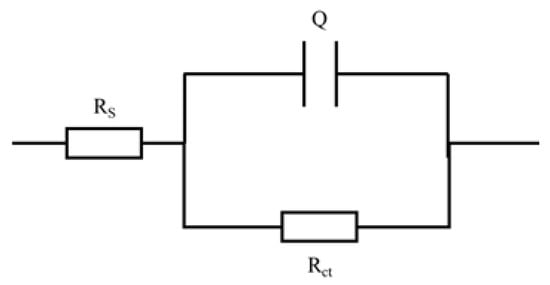
Figure 9.
Equivalent circuit of electrochemical impedance spectroscopy (EIS) of S32750 stainless steel at different annealing temperature.
Table 4.
Equivalent circuit parameter values for S32750 stainless steel samples at different annealing temperatures. Rs is the resistance of the solution, Rct is the resistance of charge transfer, Q is the constant phase element (CPE), n is the CPE exponent (0 ≤ n ≤ 1).
The polarization curves, corrosion current density (icorr), and pitting potential (Epit) of the S32750 stainless steel samples at different annealing times are provided in Figure 10 and Figure 11. The numerical results are listed in Table 5. With increasing annealing time, the corrosion current density decreased first and then rose, and the corrosion current density of the S32750 super duplex stainless steel for 30 min was lower. The pitting potential was highest for 35 min.
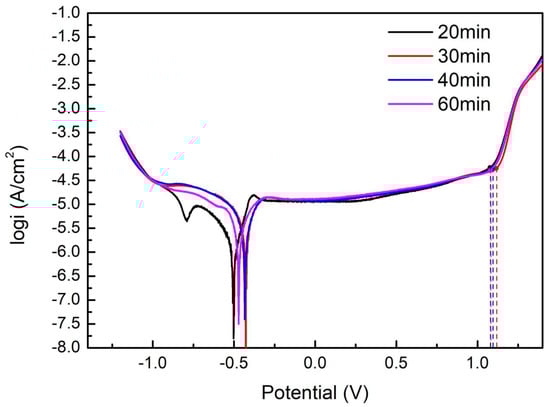
Figure 10.
Polarization curves of S32750 stainless steel with different annealing times.
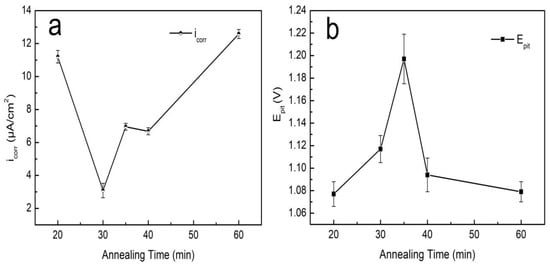
Figure 11.
(a) Corrosion current density and (b) pitting potential of S32750 stainless steel at different annealing temperatures.
Table 5.
Corrosion current density and pitting potential values (average ± standard deviation) of S32750 stainless steel with different annealing times. The average and standard deviation values were obtained from 5 experiments.
Figure 12 depicts the Nyquist curves of EIS in NaCl solution. We found that the Nyquist curves of S32750 stainless steel showed capacitive semicircle loops, which indicated that a complete passive film formed on the surface of the samples. In the holding time range of 20–40 min, the radius of capacitive arc increased, and the S32750 super duplex stainless steel with a holding time of 40 min had the largest radius of capacitive arc.
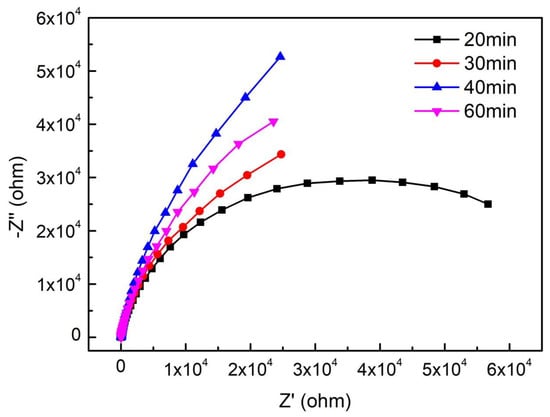
Figure 12.
Nyquist curves of S32750 stainless steel at different annealing times.
The EC used for fitting the EIS data using ZsimDemo software is presented in Figure 9. The fitting results of each component are shown in Table 6. According to the fitting data, as with the evolution of the radius of the overall capacitive semicircle loops, the resistance of charge transfer (RCT) of the passive film firstly increased and then decreased; the RCT of S32750 stainless steel annealed for 40 min was the largest. To summarize, the annealing time to create the strongest resistance to pitting may require comprehensive consideration of corrosion current density, pitting potential, and capacitive arc, and especially the micro morphology after corrosion.
Table 6.
Equivalent circuit parameter values for S32750 stainless steel samples at different annealing times.
3.4. Corrosion Surface Morphology
Figure 13 shows the SEM photographs of the samples at different annealing temperatures after the polarization test. All the samples showed pits with different sizes; after annealing treatment at 950–1000 and 1150–1200 °C, the two-phase corrosion rates of the samples were quite different, and the corrosion height between ferrite and austenite showed obvious differences. However, the corrosion morphologies of the two phases of the annealing samples at 1050–1100 °C were not significantly different. This indicated that the corrosion resistance of S32750 super duplex stainless steel increases first and then decreases with increasing the annealing temperature from 950 to 1150 °C. The S32750 super duplex stainless steel sample, after annealing at 1050 °C, had the optimum pitting corrosion resistance, which is consistent with the polarization test results.
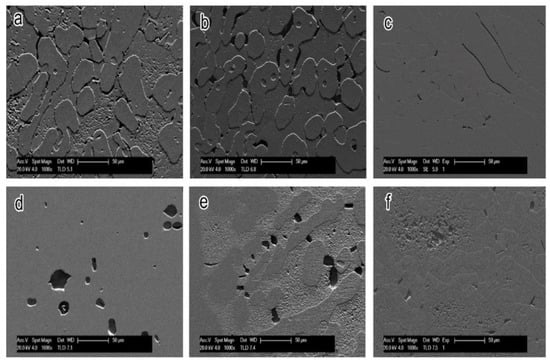
Figure 13.
SEM photographs of corrosion morphology of S32750 stainless steel at different annealing temperatures for 35 min after polarization tests: (a) 950, (b) 1000, (c) 1050, (d) 1100, (e) 1150, and (f) 1200 °C.
The corrosion morphology of the samples obtained by annealing with different holding times at 1050 °C is shown in Figure 14. The corrosion pits of the 20 and 60 min samples were remarkable, but the pitting corrosion pits of the 30 min and 40 min samples were not obvious. Comparing Figure 14b with Figure 13c, the height difference between ferrite and austenite in Figure 13c is smaller, and the pitting potential after annealing at 35 min is higher than after 30 min according to the polarization test results. We concluded that the optimum pitting resistance can be obtained for S32750 stainless steel annealed at 1050 °C for 35 min.
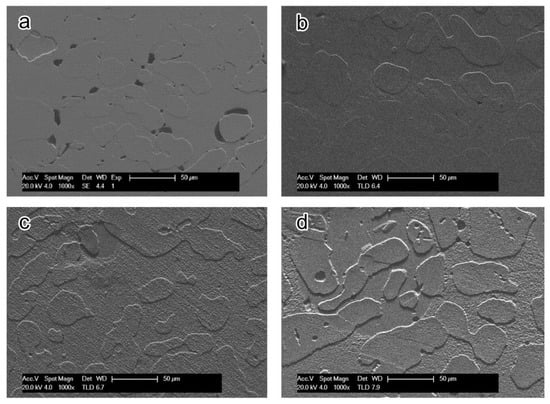
Figure 14.
SEM photographs of corrosion morphology of S32750 stainless steel at different annealing times at 1050 °C after polarization tests: (a) 20, (b) 30, (c) 40, and (d) 60 min.
4. Discussion
The pitting corrosion resistance of duplex stainless steel is determined by the weak phase in the two phases, and when their pitting corrosion resistance is similar, the overall pitting corrosion resistance of duplex stainless steel is still good. The pitting corrosion resistance of stainless steel is often quantitatively evaluated by the pitting resistance equivalent number (PREN) [20,21,22,23,24,25]. As an empirical measurement of pitting corrosion resistance of duplex stainless steel, PREN is defined as a function related to alloy elements Cr, Mo, N, and Mn. Due to the partition of alloy elements, PREN values in austenite and ferrite are different. The equation for calculating the PREN of ferrite phase is [26,27,28]:
With regard to austenite, the calculation is:
PRENα = [Cr] + 3.3[Mo]
PRENγ-16 = [Cr] + 3.3[Mo] + 16[N] – [Mn]
PRENγ-30 = [Cr] + 3.3[Mo] + 30[N] – [Mn]
The coefficient of [N] in the equation for calculating austenite PREN is usually 16 or 30. In this work, we used 16. The PREN values were calculated according to the above formulas, as shown in Figure 15. The PREN values of austenite were obviously higher than those of ferrite, and PRENα decreased gradually with the increase in temperature, but the PRENγ-16 increased gradually due to the migration of Cr and Mo from ferrite to austenite.
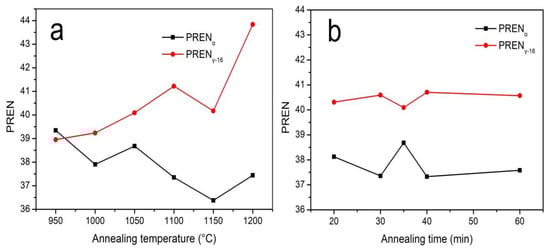
Figure 15.
The PREN values of S32750 annealed at different (a) temperatures and (b) times.
Figure 15 shows that the curves of PRENα and PRENγ-16 intersect at 961 °C. According to PREN semi-empirical theory, the pitting corrosion resistance of super duplex steel is determined by the phase with the lower pitting potential, so the corrosion resistance of ferrite determines the overall corrosion resistance of S32750 stainless steel. However, according to the experimental results, the relationship between pitting potential and temperature exhibits an inverted V-shape rather than monotonically decreasing. With the evolution of PRENα, Ha et al. reported that the ferrite fraction of the highest pitting corrosion resistance of duplex stainless steel was 56% rather than 50% based on PREN theory [7]. Garfias-Mesias et al. demonstrated that the pitting corrosion resistance of S32550 duplex stainless steel is not evaluated by the ferrite PREN value that is lower than that of the austenite phase [18]. Thus, the overall pitting corrosion resistance of S32750 duplex stainless steel cannot be evaluated only using a single factor of the PREN value.
However, Figure 15b shows that the PREN difference between the two phases is the smallest at 35 min compared with the other annealing times, and the highest pitting resistance potential also occurred at 35 min, which seems to be consistent with traditional PREN theory. Based on the above analysis, in this work, the pitting corrosion resistance of S32750 stainless steel was due to the combination of PREN value, phase fraction and grain boundary area fraction, and the imbalance in corrosion potential. Thus, further work is needed to identify the factors affecting the pitting corrosion resistance or to modify the PREN theory.
5. Conclusions
The effect of annealing treatment on the microstructure and pitting corrosion resistance of S32750 super duplex stainless steel was investigated in this study. Our conclusions are as follows:
(1) The volume fractions of ferrite in the S32750 duplex stainless steel increase from 48.9% to 68.4% as annealing temperatures increase from 950 to 1200 °C.
(2) In S32750 duplex stainless steel, Cr and Mo are enriched in the ferrite phase, while Ni and Mn are enriched in the austenite phase. With increasing annealing temperature, the concentrations of Cr, Mo, Ni, and Mn in the austenite phase decrease.
(3) The pitting potential of the sample increased first and then decreased with annealing temperatures of 950–1050 °C, and the process parameters for obtaining the optimum pitting resistance were annealing at 1050 °C for 35 min.
(4) The pitting corrosion resistance of S32750 stainless steel is due to the combination of PREN value, phase fraction and grain boundary area fraction, and imbalance in corrosion potential.
Author Contributions
Conceptualization, S.L. and C.Y.; methodology, S.L. and X.C.; validation, S.L.; formal analysis, S.L. and Q.Z.; investigation, S.L.; resources, Y.T.; data curation, C.Y.; writing—original draft preparation, S.L.; writing—review and editing, S.L. and Y.T.; visualization, S.L.; supervision, Y.T.; project administration, Y.T.; funding acquisition, Y.T. All authors have read and agreed to the published version of the manuscript.
Funding
This work was supported by the Transformation project of scientific and technological achievements in Jiangsu Province (No. BA2015030150).
Acknowledgments
The authors appreciate the guidance with the EBSD experiments from Mengqi Yuan, who belongs to the School of Materials Science and Engineering, Southeast University.
Conflicts of Interest
The authors declare that they have no conflicts of interests.
References
- Akisanya, A.R.; Obi, U.; Renton, N.C. Effect of ageing on phase evolution and mechanical properties of a high tungsten super-duplex stainless steel. Mater. Sci. Eng. A 2012, 535, 281–289. [Google Scholar] [CrossRef]
- Eguchi, K.; Burnett, T.L.; Engelberg, D.L. X-ray tomographic characterisation of pitting corrosion in lean duplex stainless steel. Corros. Sci. 2020, 165, 108406. [Google Scholar] [CrossRef]
- Deng, B.; Jiang, Y.M.; Gao, J.; Li, J. Effect of annealing treatment on microstructure evolution and the associated corrosion behavior of a super-duplex stainless steel. J. Alloy. Compd. 2010, 493, 461–464. [Google Scholar] [CrossRef]
- Xu, X.; Wessman, S.; Odqvist, J.; King, S.M.; Hedstronm, P. Nanostructure, microstructure and mechanical properties of duplex stainless steels 25Cr-7Ni and 22Cr-5Ni (wt.%) aged at 325 °C. Mater. Sci. Eng. A 2019, 754, 512–520. [Google Scholar] [CrossRef]
- Lv, J.L.; Liang, T.X.; Dong, L.M.; Wang, C. Influence of sensitization on microstructure and passive property of AISI 2205 duplex stainless steel. Corros. Sci. 2016, 104, 144–151. [Google Scholar]
- Vijayalakshmi, K.; Muthupandi, V.; Jayachitra, R. Influence of heat treatment on the microstructure, ultrasonic attenuation and hardness of SAF 2205 duplex stainless steel. Mater. Sci. Eng. A 2011, 529, 447–451. [Google Scholar] [CrossRef]
- Ha, H.-Y.; Jang, M.-H.; Lee, T.-H.; Moon, J. Understanding the relation between phase fraction and pitting corrosion resistance of UNS S32750 stainless steel. Mater. Charact. 2015, 106, 338–345. [Google Scholar] [CrossRef]
- Jiang, Y.M.; Sun, T.; Li, J.; Xu, J. Evaluation of Pitting Behavior on Solution Treated Duplex Stainless Steel UNS S31803. J. Mater. Sci. Technol. 2014, 30, 179–183. [Google Scholar] [CrossRef]
- Hou, Y.; Zhao, J.; Cheng, C.-Q.; Zhang, L.; Li, J.; Liu, J.-B.; Cao, T.-S. The metastable pitting corrosion of 2205 duplex stainless steel under bending deformation. J. Alloy. Compd. 2020, 830, 154422. [Google Scholar] [CrossRef]
- Zhang, Z.Y.; Wang, Z.Y.; Jiang, Y.M.; Tan, H.; Han, D.; Guo, Y.J.; Li, J. Effect of post-weld heat treatment on microstructure evolution and pitting corrosion behavior of UNS S31803 duplex stainless steel welds. Corros. Sci. 2012, 62, 42–50. [Google Scholar] [CrossRef]
- Yang, Y.; Tan, H.; Zhang, Z.; Wang, Z.; Jiang, Y.; Jiang, L.; Li, J. Effect of Annealing Temperature on the Pitting Corrosion Behavior of UNS S82441 Duplex Stainless Steel. Corrosion 2013, 69, 167–173. [Google Scholar] [CrossRef]
- Zhang, W.; Jiang, L.Z.; Hu, J.C.; Song, H.M. Study of mechanical and corrosion properties of a Fe-21.4Cr-6Mn-1.5Ni-0.24N-0.6Mo duplex stainless steel. Mater. Sci. Eng. A 2008, 497, 501–504. [Google Scholar]
- Yoon, H.; Ha, H.-Y.; Kim, S.-D.; Lee, T.-H.; Jang, J.H.; Moon, J.; Kang, N. Effects of carbon substitution for nitrogen on the pitting corrosion resistance of type UNS S32205 duplex stainless steel. Corros. Sci. 2020, 164, 108308. [Google Scholar] [CrossRef]
- Ha, H.-Y.; Lee, T.-H.; Lee, C.G.; Yoon, H. Understanding the relation between pitting corrosion resistance and phase fraction of S32101 duplex stainless steel. Corros. Sci. 2019, 149, 226–235. [Google Scholar] [CrossRef]
- Wan, J.; Lou, Y.; Ruan, H. The partition coefficient of alloying elements and its influence on the pitting corrosion resistance of 15Cr-2Ni duplex stainless steel. Corros. Sci. 2018, 139, 13–20. [Google Scholar] [CrossRef]
- Tan, H.; Jiang, Y.M.; Deng, B.; Sun, T.; Xu, J.L.; Li, J. Effect of annealing temperature on the pitting corrosion resistance of super duplex stainless steel UNS S32750. Mater. Charact. 2009, 60, 1049–1054. [Google Scholar] [CrossRef]
- Hwang, H.; Park, Y. Effects of Heat Treatment on the Phase Ratio and Corrosion Resistance of Duplex Stainless Steel. Mater. Trans. 2009, 50, 1548–1552. [Google Scholar] [CrossRef]
- Garfias-Mesias, L.F.; Sykes, J.M.; Tuck, C.D.S. The effect of phase compositions on the pitting corrosion of 25 Cr duplex stainless steel in chloride solutions. Corros. Sci. 1996, 38, 1319–1330. [Google Scholar] [CrossRef]
- Ha, H.-Y.; Jang, M.-H.; Lee, T.-H.; Moon, J. Interpretation of the relation between ferrite fraction and pitting corrosion resistance of commercial 2205 duplex stainless steel. Corros. Sci. 2014, 89, 154–162. [Google Scholar] [CrossRef]
- Speidel, M.O. New nitrogen-bearing austenitic stainless steels with high strength and ductility. Met. Sci. Heat Treat. 2005, 47, 489–493. [Google Scholar] [CrossRef]
- Kim, S.-T.; Lee, I.-S.; Kim, J.-S.; Jang, S.-H.; Park, Y.-S.; Kim, K.-T.; Kim, Y.-S. Investigation of the localized corrosion associated with phase transformation of tube-to-tube sheet welds of hyper duplex stainless steel in acidified chloride environments. Corros. Sci. 2012, 64, 164–173. [Google Scholar] [CrossRef]
- Martins, C.M.B.; Moreira, J.L.; Martins, J.I. Corrosion in water supply pipe stainless steel 304 and a supply line of helium in stainless steel 316. Eng. Fail. Anal. 2014, 39, 65–71. [Google Scholar] [CrossRef]
- Li, C.X.; Bell, T. Corrosion properties of active screen plasma nitrided 316 austenitic stainless steel. Corros. Sci. 2004, 46, 1527–1547. [Google Scholar] [CrossRef]
- Guo, Y.J.; Sun, T.Y.; Hu, J.C.; Jiang, Y.M.; Jiang, L.Z.; Li, J. Microstructure evolution and pitting corrosion resistance of the Gleeble-simulated heat-affected zone of a newly developed lean duplex stainless steel 2002. J. Alloy. Compd. 2016, 658, 1031–1040. [Google Scholar] [CrossRef]
- Zhang, Z.Y.; Zhang, H.Z.; Zhao, H.; Li, J. Effect of prolonged thermal cycles on the pitting corrosion resistance of a newly developed LDX 2404 lean duplex stainless steel. Corros. Sci. 2016, 103, 189–195. [Google Scholar] [CrossRef]
- Weber, L.; Uggowitzer, P.J. Partitioning of chromium and molybdenum in super duplex stainless steels with respect to nitrogen and nickel content. Mater. Sci. Eng. A 1998, 242, 222–229. [Google Scholar] [CrossRef]
- Rondelli, G.; Vicentini, B.; Cigada, A. Influence of nitrogen and manganese on localized corrosion behavior of stainless-steels in chloride environments. Mater. Corros. 1995, 46, 628–632. [Google Scholar] [CrossRef]
- Ha, H.; Kwon, H. Effects of Cr2N on the pitting corrosion of high nitrogen stainless steels. Electrochim. Acta. 2007, 52, 2175–2180. [Google Scholar] [CrossRef]
© 2020 by the authors. Licensee MDPI, Basel, Switzerland. This article is an open access article distributed under the terms and conditions of the Creative Commons Attribution (CC BY) license (http://creativecommons.org/licenses/by/4.0/).