Abstract
Within the scope of the comprehensive elucidation of the entire process chain for the production of highly functional thin films made of semiconducting aluminum-doped zinc oxide () nanocrystals, this work deals with the detailed investigation of the stabilization sub-process, considering the requirements for the subsequent coating process. An innovative investigation procedure using non-invasive small angle X-ray scattering () is developed, enabling an evaluation of qualitative and quantitative dispersion stability criteria of sterically stabilized nanocrystals. On the one hand, qualitative criteria for minimizing layer inhomogeneities due to sedimentation as well as aggregate formation are discussed, enabling a high particle occupancy density. On the other hand, a procedure for determining the concentration using , both in the stable phase and in the non-stabilized phase, is demonstrated to provide a quantitative evaluation of the stabilization success, having a significant impact on the final layer thickness. The obtained insights offer a versatile tool for the precise stabilization process control based on synthesis process using to meet coating specific requirements and thus a successful integration into the entire process chain for the production of functional thin films.
1. Introduction
The field of printable electronics is gaining increasing economic importance and offers the possibility of producing flexible and (semi-)transparent electronic components for use in complex systems [1,2,3,4,5]. The printing of particulate inks to produce these systems offers an advantage compared to the application of expensive gas phase processes, as the deposition of individual functional layers can be omitted and much simpler equipment can be used. The production of particulate thin films consisting of transparent conductive oxides (), which can be applied in displays, organic light-emitting diodes, or thin-film solar cells [6,7,8,9,10], poses a major challenge, since nanoparticular layers often have very low conductivity due to their high interfacial resistances.
Here, the n-type semiconductor aluminum doped zinc oxide () is intended to replace previously used but poorly available indium-based oxides (e.g., ), due to similar application properties such as high transparency in the visible spectral range, good electronic conductivity, and high mechanical stability [11,12]. The specific adjustment of the optical, mechanical, and electrical properties of particulate thin films consisting of requires a comprehensive understanding of particle-based properties for the entire process chain within the fabrication process, starting with the synthesis of the nanocrystals followed by their conversion into stable dispersions up to the coating and drying or post-processing of the final layers. For this purpose, small-angle X-ray scattering () as a non-invasive measuring method basically offers the possibility of recording and correlating structural properties in each individual process step independently of the state of the nanoparticles (e.g., powder, dispersion, or thin film) [13,14,15]. In the course of our own previous work, the synthesis of nanocrystals via the benzylamine route could be comprehensively clarified using X-ray scattering analysis methods, on the one hand, by developing a growth model covering the time-resolved growth to hexagonal-shaped mesocrystalline nanoparticles [16] and, on the other hand, by investigating influences of important process parameters on the growth behavior at low reaction kinetics [17].
Emanating from these prior works, an investigation procedure using the analysis method is developed in this paper to extensively focus on the dispersion stability of sterically stabilized nanocrystals regarding the requirements of the subsequent coating process.
In detail, the first step is the identification and assignment of several structural levels within the non-stabilized system after synthesis and purification using our laboratory camera to get deep insights into the initial state before stabilization. All results are validated by dynamic light scattering () and transmission electron microscopy (), concerning both their particulate and fractal properties, and then evaluated in terms of their stabilization potential concerning effects on the coating process.
Subsequently, the sterically stabilized dispersion in the solvent ethanol is first investigated qualitatively using by time-resolved analysis of the stability behavior towards sedimentation in the Earth’s gravitational field in order to draw conclusions about inhomogeneities due to sedimentation occurring during the coating process. Then, a further investigation of the structural levels within the stabilized system is carried out, ensuring stabilization at the lowest possible structural level and thus enabling a high particle occupancy density of the final thin film.
Finally, the dispersion is investigated quantitatively using by demonstrating a new method allowing a non-invasive determination of the concentration, in both the stable phase and the non-stable disperse phase, for significantly higher particle concentrations than can be characterized by common analysis methods (e.g., in the UV-Vis spectral range) after successful calibration of our laboratory camera. This allows the introduction and determination of a coefficient providing quantitative conclusions regarding the stability success, having a considerable impact on the final layer thickness.
2. Material and Methods
2.1. Synthesis and Sample Purification of AZO Nanocrystals
For the non-aqueous sol-gel synthesis of nanocrystals via the benzylamine route, the crystalline precursors zinc acetylacetonate hydrate ( powder, , Aldrich) and aluminum isopropoxide () with the initial precursor concentration were used, wherein the molar fraction of aluminum precursor was set to . The aromatic solvent benzylamine (, benzylamine for synthesis, , Merck) served as reaction medium. An ideally stirred open batch reactor () was used to carry out the synthesis at the constant process temperature . Here, the aluminum precursor was pre-dissolved in the reaction medium during the heating phase due to its poor solubility. After reaching the process temperature, the synthesis process was started with addition of the zinc precursor. The endothermic synthesis was ended by quenching the particle growth after by rapid cooling in a water bath. To remove the organic reaction medium from the particle surface necessary for the subsequent stabilization process, the nanocrystals were purified after the synthesis by repetitive centrifugation and dispersion processes and were finally presented in an ethanol-based dispersion, as described in detail in our prior works [16,17].
2.2. Post-Synthetic Stabilization of AZO Nanocrystal Dispersions
Based on preliminary works about steric stabilization and surface modification of nanoscale metal oxide using n-carboxylic acids [18,19,20,21,22,23], -Trioxadecanoic acid (, , Merck) was selected as stabilizer for the steric stabilization of the pure nanocrystal dispersion in the solvent ethanol. The carboxyl group of , having a negative partial charge in aqueous systems ( [24], adsorbs on the positively charged particle surface of , while the alkyl chain, including three polar oxo groups, provides steric hindrance. Since the amount of used stabilizer scales with the entire particle surface and thus indirectly with the metrological accessible particle mass, in Equation (1) the added stabilizer concentration was always based on the particle concentration of the non-stabilized initial dispersion .
The sequence of the stabilization and centrifugation process is based on the work of Zellmer et al. [25]. In the first step, the ethanol-based initial dispersion was treated with ultrasound for getting a homogeneous particle dispersion. In a second step, the stabilizer was added, followed by reaction between stabilizer and particle surface during stirring at for at room temperature (HLC Heating-ThermoMixer, DITABIS). Depending on the procedure, this could result in two particle fractions: a stable phase at the nanoscale level and remaining agglomerates as unstable phase at the micron scale. The subsequent separation of the stable and unstable particle phases was carried out by centrifugation (Centrifuge 5430R, Eppendorf) for a minimum time period of , introducing the separation time of ideal spheres in the centrifugal field according to Stokes, as shown in Equation (2).
On the basis of the known parameters such as the solvent–solid density difference , the dynamic solvent viscosity , the gravitational force , the maximum sedimentation path of the particles , and the relative centrifugal force , the separation grain limit can be set via the corresponding minimum centrifugation time period . Finally, a stable phase of sterically stabilized nanocrystals in ethanol using with particle sizes is obtained by assuming the validity of the Stokes conditions during centrifugation.
2.3. Characterization of AZO Nanocrystal Dispersions
For a comprehensive characterization of the stability properties of nanocrystal dispersions, a non-invasive X-ray analysis was performed using a lab scale camera (XEUSS 2.0, XENOCS). The point-collimated X-ray beam (), generated from a microfocus X-ray source, was monochromatized on ( and parallel focused on detection plane. The samples present in after purification (see Section 2.1) were injected as a homogeneous suspension into a low-scattering polyimide tube with an inner diameter of and wall thickness . The X-ray scattering intensity on samples was measured as a function of the scattering vector with , wheras is the scattering angle, and recorded by a two-dimensional hybrid photon counting X-ray detector with a pixel size of (PILATUS 300K-S, DECTRIS) for . The scattering intensity of a monodisperse particle system, normalized to the squared classical electron radius , including monodisperse particles with the single volume and the excess electron density in the exposed liquid volume is generally described in Equation (1).
Here, the form factor describes the intraparticle scatter fraction, whereas the interparticle scatter fraction is specified by the structure factor . For the description of particulate interactions for , the influence of the structure factor with can be neglected [26]. Beaucage et al. introduced a unified approximation with Equation (4) to describe experimental data from particle systems consisting of structure levels , such as aggregates or surface fractals [27].
Equation (4) describes a summation of local Guinier- and Power-Laws of each structure level within the particle system. The local Guinier-Law
is influenced by the radius of gyration and the pre-factor of the corresponding th structural level, which is given by
wherein and denote the particle number density and the structure volume of the th level. The parameter can be regarded as constant due to a not changing . Moreover, from the local Power-Law
the respective fractal information can be extracted from the power . In case of mass fractals, the mass fractal dimension is described by Equation (8) and for surface fractals Equation (9) is to be used [27,28,29].
In the special case of for surface fractals, Equation (7) leads to the Porod-Law describing smooth surfaces with sharp density transition [30], wherein the so-called “Porod constant” is shown in Equation (10) including the average structure surface .
In addition to , further particle properties of present in were analyzed by using a Zetasizer device (Nano ZS, Malvern) and (Osiris ChemiStem, FEI). For , the samples had to be diluted with and air-dried on a grid at . Finally, for recording the concentration by gravimetric analysis, the nanocrystals were completely dried at for under ambient pressure in a drying oven (UN260, Memmert) and afterwards quantified with an analytical scale (Secura 224-1S, Sartorius).
3. Results and Discussions
3.1. Characterization of Non-stabilized AZO Nanocrystal Dispersions
The aim in this section is to investigate the aggregation behavior, the size range of the stabilizable primary particles, and its mass-fractal structures of non-stabilized nanocrystals being able to make important predictions about the stabilization behavior of . In this context, the particle structure and the fractal properties of nanocrystals in an ethanol-based dispersion after synthesis, particle preparation (see Section 2.1), and before stabilization are examined in more detail using , , and . Figure 1 shows the curve (black dots) of a non-stabilized initial dispersion with a gravimetrically determined initial particle mass concentration , wherein is plotted twice logarithmically over .
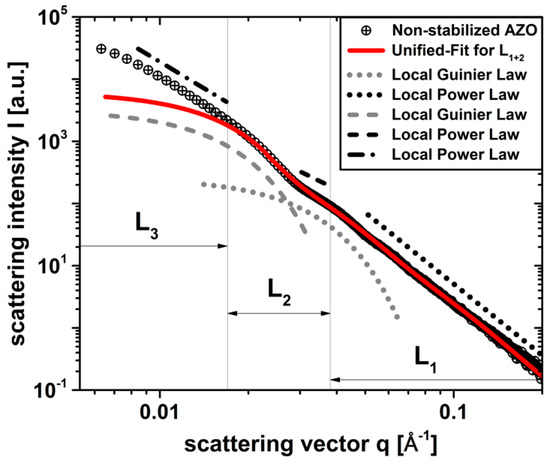
Figure 1.
curve of a non-stabilized dispersion in ethanol (black dots) including the local Guinier- and Power-laws of three particulate population levels (dotted), (dashed), and (dotted/dashed). and were approximated using the Unified-Fit model according to Beaucage (solid line).
In Figure 1, the qualitative course of shows the presence of three structural levels within the particle system examined depending on the -range: (dotted) in , (dashed) in and (dotted/dashed) in . To each level, one local Guinier area (curved line) can generally be assigned from Equation (5) including the associated local Power-Law (straight line) from Equation (7). The Guinier area of , indicated by the Power-Law of and expected in the q-range , was not detectable due to the lower resolution limit of the camera used. Therefore, the Unified-Fit model according to Beaucage from Equation (4) was approximated with a high degree of certainty () to the fully resolvable levels and of the curve in Figure 1, resulting in important structure parameters of the non-stabilized system such as the two local radii of gyration , as well as the local powers , . By assuming spherical structures within all levels , the respective volume-weighted geometric mean diameters and were calculated with . The image in Figure 2a is used to assign the structural parameters of the various levels from the Unified-Fit model obtained with to the actually existing particle structures of the examined non-stabilized nanocrystals.
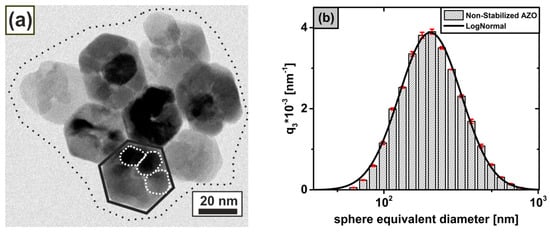
Figure 2.
(a) HRTEM image of an aggregate (dotted line) based on hexagonal-shaped mesocrystals (solid line) with internal grain boundaries (dashed line); and (b) volume-weighted size density distribution of the non-stabilized dispersion in ethanol from data (bars) including the associated log-normal distribution (solid line).
Figure 2a shows hexagonally shaped mesocrystalline particle structures of (solid line) with remaining internal grain boundaries (dashed line) arising due to non-classical crystal growth with oriented agglomeration processes during the synthesis process, as we reported previously [16,17]. Here, the mesocrystals are arranged in superordinate aggregate structures with clearly visible phase boundaries, resulting in an average mesocrystal size of from a statistical imaging evaluation of approximately mesocrystals using under the assumption of spherical particles. The order of the size of the present aggregate structures of mesocrystals could be estimated on the basis of a log-normal particle size distribution fit ( using data in Figure 2b to a volume-weighted mean sphere-equivalent diameter , which is more than times larger than the -based mesocrystal size. Using the and results in Figure 2, it is possible to clearly assign the structural levels, obtained from in Figure 1 to the actual particle levels of the investigated nanoparticle system. By comparing the respective orders of magnitude, the local Guinier fit of with can be assigned to the mesocrystal level with ), while with corresponds to the visible substructures of the incompletely fused mesocrystals on primary particle level in Figure 2a. The non-resolvable Guinier range of in Figure 1 can be solely associated with the aggregation level of the mesocrystals having the size . Based on the currently known particle hierarchy of the non-stabilized dispersion, fractal properties can be derived for the structure levels and using the power laws obtained from the Unified-Fit model in Figure 1. While the mass fractals in with (see Equation (8)) describe a high relative aggregation density in the range [31], contains surface fractals with (see Equation (9)), indicating smooth crystal surfaces on primary particle level in accordance to our prior work [16]. Since could not be fully analyzed due to the limited resolution of our -camera, a precise determination of the fractal properties using the Unified-Fit model is not possible. However, based on the and data, mass fractals in the range could be generally predicted from the aggregation behavior of the mesocrystals in Figure 2.
Hence, the existence of three structural levels within the non-stabilized particle system was verified using predominantly measurement technology. In addition to the precise assignment of the individual levels to the present system, their magnitude and fractal properties could also be estimated and additionally validated by and . The knowledge gained here results in comprehensive objectives for the subsequent stabilization process: the aggregate structure in of approximately is to be broken up and is to be stabilized on the mesocrystal level to a mean size of approximately maximum , while no post-synthetic stabilization is expected at the irreversibly intergrown primary crystal level of approximately .
3.2. Qualitative Dispersion Stability Criteria of Stabilized AZO Nanocrystals
The stability in the gravitational field is an important qualitative stability criterion of dispersions utilized for the production of particulate thin films, since sedimentation processes can cause inhomogeneities in the layer formation during coating and drying processes. In this context, sterically stabilized dispersions with (see Section 2.2) were examined by time-resolved sedimentation analysis in the Earth’s gravity field using our laboratory camera. Assuming that all quantities except are constant in Equation (3) during a sedimentation process, the linear relationship allows conclusions to be drawn about the relative temporal change in by normalizing the scatter intensity to the maximum value at constant . For this purpose, the relative of stabilized dispersions using in the initial concentration range of were recorded and finally plotted in Figure 3a over a sedimentation time period of .
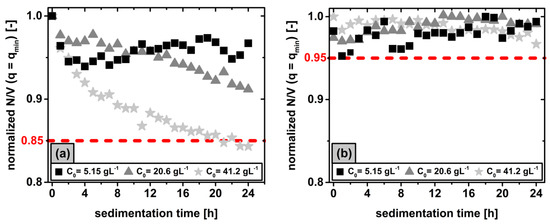
Figure 3.
The relative at constant of sterically stabilized dispersions having initial concentrations in the range of is plotted over a sedimentation time period of before (a) and after (b) removing unstable phases using data.
Irrespective of , the curves show a decrease in with progressive sedimentation time up to a maximum loss of approximately within at . Thus, an ongoing sedimentation process in the Earth’s gravity field could be observed using despite previous stabilization. To verify single grain sedimentation according to Stokes for the investigated particle concentration range of , the solid volume concentration can be calculated from the solid mass concentration using Equation (11) by assuming ideal spheres having the particle density of pure zinc oxide .
The volume concentrations calculated from Equation (11) for the samples used in Figure 3 are compared in Table 1.

Table 1.
The initial mass concentrations in the range of from the sedimentation experiment in Figure 3a are compared to their associated solid volume concentrations calculated using Equation (11).
In the literature, the Stokes approach applies i.a. to , wherein the sedimentation behavior is considered independent of the solid volume concentration [32,33]. This fact could explain the similar sedimentation behavior observed for the initial concentration range of in Figure 3a, whereas the sedimentation rate of with is significantly increased. A slight increase in concentration relative to leads to the formation of particle clusters, which result in a lower sedimentation resistance leading to the previously observed faster sedimentation compared to the Stokes approach [34]. However, a further increase in concentration would in turn cause a slowdown of the sedimentation due to growing interactions of counter flowing fluid particles, which is considered in the approach of Richardson and Zaki [35]. Consequently, the sedimentation process observed here within a time period of can be attributed to an unstable phase fraction within the stabilized dispersion consisting of aggregate structures that clearly exceed the order of magnitude of the primary crystal and the mesocrystal levels with , as previously obtained in Section 3.1. After separation of the unstable phase by centrifugation at the defined separation grain limit of at the previously observed mesocrystal level using Equation (2), no further sedimentation process could be detected in Figure 3b for all stable phases, consisting solely of and . The fluctuations of the values in Figure 3b within the range of approximately are due to the increasing influence of the Brownian molecular motion on the particle movement in the nanoscale range below . Finally, the long-term stability of the stable phase over a period of was successfully demonstrated by analysis after separating the unstable proportion in the centrifugal field.
As a further qualitative stability criterion regarding optimal application properties of particulate thin films, the highest possible particle occupancy density within the thin film must be ensured by stabilization at the lowest possible structural level of the system. After the previously shown successful separation at the aggregate level, a structural investigation of the stable phase is carried out using in analogy to Section 3.1. In this context, Figure 4 shows the curve of the stable phase from the initial dispersion in Figure 1, including the approximated Unified-Fit model () according to Beaucage from Equation (4) with its respective local Guinier- and Power-Laws of two structural levels (dotted) and (dashed).
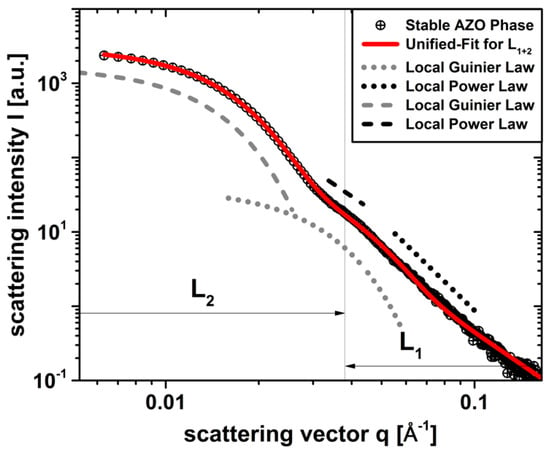
Figure 4.
curve of the stable phase in ethanol from the initial dispersion in Figure 1 (black dots) after centrifugation and including the local Guinier- and Power-laws of two structural levels (dotted), (dashed). and were approximated using the Unified-Fit model according to Beaucage (solid line).
Here, the Unified-Fit results in with for and with for . By comparing these parameters with the non-stabilized system in Figure 1 from Section 3.1, for and they are all in the same order of magnitude, whereby they can be clearly assigned to the already known primary crystal () and mesocrystal () levels having similar fractal properties. This fact shows that the essential structural properties of the system, such as size and fractal properties, were not significantly influenced by steric stabilization using . The presence of the third structural level, which was originally assigned to the aggregate structure in Section 3.1, is no longer detectable for the stable phase in Figure 4, indicating a successful steric stabilization of the system at the mesocrystal level . Obviously, the stabilization at the primary crystal level could not be achieved due to irreversible adhesions and intergrowth during synthesis, as expected and reported in our previous works [16,17]. Possibly, the intergrowth of the primary crystals into highly-ordered, regularly shaped hexagonal mesocrystals, having a high aggregation density with , could have a positive effect on the particle occupancy density and thus on the application properties of the final thin films (e.g., lower interfacial resistances), since a comparable density could probably not be generated by self-arrangement of stable particles during the coating and drying processes by stabilization at the primary crystal level alone. To validate the result in Figure 4 with respect to the successful stabilization at the mesocrystal level, the volume-weighted size density distribution of the stable phase from data in Figure 5 is used, which is additionally compared to the non-stabilized dispersion in Figure 2b.
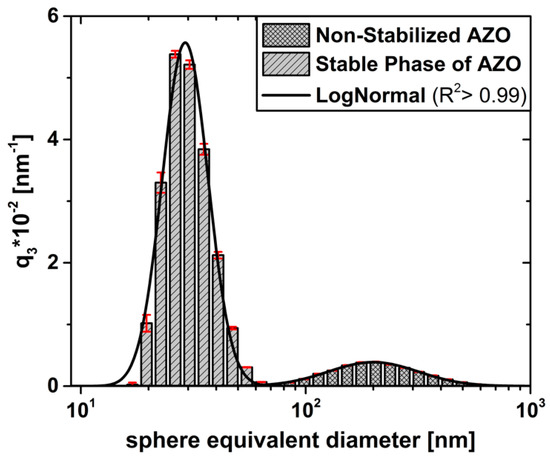
Figure 5.
Volume-weighted size density distribution of the stable phase (striped bars) is contrasted to the non-stabilized dispersion (plaid bars) in Figure 2b, including the associated log-normal distributions (solid lines).
Due to the stabilization, on the one hand, the log-normal particle size distribution of the stable phase shows a clear shift towards a smaller mean sphere equivalent diameter from originally to ), being in very good agreement with the mesocrystal level from data () in Figure 4 and data () in Figure 2a. On the other hand, the significant reduction of the density distribution width is a further qualitative indication for the removal of aggregated structures. To summarize this section, the qualitative stability criteria of the stable dispersion using offer very good prerequisites for producing homogeneous, particulate thin films, having the highest possible particle occupancy density, both because of the long-term stability towards sedimentation and due to the stability at the minimum possible mesocrystal level of approximately .
3.3. Quantitative Dispersion Stability Criteria of Stabilized AZO Nanocrystals
In addition to the previously investigated qualitative stability criteria, a quantitative evaluation of the stability success by non-invasive determination of the particle concentration of , both in the non-stabilized system and in the stable phase using , is reported in this section. Such a quantification is necessary since the particle concentration in the stable phase also significantly influence the layer thickness depending on the selected coating process, which in turn affects their application properties. The stability success is introduced in Equation (12), which relates the particle concentration in the stable phase to the initial concentration , enabling a quantitative evaluation of the particle fraction successfully transferred from the non-stabilized initial system into the stable phase using .
For the non-invasive quantitative determination of particle concentrations by means of , the local Guinier-law in Equation (5) from the Unified-Fit model is used, resulting in Equation (6) and the linear relationship . Since most of the parameters in Equation (6) are empirically difficult to determine, a theoretical prediction of concentrations based on measured from scattering curves is limited. Consequently, a calibration of our laboratory camera was necessary for the system, describing the linear relationship between and from Equation (6) by leaving all particle properties, obtained in Section 3.1 and Section 3.2, constant. For this purpose, stable phases in the range of were gravimetrically evaluated and their corresponding scattering curves at the mesocrystal level () including corresponding Unified-Fit approximations () are shown in Figure 6a.
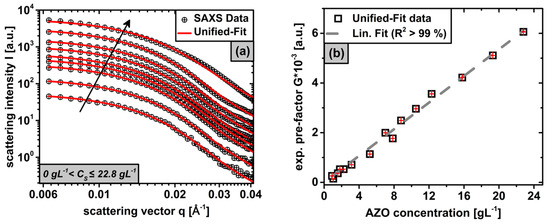
Figure 6.
curves of stable phases, having different concentrations in the range of , at the Guinier area of the mesocrystal level ( ) including their associated Unified-Fit approximations (a); The exponential pre-factors of determined from the Unified-Fit data in (a) are plotted over the corresponding concentration and approximated by a linear regression (b).
Here, the scattering intensity in the Guinier area of increases with rising particle concentration for constant particle properties (arrow). Based on the Unified-Fit models in Figure 6a, the exponential pre-factors of were determined for each concentration from the respective local Guinier-Law in Equation (5) and show a linear correlation concerning the concentration with a very high coefficient of determination () in Figure 6b. This linear relationship, confirmed by Equation (6), shows the validity of our laboratory camera used. Using linear regression, a calibration function could be obtained for the non-invasive determination of the concentration by means of at from data in Equation (13).
This calibration function can be generally used for the structural level in the stable as well as in the non-stabilized phases, since the technique is capable of providing this information from Guinier areas independent of the aggregation state. To verify the validity of Equation (13) also for the non-stabilized phase, after determining the exponential pre-factor of with from the Unified-Fit model of the non-stabilized initial dispersion in Figure 1 using , the initial concentration could be calculated, which corresponds very well to the gravimetric result () in Section 3.1. Similarly, extracting of the stable phase from Figure 4, the corresponding concentration of the stable phase could also be calculated using Equation (13). Finally, with both concentration values obtained here from data, a stabilization efficiency of was derived from Equation (12) for the system investigated in this work.
To summarize this section, a new method for quantitative determination of the concentration, both for the non-stabilized phase and for the stabilized phase using is successfully demonstrated, leading to an evaluation of the quantitative stability criterion . On the one hand, the non-invasive X-ray scattering offers an advantage to the invasive, non-reversible gravimetric method concerning the further processing of the stable phases into functional thin films. On the other hand, covers a significantly higher concentration range, being particularly relevant for coating applications, for determining the concentration of particulate systems in contrast to, e.g., UV-Vis methods, in which even concentrations of could no longer be described using the Lambert–Beer law.
4. Conclusions
In this work, we establish a detailed investigation procedure concerning significant dispersion stability criteria of sterically stabilized nanocrystals using a non-invasive analysis method, evaluating their suitability for subsequent coating processes for the fabrication of functional thin films. Qualitative stability criteria of the system can be generally studied, ensuring a homogeneous particle distribution during post-processing steps and a maximum packing density of particulate thin films. Furthermore, quantitative criteria are examined, influencing the layer thickness of thin films during coating processes.
In detail, we first verified the existence of three structural levels within the initially non-stabilized nanoparticle system using , which could be clearly assigned to the primary crystal, mesocrystal, and aggregation levels with the help of and , being consistent with our prior work. Particle-based properties of the individual structural levels, such as shape, sizes, and fractal properties were obtained, allowing significant predictions to be made about the stabilization behavior of at the mesocrystal level. Furthermore, we carried out sedimentation analysis on the sterically stabilized system to detect an unstable phase, being completely removed by centrifugation, on the one hand, and to successfully demonstrate the long-term stability of the stable phase over a period of , on the other hand. An additional structural analysis of the stable phase using showed that the mesocrystal level, representing the smallest possible stabilization level, meets the qualitative stability criteria of the stable dispersion and offers very good prerequisites for the production of homogeneous, particulate thin films with the highest possible particle coverage density. Finally, a new method for non-invasive determination of the concentration for both the non-stabilized and the stabilized phase using was successfully demonstrated to provide a quantitative evaluation of the stabilization success.
The obtained insights offer a versatile tool for the precise stabilization process control based on synthesis using to meet coating specific requirements and thus enable a successful integration of the stabilization process into the entire process chain for manufacturing functional thin films.
Author Contributions
Conceptualization, investigation, data curation, visualization, and writing—original draft preparation, J.U.; writing—review and editing, J.U., A.-K.T., G.G., and H.N.; and supervision, project administration, and funding acquisition, G.G. and H.N. All authors have read and agreed to the published version of the manuscript.
Funding
The research leading to these results has received funding from the German Research Foundation (DFG Ni 414/24-1 and Ga 1492/9-1). The APC was funded by the KIT-Publication Fund of the Karlsruhe Institute of Technology.
Acknowledgments
We express our immense thanks to Melanie Fuhrmann and Tim Delrieux for the experimental assistance.
Conflicts of Interest
The authors declare no conflict of interest.
References
- Patil, A.; Dighavkar, C.; Borse, R. Al doped ZnO thick films as CO2 gas sensors. J. Optoelectron. Adv. Mater. 2011, 13, 1331–1337. [Google Scholar]
- Stubhan, T.; Oh, H.; Pinna, L.; Krantz, J.; Litzov, I.; Brabec, C.J. Inverted organic solar cells using a solution processed aluminum-doped zinc oxide buffer layer. Org. Electron. 2011, 12, 1539–1543. [Google Scholar] [CrossRef]
- Winarski, D.; Selim, F. Synthesis of conductive sol-gel ZnO films and development of ZnO printed electronics. In Sol-Gel Method-Design and Synthesis of New Materials with Interesting Physical, Chemical and Biological Properties; IntechOpen: London, UK, 2019. [Google Scholar]
- Qiu, S.; Wu, K.; Gao, B.; Li, L.; Jin, H.; Li, Q. Solution-processing of high-purity semiconducting single-walled carbon nanotubes for electronics devices. Adv. Mater. 2019, 31, 1800750. [Google Scholar] [CrossRef] [PubMed]
- Scheideler, W.; Subramanian, V. Printed flexible and transparent electronics: Enhancing low-temperature processed metal oxides with 0d and 1d nanomaterials. Nanotechnology 2019, 30, 272001. [Google Scholar] [CrossRef] [PubMed]
- Lee, S.J.; Kim, S.; Lim, D.C.; Kim, D.H.; Nahm, S.; Han, S.H. Inverted bulk-heterojunction polymer solar cells using a sputter-deposited Al-doped ZnO electron transport layer. J. Alloys Compd. 2019, 777, 717–722. [Google Scholar] [CrossRef]
- Luo, L.; Rossell, M.D.; Xie, D.; Erni, R.; Niederberger, M. Microwave-assisted nonaqueous sol–gel synthesis: From Al: ZnO nanoparticles to transparent conducting films. ACS Sustain. Chem. Eng. 2012, 1, 152–160. [Google Scholar] [CrossRef]
- Meng, L.; Chai, H.; Yang, X.; Lv, Z.; Yang, T. Optically rough and physically flat tco substrate formed by coating ZnO thin film on pyramid-patterned glass substrate. Sol. Energy Mater. Sol. Cells 2019, 191, 459–465. [Google Scholar] [CrossRef]
- Liu, R.; Chen, Y.; Ding, S.; Li, Y.; Tian, Y. Preparation of highly transparent conductive aluminum-doped zinc oxide thin films using a low-temperature aqueous solution process for thin-film solar cells applications. Sol. Energy Mater. Sol. Cells 2019, 203, 110161. [Google Scholar] [CrossRef]
- Ellinger, C.R.; Nelson, S.F. Selective area spatial atomic layer deposition of ZnO, Al2O3, and aluminum-doped ZnO using poly(vinyl pyrrolidone). Chem. Mater. 2014, 26, 1514–1522. [Google Scholar] [CrossRef]
- Minami, T. Present status of transparent conducting oxide thin-film development for indium-tin-oxide (ITO) substitutes. Thin Solid Film. 2008, 516, 5822–5828. [Google Scholar] [CrossRef]
- Ellmer, K.; Klein, A.; Rech, B. Transparent Conductive Zinc Oxide: Basics and Applications in Thin Film Solar Cells; Springer Science & Business Media: Berlin/Heidelberg, Germany, 2007; Volume 104. [Google Scholar]
- Gutsche, A.; Meier, M.; Guo, X.; Ungerer, J.; Nirschl, H. Modification of a saxs camera to study structures on multiple scales. J. Nanopart. Res. 2017, 19, 321. [Google Scholar] [CrossRef]
- Nirschl, H.; Guo, X. Characterisation of structured and functionalised particles by small-angle X-ray scattering (saxs). Chem. Eng. Res. Des. 2018, 136, 431–446. [Google Scholar] [CrossRef]
- Meier, M.; Ungerer, J.; Klinge, M.; Nirschl, H. Formation of porous silica nanoparticles at higher reaction kinetics. Powder Technol. 2018, 339, 801–808. [Google Scholar] [CrossRef]
- Ungerer, J.; Thurm, A.-K.; Meier, M.; Klinge, M.; Garnweitner, G.; Nirschl, H. Development of a growth model for aluminum-doped zinc oxide nanocrystal synthesis via the benzylamine route. J. Nanopart. Res. 2019, 21, 106. [Google Scholar] [CrossRef]
- Ungerer, J.; Thurm, A.-K.; Garnweitner, G.; Nirschl, H. Formation of aluminum-doped zinc oxide nanocrystals via the benzylamine route at low reaction kinetics. Chem. Eng. Technol. 2020. [Google Scholar] [CrossRef]
- Neouze, M.-A.; Schubert, U. Surface modification and functionalization of metal and metal oxide nanoparticles by organic ligands. Monatshefte für Chemie Chem. Mon. 2008, 139, 183–195. [Google Scholar] [CrossRef]
- Napper, D.H. Steric stabilization. J. Colloid Interface Sci. 1977, 58, 390–407. [Google Scholar] [CrossRef]
- Farrokhpay, S. A review of polymeric dispersant stabilisation of titania pigment. Adv. Colloid Interface Sci. 2009, 151, 24–32. [Google Scholar] [CrossRef]
- Elbasuney, S. Sustainable steric stabilization of colloidal titania nanoparticles. Appl. Surf. Sci. 2017, 409, 438–447. [Google Scholar] [CrossRef]
- Grote, C.; Cheema, T.; Garnweitner, G. Comparative study of ligand binding during the postsynthetic stabilization of metal oxide nanoparticles. Langmuir 2012, 28, 14395–14404. [Google Scholar] [CrossRef]
- Cheema, T.A.; Garnweitner, G. Phase-controlled synthesis of ZrO2 nanoparticles for highly transparent dielectric thin films. CrystEngComm 2014, 16, 3366–3375. [Google Scholar] [CrossRef]
- Degen, A.; Kosec, M. Effect of pH and impurities on the surface charge of zinc oxide in aqueous solution. J. Eur. Ceram. Soc. 2000, 20, 667–673. [Google Scholar] [CrossRef]
- Zellmer, S.; Grote, C.; Cheema, T.; Garnweitner, G. Small-molecule stabilization mechanisms of metal oxide nanoparticles. In Colloid Process Engineering; Springer: Cham, Switzerland, 2015; pp. 73–91. [Google Scholar]
- Ashcroft, N.W.; Lekner, J. Structure and resistivity of liquid metals. Phys. Rev. 1966, 145, 83. [Google Scholar] [CrossRef]
- Beaucage, G. Approximations leading to a unified exponential/power-law approach to small-angle scattering. J. Appl. Crystallogr. 1995, 28, 717–728. [Google Scholar] [CrossRef]
- Schmidt, P. Small-angle scattering studies of disordered, porous and fractal systems. J. Appl. Crystallogr. 1991, 24, 414–435. [Google Scholar] [CrossRef]
- Boukari, H.; Lin, J.S.; Harris, M.T. Small-angle X-ray scattering study of the formation of colloidal silica particles from alkoxides: Primary particles or not? J. Colloid Interface Sci. 1997, 194, 311–318. [Google Scholar] [CrossRef]
- Porod, G. Die Röntgenkleinwinkelstreuung von dichtgepackten kolloiden Systemen. Kolloid Z. 1951, 124, 83–114. [Google Scholar] [CrossRef]
- Virtanen, A.; Ristimäki, J.; Keskinen, J. Method for measuring effective density and fractal dimension of aerosol agglomerates. Aerosol Sci. Technol. 2004, 38, 437–446. [Google Scholar] [CrossRef]
- Stieß, M. Mechanische Verfahrenstechnik-Partikeltechnologie 1; Springer: Berlin/Heidelberg, Germany, 2008. [Google Scholar]
- Schubert, H. Handbuch der Mechanischen Verfahrenstechnik; John Wiley & Sons: Hoboken, NJ, USA, 2012. [Google Scholar]
- Bickert, G.; Stahl, W. Sedimentationsverhalten von mono-und polydispersen, submikronen Partikeln in verdünnten und konzentrierten Suspensionen. Chem. Ing. Tech. 1996, 68, 1459–1462. [Google Scholar] [CrossRef]
- Richardson, J.; Zaki, W. The sedimentation of a suspension of uniform spheres under conditions of viscous flow. Chem. Eng. Sci. 1954, 3, 65–73. [Google Scholar] [CrossRef]
© 2020 by the authors. Licensee MDPI, Basel, Switzerland. This article is an open access article distributed under the terms and conditions of the Creative Commons Attribution (CC BY) license (http://creativecommons.org/licenses/by/4.0/).