Article

Deformation Induced Soft and Hard Lath Packets Enhance Ductility in Martensitic Steels

1
Department of Materials Physics, Eötvös Loránd University Budapest, PO Box 32, H-1518 Budapest, Hungary
2
Materials Performance Centre, School of Materials, The University of Manchester, Manchester M13 9PL, UK
3
Department of Materials Science and Engineering, Budapest University of Technology and Economics, PO Box 91, H-1521 Budapest, Hungary
*
Author to whom correspondence should be addressed.
Crystals 2020, 10(5), 373; https://doi.org/10.3390/cryst10050373
Submission received: 3 April 2020 / Revised: 30 April 2020 / Accepted: 2 May 2020 / Published: 6 May 2020
(This article belongs to the Special Issue X-ray and neutron Line Profile Analysis of Microstructures)

Abstract

:
Martensitic steels are widely used structural materials with outstanding mechanical properties. Their high strength is provided by the non-diffusional phase transformation of fcc γ into thin lamellar bcc plates during fast cooling. Coherency strains between the fcc and bcc lamellae induce large dislocation densities in the range of 1016 m−2, well above the densities attainable by conventional plastic deformation. Using high resolution X-ray line profile analysis, scanning electron microscopy, and hardness tests we show that during tensile deformation when the active Burgers vectors are within the lath plane the lath-packets work soften. On the contrary, when the active Burgers vectors are oblique to the lath-plane the lath-packets work harden. The softening and hardening processes in the differently oriented lath-packets produce a composite of hard and soft components on the length scale of lath-packet size. The stress–strain response of the alloy is discussed in terms of the different mean free paths and the different annihilation lengths of dislocations in the softened and hardened lath-packets. The relatively good ductility is shown to be produced by the composite microstructure induced by plastic strain.

1. Introduction

Lath-martensite steel is a low-alloy high-strength structural material with wide applications [1,2,3]. The strength relates to the hierarchical fine sub-grain size of lath-packets and martensite laths and to the high dislocation densities [4,5]. In the as-quenched state, depending on the content of carbon and other microalloying elements, its strength can reach values well above one GPa [1,2,3,4]. The fine lath martensite embedded into thin rest austenite films produces the high strength [1,2,3,4,5,6,7]. Within the large prior austenite grains lath martensite forms a hierarchical structure. The smallest units are the lamellar plates separated by austenite films arranged into small sub-blocks having thickness of one or two microns [2,5,6]. The sub-blocks, accommodated by different twin-related boundaries, arrange into blocks [2,5,8,9]. The blocks form packets in which all the laths are more-or-less parallel lamellae aligned coherently with their 110 oriented lath planes to one of the 111 type planes of the primary austenite [6,10,11].
Despite the extremely large flow stress, lath martensite does reveal a non-negligible ductility [1,12,13]. Microscale deformation experiments on micropillars consisting of a singular martensite block, oriented for easy glide along the plane of lath planes, revealed ideal stress-strain behavior with no strain hardening [14]. Micropillars containing more blocks with different lath lamellae orientations showed significant strain hardening [14]. Similarly, in other microscale tensile experiments, when the active slip systems were in-lath-plane the flow stress was relatively low, of about 350 MPa, whereas it doubled when the active slip systems were out-of-lath-plane [15]. The anisotropic stress–strain response of differently oriented lath-packets was shown in micro tensile experiments in a martensitic steel [16]. Three specimens were prepared by focused-ion-beam (FIB), one with the shear direction parallel to the habit plane of the laths (sample #1) and two with the shear direction across the habit plane of the laths (sample #2 and #3). In sample #1 with long mean free paths of dislocations the flow stress was about 890 MPa, whereas in samples #2 and #3 with short mean free paths of dislocations the flow stress was about 1200 MPa [16]. These experiments indicate that the local microscopic flow stress of lath martensite depends on the relative orientation between the habit plane direction of laths and the direction of the active Burgers vectors. Microscale compression experiments on pearlitic steels revealed similar anisotropic stress–strain behavior [17]. The flow stress was large when the pearlite lamellae were either parallel or normal to the compression direction, whereas it was smaller when the lamellae were inclined about 45° to the stress axis. Two phase composite materials are usually developed in order to improve the mechanical response of the pure single component properties, especially to increase the strength along with ductility [17,18,19,20]. Martensitic steels are usually tough and strong [1,2,3,4,5,6,7]. Ductility is more of a concern [21].
In recent in situ neutron diffraction experiments it was shown that the diffraction peaks of a tensile deformed low-alloy martensitic steel specimen become characteristically asymmetric during deformation or after unloading [22,23]. Characteristic asymmetry means that diffraction peaks measured on planes normal or parallel to the loading direction of the specimen become asymmetric in the opposite directions [24,25,26]. In the case of tensile deformed specimens, the lower-angle tails of peaks corresponding to the loading-direction diffraction vectors (axial case) become longer, whereas in peaks corresponding to the transverse-direction diffraction vectors (side case) the higher angle tails become longer [24,25,26]. In references [22,23] it was shown that the plastic strain induced characteristic peak asymmetry can be related to the decomposition of the initially homogeneous microstructure into a composite. It was shown that when the active Burgers vectors in the martensite packets are within the plane of the lath lamellae, the mean free paths of dislocations will be long and there will be either no substantial work hardening, or even work softening. When, however, the active Burgers vectors show across the boundaries of the lath-martensite lamellae, the mean free paths of dislocations will be short and substantial work hardening occurs. In the first case the dislocation densities were shown to decrease, or at least stagnate, whereas in the second case significant dislocation density increment was observed. Packets of the first or the second case were named soft orientation (SO) or hard orientation (HO), respectively.
In the present work we show that the composite type behavior observed in a specific martensitic steel in [22,23] is not unique to one composition, and is probably a general feature of low-carbon high-strength lath-martensite steels. We investigate a high-strength low-alloy lath-martensitic steel containing a negligible remaining austenitic phase, less than 1% in vol. pct. Though the specimen investigated here is different from that studied in [22,23], the fundamental features of the composite behavior induced by plastic deformation are similar. High resolution X-ray line profile analysis experiments are accompanied by scanning electron microscopy (SEM) and nanoindentation investigations. The dislocation densities and the long-range internal stresses provided by line profile analysis are discussed in terms of the Taylor equation separately for the SO and the HO components. The different work hardening behavior in the SO and HO packets leading to the composite structure is further supported by nanoindentation tests. We suggest that the deformation invoked composite structure provides the relatively good ductility and toughness of the high strength lath-martensite steel. Specifically, the work-softened lath-packets provide ductility, whereas the work hardened lath-packets provide high strength and toughness.

2. Experimental

2.1. Specimens

The composition of the as-received steel plate was Fe-0.16C-1.48Mn-0.29Si and the other components were less than 0.01 (all in wt. pct.). (We note that the composition of the lath-martensite steel specimen studied in references [22,23] was: Fe-0.22C-0.87Si-1.64Mn-0.024Ti-0.0015B-0.0025N, all in wt. pct.). The steel sheet had no specific texture. The plate was annealed at 1100 °C for 30 min and then quenched into room temperature (RT) water. From the quenched plate six dog-bone shaped specimens were cut for tensile tests with the tensile direction in the rolling direction of the plate. The tensile deformations were carried out in an MTS-810 standard testing machine at the strain velocity of 1 mm/min at room temperature, on each of the six specimens to different strain levels. The true stress vs. true strain is shown in Figure 1. The fracture of the material was at ε = 0.034 plastic strain, which is a relatively small value. The six true strain values, indicated as unloaded states in the figure, were chosen for specimens for the X-ray diffraction experiments. The maximum stresses applied to each of these specimens are denoted as σapp.
The undeformed state was also examined and its σapp value is considered as the yield stress, i.e., 600 (±30) MPa. This was determined from the stress–strain curve. Small pieces from the center regions of the samples were cut for XRD, SEM, nano- and microhardness measurements. The specimens were chemically etched in an electrolyte (10% perchloric acid, 70% ethanol, 20% glycerol) in order to remove any surface layer damaged by the sample preparation procedure.

2.2. X-ray Diffraction Experiments

The X-ray diffraction measurements were carried out in a special double-crystal diffractometer dedicated to line-profile-analysis using CoKα1 radiation with a wavelength of λ = 0.1789 nm. The cobalt anode of the sealed X-ray tube was operated at 30 kV and 35 mA with 0.4 × 8 mm2 fine line-focus. The primary beam was monochromatized by a plane Ge monochromator using the (220) reflection. A slit of about 0.2 mm was placed before the monochromator in order to select the CoKα1 line and to cut off the CoKα2 line.
The CoKα1 beam has a size of about 0.2 × 2.0 mm2 on the specimen surface. The scattered radiation was detected by two imaging plate (IP) detectors with the linear spatial resolution of 50 μm. The IPs were placed at the distance of 193 mm from the specimen covering the angular range between 2θ = 25° and 170°. The instrumental effect was negligible since the instrumental peak broadening was always less than 10% of the physical line broadening [27]. The diffraction patterns were obtained by integrating the intensity distributions along the corresponding Debye–Scherrer arcs on the IPs. The X-ray beam was positioned on the specimen surface using a low depth-resolution microscope coupled to a monitor. The measurements were taken at the side and axial surfaces of the deformed specimens, where the normal vectors of the axial and side surfaces are parallel or perpendicular to the applied stress direction, respectively. Two types of measurements were carried out for all deformed specimens using ω = 40° and ω = 80° angles between the incoming beam and the measured specimen surface. In such a manner, the g diffraction vector was close to perpendicular to the surface for both the 200 and the 310 diffraction peaks. The perpendicular g vector is needed for the calculations of the long-range internal stresses [24,25,26]. With these diffraction conditions the two diffraction peaks, i.e., the 200 and the 310, were used to evaluate the long-range internal stresses.
Using the CoKα1 radiation five diffraction peaks are measurable. The whole diffraction patterns were created by putting the two types of measurements together, i.e., the 110, 200, and 211 peaks were taken from the ω = 40°, while the 220 and 310 peaks were taken from the ω = 80° type measurements. In the case of the undeformed specimen only one measurement with ω = 40° was carried out because we assumed that the microstructure in the as-quenched state is homogeneous, where there are no long-range internal stresses [22,23]. Typical diffractions pattern corresponding to the axial diffraction conditions of the specimen tensile deformed to ε = 0.0013 are shown in Figure 2.

2.3. Nano- and Micro-Indentation Measurements

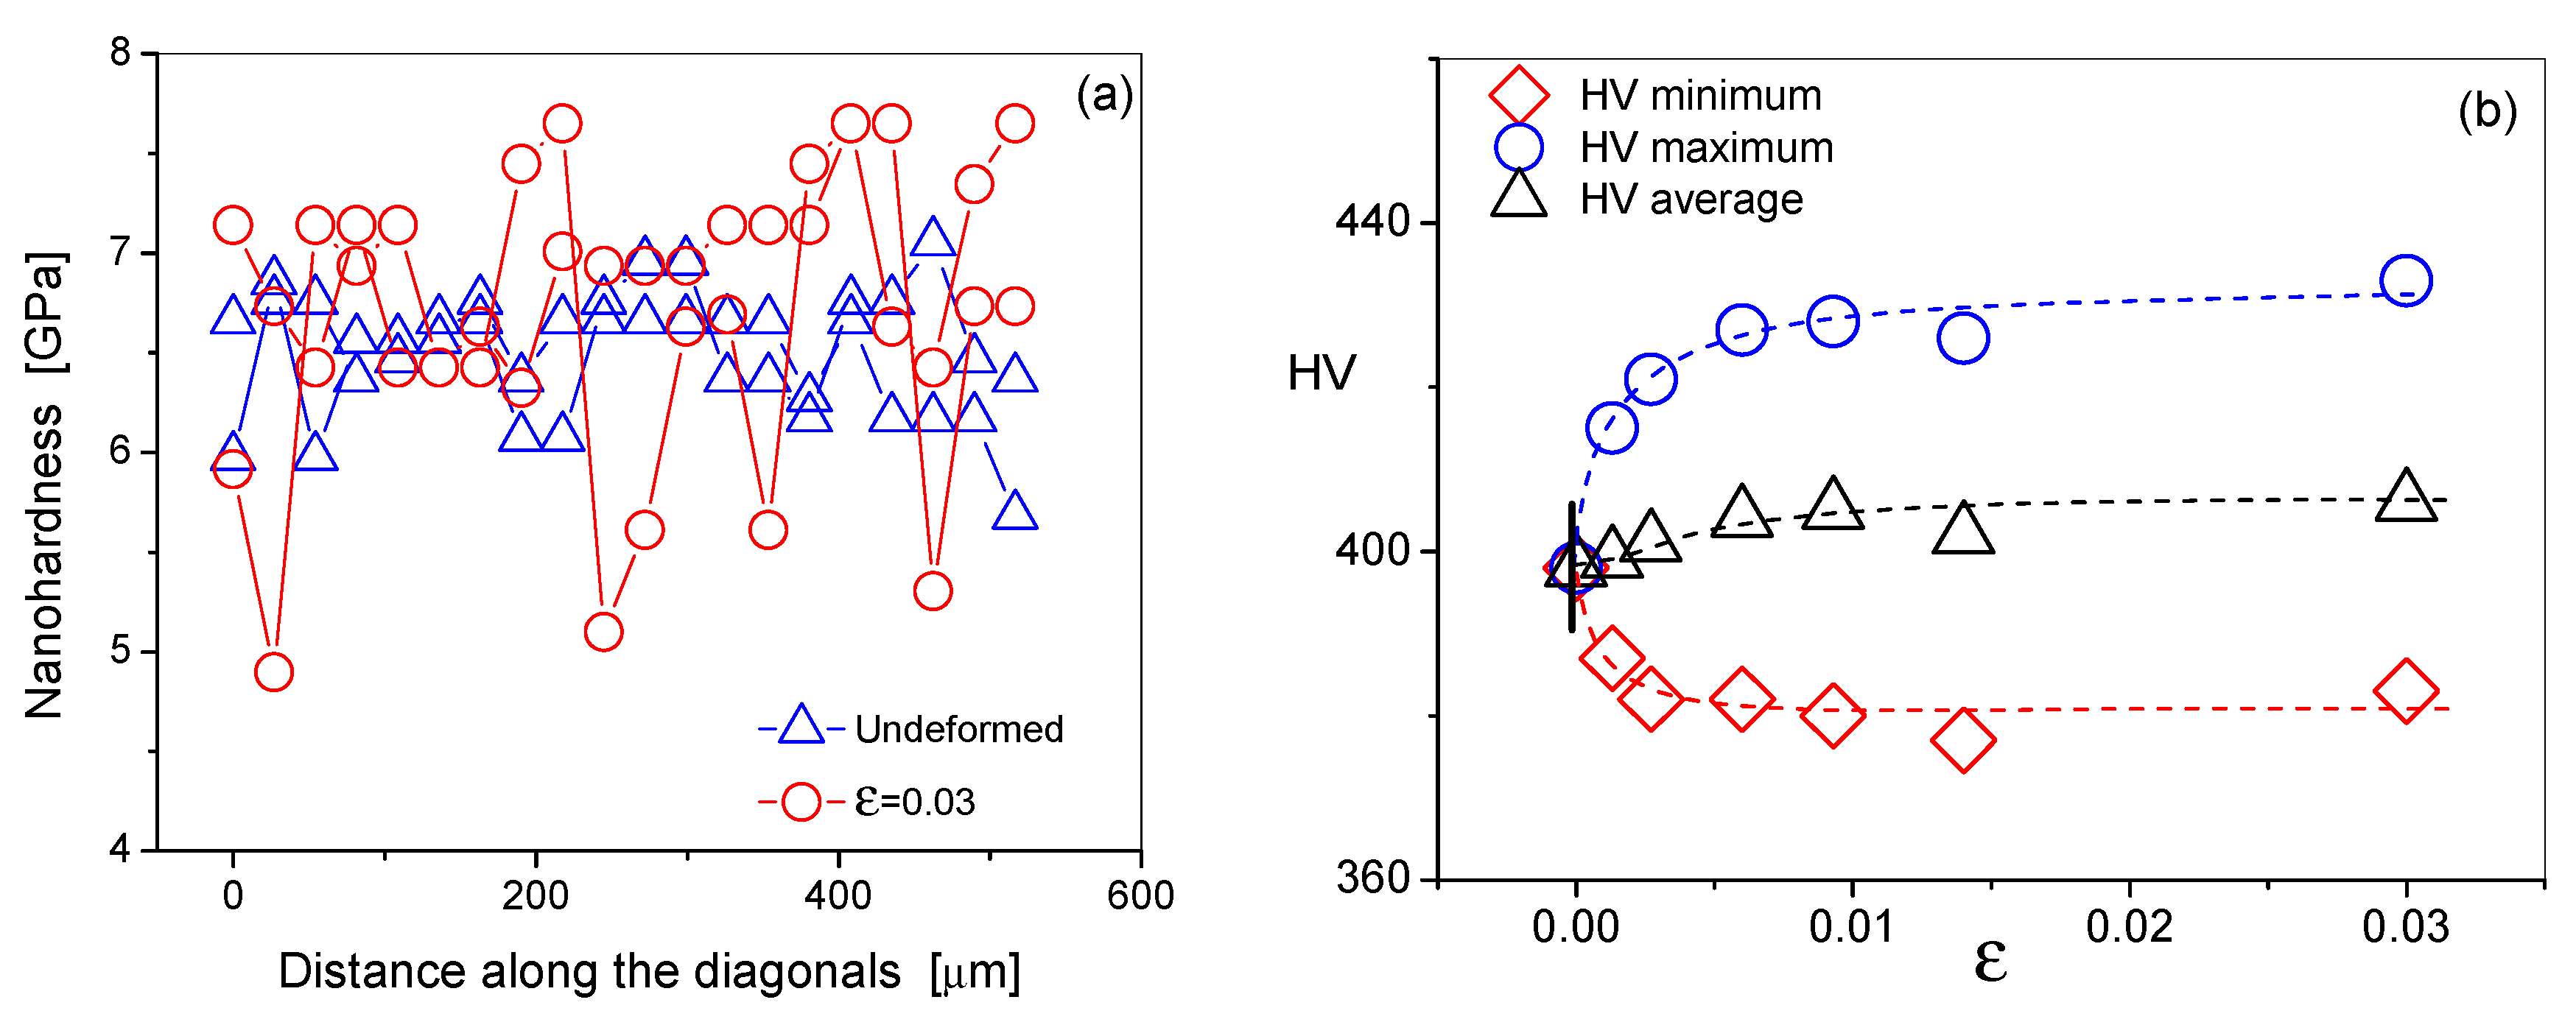
The undeformed and the 3% deformed specimens were investigated by nanohardness testing. These tests were carried out using a nanoindentation device (UMIS CSIRO, New South Wales, Australia) with a Vickers indenter and applying a maximum load of 50 mN. Two series of 400 indentations were recorded for both specimens with the indents arranged in a 20 × 20 matrix with a step size of 20 μm. The maximum indentation depth was between 400 and 600 nm corresponding to the indent size of 3–4 μm. This was smaller than the block-size of the investigated lath martensite [2,8,9]. Two-dimensional color-coded plots of the nanoindentation results on the undeformed as-quenched and 3% tensile deformed specimens are shown in Figure 3. Histograms along the diagonals of the nanohardness maps taken at steps of 25 μm are shown in Figure 4a. The means and standard deviations for the undeformed and the ε = 0.03 strained specimens are 6.50 (±0.31) and 6.73 (±0.70) GPa, respectively. The color-coded maps and the histogram in Figure 4a show that in the tensile deformed specimens the nanohardness fluctuations are significantly larger than in the undeformed as-quenched specimen. The histogram in Figure 4a shows that in the 3% tensile deformed specimen there are regions where the nanohardness is smaller than anywhere in the as-quenched state, indicating that some regions softened during tensile plastic deformation. All specimens were investigated by microhardness testing. The microhardness measurements were carried out using a microhardness tester (Zwick/Roell-ZHμ-Indentec, Ulm, Germany) with a Vickers indenter and applying a maximum load of 0.981 N. For all specimens a series of 30 indentations were registered with the indents arranged in a 3 × 10 matrix with a step size of 100 μm. The indent sizes varied between 19 and 23 μm. Results of the microhardness testing are shown in Figure 4b.

2.4. Scanning Electron Microscopy Investigations

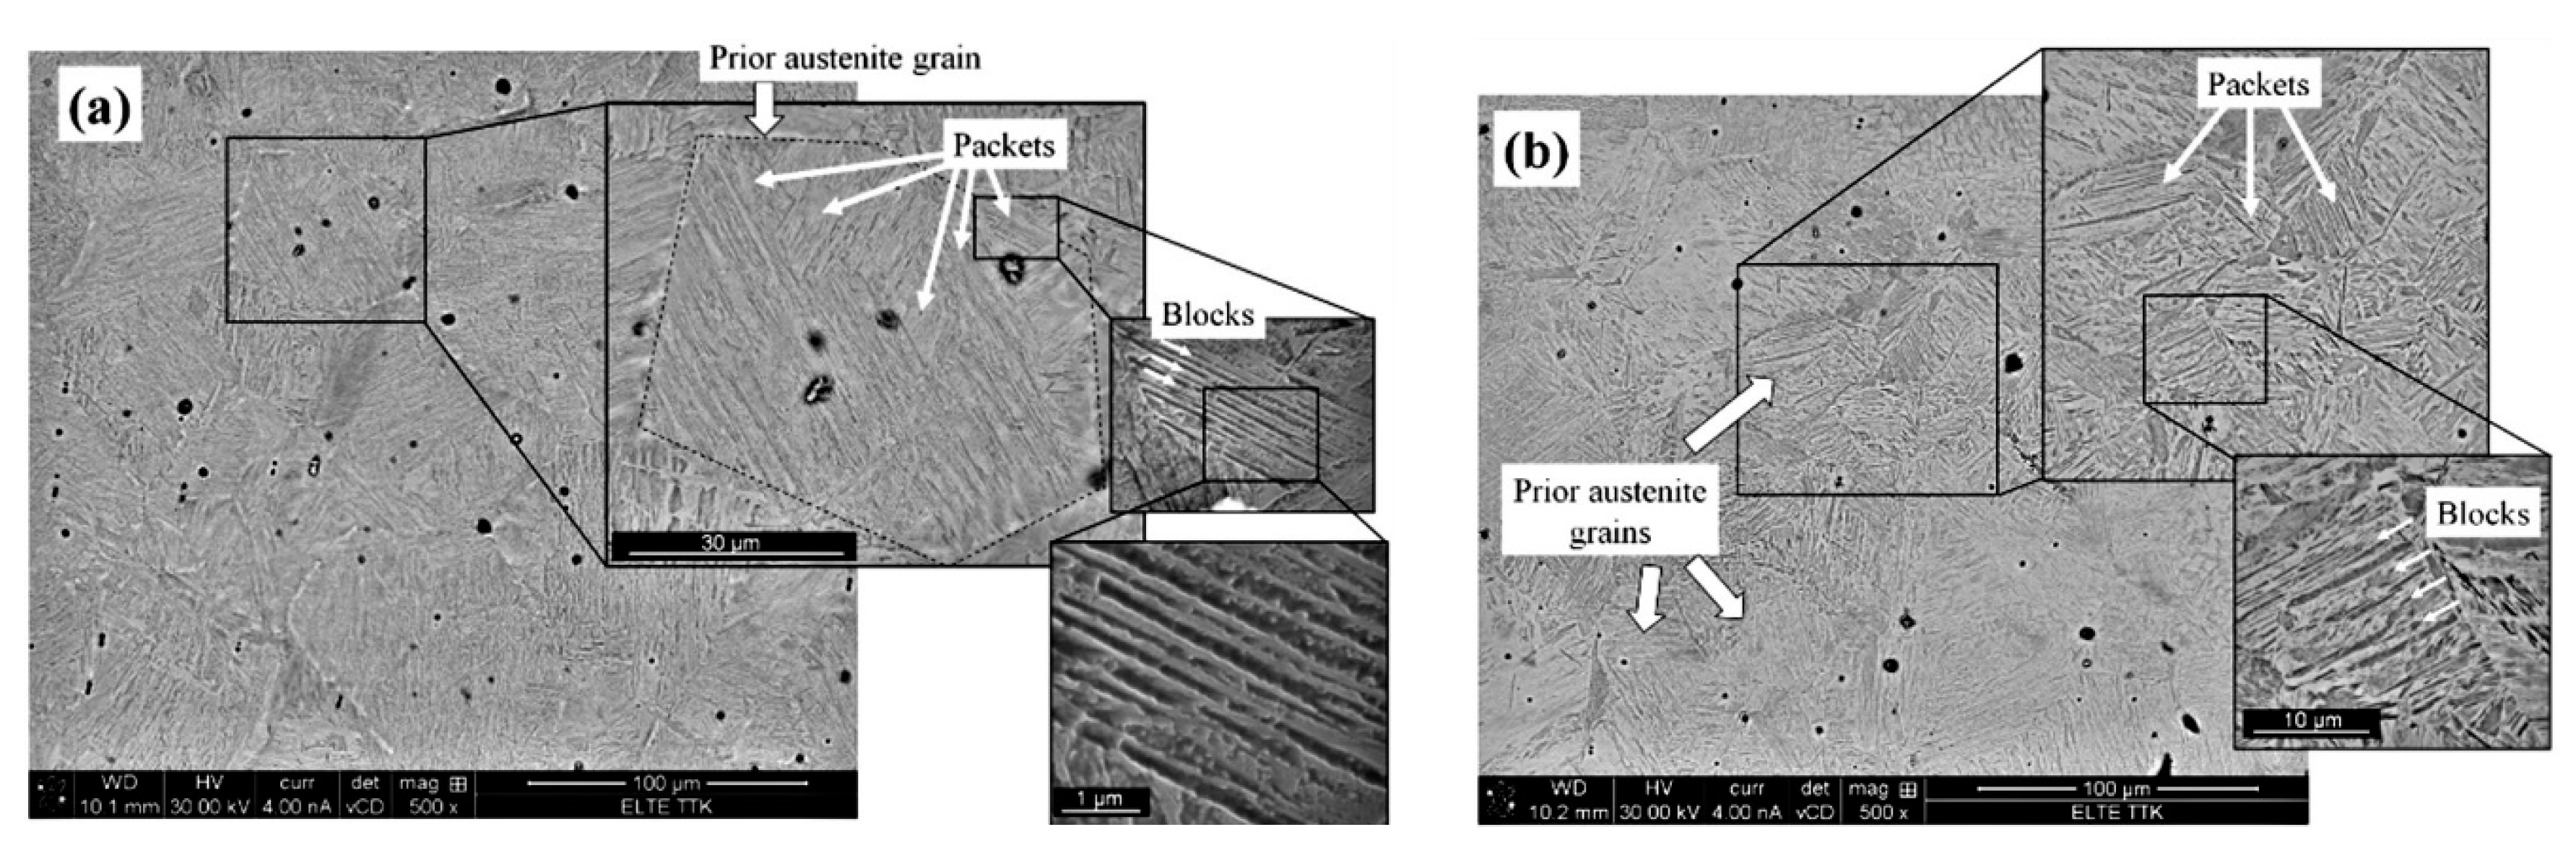
In order to determine the prior austenite grain, and the packet and block sizes, a series of scanning electron microscope (SEM) measurements were taken on the undeformed and the 3% deformed specimens. The measurements were carried out in a high-resolution dual beam FEI Quanta 3D scanning electron microscope detecting secondary electrons. Two typical SEM images are shown in Figure 5a,b. The boundaries of the prior austenite grains and the packets can be seen clearly in the figures. The blocks, sub-blocks, or laths cannot be distinguished well because they have the same longitudinal orientations. Therefore, in the size analysis, the widest structures were considered as blocks.

3. Evaluation of the Diffraction Patterns

The diffraction patterns were evaluated by the convolutional multiple whole profile (CMWP) procedure [28,29,30]. The Marquardt–Levenberg algorithm has recently been combined with a Monte Carlo-type procedure in order to find the global minimum of the weighted-sum-of-squared-residuals (WSSR) in the parameter-field of the physical parameters [31]. The measured IM() diffraction patterns were matched by the physically modeled and convoluted profile functions for dislocations,   I h k l D and crystallite sizes,   I h k l S :
I ( 2 θ ) M = h k l I h k l S * I h k l D * I h k l i n s t + I B G ,    
where “∗” stands for convolution and IBG is the background spline determined separately. Due to the double-crystal high resolution diffractometer [21], the instrumental broadening, I h k l i n s t , was negligible and therefore not considered.
The size profile, I h k l S , is determined by assuming log-normal size distribution given by the median and its variance, m and ζ, respectively. The area-weighted mean crystallite size, <x>area, was calculated from the median and variance of the distribution as <x>area = m × exp(2.5 × ζ 2) [30,32]. It is noted that the <x>area value represents the coherently scattering domain size which is closer to the sub-grain or dislocation cell than to crystallographic grains [32].
The Fourier transform of the strain profile is [33]:
AD(L) = exp{ - 2π2L2g2g,L2> },
where g is the absolute value of the diffraction vector and L is the Fourier variable. The mean square strain, <εg,L2>, in dislocated crystals can be given by the Wilkens function f(η) [34]:
< ε g , L 2 >   ρ C b 2 4 π f ( η ) ,
where η = L/Re and Re is the effective outer cut-off radius of dislocation. When the dislocation arrangement has a strong dipole character, i.e., when the strain field is strongly screened, Re will be smaller than the average dislocation distance ( 1 / ρ ) and M becomes smaller than 1 (M ≤ 1). When the dislocation arrangement has a weak dipole character, i.e., when the strain field is weakly screened, Re becomes larger than the average dislocation distance and M will be larger than 1 (M > 1). In elastically anisotropic material, peak broadening becomes anisotropic as a function of hkl. The phenomenon is known as strain anisotropy taken into account by the hkl dependent contrast factors, C h k l [34]. In a polycrystal or if all possible Burgers vectors are activated in a particular slip system the dislocation contrast factors can be averaged over the permutations of the corresponding hkl indices. In this case the average contrast factors can be given as a function of one single parameter, C ¯ h k l = C ¯ h k l ( q ) [35], where the q parameter is related to the edge or screw character of dislocations [36].
In the present martensitic alloy, the profile functions are described by five parameters of the microstructure: m, ζ, ρ, M, and q. This means that the characterization of an asymmetric profile with two sub-profiles for SO and HO components requires 10 physical parameters. In addition to these physical parameters, there are extra fit parameters for all peaks corresponding to the maximal intensities, Imax, and the centers, I0, of the peaks. Despite the relatively large number of physical fitting parameters, the upgraded CMWP procedure, with the combined Marquardt–Levenberg and Monte Carlo algorithms [31], proved to be stable and robust. The CMWP evaluation was carried out for five diffraction peaks, for the SO and the HO components simultaneously. A typical axial diffraction pattern for the ε = 0.0013 tensile deformed state is shown in Figure 2a,b. Figure 2a shows the evaluation with one single symmetric profile for each reflection, whereas Figure 2b shows the evaluation with two slightly shifted sub-profiles, one for the SO and one for the HO component, respectively. The figure indicates that the evaluation with two sub-profiles provides a qualitatively better fit in agreement with the asymmetric peak broadening in the deformed states. In the undeformed material, all the diffraction peaks were almost perfectly symmetric within the experimental error, so we used one single symmetric diffraction profile for all peaks.
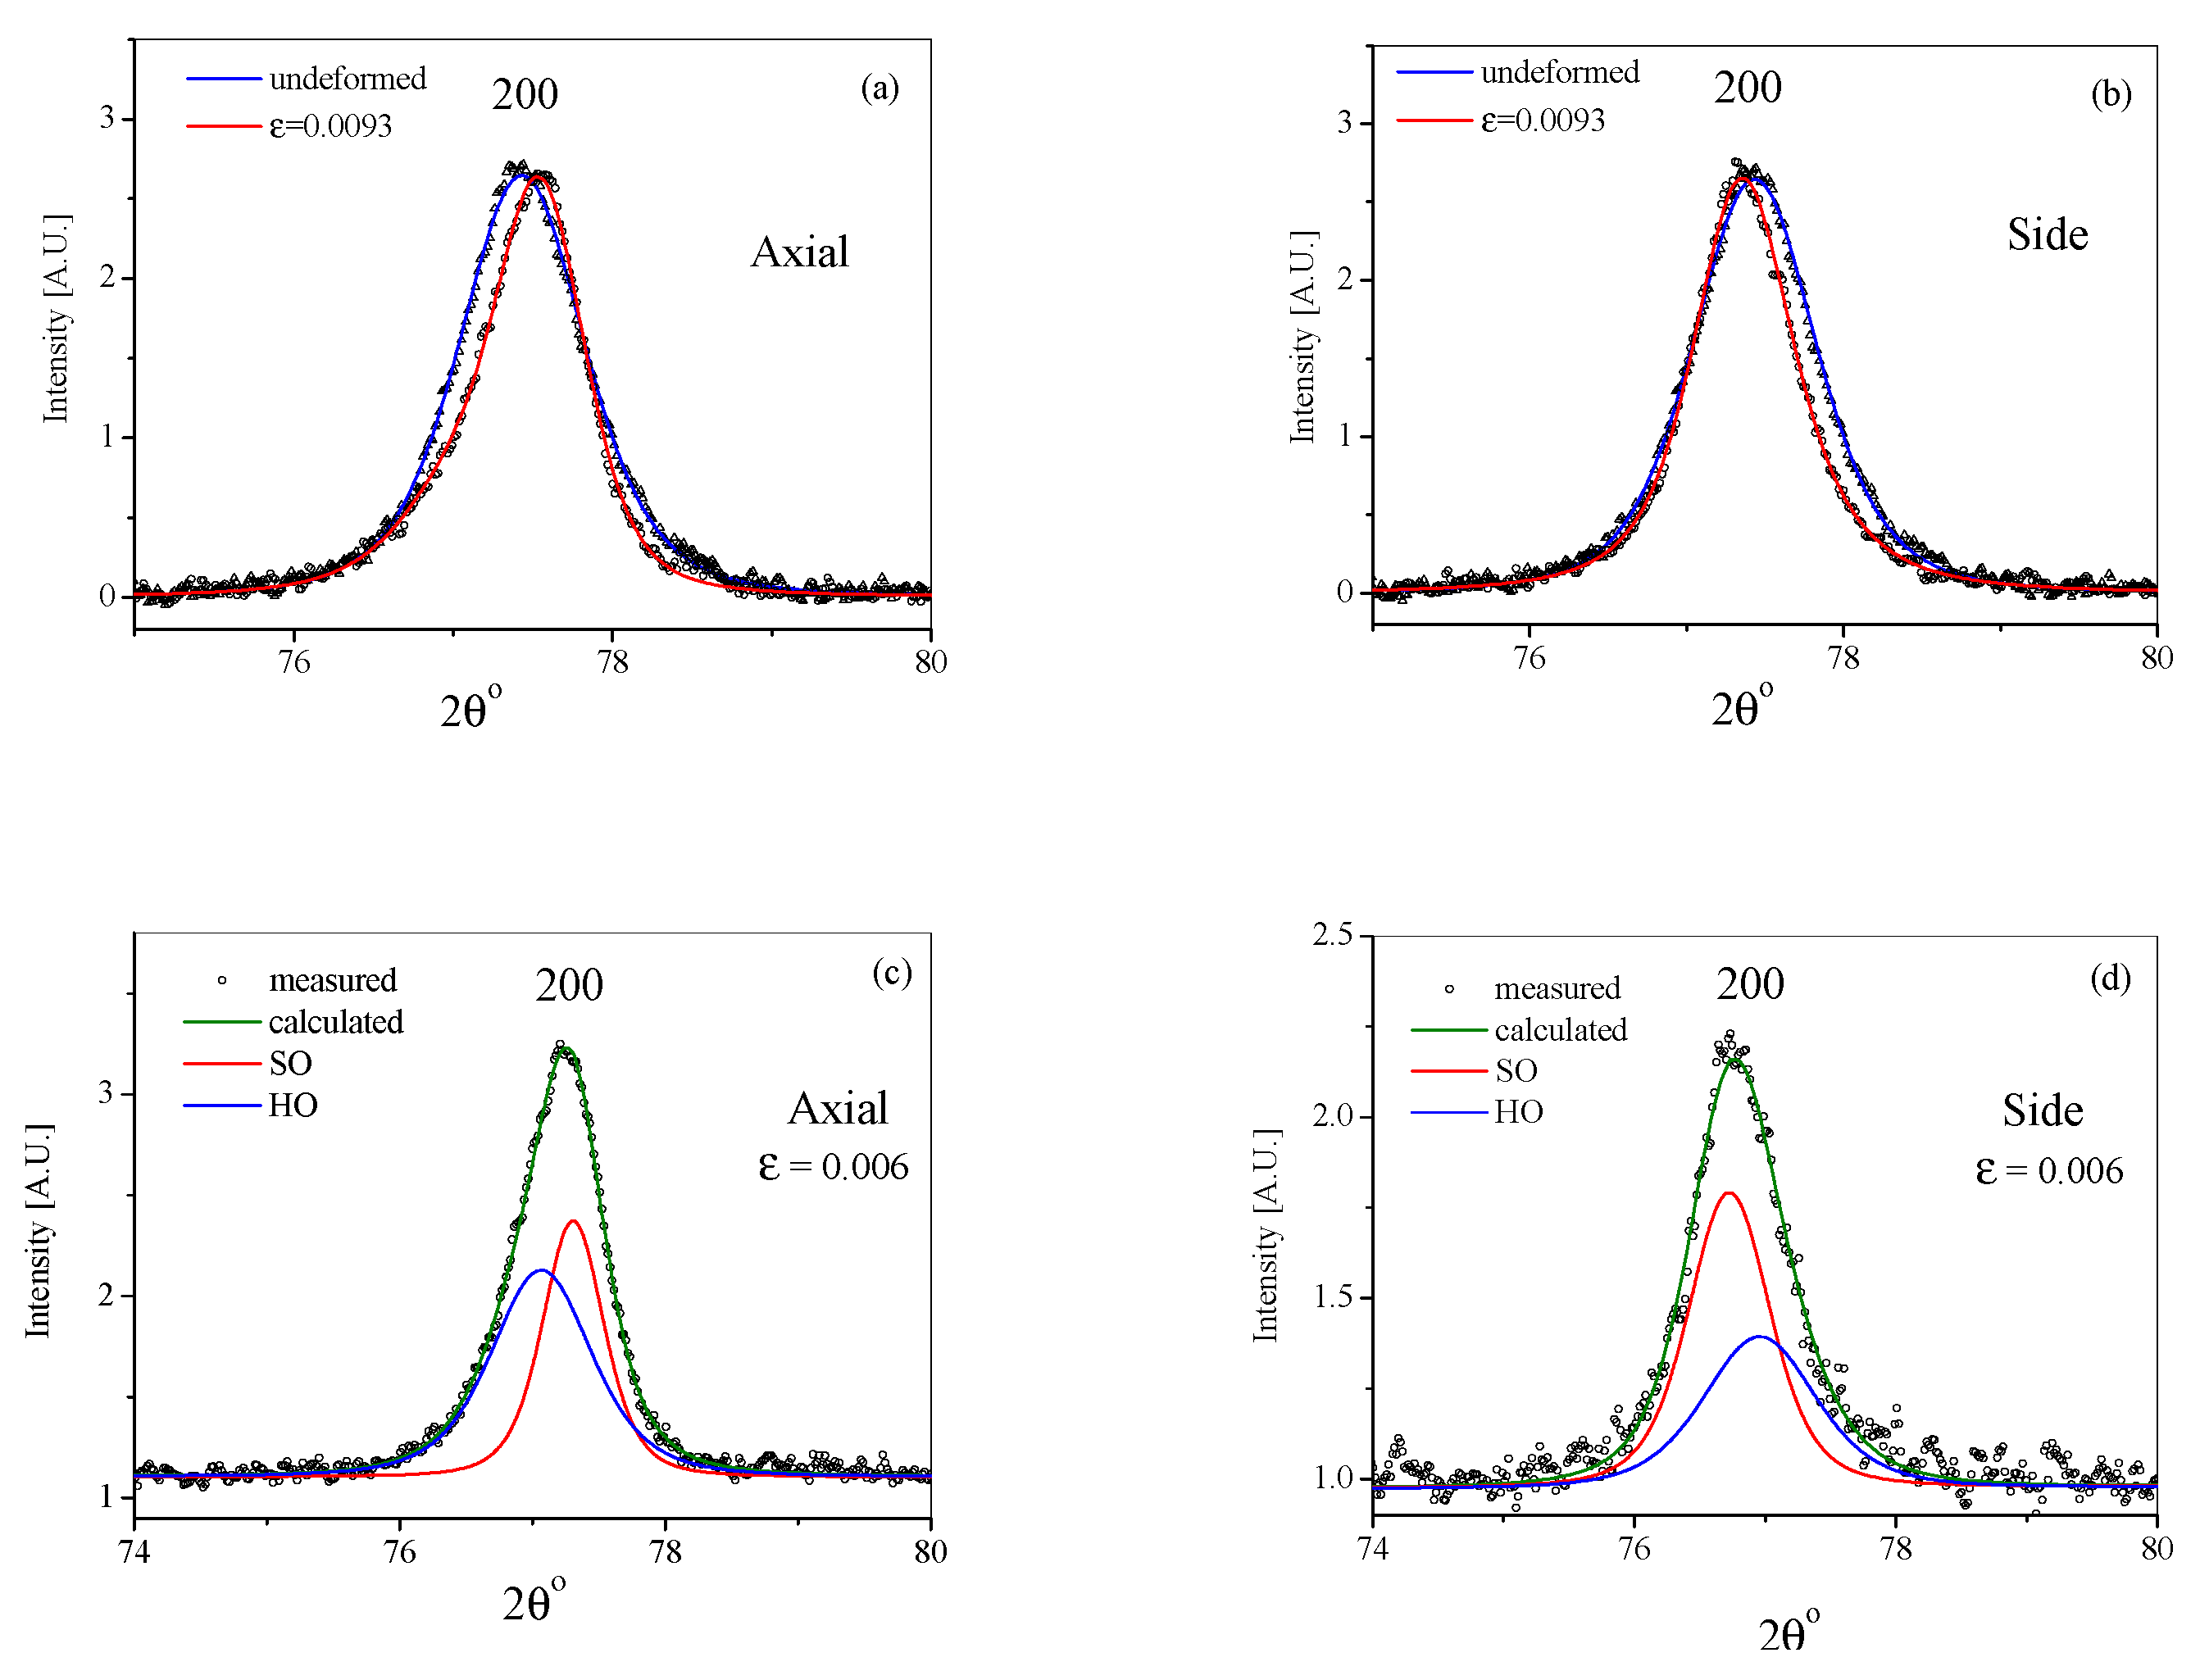
In the tensile deformed states, the peaks become unequivocally asymmetric, beyond experimental error. This is illustrated for the 200 axial- and side-case diffraction peaks in Figure 6a,b respectively. The figures clearly show that after deformation, the peaks become asymmetric, and that the asymmetries in the axial- and side-case peaks occur in opposite directions. To describe the asymmetrical profiles, we used the sum of two sub-profiles, one corresponding to the HO and the other to the SO components, for both the axial- and side-cases, as shown in Figure 6c,d respectively. This characteristic reversal of peak asymmetry is direct evidence for the composite behavior in heterogeneous microstructures [24,25,26].

4. Results and Discussion

4.1. Plastic Strain Induced Long-Range Internal Stresses

In the XRD patterns the retained austenite phase was negligible within experimental error, as was expected according to the carbon content of the present steel. The absence of the austenite phase means that we can investigate the physical processes without taking into account the effects of the austenite phase.
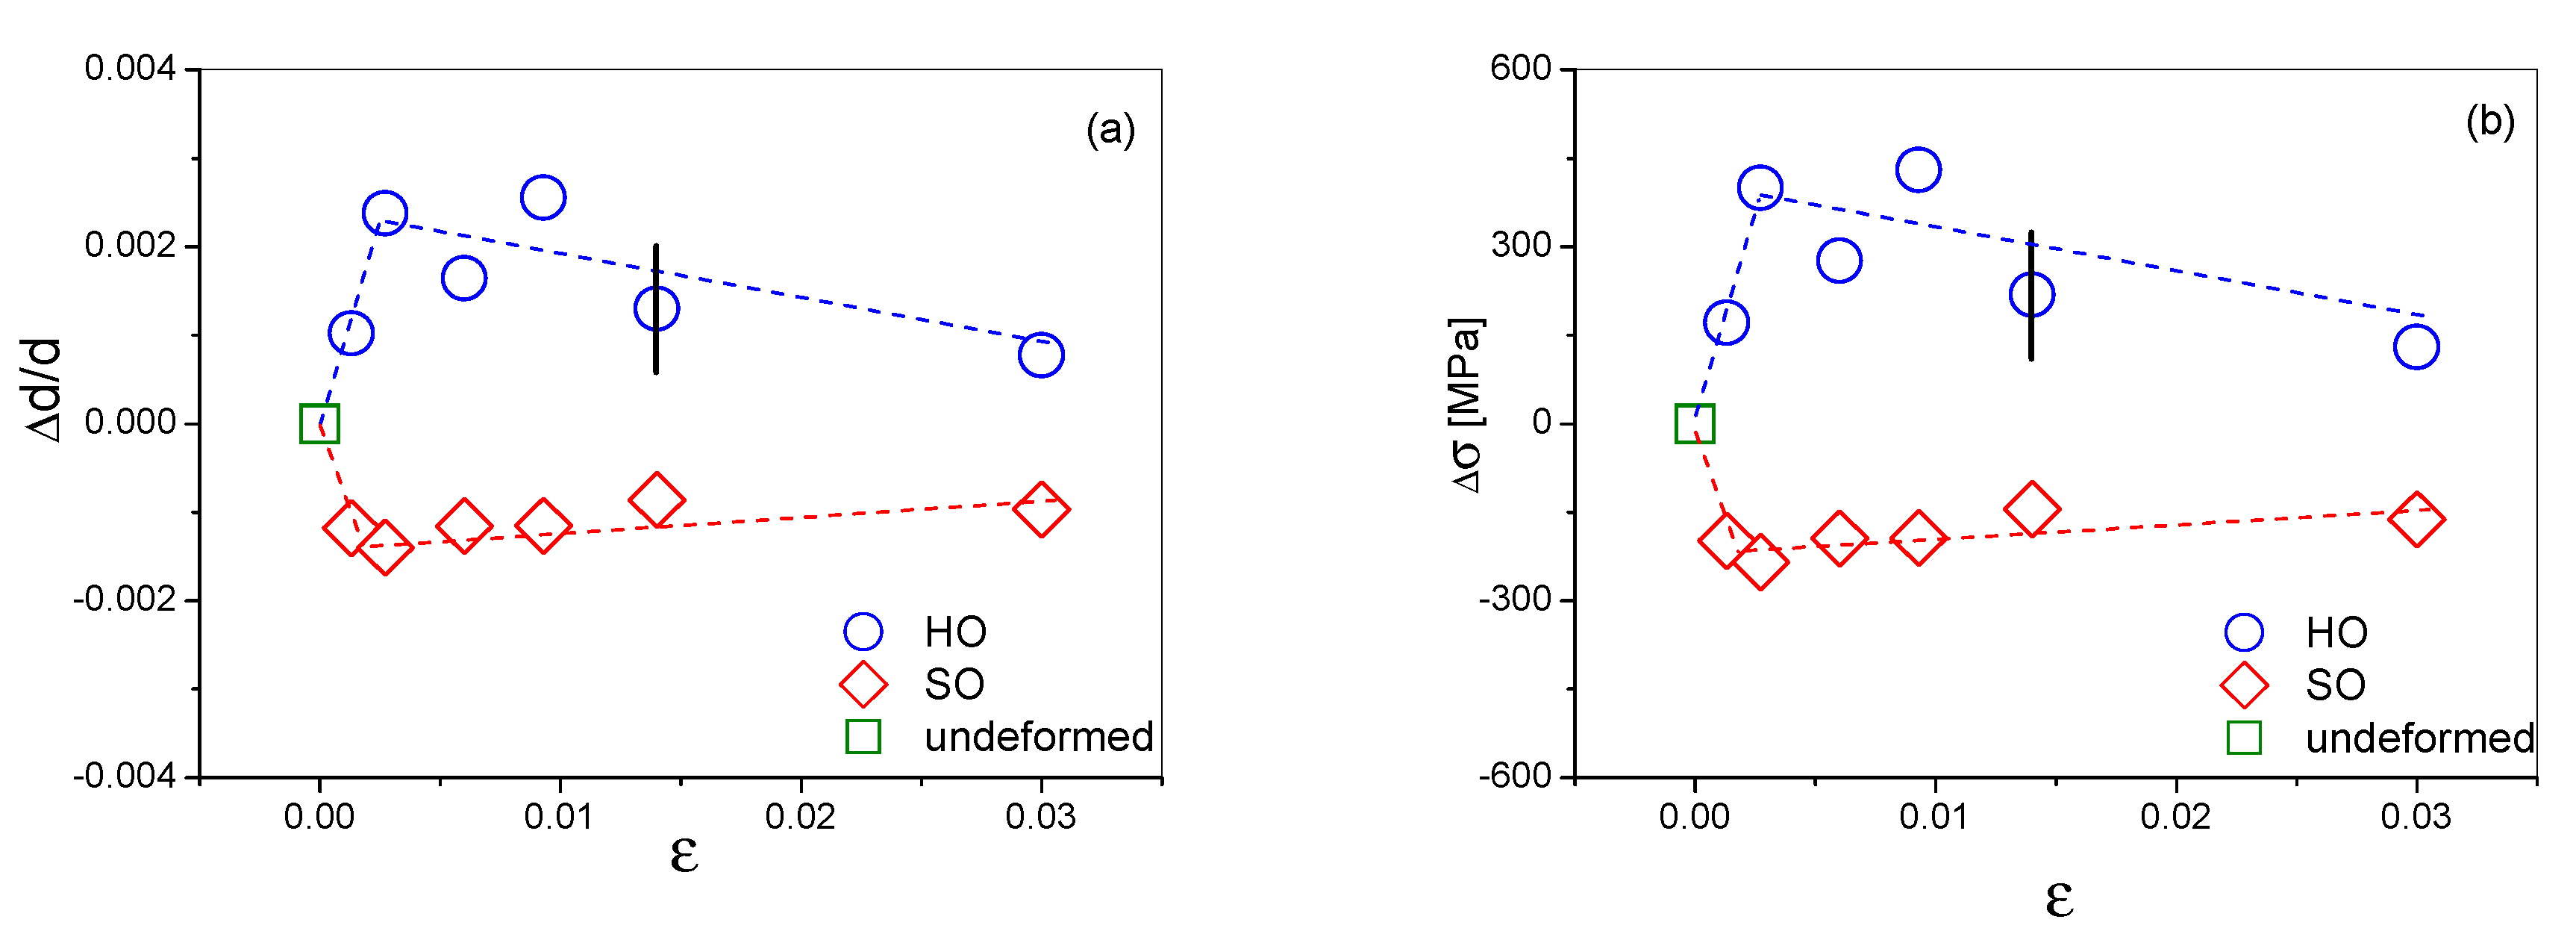
The distance of the center of the sub-profiles from the center of gravity of the measured peaks provides the sub-peak shifts, Δd, where Δd ≅ (2cosθ/λ)Δθ. The hkl-dependent local strains, εhkl = (Δd/d)hkl, were evaluated from the 200 and 310 diffraction peaks and for both the axial- and side-cases, where d = 2sinθ/λ. There are two reasons why these reflections were considered for the evaluation of the local strains and the local long-range internal stresses: (i) The diffraction vectors of these two reflections were strictly perpendicular to the measured specimen surfaces, therefore perpendicular or parallel to the applied stress direction. (ii) These two reflections have the largest contrast factors and the local long-range internal stresses also scale with the contrast factors [25]. The sub-peak shifts are shown in Figure 7a as a function of true strain. The values in the figure are the averages of the values obtained from the evaluation of the 200 and 310 reflections. The hkl-dependent local long-range internal stresses, Δσhkl, have been calculated as Δσhkl = EhklΔεhkl, where Ehkl are the hkl-dependent Young’s moduli. The Ehkl values have been determined from the elastic parts of lattice strain measurements in a similar martensitic steel in references [22,23]. The measured values were E200 = 160 (±5) GPa and E310 = 175 (±5) GPa. The averaged Δσ values are plotted as a function of the true strain in Figure 7b. We can see that the long-range internal stresses appear immediately upon the smallest plastic deformation. The Δσ values increase sharply to about 400 MPa, and then decrease continuously.

4.2. The Local and the Average Dislocation Densities as a Function Plastic Strain

The analysis of the SEM images in Figure 5 showed that the size of the prior austenite grains was between about 50 and 80 μm in both the undeformed and the 3% deformed specimens. The packet size varied from 7 to 30 μm. Since the blocks, sub-blocks, and laths have the same longitudinal directions, it is not easy to take differences between them, as we can see in Figure 5a,b. On the one hand, the maximum widths of the stripes were 1–3 μm; these are most probably the blocks. On the other hand, the minimum widths of the stripes were 70 to 110 nm, which are the sub-blocks, or the laths. This is in good correlation with the area-weighted mean crystallite sizes, <x>area, determined from the diffraction patterns which vary between 40 and 110 nm. The <x>area, i.e., the area average mean of the coherently scattering domain size, cannot be larger than the widths of the laths.
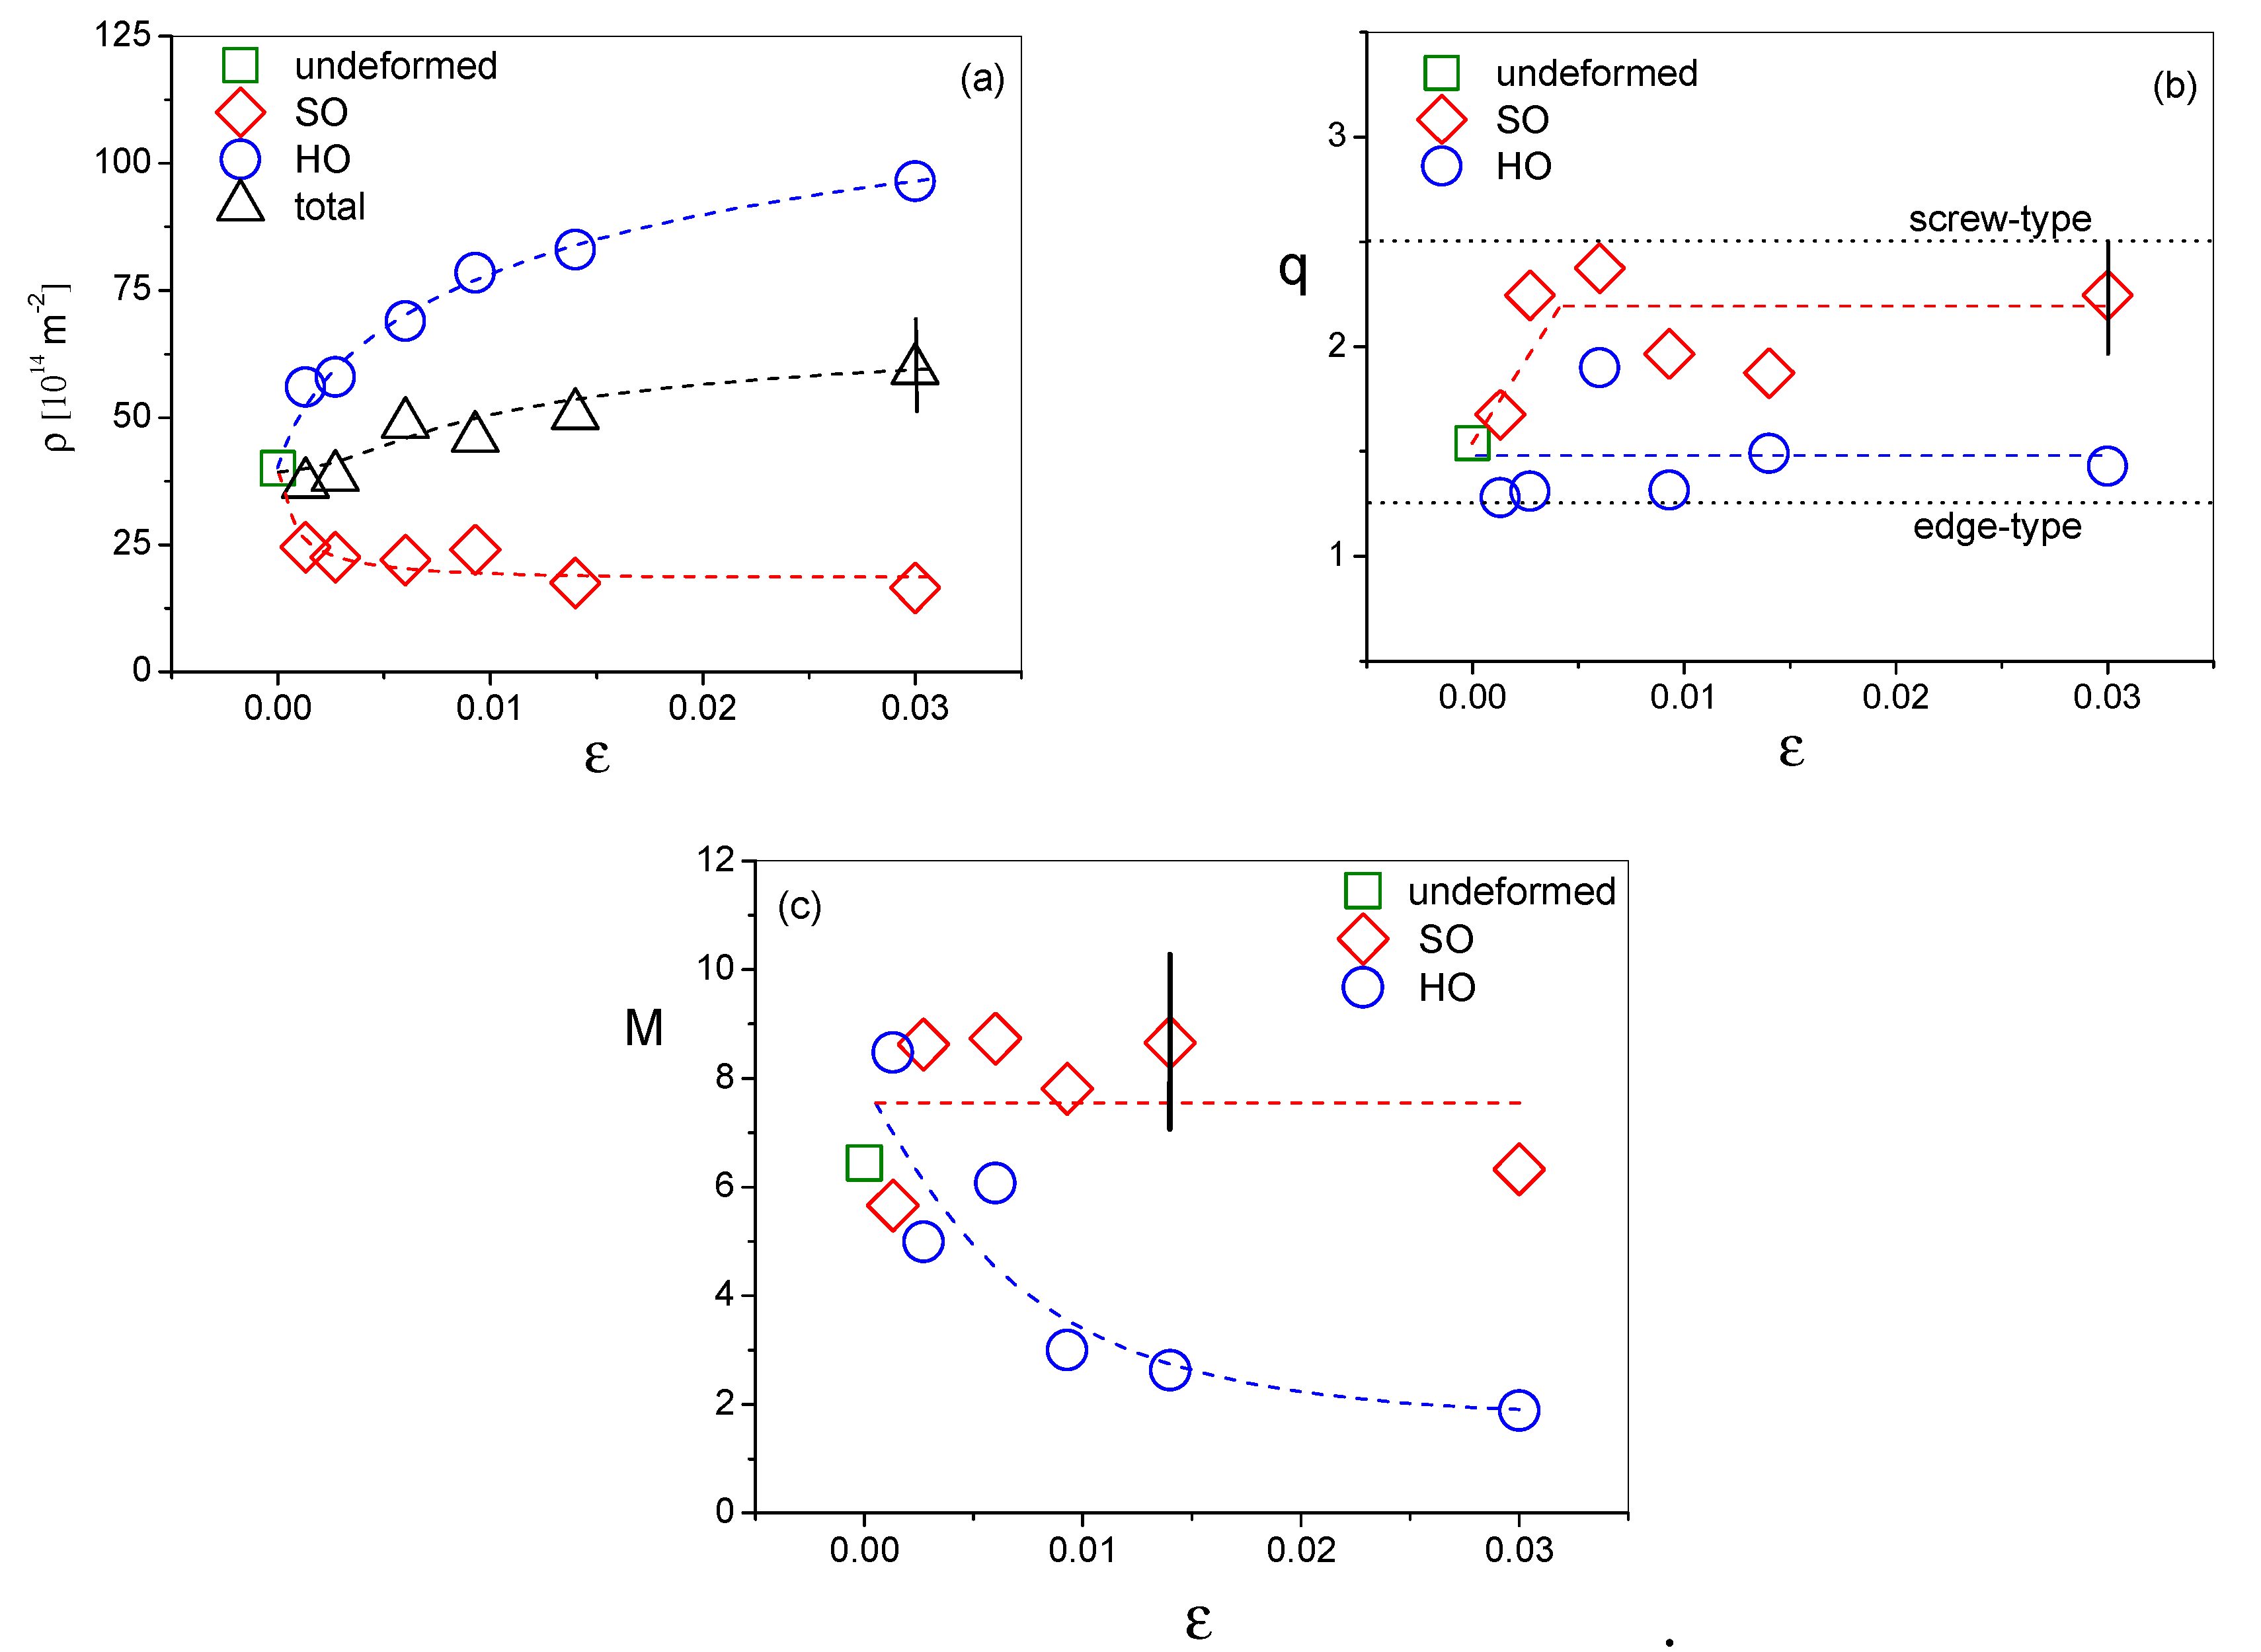
The dislocation density, ρ, the dislocation type parameter, q, and the dislocation arrangement parameter, M, were evaluated in the HO and SO packet components from the sub-profiles using the CMWP method. The results are shown as a function of true strain in Figure 8a–c, respectively. The values for the HO and SO components are the averages determined from the axial and side measurements in order to reduce the statistical error. The huge dislocation density in the undeformed lath martensite is created by the martensitic phase transformation where the mismatch between the primary fcc lattice has to be accommodated to the final bcc lattice. In references [22,23] it was discussed in detail that during deformation the dislocation density increases in the HO, whereas decreases in the SO, component. It was shown that the increase or the decrease is related to the saturation value of the dislocation density during plastic deformation [37], where the saturation values depend on the mean free paths of dislocations [38]. If the mean free path is long, as it is in the SO component, the saturation value can be lower than the dislocation density in the as-quenched initial state, whereas, if the mean free path is short, as it is in the HO component, the saturation value can be larger than the dislocation density in the as-quenched initial state. In the first case, during plastic straining, the dislocation density can decrease, whereas in the second case it can increase. In the present case we can see a similar tendency of the change in dislocation density in Figure 8a as in references [22,23].
The integral intensity ratio of the sub-profiles corresponding to the HO and SO packets provides the volume fractions of the two components, fHO and fSO, where
f HO + f SO = 1 .
In Figure 8a we can see that the total dislocation density,
ρ t = f HO ρ HO + f SO ρ SO ,
increases during deformation. The fractions of edge- and screw-type dislocations provided by the q parameter are shown in Figure 8b. The q parameter values of edge- and screw-type dislocations can be obtained from the elastic constants of the material [36]. For bcc materials q as a function of the elastic anisotropy is shown in a numerically calculated plot in Figure 2b in [36]. For the present steel, qedge = 1.28 and qscrew = 2.67 values correspond to the pure edge- and screw-type, respectively. The evaluation indicated that, in the HO packets, the dislocations are mainly of edge character, which does not change during the plastic deformation. However, in the SO component, the dislocation character changes from edge to mostly screw character immediately and does not change further. In the HO packets the active dislocations are moving in the narrow directions of the laths. Here the dislocations become stuck in the lath boundaries where the misfits and the misorientations between the bcc laths and fcc austenite films have to be compensated. These dislocations are overwhelmingly of edge character. In the SO packets the active dislocations are moving in directions along the planes of the laths, therefore the mean free path of dislocations is long. In these packets the initial dislocation density is larger than the saturation value corresponding to the relevant plastic straining conditions, or at least not smaller. This means that in the SO packets during plastic straining there will be continuous dynamic recovery and the dislocation density will remain constant. Next, we take into account that plastic deformation of low carbon steels is carried by long screw dipoles as was shown by Sestak and Seeger [39,40]. As a consequence of the perpetual dynamic recovery, along with the deformation mechanism carried by long screw dipoles, the screw dislocation population will grow over that of the edge dislocations.
The dislocation arrangement parameter, M, versus the true strain for the HO and SO components is shown in Figure 8c. The analysis indicated that, in the HO packets, the dislocation arrangement values decrease from M 7 to about M 2 , indicating the strengthening of the dipole character. In the SO packets, M does not change during plastic straining indicating that the dislocations form loose arrangements with weaker dipole character. The dislocation activity, the dislocation density, the dislocation character, and the dipole character are all consistently characterizing the deformation process in the two different components of the specimens.

4.3. Correlation between the Stress-Strain Response and the Dislocation Density and Arrangement as a Function of Strain

The applied stress values, σapp are correlated with the dislocation densities by the Taylor equation [41]:
σ a p p = σ 0 + α M T G b ρ t   ,
where σ0 is the friction stress, α is a scaling factor between zero and unity, G = 78 GPa [23] is the shear modulus, MT = 2.8 [23] is the Taylor factor, and b = 0.248 nm is the Burgers vector. The friction stress, σ0, was modeled in martensitic steels containing Ni or Mn by Krauss [1] or Arlazarov et al. [42], respectively. Krauss provided a formula for the effect of carbon content, for a 20 wt% Ni alloy: σ0.2(MPa) = 461 + 1.31 × 10³(wt%C)1/2, see Equation (1) in reference [1], where σ0.2 is the proof-stress with 0.2% offset. The 461 MPa term is claimed to consist of 69 MPa friction stress in pure iron, 138 MPa solid-solution stress for 20% Ni, and 255 MPa for the strengthening component of the substructure of martensite. The martensite substructure effect is the Hall–Petch contribution of the small lath size and the grain boundary contribution of the polycrystalline material. In the present work the dislocation density, determined directly by X-ray line broadening, is related to the flow stress of the material. Therefore, σ0 in Equation (6) is the friction stress in the dislocation free material. Taking into account that our alloy is Ni free and contains only 1.48 wt% Mn, we estimate the friction stress as: σ0 ≅ 220 MPa. This is in good correlation with low Mn-containing alloys with smaller friction stress values [42].
Work hardening in the present alloy is solely taking place by dislocation activity. Therefore, in the present case, work hardening will be accounted for by Equation (6). Since we measured the applied stress along with the dislocation densities, the only free parameter in Equation (6) is α, which can be written as:
α = σ a p p σ 0 M T G b ρ t    
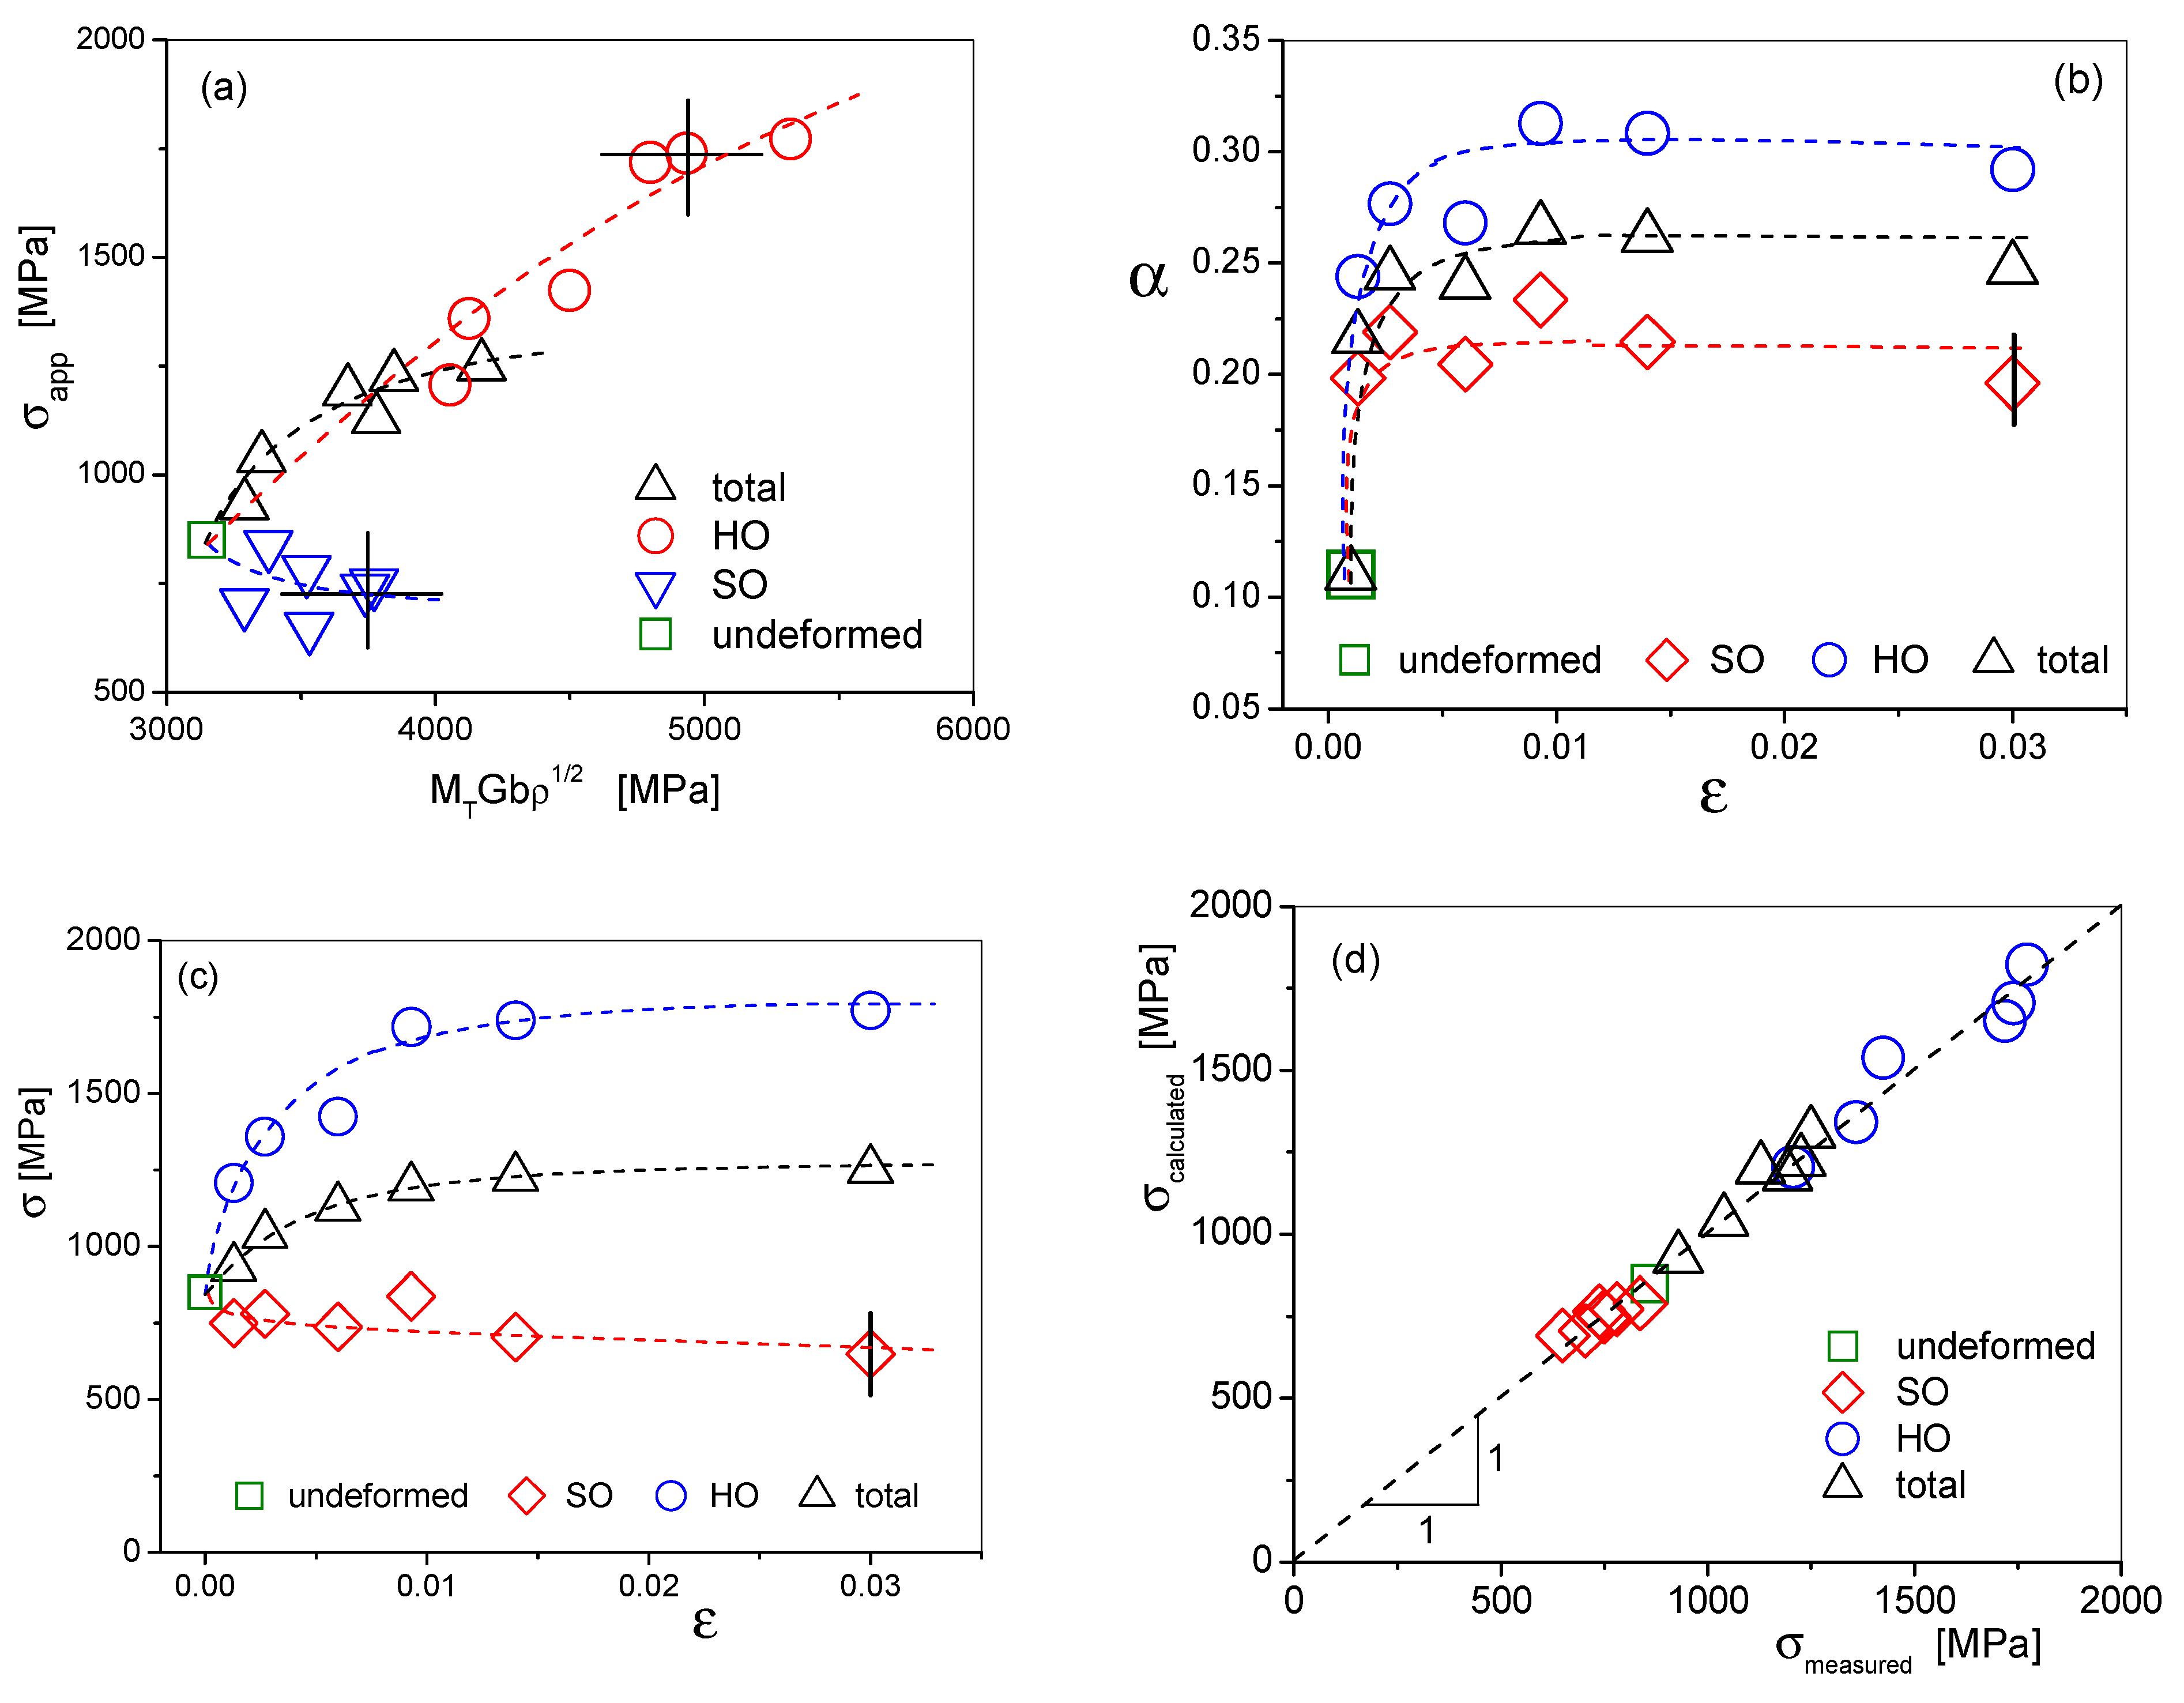
It is usually assumed that even during work hardening the value of α stays constant. σapp is shown versus MTGb ρ in Figure 9a for the measured values of the total, the hard, and the soft component dislocation densities, ρt, ρHO, and ρSO, respectively. The dashed lines in the figure indicate that the α values are not constant during the work hardening process. Several experiments in the literature have shown that the α parameter can change strongly when the dislocation arrangement is changing during plastic deformation [43,44,45,46].
Assuming a linear composite behavior as in reference [43], α can be written as the volume weighted average of the local α values, αHO and αSO:
α = f HO α HO + f SO α SO   ,
where fHO and fSO are the volume fractions of hard and soft components determined from the ratios of the integral intensities of the sub-profiles in the asymmetric peaks. Based on the composite model [43] and the Taylor equation [41] the flow stress can be given as:
σ a p p = σ 0 + f HO α HO M T G b ρ HO + f SO α SO M T G b ρ SO .
The local α values can be calculated as:
α SO = σ a p p σ 0 α M T G b ρ HO f SO M T G b ( ρ SO ρ HO )   and   α HO = α f SO α SO f HO .
The local and the average α values as determined by Equations (7) and (10) are shown in Figure 9b as a function of the true plastic strain. The figure shows that in the undeformed state α is relatively small, α ≅ 0.11. At the beginning of plastic deformation, the average value of α increases quickly to about 0.25 and then remains constant. The large increase of the total flow stress is compelling to introduce the increasing α. In the soft component, αSO increases sharply and stays constant during further deformation. In the hard component αHO also increases, to a larger value of about αHO ≅ 0.3 (±0.01).
The local flow stresses, σHO and σSO, in the HO and SO components can be evaluated by the composite concept using Equation (9):
σ a p p = f HO σ HO + f SO σ SO ,
where
σ HO = σ 0 + α HO M T G b ρ HO ,
and
σ SO = σ 0 + α SO M T G b ρ SO .
The local flow stresses, σ HO and σ SO , in the HO and SO packets and the total flow stress versus the true strain are shown in Figure 9c. In the HO packets both the dislocation density and the α increase, so both raise the local flow stress. However, in the SO packets the dislocation density decreases while αSO increases. The first reduces while the latter enhances the local flow stress. The two opposite effects produce a slightly decreasing local flow stress in the soft component. Taking the α values from the curves adjusted to the data points in Figure 9b, the calculated local flow stress values in the SO and HO components and the total flow stress values are plotted versus the corresponding measured values in Figure 9d.

4.4. A Direct Evidence for the Decomposition into the Composition of Soft and Hard Lath-packets Induced by Plastic Strain

Further, more direct evidence of the composite behavior is provided by nanohardness tests. Nanohardness results shown in Figure 3 and Figure 4a indicate that in the undeformed state the hardness values fluctuate only within the statistical error as a function of location. In contrast, in the deformed state, there are softer domains than in the undeformed state, but there are also harder domains. The nanohardness results are in very good correlation with the calculated σ HO and σ SO values and confirm that while the local flow stress in the SO packets slightly decreases compared to the flow stress of the undeformed state, in the HO packets there is a significant increment.
In addition to the nanohardness measurements, a series of microhardness tests were carried out for all specimens. We chose the pressing load to be as small as possible so that the size of the indentations would be comparable with the packet sizes while remaining visible and measurable. The sizes of the indentations varied between 19 and 23 μm, which is in a range of packets according to the SEM analysis. The mean, maximum, and minimum values of the microhardness distributions versus the deformation are shown in Figure 4b. We can see in Figure 4b that during tensile deformation soft and hard domains are created beyond the statistical fluctuation. The microhardness results also confirm qualitatively the formation of HO and SO packets during deformation.

5. Conclusions and Summary

(1) We have shown that in plastically deformed lath-martensite steel when the active Burgers vectors are within the plane of the lath lamellae these packets either soften or at least do not work harden. When, however, the active Burgers vectors are across the boundaries of the lath martensite lamellae the packets work harden substantially. We found that plastic deformation induces composite behavior in lath martensite with the composite of soft and hard packets.
(2) The diffraction peak profiles of the plastically deformed lath martensite specimens revealed characteristic asymmetries. The lower-angle tails of peaks corresponding to the loading-direction diffraction vectors (axial case) became longer, whereas in peaks corresponding to the transverse-direction diffraction vectors (side case), the higher angle tails became longer. The asymmetric peak profiles were evaluated by the CMWP method by allowing two sub-profiles for each asymmetric diffraction profile. The sub-profiles were evaluated for all the physical parameters characterizing the defect structure in the corresponding components of the material. The narrower sub-profiles corresponding to the softer packets (SO component) revealed stagnating dislocation densities during plastic straining, whereas the broader sub-profiles related to the hardening packets (HO component) provided substantial work hardening and increase of the local dislocation density. The edge or screw dislocation character was determined from the contrast of dislocations. In the SO component the initial mixed character changed with deformation mainly to the screw character, whereas, in the HO component the mainly edge character did not change within experimental error during plastic straining. The behavior in the SO component is consistent with constant dynamic recovery during which the dislocations are steadily created and annihilated and with the dislocation mechanism in low carbon steels, according to which long screw dipoles carry plastic deformation. In the HO component, however, the short dislocation mean free paths and accommodation of misfits at the lath boundaries prefers the storage of more edge-type dislocations. The dipole character of dislocations, the M parameter, is provided by the shape of dislocation profiles. In the SO component it remains relatively large and constant during straining, indicating that the dipole character is weak. This behavior is consistent with the relatively smaller dislocation density and the dislocation character in this component. In the HO component the dipole character increases and the M parameter decreases, in correlation with the strong increase in dislocation density.
(3) The shifts of the sub-peaks relative to the center of gravity of the asymmetric profiles were evaluated in terms of long-range internal stresses between the SO and HO components of the composite. We showed that the HO and SO components are strained forward and backward, as in a composite consisting of alternating soft and hard components, respectively. The local long-range internal stresses were shown to reach about 450 MPa shortly after deformation and decreased slightly with further plastic straining.
(4) It has been shown that the α parameter in the Taylor equation changes from its initial value during plastic straining in both the SO and the HO components. In the SO component α increases from the initial α = 0.11 to α = 0.21 at the beginning of deformation and remains constant thereafter. In the HO component it increases gradually to a larger saturation value of α = 0.3. The larger α value means that in the process of work hardening the arrangement of dislocations is more efficient.
(5) The results of the present work are in good correlation with the results obtained in a somewhat similar but nonetheless different lath-martensite alloy by neutron diffraction line profile analysis. This indicates that the composite behavior induced by plastic straining in lath-martensite alloys is probably a general feature of this class of steels.
(6) Further SEM or EBSD investigations should be carried out in the future on new specimens at the same locations where nanoindentation is performed in order to better understand the evolution of the microstructure during plastic straining of lath martensite.

Author Contributions

Conceptualization, P.J.S., T.U.; methodology, T.U., É.Ó. and B.J.; validation, T.U.; formal analysis, T.U., É.Ó. and B.J.; investigation, É.Ó., B.J. and N.Q.C.; resources, P.J.S.; data curation, T.U., É.Ó. and B.J.; writing—original draft preparation, T.U., É.Ó. and B.J.; writing—review and editing, N.Q.C. and G.R.; supervision, T.U. All authors have read and agreed to the published version of the manuscript.

Funding

This research was funded by National Research, Development and Innovation Office—NKFIH, OTKA grant number K 124926., and was also funded by the Hungarian-Russian bilateral Research program (TÉT) No. 2017-2.3.4-TÉT-RU-2017-00005. The research reported in this paper was supported by the Higher Education Excellence Program of the Ministry of Human Capacities of Hungary within the frame of TOPIC research area of Budapest University of Technology and Economics ((BME FIKP-NAT) and the ELTE University Excellence program (1783-3/2018/FEKUTSRAT). The APC was funded by National Research, Development and Innovation Office—NKFIH, OTKA grant number K 124926.”.

Acknowledgments

The authors are grateful to Zoltán Dankházi and Anikó Németh for performing SEM experiments. The authors are grateful to István Groma and Zsolt Kovács for performing the tensile tests. G.R. gratefully acknowledges the support of the János Bolyai Research Fellowship of the Hungarian Academy of Sciences. P.J.SZ. is grateful for the support of the National Research, Development and Innovation Office—NKFIH, OTKA K 124926. The research of N.Q.C. is partly supported by the Hungarian-Russian bilateral Research program (TÉT) No. 2017-2.3.4-TÉT-RU-2017-00005. The research reported in this paper was supported by the Higher Education Excellence Program of the Ministry of Human Capacities of Hungary within the frame of TOPIC research area of Budapest University of Technology and Economics ((BME FIKP-NAT) and the ELTE University Excellence program (1783-3/2018/FEKUTSRAT).

Conflicts of Interest

The authors declare no conflict of interest.

References

  1. Krauss, G. Martensite in steel: Strength and structure. Mater. Sci. Eng. 1999, 273–275, 40–57. [Google Scholar] [CrossRef]
  2. Krauss, G.; Marder, A.R. The morphology of martensite in iron alloys. Metall. Trans. 1971, 2, 2343–2357. [Google Scholar] [CrossRef]
  3. Krauss, G. Tempering of lath martensite in low and medium carbon steels: Assessment and challenges. Steel Res. Int. 2017, 87, 1700038. [Google Scholar] [CrossRef]
  4. Bhadeshia, H.K.D.H.; Honeycombe, R. Steels: Microstructure and Properties, 3rd ed.; Butterworth-Heinemann: Oxford, UK, 2006; pp. 95–128. ISBN 9780750680844. [Google Scholar]
  5. Morito, S.; Tanaka, H.; Konishi, R.; Furuhara, T.; Maki, T. The morphology and crystallography of lath martensite in Fe-C alloys. Acta Mater. 2003, 51, 1789–1799. [Google Scholar] [CrossRef]
  6. Kitahara, H.; Ueji, R.; Tsuji, N.; Minamino, Y. Crystallographic features of lath martensite in low-carbon steel. Acta Mater. 2006, 54, 1279–1288. [Google Scholar] [CrossRef]
  7. Swarr, T.; Krauss, G. The effect of structure on the deformation of as-quenched and tempered martensite in an Fe-0.2 pct C alloy. Metall. Trans. 1976, A7, 41–48. [Google Scholar] [CrossRef]
  8. Morito, S.; Adachi, Y.; Ohba, T. Morphology and crystallography of sub-blocks in ultra-low carbon lath martensite steel. Mater. Trans. 2009, 50, 1919–1923. [Google Scholar] [CrossRef] [Green Version]
  9. Morito, S.; Huang, X.; Furuhara, T.; Maki, T.; Hansen, N. The morphology and crystallography of lath martensite in alloy steels. Acta Mater. 2006, 54, 5323–5331. [Google Scholar] [CrossRef]
  10. Zhang, P.; Chen, Y.; Xiao, W.; Ping, D.; Zhao, X. Twin structure of the lath martensite in low carbon steel. Prog. Nat. Sci. Mater. Int. 2016, 26, 169–172. [Google Scholar] [CrossRef] [Green Version]
  11. Kurdjumov, G.V.; Sachs, G. Über den Mechanismus der Stahlhärtung. Zeitschrift Physik 1930, 64, 325–343. [Google Scholar] [CrossRef]
  12. Michiuchi, M.; Nambu, S.; Ishimoto, Y.; Inoue, J.; Koseki, T. Relationship between local deformation behavior and crystallographic features of as-quenched lath martensite during uniaxial tensile deformation. Acta Mater. 2009, 57, 5283–5291. [Google Scholar] [CrossRef]
  13. Nambu, S.; Michiuchi, M.; Ishimoto, Y.; Asakura, K.; Inoue, J.; Koseki, T. Transition in deformation behavior of martensitic steel during large deformation under uniaxial tensile loading. Scr. Mater. 2009, 60, 221–224. [Google Scholar] [CrossRef]
  14. Ghassemi-Armaki, H.; Chen, P.; Bhat, S.; Sadagopan, S.; Kumar, S.; Bower, A. Microscale-calibrated modeling of the deformation response of low-carbon martensite. Acta Mater. 2013, 61, 3640–3652. [Google Scholar] [CrossRef]
  15. Mine, Y.; Hirashita, K.; Takashima, H.; Matsuda, M.; Takashima, K. Micro-tension behaviour of lath martensite structures of carbon steel. Mater. Sci. Eng. 2013, A560, 535–544. [Google Scholar] [CrossRef]
  16. Kwak, K.; Mayama, T.; Mine, Y.; Takashima, K. Anisotropy of strength and plasticity in lath martensite steel. Mater. Sci. Eng. 2016, A674, 104–116. [Google Scholar] [CrossRef]
  17. Kapp, M.W.; Hohenwarter, A.; Wurster, S.; Yang, B.; Pippan, R. Anisotropic deformation characteristics of an ultrafine- and nanolamellar pearlitic steel. Acta Mater. 2016, 106, 239–248. [Google Scholar] [CrossRef] [Green Version]
  18. Funkenbusch, P.D.; Lee, J.K.; Courtney, T.H. Ductile Two-Phase Alloys: Prediction of Strengthening at High Strains. Metall. Trans. 1987, A18, 1249–1256. [Google Scholar] [CrossRef]
  19. Hangen, N.; Raabe, D. Modelling of the yield stregth of a heavily wire drawn Cu-20%Nb composite by use of a modified linear rule of mixture. Acta Metall. Mater. 1995, 43, 4075–4082. [Google Scholar] [CrossRef]
  20. Russell, A.M.; Chumbley, L.S.; Tian, Y. Deformation Processed Metal-Metal Composites. Adv. Eng. Mater. 2000, 2, 11–22. [Google Scholar] [CrossRef]
  21. Bouaziz, O.; Zurob, H.; Huang, M. Driving Force and Logic of Development of Advanced High Strength Steels for Automotive Applications. Int. Steel Res. 2013, 84, 937–947. [Google Scholar] [CrossRef]
  22. Ungár, T.; Harjo, S.; Kawasaki, T.; Tomota, Y.; Ribárik, G.; Shi, Z. Composite behavior of martensite steels induced by plastic strain, a new paradigm for the elastic-plastic response of martensitic steels. Metall. Mater. Trans. 2017, A48, 159–167. [Google Scholar] [CrossRef] [Green Version]
  23. Harjo, S.; Kawasaki, T.; Tomota, Y.; Gong, W.; Aizawa, K.; Shi, Z.; Tichy, G.; Ungár, T. Work hardening, dislocation structure and load partitioning in lath-martensite determined by in situ neutron diffraction line profile analysis. Metall. Mater. Trans. 2017, A48, 4080–4092. [Google Scholar] [CrossRef] [Green Version]
  24. Mughrabi, H. Dislocation wall and cell structures and long-range internal stresses in deformed metal crystals. Acta Metall. 1983, 31, 1367–1379. [Google Scholar] [CrossRef]
  25. Ungár, T.; Mughrabi, H.; Rönnpagel, D.; Wilkens, M. X-ray line-broadening study of the dislocation cell structure in deformed [001]-orientated copper single crystals. Acta Metall. 1984, 32, 333–342. [Google Scholar] [CrossRef]
  26. Mughrabi, H.T.; Ungár Kienle, T.W.; Wilkens, M. Long-range internal stresses and asymmetric X-ray line-broadening in tensile-deformed [001]-orientated copper single crystals. Philos. Mag. 1986, A53, 793–813. [Google Scholar] [CrossRef]
  27. Ungár, T.; Ott, S.; Sanders, P.G.; Borbély, A.; Weertman, J.R. Dislocations, grain size and planar faults in nanostructured copper determined by high resolution X-ray diffraction and a new procedure of peak profile analysis. Acta Mater. 1998, 46, 3693–3699. [Google Scholar] [CrossRef]
  28. Ungár, T.; Gubicza, J.; Ribárik, G.; Borbély, A. Crystallite size distribution and dislocation structure determined by diffraction profile analysis: Principles and practical application to cubic and hexagonal crystals. J. Appl. Cryst. 2001, 34, 298–310. [Google Scholar] [CrossRef] [Green Version]
  29. Ribárik, G.; Gubicza, J.; Ungár, T. Correlation between strength and microstructure of ball-milled Al-Mg alloys determined by X-ray diffraction. Mater. Sci. Eng. 2004, A387–A389, 343–347. [Google Scholar] [CrossRef]
  30. Ribárik, G.; Ungár, T. Characterization of the microstructure in random and textured polycrystals and single crystals by diffraction line profile analysis. Mater. Sci. Eng. 2010, A528, 112–121. [Google Scholar] [CrossRef]
  31. Ribárik, G.; Jóni, B.; Ungár, T. Global optimum of microstructure parameters in the CMWP line-profile-analysis method by combining Marquardt-Levenberg and Monte-Carlo procedures. J. Mater. Sci. 2019, 35, 1508–1514. [Google Scholar] [CrossRef] [Green Version]
  32. Ungár, T.; Tichy, G.; Gubicza, J.; Hellmig, R.J. Correlation between subgrains and coherently scattering domains. Powder Diffr. 2005, 20, 366–375. [Google Scholar] [CrossRef] [Green Version]
  33. Warren, B.E. X-ray Diffraction; Dover Publ.: New York, NY, USA, 1990; p. 269. [Google Scholar]
  34. Wilkens, M. Theoretical aspects of kinematical X-ray diffraction profiles from crystals containing dislocation distributions. In Fundamental Aspects of Dislocation Theory Volume II; Simmons, J.A., De Wit, R., Bullough, R., Eds.; National Bureau of Standards (US) Special Publication No. 317; National Institute of Standards and Technology: Gaithersburg, MD, USA, 1970; pp. 1195–1221. [Google Scholar]
  35. Ungár, T.; Tichy, G. The effect of dislocation contrast on X-ray line profiles in untextured polycrystals. Phys. Status Solidi 1999, A171, 425–434. [Google Scholar] [CrossRef]
  36. Ungár, T.; Dragomir, I.; Révész, Á.; Borbély, A. The contrast factors of dislocations in cubic crystals: The dislocation model of strain anisotropy in practice. J. Appl. Crystallogr. 1999, 32, 992–1002. [Google Scholar] [CrossRef] [Green Version]
  37. Ungár, T.; Li, L.; Tichy, G.; Pantleon, W.; Choo, H.; Liaw, P.K. Work softening in nanocrystalline materials induced by dislocation annihilation. Scr. Mater. 2011, 64, 876–879. [Google Scholar] [CrossRef]
  38. Devincre, B.; Hoc, T.; Kubin, L. Dislocation mean free paths and strain hardening of crystals. Science 2008, 320, 1745–1748. [Google Scholar] [CrossRef]
  39. Sestak, B.; Seeger, A. The relationship between the work-hardening of B.C.C. and F.C.C. metals. Phys. Status Solidi 1971, B43, 433–444. [Google Scholar] [CrossRef]
  40. Sestak, B.; Seeger, A. Gleitung und Verfestigung in kubisch raumzentrierten Metallen und Legierungen I-III. Zeitschrift Metallkunde 1978, 69, 425–432. [Google Scholar]
  41. Taylor, G.I. The mechanism of plastic deformation of crystals, Part I Theoretical. Proc. R. Soc. Lond. 1934, A145, 362–387. [Google Scholar]
  42. Arlazarov, A.; Bouaziz, O.; Hazotte, A.; Gouné, M.; Allain, S. Characterization and Modeling of Manganese Effect on Strength and Strain Hardening of Martensitic Carbon Steels. Int. Iron Steel Inst. Jpn. 2013, 53, 1076–1080. [Google Scholar] [CrossRef] [Green Version]
  43. Mughrabi, H. A two-parameter description of heterogeneous dislocation distributions in deformed metal crystals. Mater. Sci. Eng. 1987, 85, 15–31. [Google Scholar] [CrossRef]
  44. Schafler, E.; Simon, K.; Bernstorff, S.; Hanák, P.; Tichy, G.; Ungár, T.; Zehetbauer, M.J. A second-order phase-transformation of the dislocation structure during plastic deformation determined by in situ synchrotron X-ray diffraction. Acta Mater. 2005, 53, 315–322. [Google Scholar] [CrossRef]
  45. Ungár, T.; Stoica, A.D.; Tichy, G.; Wang, X.-L. Orientation-dependent evolution of the dislocation density in grain populations with different crystallographic orientations relative to the tensile axis in a polycrystalline aggregate of stainless steel. Acta Mater. 2014, 66, 251–261. [Google Scholar] [CrossRef]
  46. Mughrabi, H. The α-factor in the Taylor flow-stress law in monotonic, cyclic and quasi-stationary deformations: Dependence on slip mode, dislocation arrangement and density. Curr. Opin. Solid State Mater. Sci. 2016, 20, 411–420. [Google Scholar] [CrossRef]
Figure 1. The true stress, σ, versus true strain, ε, curves of the deformed specimens. The material fractured at ε = 0.034 plastic strain. The different colors ending at the dashed lines, indicating unloading, correspond to the stress–strain curves of the individual specimens. The dash–dot–dot line is at ε = 0.001 and the corresponding stress value is taken as the proof-stress, Rp,0.1 = 930 MPa.
Crystals 10 00373 g001
Figure 2. Typical axial diffraction patterns corresponding to the ε=0.0013 tensile deformed state. (a) Each peak is fitted in convolutional multiple whole profile (CMWP) with a single symmetrical profile. (b) Each peak is fitted in CMWP with the sum of two symmetrical sub-profiles. Black dots are the measured data, red lines are the CMWP calculated patterns and the blues line at the bottom are the difference between the measured and calculated patterns. Note the logarithmic intensity scales for the patterns. The insets show the enlarged 200 peaks.
Crystals 10 00373 g002
Figure 3. (a,b) Color-coded nanohardness maps of the undeformed, as-quenched state of the alloy at two different locations of the specimen. (c,d) Color-coded nanohardness maps of the specimen plastically strained to ε = 0.03, at two different locations.
Crystals 10 00373 g003
Figure 4. (a) Nanoharness values at steps of 25 μm along the diagonals of the maps shown in Figure 3 for the undeformed (blue open up-triangles) and the ε = 0.03 tensile strained (red open circles) specimens. The means and standard deviations for the undeformed and the ε = 0.03 strained specimens are 6.50 (±0.31) and 6.73 (±0.70) GPa, respectively. (b) The mean, maximum, and minimum values of the Vickers-hardness distributions versus the ε true strain. The vertical thick black line indicates the statistical fluctuation of HV in the undeformed state.
Crystals 10 00373 g004
Figure 5. (a,b) Scanning electron micrographs showing the prior austenite grain encircled by thin black lines, the packets in the first enlarged rectangle, and the blocks in the further enlarged rectangles. The black spots are contaminations on the surface, not belonging to the structure.
Crystals 10 00373 g005
Figure 6. Enlarged 200 diffraction profiles: the measured and CMWP-calculated profiles for the undeformed (open triangles and blue lines) and ε = 0.0093 tensile deformed (open circles and red lines) states corresponding to the axial (a) and side (b) surfaces. The measured (open circles), the CMWP-calculated total- (green lines) and sub-profiles corresponding to the HO (blue lines) and SO (red lines) packets for the ε = 0.006 tensile deformed states in the axial (c) and side (d) directions.
Crystals 10 00373 g006
Figure 7. The averaged values of the relative shifts, Δd/d, of the sub-peaks obtained from 200 and 310 reflections and both axial- and side cases (a) and the long-range internal stress values, Δσ (b) as a function of true strain. The vertical thick black lines indicate the experimental error.
Crystals 10 00373 g007
Figure 8. The dislocation densities (a), the q dislocation-type (b) and the M dislocation arrangement parameters (c) in the HO and SO packets as a function of true strain. The vertical thick black lines indicate the experimental error.
Crystals 10 00373 g008
Figure 9. (a) The applied stress values versus MTGb ρ for the measured values of the total, the hard, and the soft component dislocation densities, (b) the total α parameters and the local α values in the HO and SO components as a function of true strain, (c) the total and the local flow stresses corresponding to the HO and SO packets versus the true strain. The vertical thick black line indicates the experimental error. (d) The calculated local flow stress values in the SO and HO components and the total flow stress values vs. the corresponding measured values.
Crystals 10 00373 g009