Article

Numerical Simulation to Determine the Effect of Topological Entropy on the Effective Transport Coefficient of Unidirectional Composites

1
Unidad de Energía Renovable, CONACYT-Centro de Investigación Científica de Yucatán, C 43 No 130, Chuburná de Hidalgo, Mérida 97200, Yucatán, Mexico
2
División de Ciencias e Ingeniería, Universidad de Quintana Roo, Boulevard Bahía s/n, Chetumal 77019, Quintana Roo, Mexico
3
Departamento de Física Aplicada, CINVESTAV-IPN, Antigua Carretera a Progreso km 6, Mérida 97310, Yucatán, Mexico
*
Authors to whom correspondence should be addressed.
Crystals 2020, 10(6), 423; https://doi.org/10.3390/cryst10060423
Submission received: 29 April 2020 / Revised: 15 May 2020 / Accepted: 20 May 2020 / Published: 26 May 2020
(This article belongs to the Special Issue Advanced Research on Heterogeneous Materials)

Abstract

:
The influence of topological entropy (TS) on the effective transport coefficient (ETC) of a two-phase material is analyzed. The proposed methodology studies a system of aligned bars that evolves into a stochastic heterogeneous system. This proposal uses synthetic images generated by computational algorithms and experimental images from the scanning electron microscope (SEM). Microstructural variation is imposed for statistical reconstruction moments by simulated annealing (SA) and it is characterized through TS applied in Voronoi diagrams of the studied systems. On the other hand, ETC is determined numerically by the Finite Volume Method (FVM) and generalized by a transport efficiency of charge (ek). The results suggest that our approach can work as a design tool to improve the ETC in stochastic heterogeneous materials. The case studies show that ek decreases when TS increases to the point of stability of both variables. For example, for the 80% surface fraction, in the particulate system of diameter D = 1, ek = 50.81 ± 0.26% @ TS = 0.27 ± 0.002; when the system has an agglomerate distribution similar to a SEM image, ek = 45.69 ± 0.60% @ TS = 0.32 ± 0.002.

1. Introduction

Composites allow the association of materials with different but complementary characteristics, which combined synergistically generate an assembly with original properties. These materials find a niche in applications where traditional materials cannot satisfy design criteria. Some examples of its applications are to save weight while maintaining high-performance mechanical properties [1], high corrosion resistance [2] and better electrical transport [3]. Different sectors such as aerospace and energy industry are attracted to composite materials [4].
When composites materials align their phases, they can improve some of the physical properties [5]. For example, in electrochemical electrodes, there are many expectations of having unidirectional composite materials that provide a reduction in internal resistance and facilitate ion diffusion. An aligned electrode exhibits better electrochemical performance [5,6]. Currently, several strategies are developed to manufacture electrolytic composites that provide high ionic conductivity. Tortuosity analyses suggest that vertically interconnected ceramic particles are the optimal configuration for creating high ionic conductivity pathways in lithium-ion batteries [7]. Liu et al. proved that aligning fibers of L i 0.33 L a 0.557 T i O 3 vertically, increases ionic conductivity from 1.78 × 10⁻⁷ S cm−1 to 6.05 × 10⁻⁵ S cm−1 at 30 °C [8]. Wang et al. present a study on rechargeable batteries with vertically aligned ceramic/polymer composites where the alienated ceramic phase in the composite electrolyte allows rapid conduction of lithium-ions, reaching a conduction of 1.67 × 10⁻⁴ S cm−1 at room temperature, 6.9 times higher than the sample containing the ceramic composite dispersed in the electrolyte [7].
In polymer electrolyte fuel cells (PEFC), mass transport in the catalytic layer continues as the primary characteristic that determines the cell performance, mainly because effective transport of electrons, ions and reactants gases are prerequisites for complete electrochemical reactions to occur [9,10,11]. Transport phenomena are associated with the heterogeneous morphology of the composites that form the catalytic layer, ionomer and pores. The use of platinum (Pt) supported in vertically aligned carbon nanotubes (Pt/VACNT) is widely proposed as it improves the structure of the catalytic layer at the nanoscale. By adopting the use of VACNT as carbon support, the catalytic layer can form effective pathways for electron transport and continuous porous structures for mass transport [12,13]. Yasuda et al., who developed a catalytic layer of iron-nitrogen-doped carbon nanotubes using VACNT, demonstrated that the catalytic layer supported in VACNT exhibited a more significant reaction to the oxygen reduction compared to the conventional carbon supported catalytic layer, resulting in improved mass transport efficiency [14]. Tian et al. reported that VACNT could significantly improve the fabrication of membrane electrode assemblies (MEA) with low loads of Pt when used as carbon support because there are suitable pathways for transport of electrons, protons and reactants in the VACNT catalytic layer allowing better use of the catalyst [15]. Catalytic layers deposited on VACNT exhibit similar performances to conventional catalytic layers even when very low Pt loads have been used and deposited on the surface of VACNT. Murata et al. demonstrated that VACNT used as carbon support allowed the operation of a PEFC at high current densities with a low Pt load, mainly due to improved pore continuity and electric contact [16].
Composites can be studied as random heterogeneous materials (RHM). The coefficient proportionality, or effective transport coefficient (ETC), for mass transport, charge and energy are affected by properties of the phases that form them, the surface fraction of the phases and by the microstructure, as described in the Equation (1) [17]:
K e = f ( K 1 ,   K 2 , ,   K M ;   ϕ 1 , ϕ 2 , ,   ϕ M ;   Ω ) ,
where the subindex of the variables indicates the phase in question, K is the phase proportionality constant, ϕ is the volumetric fraction of the phase, and Ω is the microstructural information of the medium [18,19].
There are different mathematical relationships to determine ETC’s. Garnett [20] developed a relationship to determine the optical properties of diluted uniform sphere dispersions. One of the most widely used methodologies is the one proposed by Bruggeman [21], which applies for systems random dispersions of spherical particles with different size ranges. However, stochastic reconstruction allows defining the microstructure in a node mesh to study the ETC in more detail [17].
In previous works our research group has published strategies to study RHMs. Barbosa et al. [17] reported an escalating method to determine ETC’s in RHM using stochastics reconstruction and analytical techniques. Ortegon et al. [22] presented a method to classify the phases of the materials using Support Vector Machines (SVM) which generates a binarized image from the obtained SEM images of the studied microstructures. Ledesma-Alonso et al. [23] presented a theoretical analysis of the effect of image reduction obtained from the reconstruction, using a progressive and sequential method of the decimated image. Rodriguez et al. [24] analyzed the effect of size reduction in ETC’s microstructure and implemented Simulated Annealing (SA) reconstruction for the study.
On the other hand, there are studies of structures and topological properties in 2D systems, which exhibited that specific structural and topological properties reach a stable state when the aggregation continues, due to the spatial ordering of the groups [25]. These properties can be studied by construction of Voronoi diagrams, which allow a global description of the system’s aggregates.
This work analyzes the effect of topological entropy (TS) on the ETC in different composites, with variations of the surface fraction. The SA method is used to reconstruct systems (microstructures) that evolve from a unidirectional composite aligned in vertical bars to an RHM. The moments of the SA reconstruction are selected for post-process to characterize the TS and determine the ETC by finite control volume. The proposed method allows analyzing the evolution of the systems, not only quantifying the influence of TS on ETC but also proposing a design strategy to modify the response of the ETC as a function of the TS. The algorithms were programed in C-language and developed by using Dev-C++ IDE (Integrated Development Environment) (Free software Foundation, Inc., version 5.11, Cambridge, MA, USA).

2. Materials and Methods

The process begins with the generation of a synthetic system, generated using our computational algorithms, which has identifiable phases. SA is used to agitate the initial system (vertically aligned composites) to a target system (randomly distributed composite). At specific points of the SA ( I S A ) agitation, representative meshes are generated which are considered new target systems (study points). The results in each study point present statistical characterization utilizing correlation, entropy and ETC functions. Figure 1 shows the general diagram of the proposed methodology.
The methodology begins with the generation of two digital systems; each system has identifiable phases: j1) matrix phase, white color and j0) dispersed phase, black color. The systems are defined by initial conditions: the size (n × n) and the surface fraction (Φ) of the phase matrix. The system origin is conditioned to show vertically aligned bars (south to north). In the target system three different configurations are studied, as described in the boundary conditions section.
The generated microstructures are characterized by the two-points correlation function ( S j ) and the linear path ( L j ). SA is used to obtain an assembly ( Ω ) that characterizes a statistical moment of the agitation SA ( I S A ). Each moment I S A is presented as a study system, where Ω is composed of 5 random realizations ω (W = 5). The results represent the response of the correlation functions, TS and the conduction efficiency (ek), applied to both phases: matrix (j1) and dispersion (j0).

2.1. Transport Effective Coefficient

The Finite Volume Method (FVM) is applied to the mesh of reconstructed control volumes, where each node identifies the phase conductivity. FVM can be implemented in different scales of synthesized materials and modeling of transport phenomena in 2D and 3D of a heterogeneous medium [24]. The normalization and generalization of the results are performed by calculating the resistivities to estimate a conduction efficiency ek (%) [17].
e k = Γ e f f Γ M ,
where, Γ e f f is the effective conductivity and Γ M the nominal conductivity.

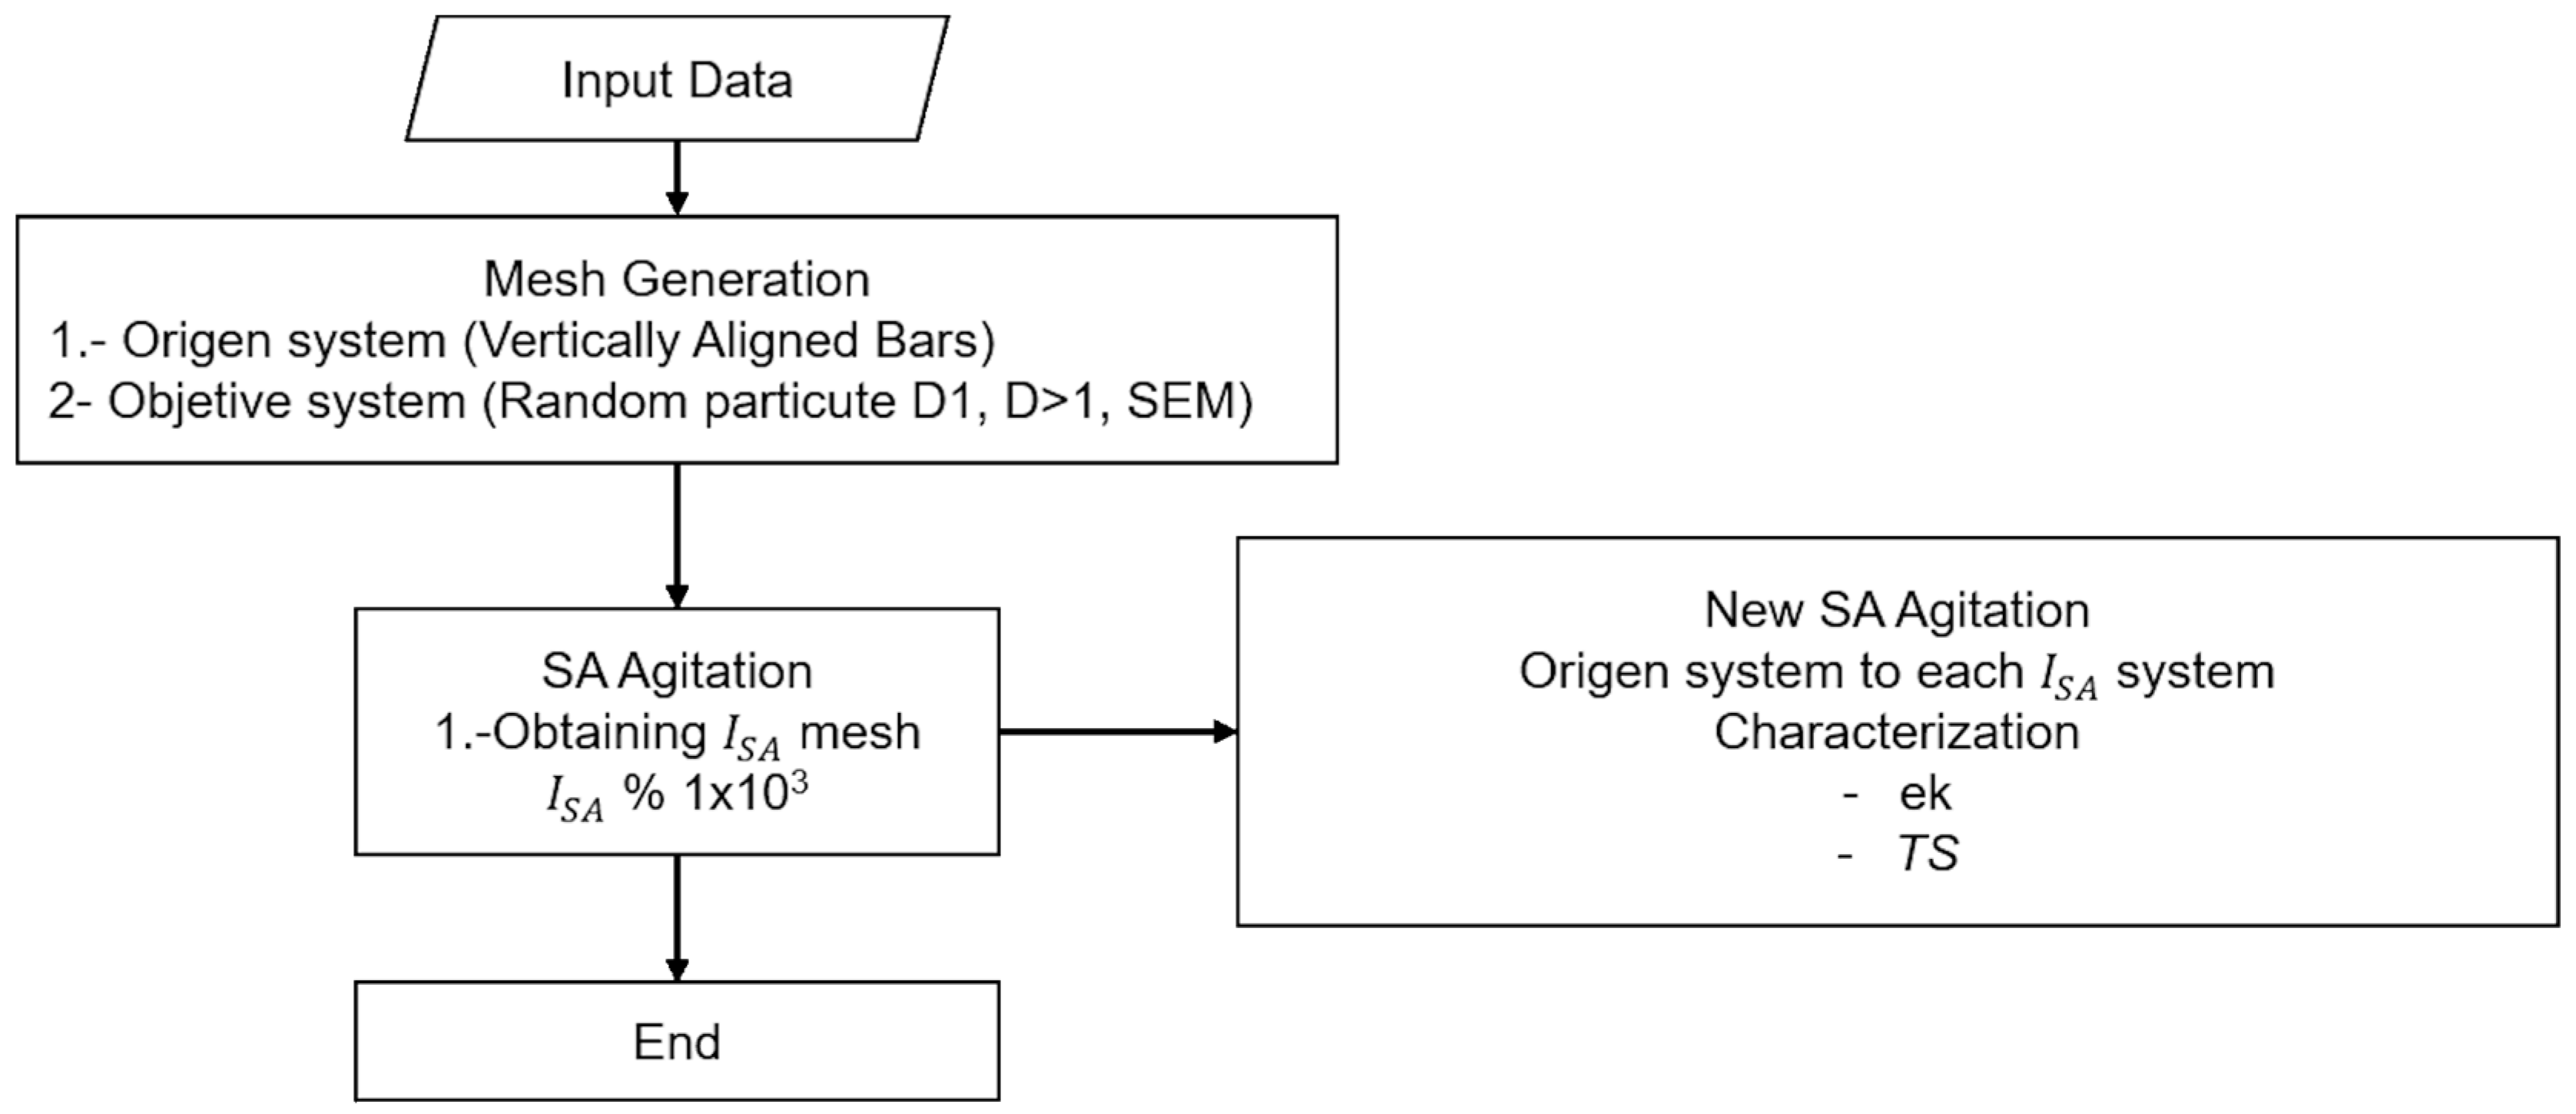
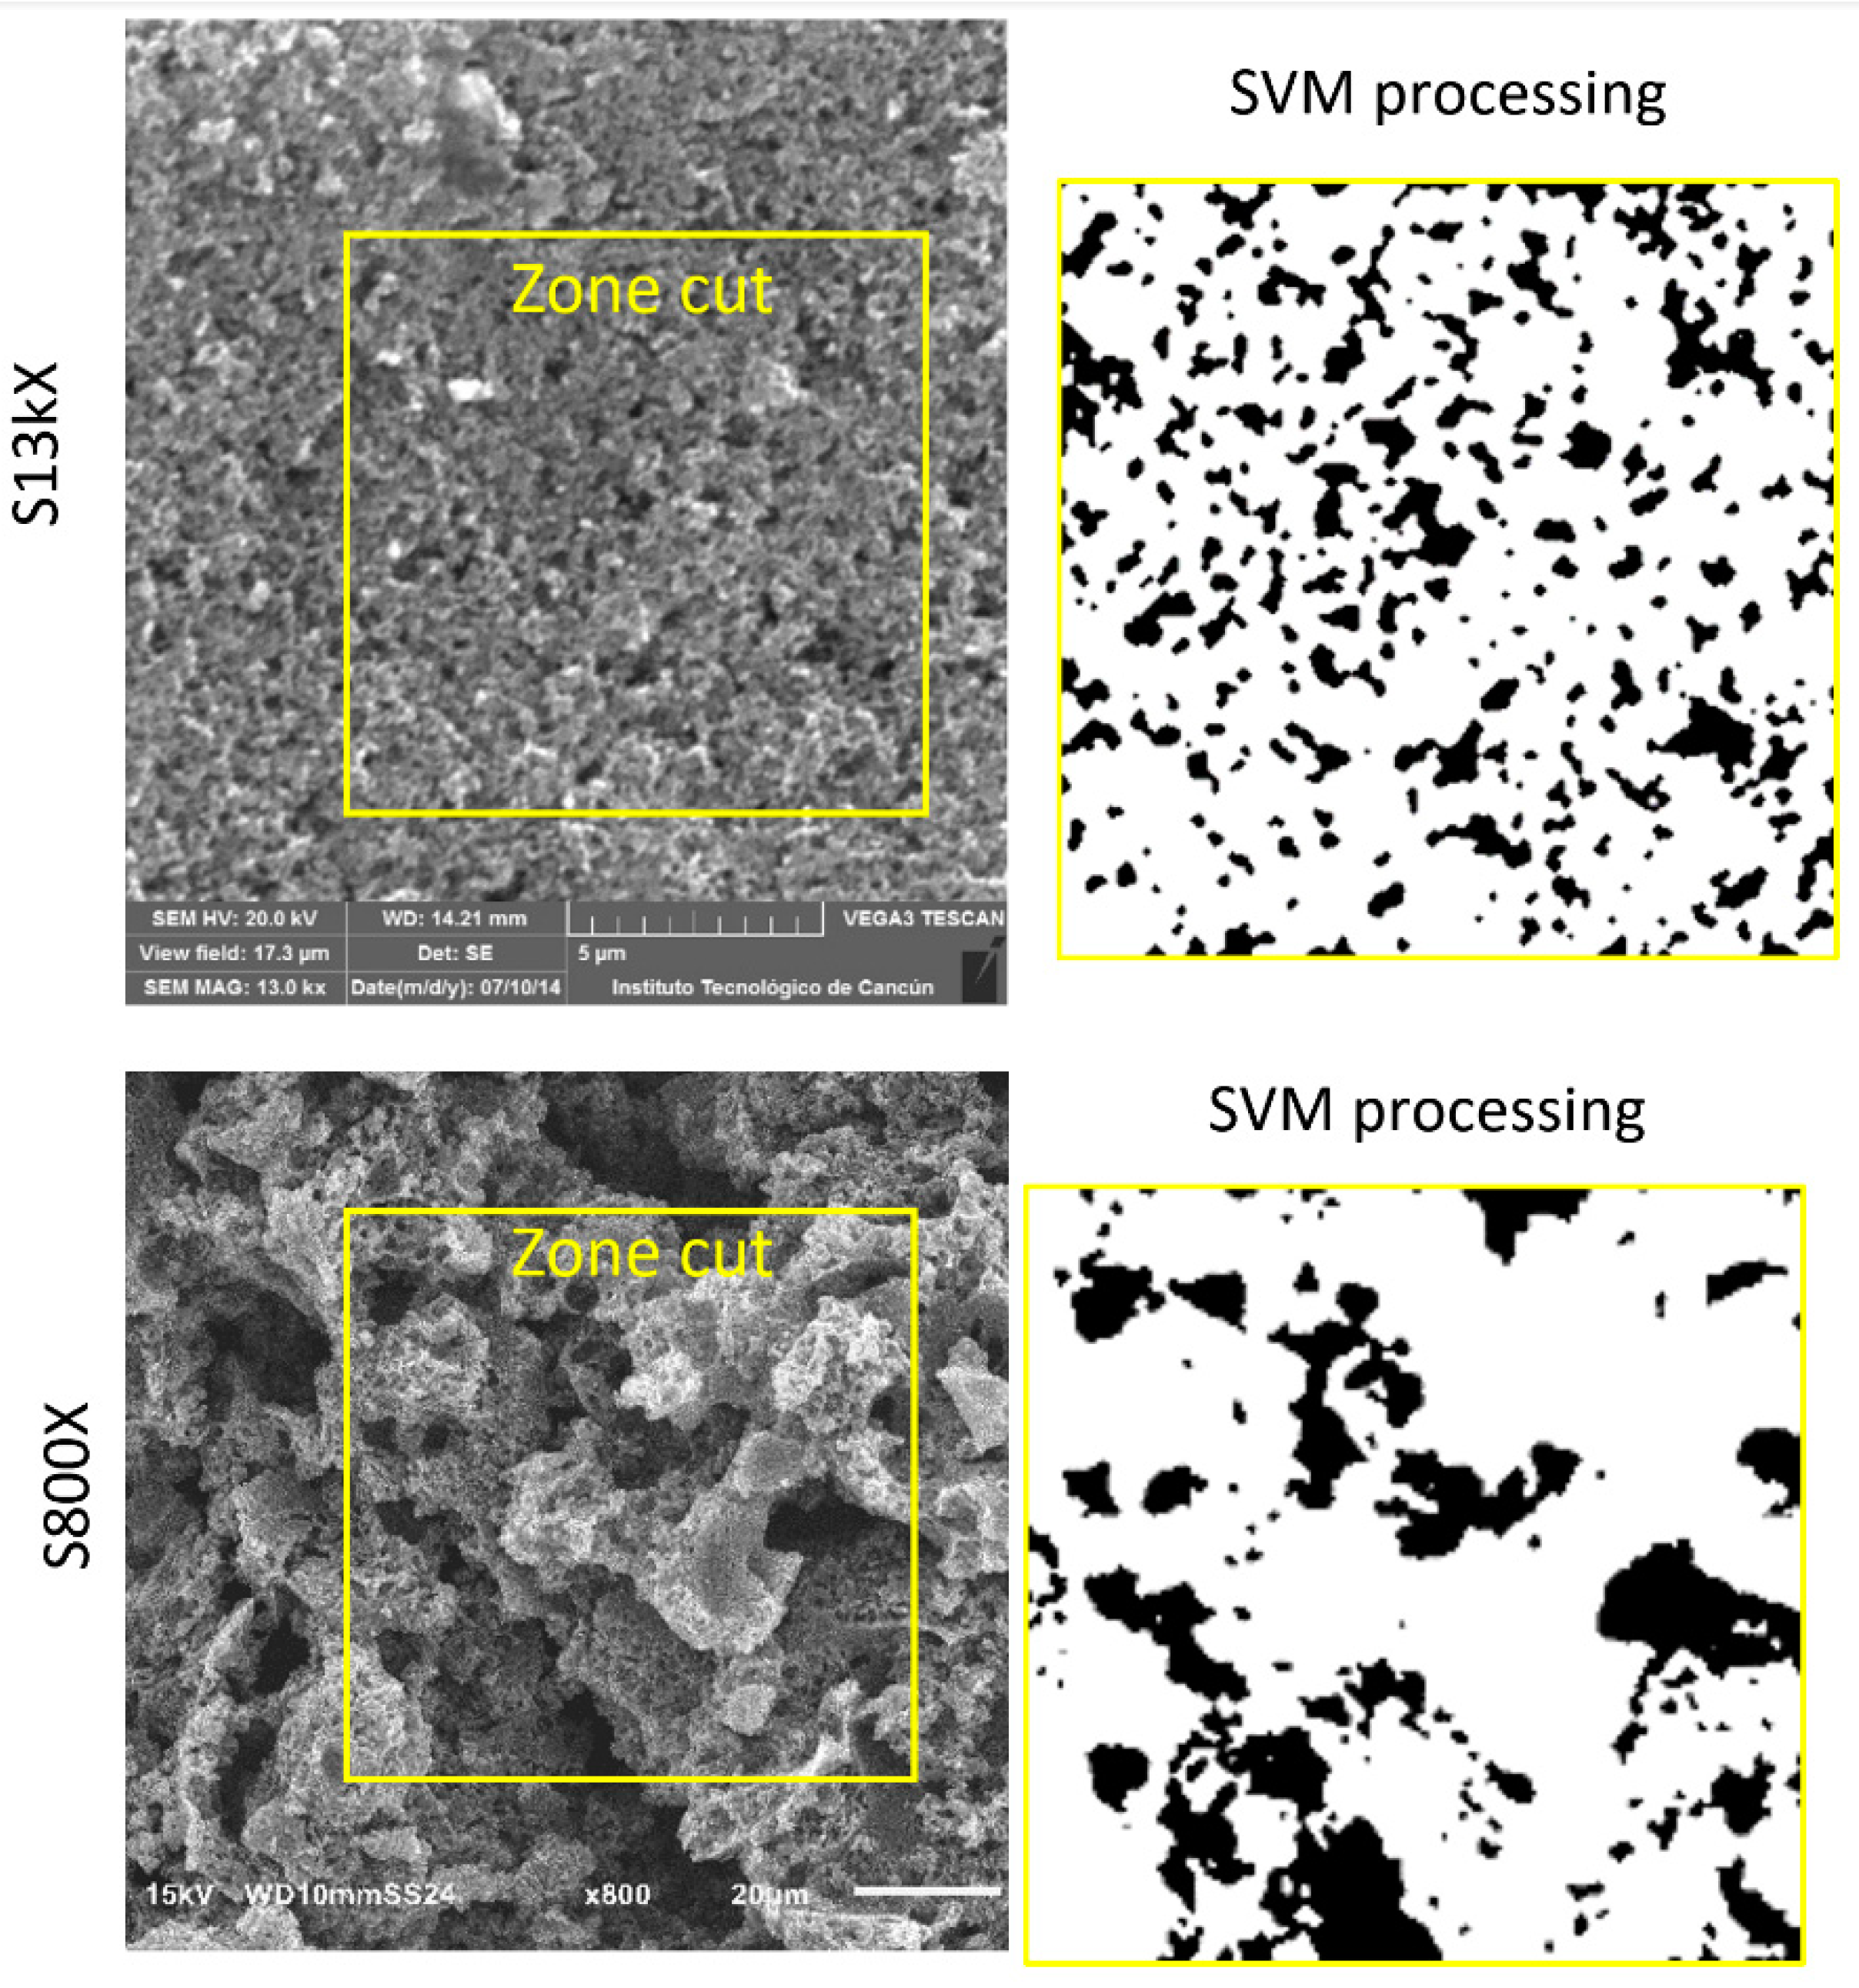
2.2. Microstructure Reconstruction

Reconstruction is employed as a strategy to generate a mesh of control volumes that characterizes the microstructure of an RHM and can be described mathematically through correlation functions. Torquato offers a methodology to characterize the microstructure and estimate the effective properties [26]. This proposal uses a reconstruction method based on the SA optimization technique. SA generates a system that is statistically the same as the target system. This study allows the user to set the initial and target systems at the beginning. Details of SA reconstruction appears in S. Torquato’s book [27]. This work presents the evolution of the error during the SA reconstruction process, which is reconstructed (W = 5) to obtain an average value. The SA error ( E S A ) is defined by Equation (3):
E S A = r [ F ´ ( r ) F ( r ) ] 2 ,
where F ( r ) is the reference system and F ´ ( r ) is the statistical descriptors of the moment SA [27]. The correlation functions are detailed in previous works [23], two-point correlation function ( S j ) and the linear path ( L j ) will be used in this work to rebuild the microstructure.
The two-point correlation function S j ( 2 ) ( x a , x b ) is the probability that the initial point x a and the final point x b of a line of length r fall into the same phase j. Considering an isotropic and homogenous medium, S j ( 2 ) statistically can be defined as a function of the distance r:
S j ( 2 ) ( r ) = T J ( x ) T J ( x + r ) ,
where 〈〉 refers to the statistical average that results when evaluating the entire computing domain of each one of the realizations ω . T J is the index function of the computing domain, which is T J = 1 when the node belongs to the conductive phase (study phase) and T J = 0 when the node is in the non-conductive phase.
The function L j ( x a , x b ) is the probability that a segment of a line r with its initial point x a and the final point x b fall completely in the phase j. Considering an isotropic and homogenous medium statistically, L j as a function of the distance r, is:
L J ( r ) = 0 r T J ( x + r ) ,
The procedure for L J is simply reduced to identify the length of the strings for the corresponding phase. In this work, the evaluation of S j ( 2 ) and L J is done with integer values of r in orthogonal directions.

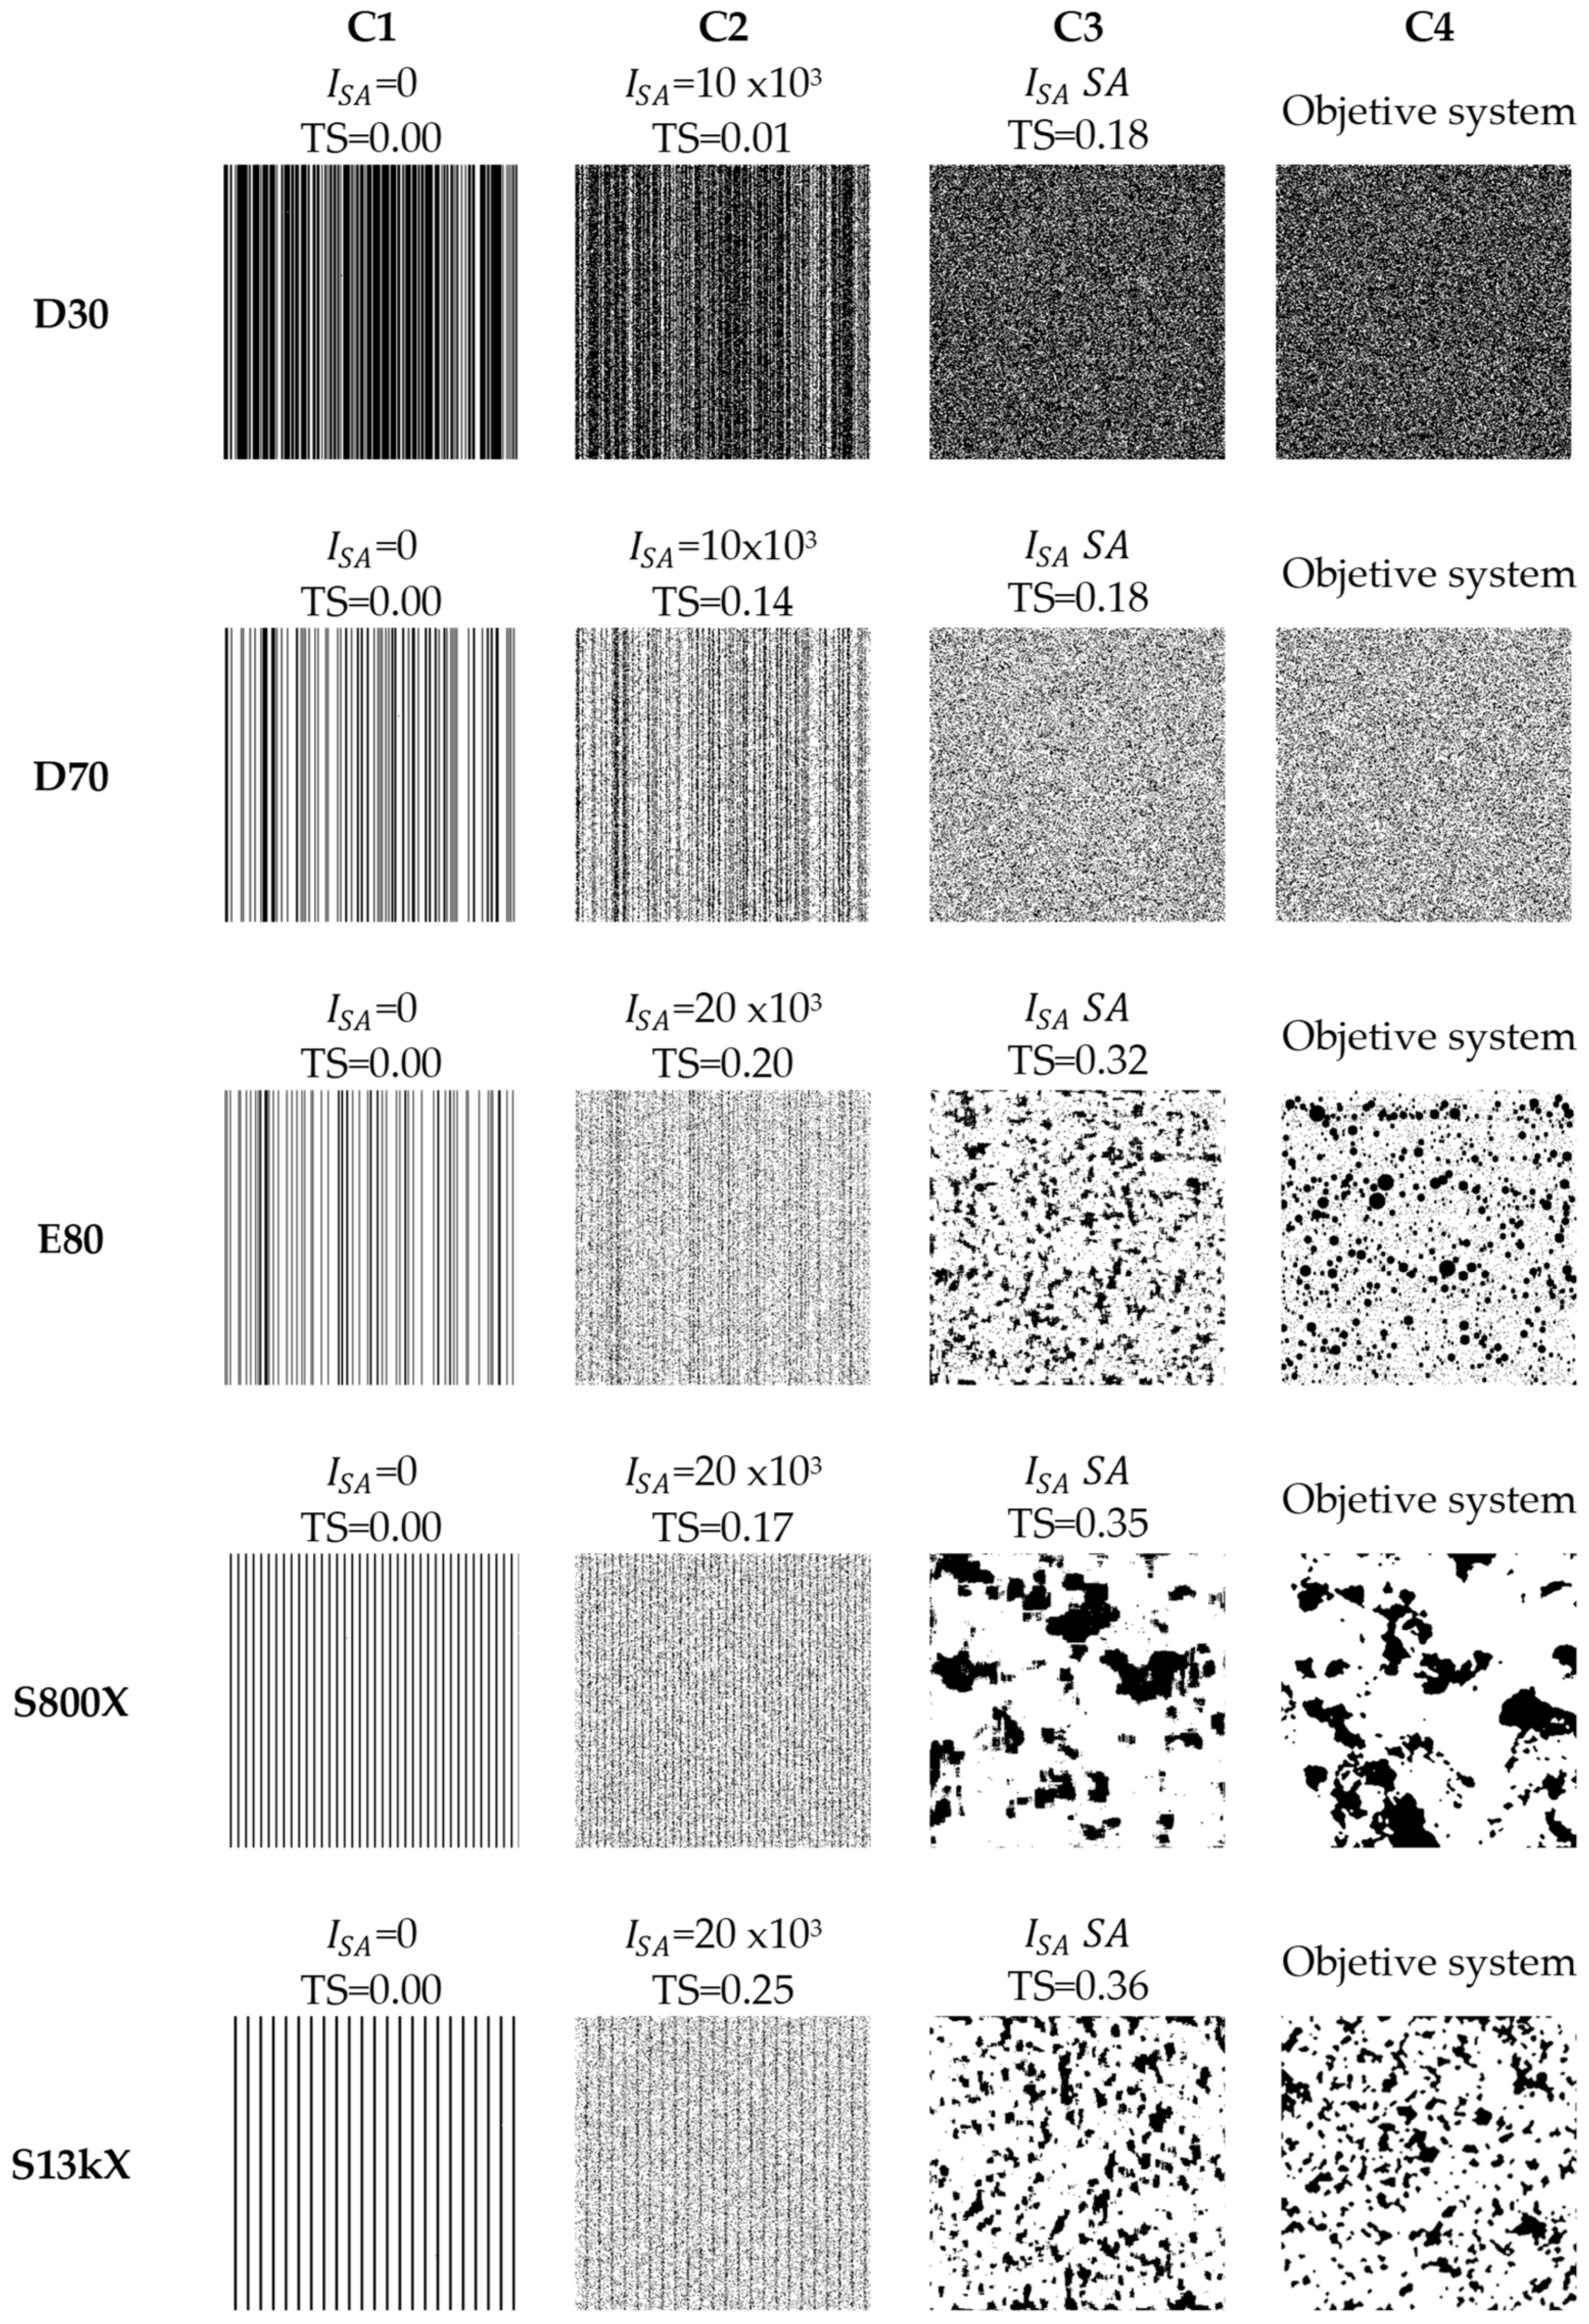
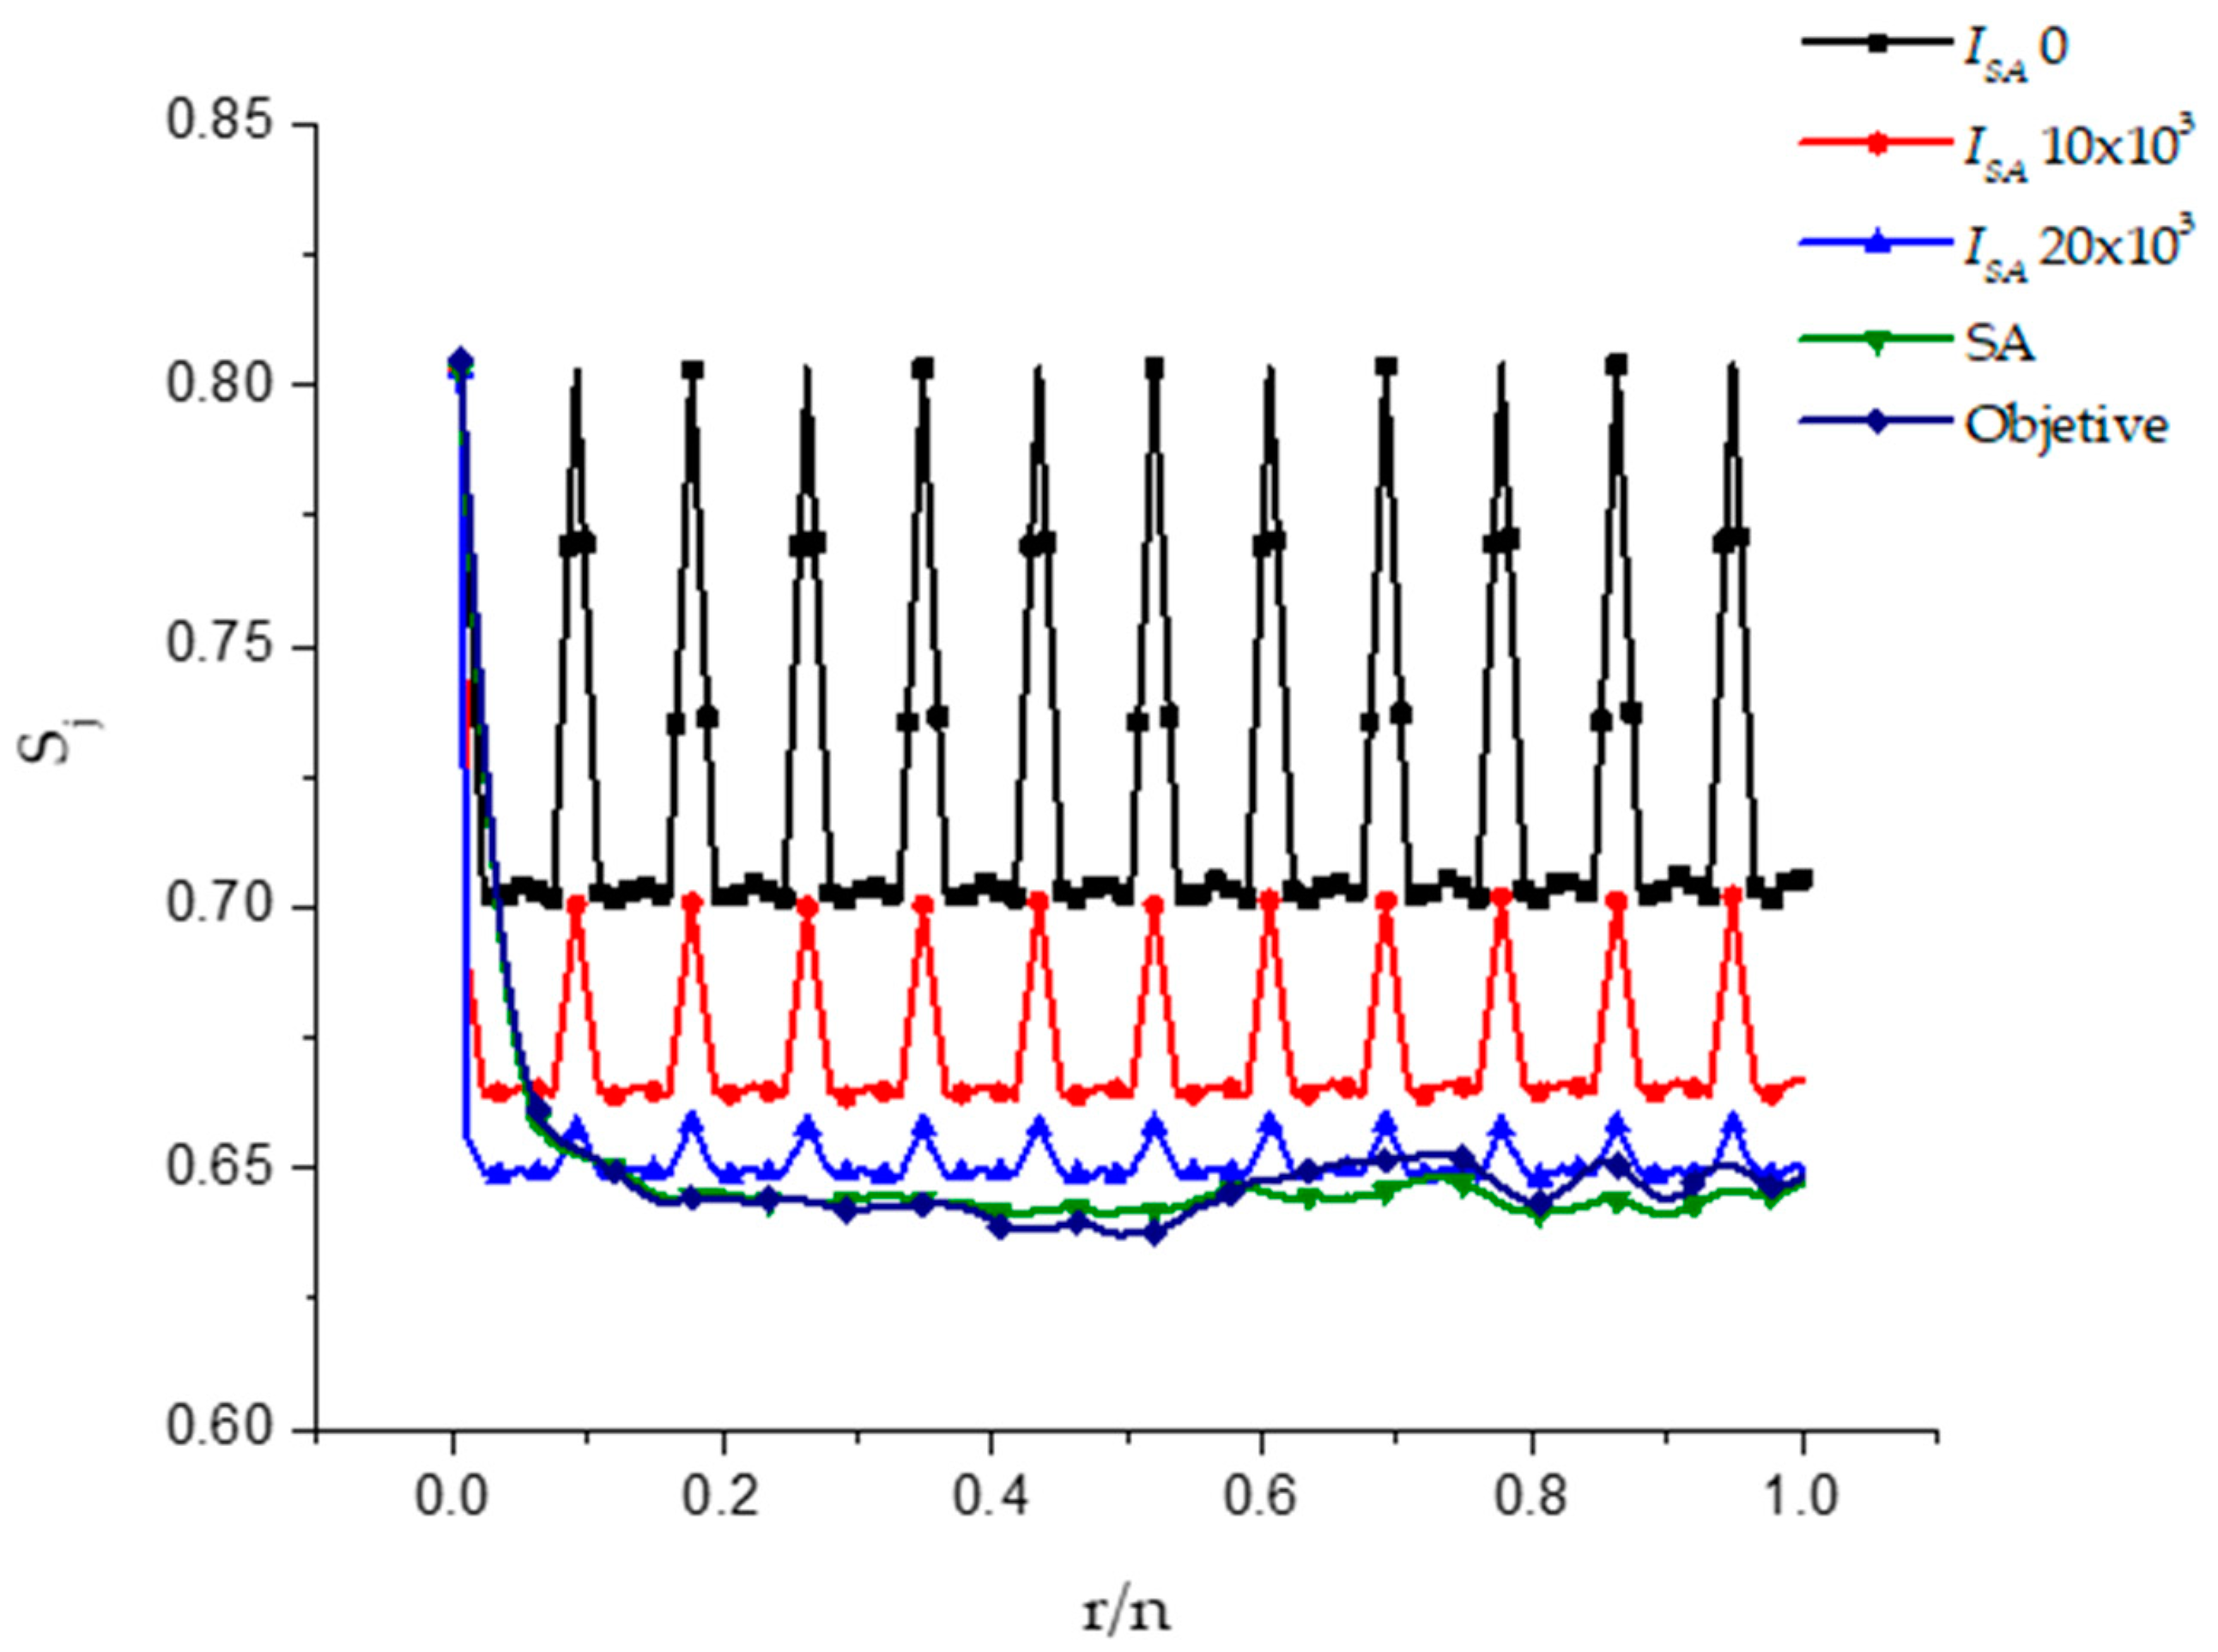
2.3. Topological Entropy

The topological Entropy technique was used to characterize the microstructural changes of a system with vertically aligned phases that transforms into a system with randomly dispersed phases. Such a technique generates random polygons with the center at each pixel of each j phase. The polygons arise from Voronoi diagrams, an interpolation method, based on Euclidean distance [28]. The construction of Voronoi diagrams allows a global description of the system aggregates, representing them by irregular cells whose shape depends on their neighboring cells. The number of sides per cell (n) provides the number of close neighbors surrounding the aggregate. The area of the polygon (A) represents the area occupied by the aggregate plus its depletion zone [29]. The generated polygons can be defined by their shape, which is a topological property. The number of sides is considered as a random variable to describe the topological randomness of polygons. The TS can be characterized by the state of the polygonal network, considering the frequencies ( p n ), as the probability of finding n-sided polygons within an observation area (microstructure domain).
T S = n = 1 p n I n p n
The TS measures a degree of arbitrariness. The entropy value for a perfectly regular pattern is always equal to zero and grows with increasing disorder. The entropy is caused by the appearance of polygons with several different edges of six. Furthermore, regardless of the degree of disorder, the average area of n-sided polygons grows. This property is derived from Equation (6). TS values for their corresponding dispersions are shown in Figure 2.
Figure 2 shows the characterization of a sample, (a) shows the original microstructure (vertically aligned bars), (b) shows the same microstructure characterized by the polygons used in the Voronoi diagrams which in turns are used to calculate the TS. The zoomed area presented in (c) shows the polygons with four sides and the order of the phase, which after its characterization, gives a TS equal to zero. On the other hand, (d) and (e) show the randomly agitated microstructure, (f) shows a zoom to the polygons which can be seen as having deformities in their sides, giving a TS of 0.18.

3. Results and Discussion

This work quantifies the influence of TS on ek (%) in composites that evolve from an aligned system to a stochastic system through three microstructural characteristics. The systems are defined as follows, (1) random systems of one-pixel diameter particles (D1); (2) random systems with a diameter distribution simulating images obtained from SEM; and (3) experimental systems obtained by SEM from a PEFC electrode. The nomenclature corresponding to each system is D, E, and S, respectively; Table 1 summarizes the studied systems, the numbers in the nomenclature correspond to the studied surface fraction.
All samples originate from a vertical bars structure (ordered pixels) of random widths. Samples D20–D82 are synthetic microstructures of 300 × 300 pixels, generated by computational algorithms that control the surface fraction of the phase, with particles of D = 1. The target microstructures of the samples “E” are synthetic as well but generated with random dispersion of diameter higher than one pixel. Samples “S” are two experimental systems obtained from SEM images of a fuel cell electrode, for samples E and S, the images size of the images is 350 × 350. The samples S13k and s800x are SEM images taken from fuel cell electrodes; the electrode was prepared by depositing 30 µL of sonicated catalytic ink for 40 min on a 5 mm diameter graphite substrate. The ink is made up of 20 mg of electrocatalyst, 30 µL of Nafion®, and 1mL of isopropanol. For image acquisition, the JEOL model JSM 6010 PLUS scanning electron microscope (Manufacturer JEOL, Chetumal, QRoo, México) was used. The samples were coated with a thin layer of gold to improve the conductivity of the samples.
Figure 3 represents the original SEM images of a electrodes of PEFC and their processing (zone cut, SVM) for the analysis. Sample S13kX corresponds to the SEM image of a fuel cell electrode, taken at 13kX magnification. Sample S800X corresponds to the SEM image of a fuel cell electrode, taken at 800X magnification. Both SEM images were processed using SVM [22].
The binarized SEM images in Figure 3 are characterized by S j and L j in the two phases, to be used as reference statistical descriptors F(r) (Equation (3)). The microstructures reconstructed in the assembly Ω, allow the statistical analysis of the ETC response in 5 realizations ω (W = 5). Conversely, seven monodispersed synthetic systems with diameter D = 1 and polydispersed synthetic systems with random diameters were studied. Figure 4 shows representative images of the systems studied. The rows refer to the evolution of the microstructure, from a system of vertically aligned bars to a system with randomly distributed particles. The columns refer to the specific configurations of the study cases. Although different surface fractions were studied, Figure 4 only shows D30, D70, E20, S13kX and S800X.
The first column presents the initial system with the vertically aligned unidirectional composites, which are characterized with TS = 0. The columns 2 to 3 present the moments I S A representative of SA agitation. The last column shows the target system or reference system used by the SA methodology for the reconstruction.
In all cases, there is an increase in TS when the SA reconstruction advances towards the optimization of the desired system (reference systems). The values presented correspond to the average obtained of W = 5 for all cases.

3.1. Reconstruction Process

This section presents the results obtained during the SA reconstruction process. Figure 5 shows the two-point correlation functions S j , of the system S800X as an example of the process that was applied to all systems. In order to highlight the changes in the statistical information, only the functions S j are presented for the matrix phase (white color phase).
The magnitude of the function S j is normalized to r/n where r is the magnitude of the line segment evaluated by the functions, and n is the length of the image domain, both values evaluated in pixels. The S j values of the initial system (black dotted curve) show a periodic response oscillating with a maximum in the surface fraction. The curves marked in red and blue represent the statistical moments I S A 10 × 103 and 20 × 103, when the system is agitated the magnitude of S j decreases, observed in the height of the peaks that represent the vertical alignment of the composite; while the green line represents the reconstructed system in comparison with the target function. The function S j of the reconstructed system and the target function are similar, responding to the general convergence term (SA) E S A = 1 × 10⁻⁶, with a standard deviation of less than 0.03%.
Figure 6 shows the evolution of the E S A error as a function of the iterations I S A of the reconstructed microstructures corresponding to D30, D70, S13kX and S800X, presented as examples. All the studied cases converged.
The error is presented in multiples of I S A = 1 × 10³. The evolution of the E S A error (Equation (3)) can be observed as a function of the statistical moments of the SA methodology. Figure 6a shows the average errors of D30 and D70; it is observed that the error drops drastically to the convergence error ( E S A = 1 × 10⁻⁶) to the few moments I S A . This observation is because the SA method agitates intrinsically from a high temperature to a lower temperature, which corresponds to the random systems with a diameter of one. Figure 6b shows the evolution E S A of the samples S13kX and S800X, and it is noted that a higher number of iterations I S A is required to reach the convergence E S A = 1 × 10⁻⁶, maybe due to the need for “agglomerates” formation to reach the target function.
Figure 7 shows the average entropy value as a function of the I S A iteration. They were obtained in the methodology stage corresponding to the original agitation. Systems D with agglomerates with a diameter of one, and systems E, S13kX and S800X with agglomerates of a diameter greater than one are presented separately for the Matrix phase in both cases.
Figure 7a shows that the entropy reaches a maximum value in all cases. Relating Figure 6; Figure 7, we can see that since we are dealing with a dispersion of elements of diameter D = 1, entropy and minimum error are reached in a faster way compared to microstructures with larger diameter agglomerates. TS achieves stability at approximately 250 I S A iterations for system D, as for systems E and S it takes up to approximately 1250–1500 I S A iterations to achieve stability of TS since the system first disperses all the particles and then begins to generate the agglomerates.

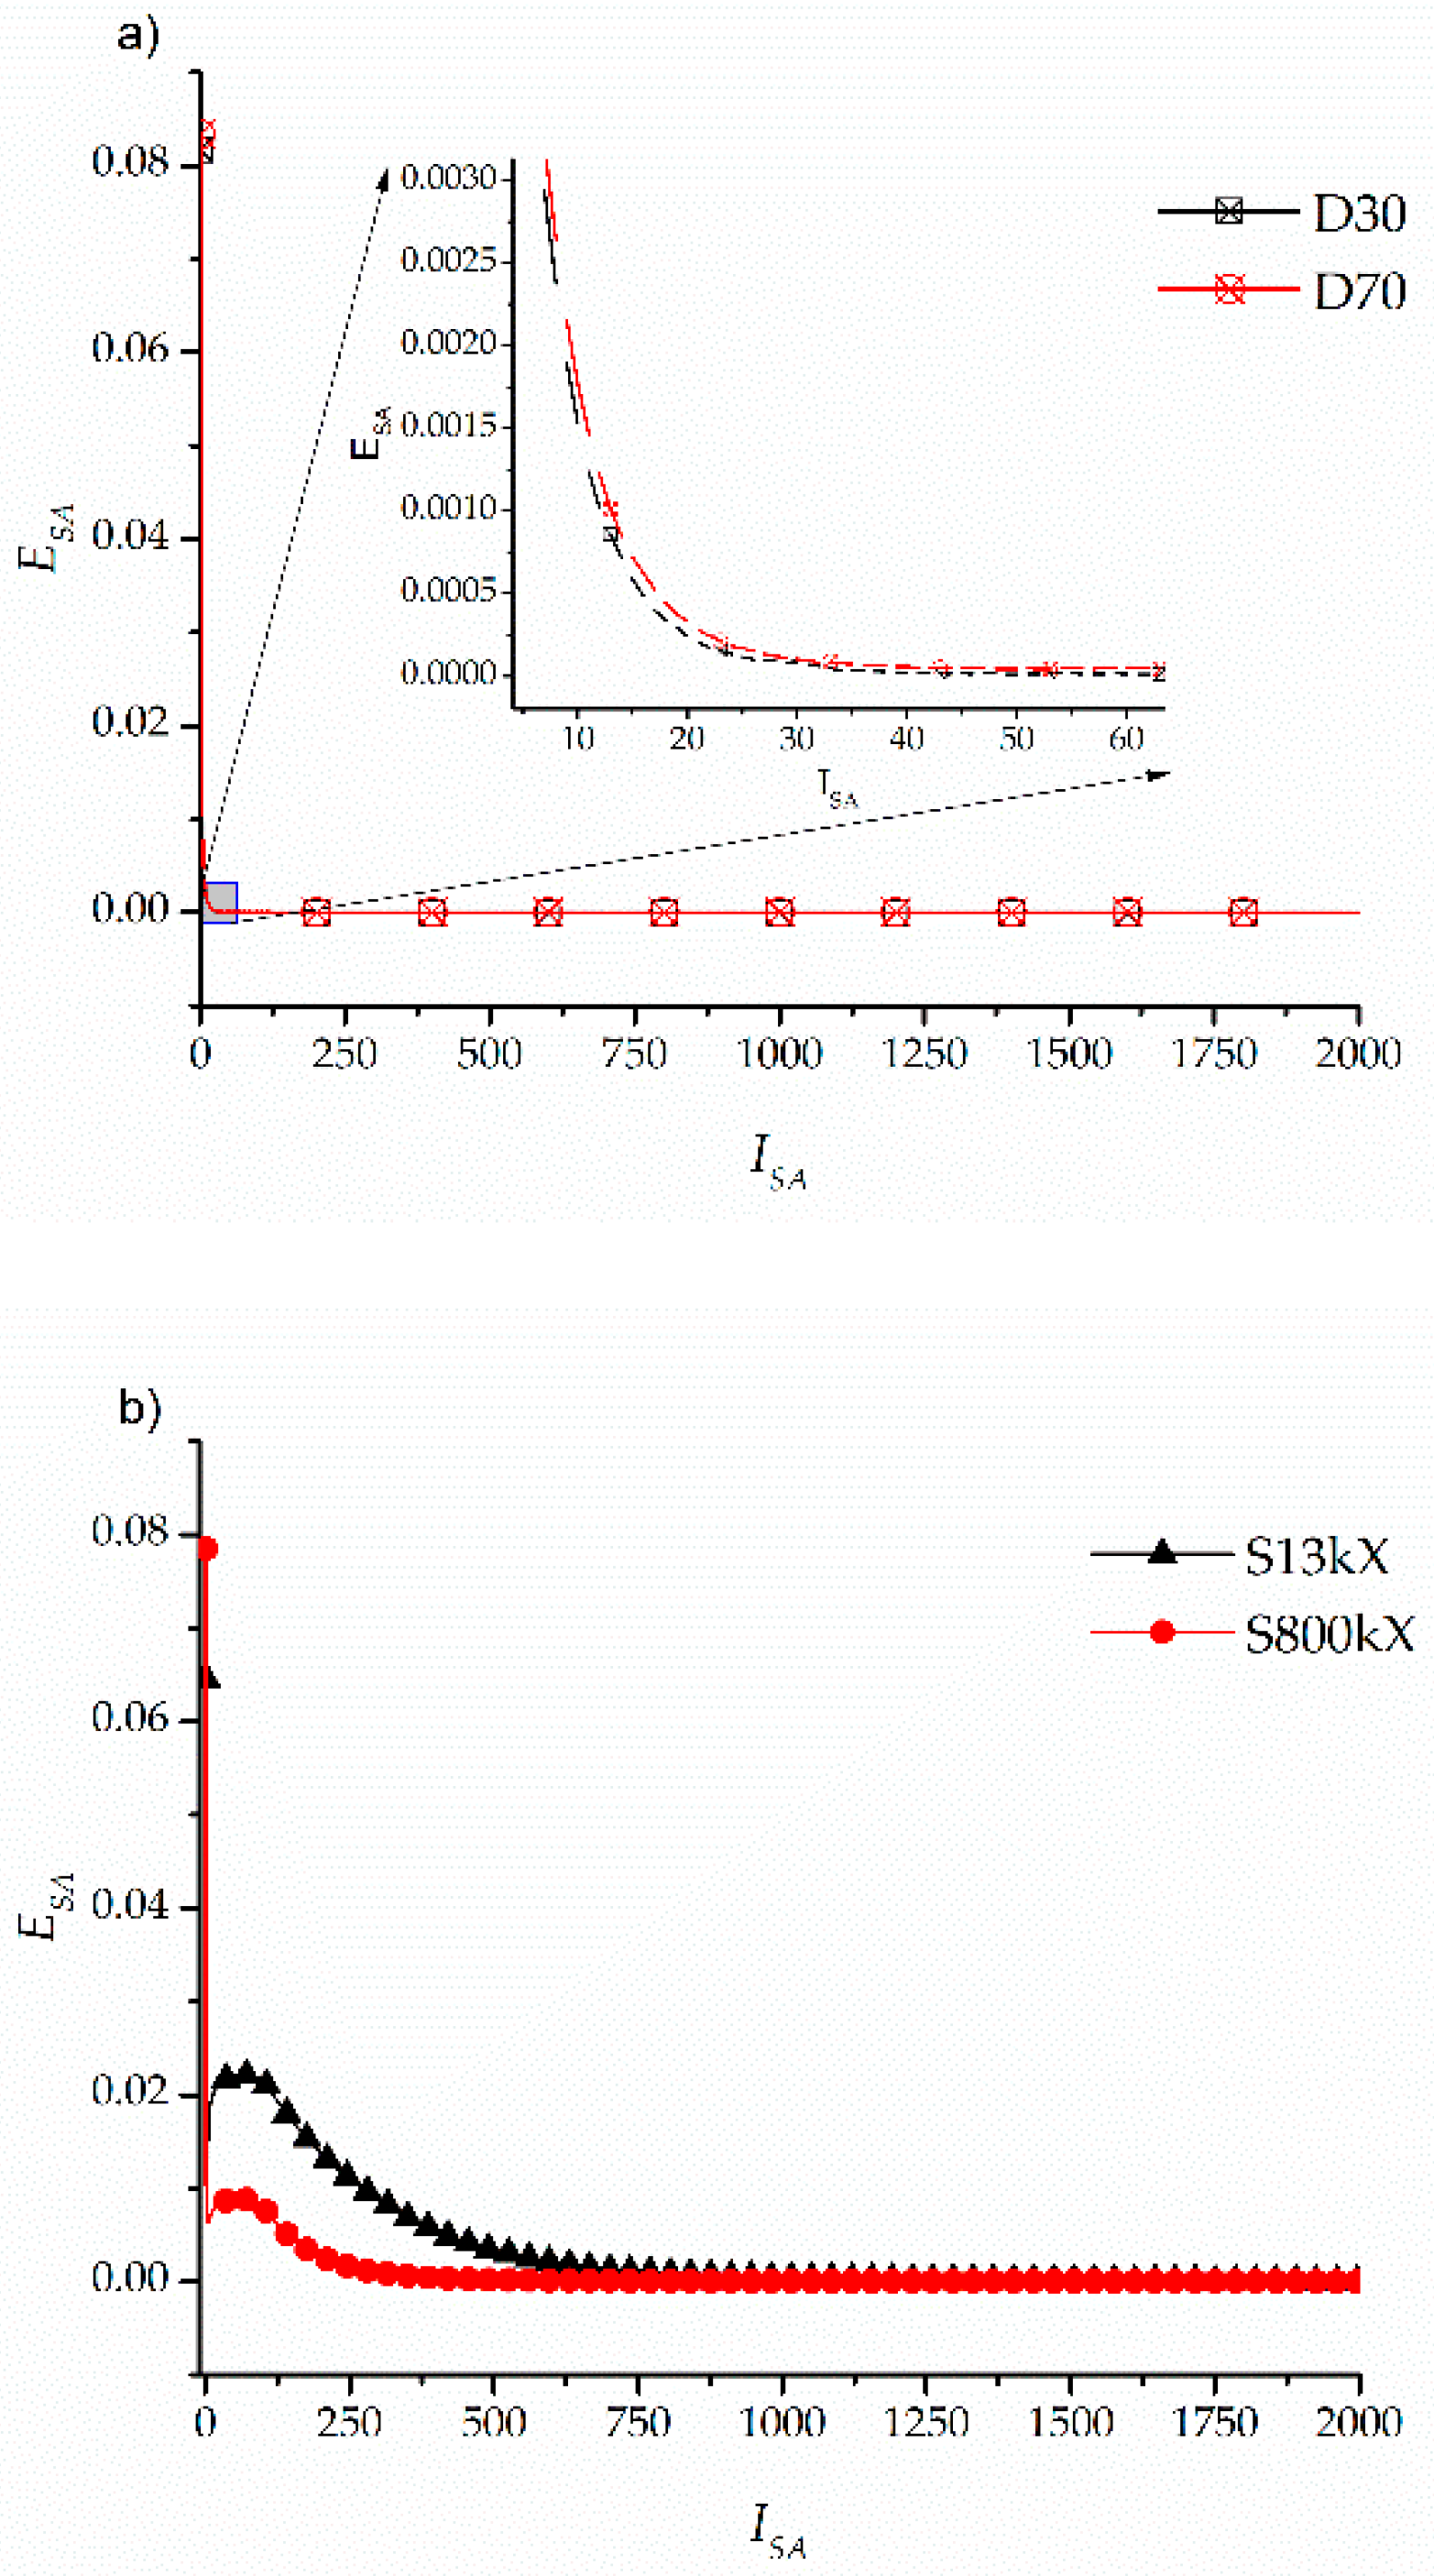
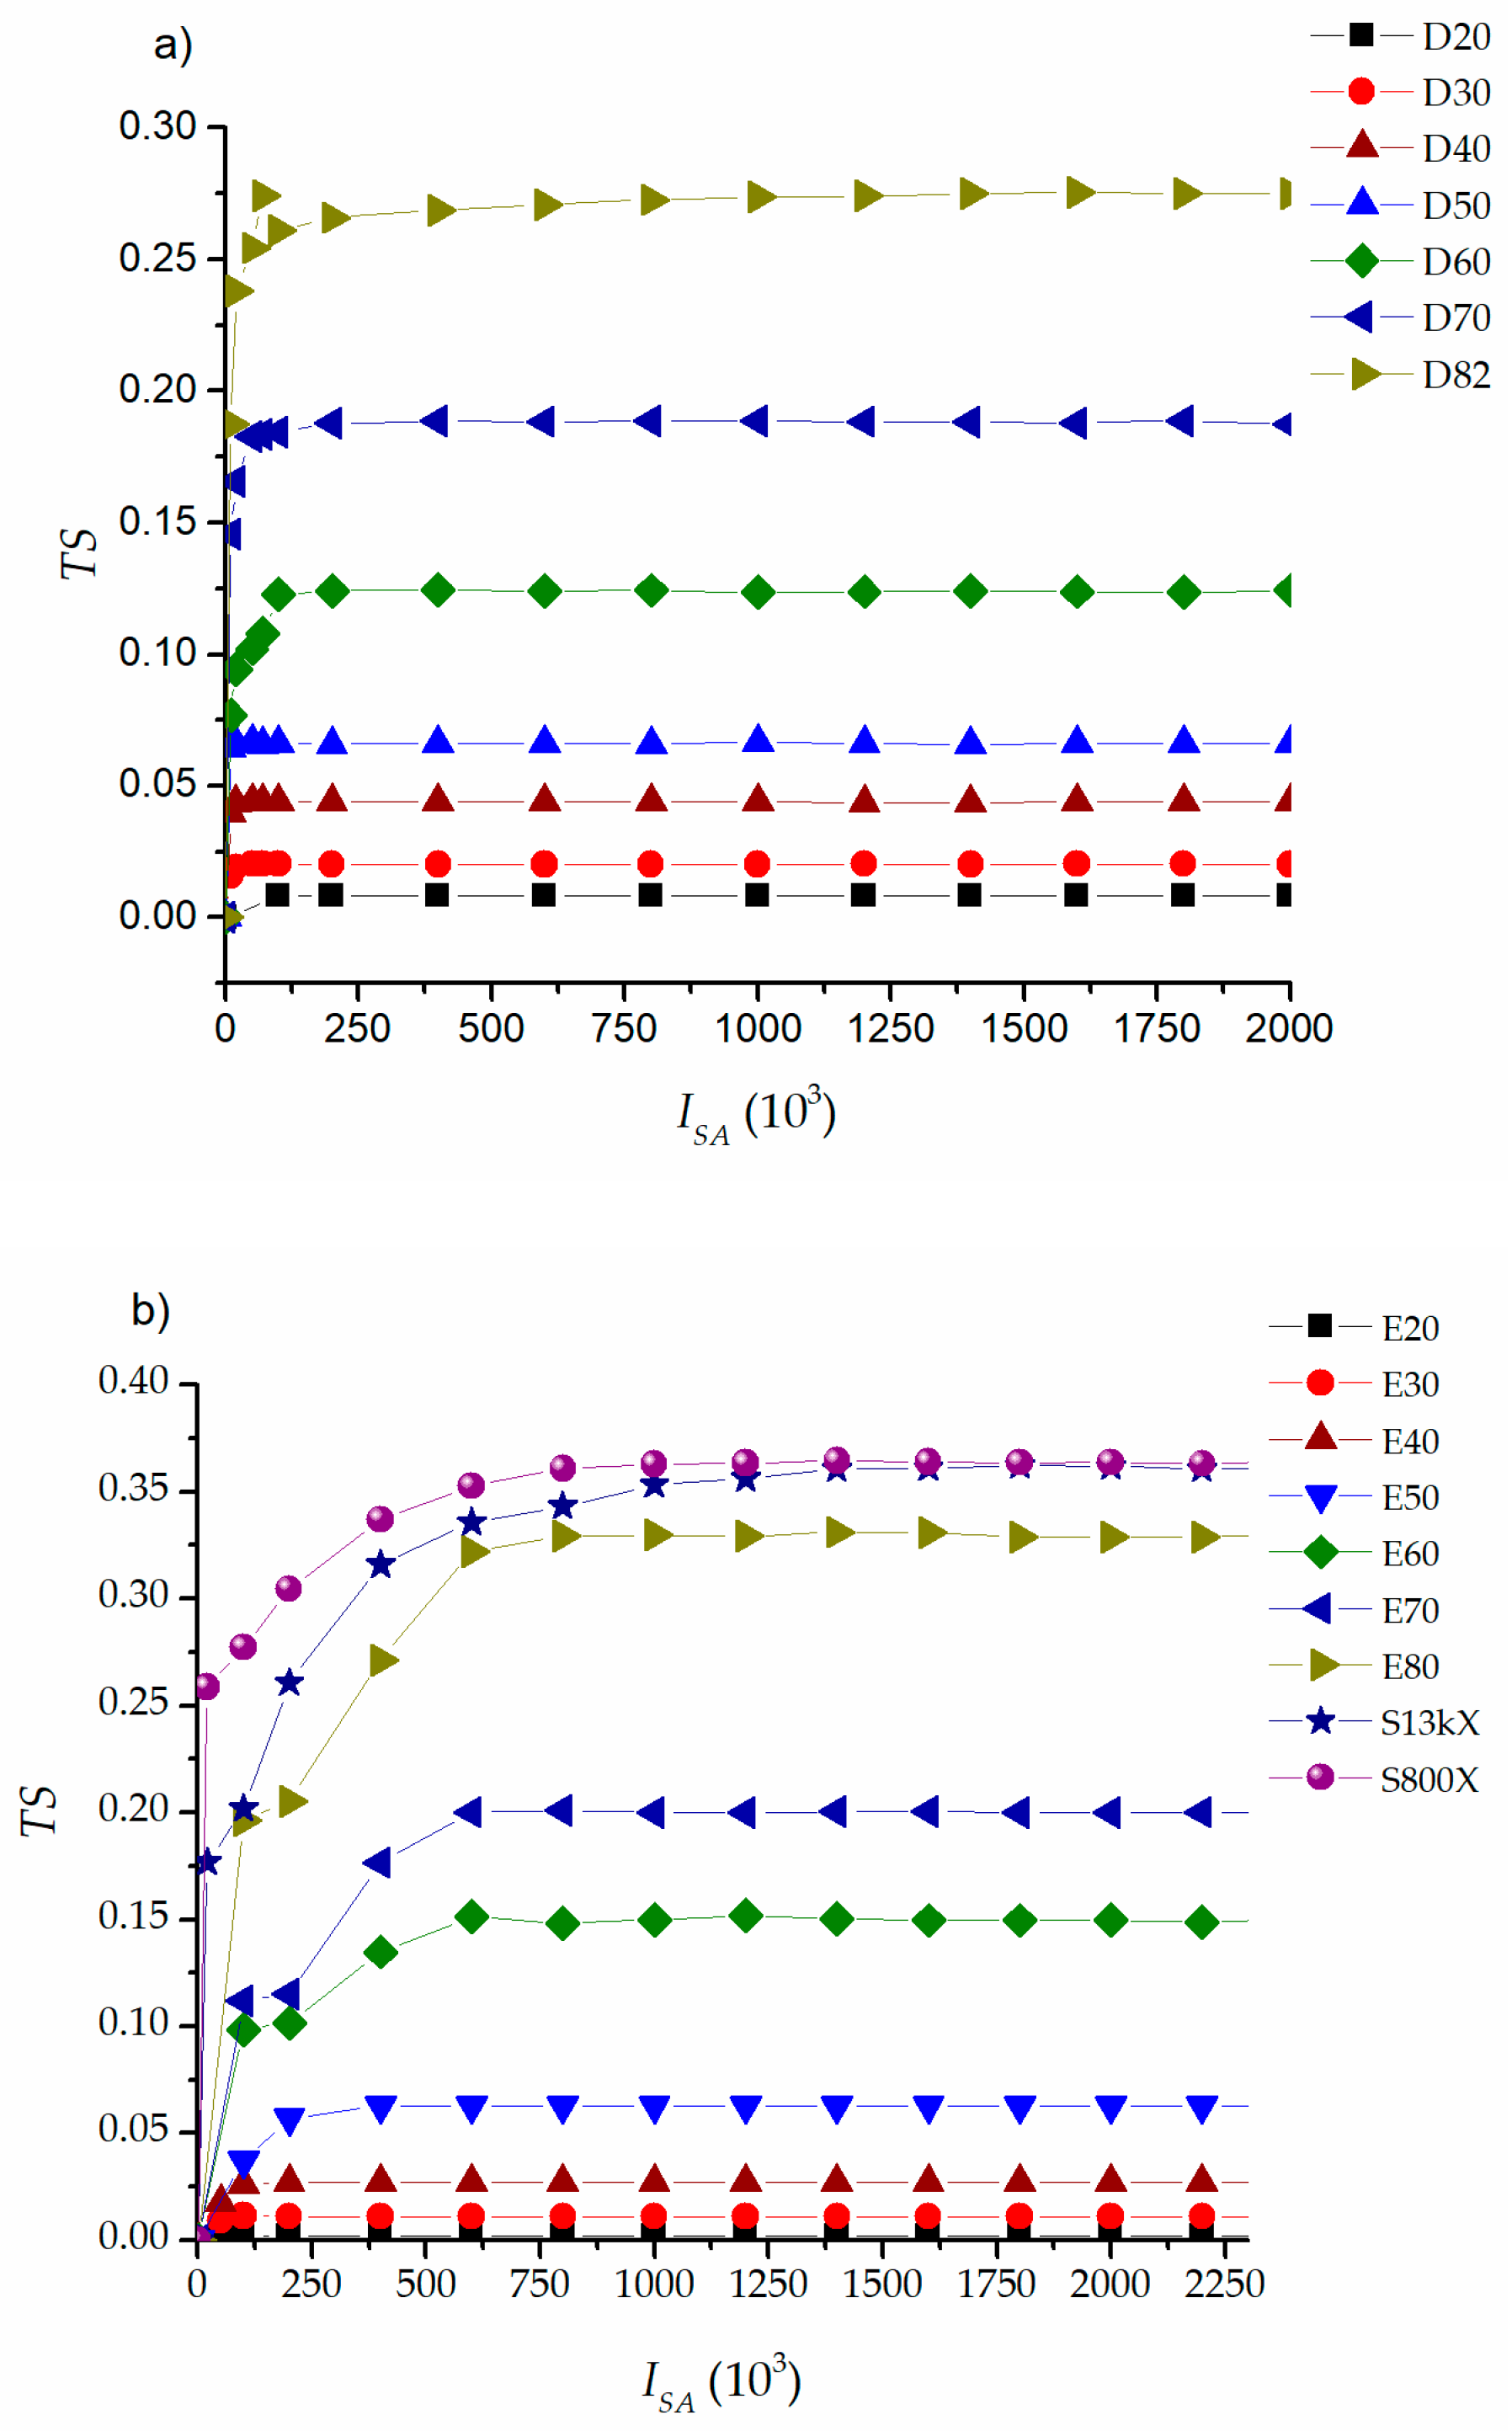
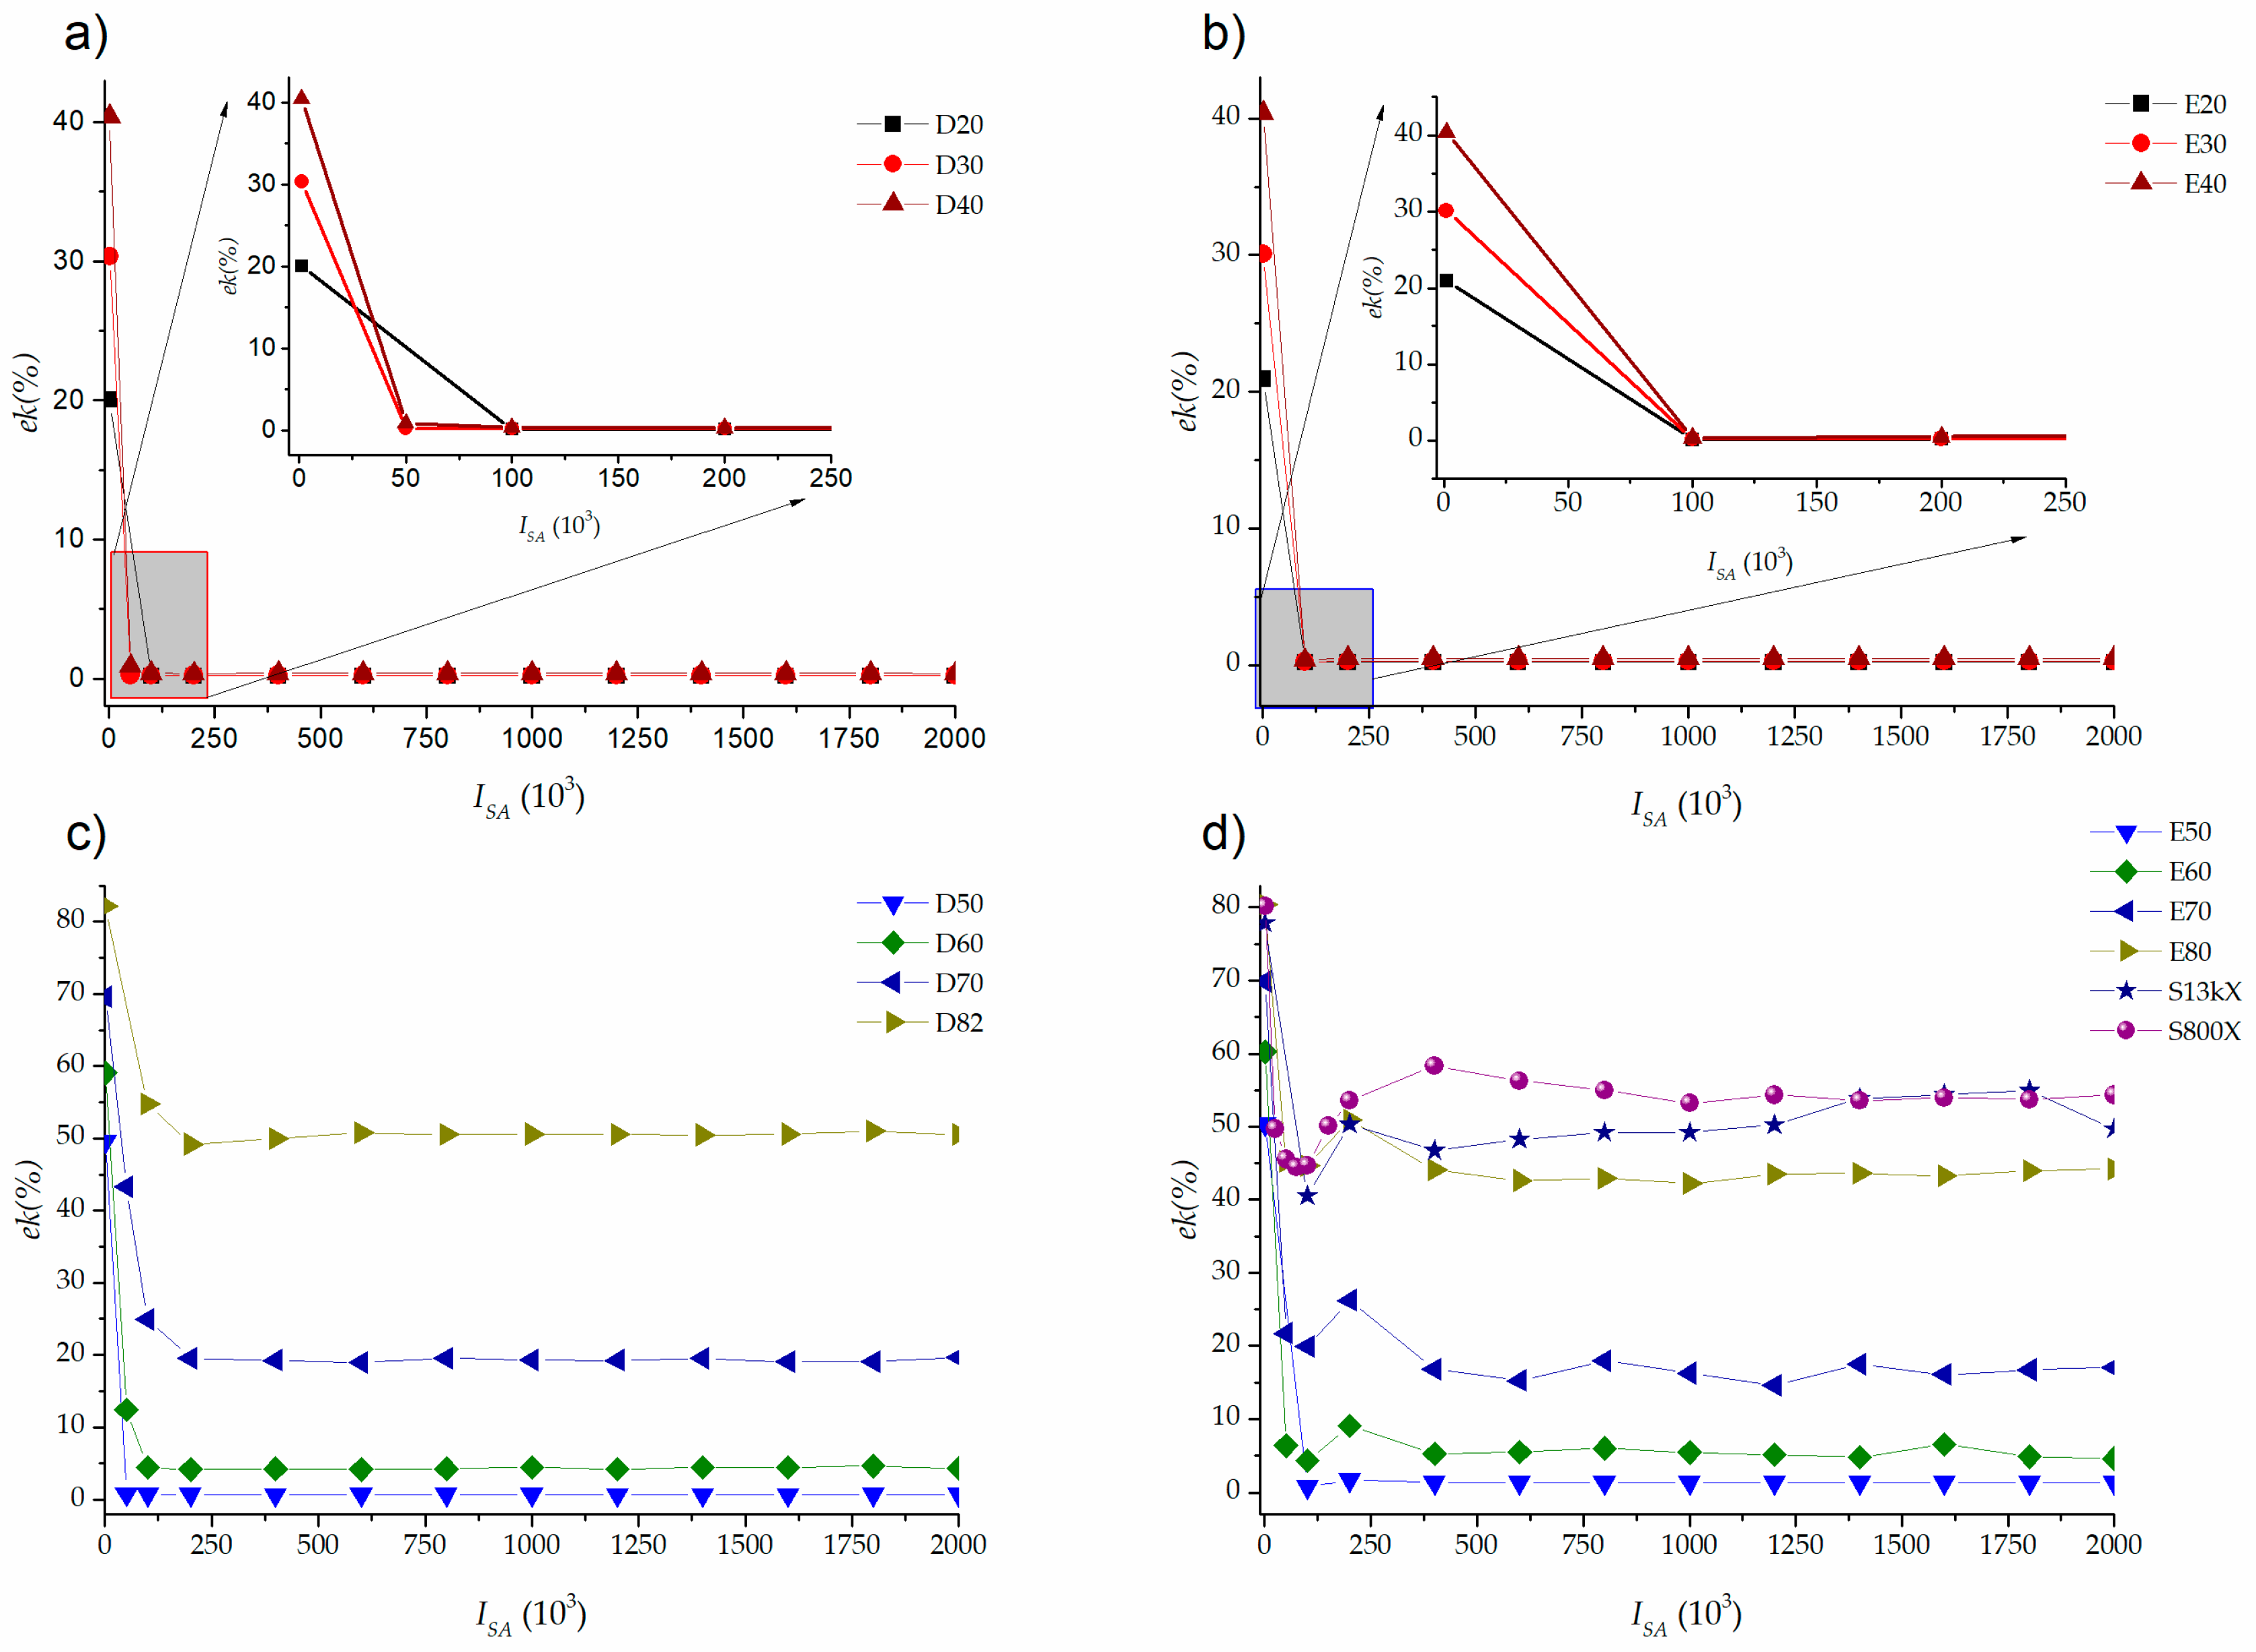
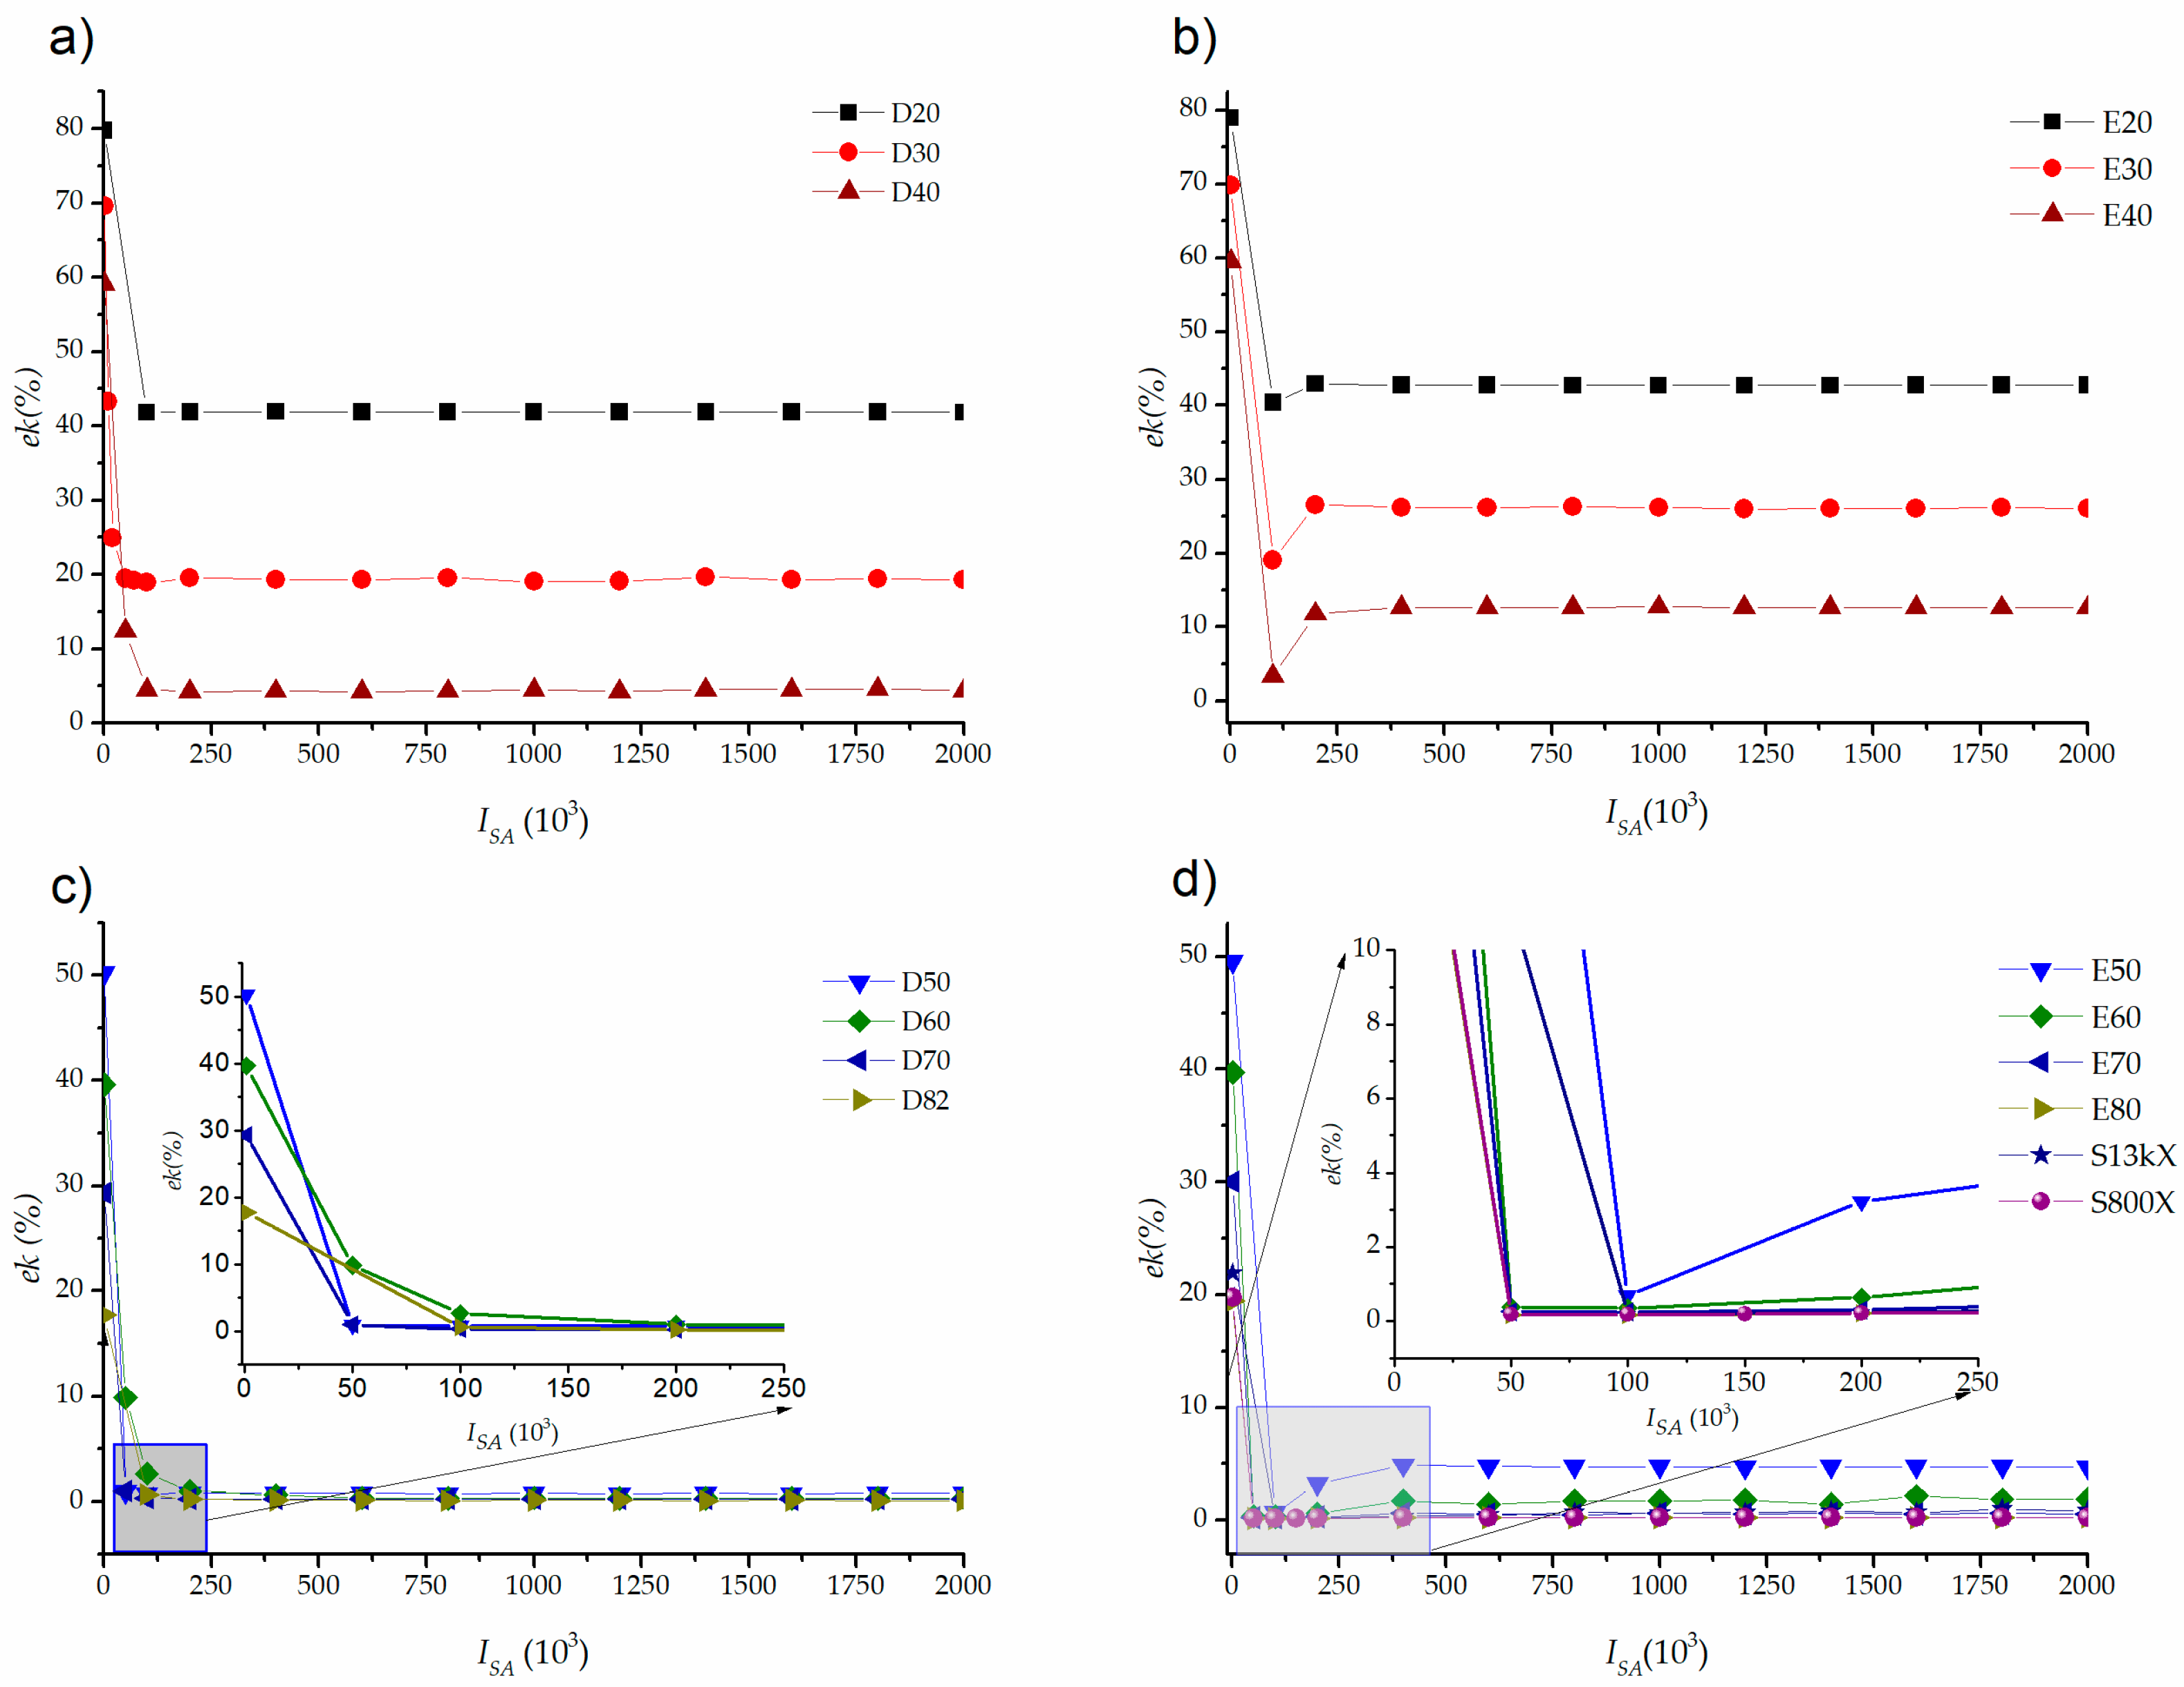
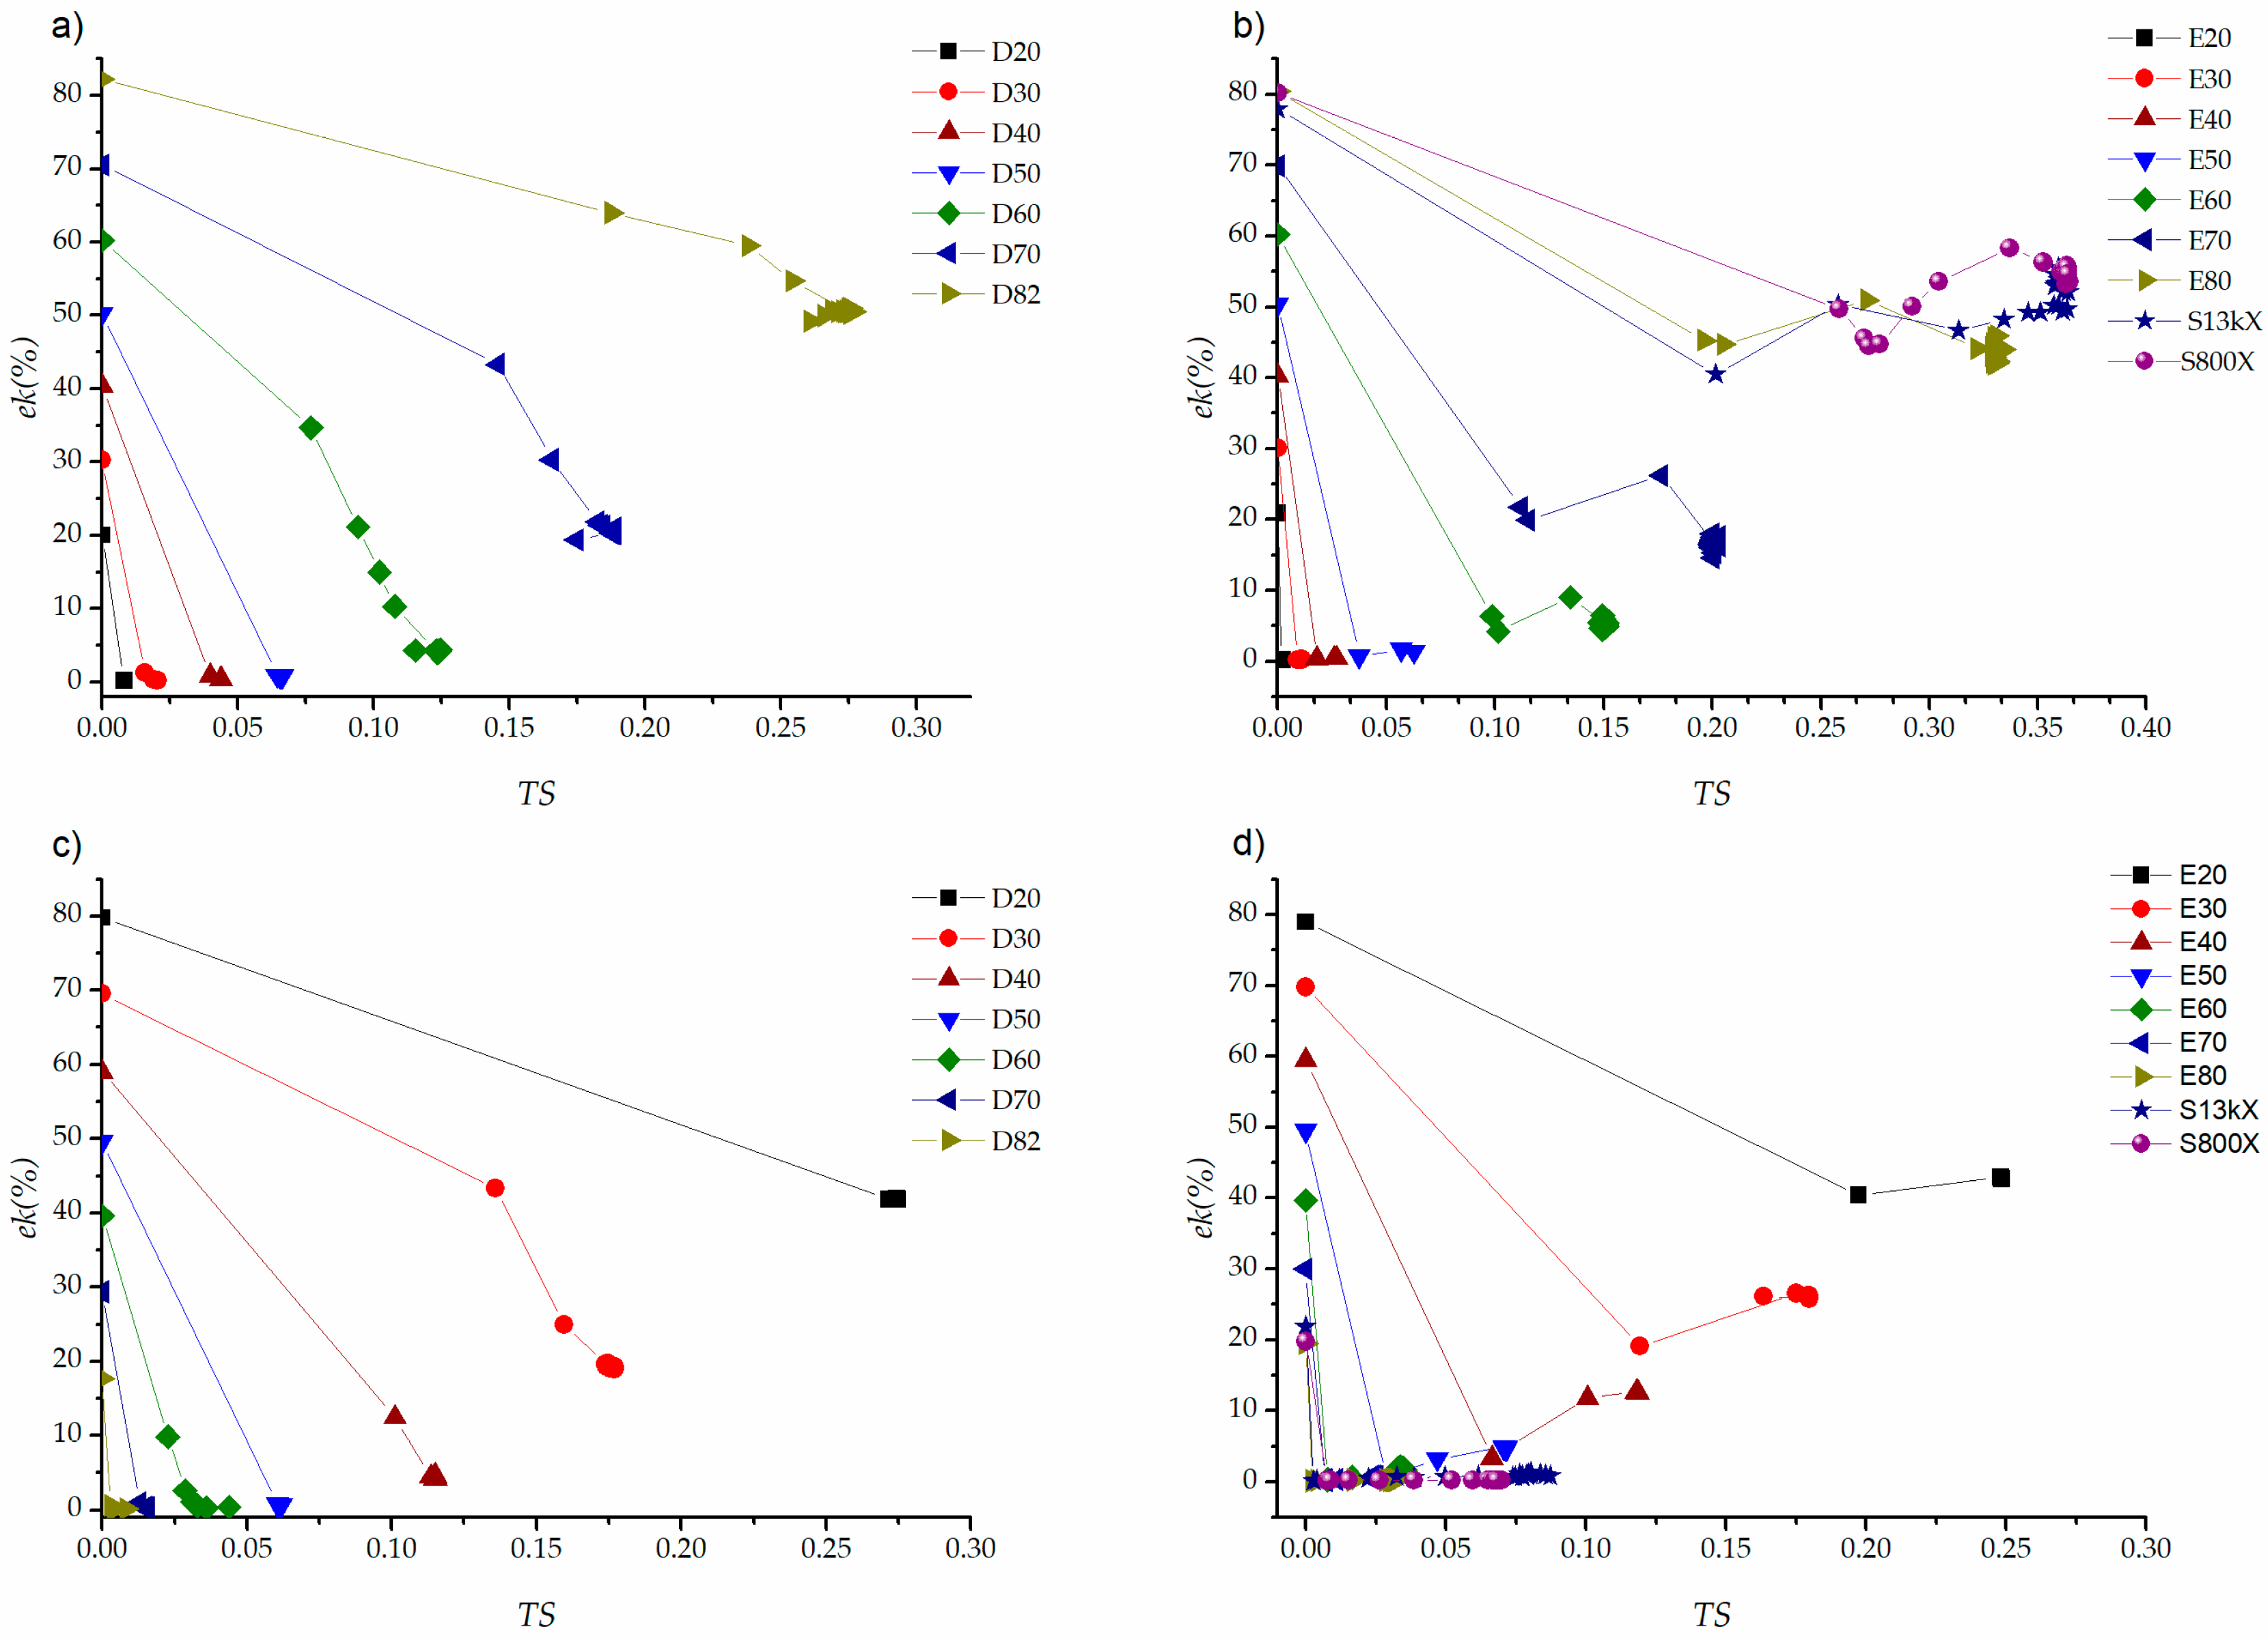
3.2. Effective Transport Coefficient

FVM is applied to determine ek (%) (Equation (2)) [17]. Five repetitions were performed for each I S A moment in each microstructure, for a total of 1200 reconstructions. Figure 8a,c show the average values of ek (%) as a function of the iteration I S A determined in the matrix phase (J1, white color) for samples D; Figure 8b,d show the average values of ek (%) in the matrix phase of the samples S and E. The figures show the results for all the assemblies ω.
In all the studied cases, the ek (%) value, when I S A = 0 corresponds to the percentage value of the surface fraction Φ of matrix phase, which is presented in Table 1. This result validates the initial boundary condition of the SA reconstruction, where the phases are aligned vertically and unidirectionally, as shown in Figure 4. The magnitude of ek (%) in the samples “D”, shows a fast decline, until reaching a constant value during all the SA reconstruction. This behavior is visible in Figure 8a,c, which show that ek (%) is constant after I S A = 250 × 103, with a standard deviation of 0.02% for sample D20, and obtaining a standard deviation of 0.45% for sample D70. These two values correspond to the minimum, and maximum standard deviations, respectively, for samples D. Figure 8b,d show that a higher number of I S A iterations are required for ek (%) to stabilize in samples S and E, which is related to Figure 6; Figure 7, due to the agitation process and then the formation of the agglomerates.
Figure 9 shows the results for the dispersion phase; Figure 9a,c, present the results for systems D; Figure 9b,d present the results for systems E and S. Similar behavior is observed in the matrix phase because ek (%) stabilizes at less than 250 I S A iterations for systems D. In the case of systems E and S, they present a rapid drop in iteration 125 where ek (%) reaches the minimum value in the reconstruction process. The value of ek (%) increases and stabilizes in all cases. The minimum value of ek (%) is attributed to the dispersion of the pixels in a diameter of one; the increase indicates the formation of agglomerates.
Figure 10 shows the values of ek (%) as a function of the TS for all samples. Figure 10a,b show the results determined for the matrix phase and Figure 10c,d show the results determined for the dispersion phase. This figure presents the average values of all the realizations ω for all studied systems; the entropy corresponds to the study phase.
The surface fraction influences, in a meaningful manner, the magnitude of ek (%) but maintaining a tendency as a function of the microstructural configuration. In all graphs, comparing the first and second evaluated point, which corresponds to I S A = 0 and I S A = 1 × 10³ in the SA process, we can see that the TS and ek (%) magnitude change drastically. These tendencies are related to Figure 8; Figure 9. Figure 10a,c show the results of the systems D, where ek (%) shows a quick semi linear drop and agglomerates at maximum entropy. Quantitatively, it can be proved that ek (%) has the same tendency and magnitude for similar surface fractions. For example, for the maximum TS of the sample D30 and D70 ek = 20.36 ± 0.8%, and in D40 and D60, ek = 4.18 ± 0.14%. Figure 10b,d show the tendencies of ek for the samples with agglomerates of diameter greater than one. In this microstructural configuration, ek at the beginning has a linear tendency; then, in a moment of agitation when the entropy is low, a semi-loop is observed and attributed to the formation of agglomerates that are features of the reconstructed system. In the trends, it is observed that in the systems with a surface fraction smaller than 50%, ek has a magnitude close to zero. For example, ek = 0.24% @ E20; ek = 0.73% @ S13kX and ek = 0.26% @ S800X.
Figure 11 shows the ek (%) results at the end of the SA reconstruction process, as a function of the surface fraction. D(J1) and D(J0) represent samples D of the matrix and dispersion phase, respectively. E(J1) for the matrix phase and E(J0) represents the dispersion phase.
Figure 11 shows the behavior of the two phases (matrix and dispersed) of systems D and E about the surface fraction of the matrix phase. When comparing systems D (system with diameter D = 1 pixel) and E (system with polydispersed diameter), we can observe a similar general trend, but there are significant differences: (1) for porosities higher than Φ = 40%, the ek (%) value of systems D and E increase in a similar way. This response is expected due to the increase in the surface fraction of the matrix phase. (2) For Φ = 70% and Φ = 80% the ek value of system D is higher than system E in the matrix phase. This observation indicates that particulate systems, under these conditions of surface fractions, have better transport than "agglomerated" systems. For example, ek = 20.39% @ Φ = 70% of the matrix phase for system D, compared to the ek of the same phase in system E with a value of ek = 15.87% @ Φ = 70%, and ek = 50.81% @ Φ = 80% for system D, compared to ek = 45.69% @ Φ = 80%. When comparing the values ek(%) based on the surface fraction, an increasing trend is obtained, as the surface fraction of the matrix phase increments, the value of ek(%) gradually increases, while the value of ek(%) for the dispersed phase decreases proportionally. For example, the D82 system has a dispersed ek of 0.11%, while for the matrix phase, it has an ek of 50.81%. This is contrary to sample D20 where the dispersed phase is the dominant one and presents ek values of 41.83% dispersed and ek values of 0.18% for the matrix. The same effect occurs in samples E, S13kX and S800X.

4. Conclusions

A technique that allows the analysis of ek (%) is proposed, as a function of the entropy throughout the reconstruction process by SA in vertically aligned composites that are agitated until reaching a target function. The SA method allows simulating the evolution of the agitation of the aligned system until a dispersed system of particles with a diameter of one or likewise agglomerates of diameters greater than one is reached. The process can be carried out inversely.
The entropy affects the ETC; as the entropy increases, the ETC decreases until it stabilizes at maximum entropy. In the case of "D" systems, ek (%) decreases in a semi linear manner until the maximum entropy. In the case of samples with target systems and agglomerates of particles with a diameter greater than one (E, S13kX and S800X systems), the coefficient first decreases linearly and then forms a semi-cycle that is attributed to the formation of agglomerates to eventually stabilize at the maximum TS.
This tool would allow the design of better microstructures of any RHM because it is possible to know which point of the agitation presents the highest percentage of conduction efficiency.

Author Contributions

C.P., R.B. and B.E. contributed to the design and implementation of the research. A.R. reviews the entropy and reconstruction theory and implementation. G.O. and M.R.-G. verified and tested the numerical algorithm and contributed to the interpretation of the results. All authors have read and agreed to the published version of the manuscript.

Funding

This research was partially funded by CONACYT under the grant SENER 254667 (LENERSE) and the grant Problemas Nacionales 2266.

Acknowledgments

The authors would like to thank Manuel Elias (ECOSUR, Mexico) and Ysmael Verde (ITC, Mexico) for providing SEM images. A. Rodriguez, M. Ruiz-Gómez and B. Escobar would like to thank the CATEDRAS CONACYT program. R. Barbosa would like to thank Quintana Roo University and CONACYT for sabbatical-leave funding.

Conflicts of Interest

The authors declare that there is no conflict of interest regarding the publication of this paper.

References

  1. Lin, M.C.; Lou, C.W.; Lin, J.Y.; Lin, T.A.; Lin, J.H. Mechanical property evaluations of flexible laminated composites reinforced by high-performance Kevlar filaments: Tensile strength, peel load, and static puncture resistance. Compos. Part B Eng. 2019, 166, 139–147. [Google Scholar] [CrossRef]
  2. Huang, Z.H.; Zhou, Y.J.; Nguyen, T.T. Study of nickel matrix composite coatings deposited from electroless plating bath loaded with TiB2, ZrB2 and TiC particles for improved wear and corrosion resistance. Surf. Coat. Technol. 2019, 364, 323–329. [Google Scholar] [CrossRef]
  3. Han, B.; Chen, H.; Hu, T.; Ye, H.; Xu, L. High electrical conductivity in polydimethylsiloxane composite with tailored graphene foam architecture. J. Mol. Struct. 2020, 1203, 127416. [Google Scholar] [CrossRef]
  4. Blassiau, S.; Thionnet, A.; Bunsell, A.R. Micromechanisms of load transfer in a unidirectional carbon fibre-reinforced epoxy composite due to fibre failures: Part 3. Multiscale reconstruction of composite behaviour. Compos. Struct. 2008, 83, 312–323. [Google Scholar] [CrossRef]
  5. Wu, X.; Tang, L.; Zheng, S.; Huang, Y.; Yang, J.; Liu, Z.; Yang, W.; Yang, M. Hierarchical unidirectional graphene aerogel/polyaniline composite for high performance supercapacitors. J. Power Sources 2018, 397, 189–195. [Google Scholar] [CrossRef]
  6. Mao, N.; Chen, W.; Meng, J.; Li, Y.; Zhang, K.; Qin, X.; Zhang, H.; Zhang, C.; Qiu, Y.; Wang, S. Enhanced electrochemical properties of hierarchically sheath-core aligned carbon nanofibers coated carbon fiber yarn electrode-based supercapacitor via polyaniline nanowire array modification. J. Power Sources 2018, 399, 406–413. [Google Scholar] [CrossRef]
  7. Wang, X.; Zhai, H.; Qie, B.; Cheng, Q.; Li, A.; Borovilas, J.; Xu, B.; Shi, C.; Jin, T.; Liao, X.; et al. Rechargeable solid-state lithium metal batteries with vertically aligned ceramic nanoparticle/polymer composite electrolyte. Nano Energy 2019, 60, 205–212. [Google Scholar] [CrossRef]
  8. Liu, W.; Lee, S.W.; Lin, D.; Shi, F.; Wang, S.; Sendek, A.D.; Cui, Y. Enhancing ionic conductivity in composite polymer electrolytes with well-aligned ceramic nanowires. Nat. Energy 2017, 2, 17035. [Google Scholar] [CrossRef]
  9. Shin, S.; Liu, J.; Akbar, A.; Um, S. Nanoscale transport characteristics and catalyst utilization of vertically aligned carbon nanotube catalyst layers for fuel cell applications: Comprehensive stochastic modeling of composite morphological structures. J. Catal. 2019, 377, 465–479. [Google Scholar] [CrossRef]
  10. Mench, M.M. Fuel Cell Engines; John Wiley & Sons: Hoboken, NJ, USA, 2008; ISBN 0471689580. [Google Scholar]
  11. O’hayre, R.; Cha, S.-W.; Colella, W.; Prinz, F.B. Fuel Cell Fundamentals; John Wiley & Sons: Hoboken, NJ, USA, 2016; ISBN 1119113806. [Google Scholar]
  12. Chhowalla, M.; Teo, K.B.K.; Ducati, C.; Rupesinghe, N.L.; Amaratunga, G.A.J.; Ferrari, A.C.; Roy, D.; Robertson, J.; Milne, W.I. Growth process conditions of vertically aligned carbon nanotubes using plasma enhanced chemical vapor deposition. J. Appl. Phys. 2001, 90, 5308–5317. [Google Scholar] [CrossRef]
  13. Jakubinek, M.B.; White, M.A.; Li, G.; Jayasinghe, C.; Cho, W.; Schulz, M.J.; Shanov, V. Thermal and electrical conductivity of tall, vertically aligned carbon nanotube arrays. Carbon N. Y. 2010, 48, 3947–3952. [Google Scholar] [CrossRef]
  14. Yasuda, S.; Furuya, A.; Uchibori, Y.; Kim, J.; Murakoshi, K. Iron–nitrogen-doped vertically aligned carbon nanotube electrocatalyst for the oxygen reduction reaction. Adv. Funct. Mater. 2016, 26, 738–744. [Google Scholar] [CrossRef]
  15. Tian, Z.Q.; Lim, S.H.; Poh, C.K.; Tang, Z.; Xia, Z.; Luo, Z.; Shen, P.K.; Chua, D.; Feng, Y.P.; Shen, Z. A highly order-structured membrane electrode assembly with vertically aligned carbon nanotubes for ultra-low Pt loading PEM fuel cells. Adv. Energy Mater. 2011, 1, 1205–1214. [Google Scholar] [CrossRef]
  16. Murata, S.; Imanishi, M.; Hasegawa, S.; Namba, R. Vertically aligned carbon nanotube electrodes for high current density operating proton exchange membrane fuel cells. J. Power Sources 2014, 253, 104–113. [Google Scholar] [CrossRef]
  17. Barbosa, R.; Andaverde, J.; Escobar, B.; Cano, U. Stochastic reconstruction and a scaling method to determine effective transport coefficients of a proton exchange membrane fuel cell catalyst layer. J. Power Sources 2011, 196, 1248–1257. [Google Scholar] [CrossRef]
  18. Torquato, S. Theory of random heterogeneous materials. In Handbook of Materials Modeling; Springer: Berlin/Heidelberg, Germany, 2005; pp. 1333–1357. [Google Scholar]
  19. Cano-Castillo, U.; Barbosa-Pool, R. Chapter 2: Reconstruction of PEM fuel cell electrodes with micro- and nano-structures. In Micro & Nano-Engineering of Fuel Cells; Xuan, J., Ed.; Taylor and Francis Group, CRC Press: London, UK, 2015. [Google Scholar]
  20. Garnett, J.C.M. Colours in metal glasses, in metallic films and in metallic solutions.—II. Proc. R. Soc. Lond. A 1905, 76, 370–373. [Google Scholar]
  21. Bruggeman, D.A.G. Berechnung verschiedener physikalischer Konstanten von heterogenen Substanzen. II. Dielektrizitätskonstanten und Leitfähigkeiten von Vielkristallen der nichtregulären Systeme. Ann. Phys. 1936, 417, 645–672. [Google Scholar] [CrossRef]
  22. Ortegon, J.; Ledesma-Alonso, R.; Barbosa, R.; Castillo, J.V.; Atoche, A.C. Material phase classification by means of Support Vector Machines. Comput. Mater. Sci. 2018, 148, 336–342. [Google Scholar] [CrossRef] [Green Version]
  23. Ledesma-Alonso, R.; Barbosa, R.; Ortegón, J. Effect of the image resolution on the statistical descriptors of heterogeneous media. Phys. Rev. E 2018, 97, 23304. [Google Scholar] [CrossRef] [Green Version]
  24. Rodriguez, A.; Barbosa, R.; Rios, A.; Ortegon, J.; Escobar, B.; Gayosso, B.; Couder, C. Effect of An Image Resolution Change on the Effective Transport Coefficient of Heterogeneous Materials. Materials 2019, 12, 3757. [Google Scholar] [CrossRef] [Green Version]
  25. Earnshaw, J.C.; Robinson, D.J. Inter-cluster scaling in two-dimensional colloidal aggregation. Phys. A Stat. Mech. Its Appl. 1995, 214, 23–51. [Google Scholar] [CrossRef]
  26. Torquato, S. Random Heterogeneous Materials: Microstructure and Macroscopic Properties; Springer Science & Business Media: Berlin/Heidelberg, Germany, 2013; Volume 16, ISBN 1475763557. [Google Scholar]
  27. Torquato, S.; Haslach, H.W., Jr. Random heterogeneous materials: Microstructure and macroscopic properties. Appl. Mech. Rev. 2002, 55, B62–B63. [Google Scholar] [CrossRef]
  28. Bochenek, B.; Pyrz, R. Reconstruction of random microstructures—A stochastic optimization problem. Comput. Mater. Sci. 2004, 31, 93–112. [Google Scholar] [CrossRef]
  29. Moncho-Jordá, A.; Martınez-López, F.; Hidalgo-Álvarez, R. Simulations of aggregation in 2D. A study of kinetics, structure and topological properties. Phys. A Stat. Mech. Its Appl. 2000, 282, 50–64. [Google Scholar] [CrossRef]
Figure 1. Methodology outline.
Crystals 10 00423 g001
Figure 2. Topological entropy (TS) for different planes: (a) microstructure with aligned bars; (b) microstructure characterized by Voronoi diagrams with TS = 0; (c) zoomed section of the characterized microstructure to observe the order of the phases; (d) randomly agitated microstructure; (e) microstructure characterized by Voronoi diagrams with a TS = 0.18; (f) zoomed section of the characterized microstructure, which shows a polygons deformation.
Crystals 10 00423 g002
Figure 3. The binarization process using support vector machines (SVM) of the SEM samples of electrodes of a polymer electrolyte fuel cell (PEFC) (S13kX and S800X). The zone cut is the selected zone that is representative of the microstructure.
Crystals 10 00423 g003
Figure 4. Representative images of the stirring process using simulated annealing (SA), TS values, and I S A moments are presented for samples D30, D70, E80, S13kX, and S800X.
Crystals 10 00423 g004
Figure 5. Correlation functions of Sj during the reconstruction process of S800X.
Crystals 10 00423 g005
Figure 6. Average error of the simulated annealing (SA) process: (a) results for samples D30 and D70; (b) results for samples S13kX and S800X.
Crystals 10 00423 g006
Figure 7. Comparison of TS for the matrix phase as a function of the moments I S A of the reconstruction; (a) TS vs. I S A for samples D and (b) TS vs. I S A for samples E and S.
Crystals 10 00423 g007
Figure 8. Average of efficiency of charge (ek)(%) for the matrix phase (j1) vs. I S A (a) systems D20–D40; (b) systems E20–E40; (c) systems D50–D82 and (d) systems E20–E80 and S.
Crystals 10 00423 g008
Figure 9. Average of ek (%) for the dispersion phase (j0) vs. I S A ; (a) systems D20–D40; (b) systems E20–40; (c) systems D50–D82 and (d) systems E50–E80 and S.
Crystals 10 00423 g009
Figure 10. Average of ek (%) as a function of the topological entropy, (a) ek (%) for the analyzed D systems in the matrix phase; (b) ek (%) for systems E and S in the matrix phase; (c) ek (%) for the systems D in the dispersion phase and (d) ek (%) for systems E and S in the dispersion phase.
Crystals 10 00423 g010
Figure 11. Effect of the superficial fraction on ek response for all systems.
Crystals 10 00423 g011
Table 1. Studied structures characteristics.
NameΦ MatrixΦ DispersionDiameterSize
D2020.1079.801300 × 300
D3030.3369.551300 × 300
D4040.2558.911300 × 300
D5050.2749.611300 × 300
D6060.2439.641300 × 300
D7070.5529.341300 × 300
D8282.1817.711300 × 300
E2020.8179.19Random350 × 350
E3030.2569.75Random350 × 350
E4040.6159.39Random350 × 350
E5050.5049.50Random350 × 350
E6060.2139.70Random350 × 350
E7069.9030.01Random350 × 350
E8080.1619.75Random350 × 350
S13kX77.8822.03SEM350 × 350
S800X80.1619.75SEM350 × 350

