
Influence of Crystal Plasticity Parameters on the Strain Hardening Behavior of Polycrystals


Abstract
:1. Introduction
2. Numerical Model
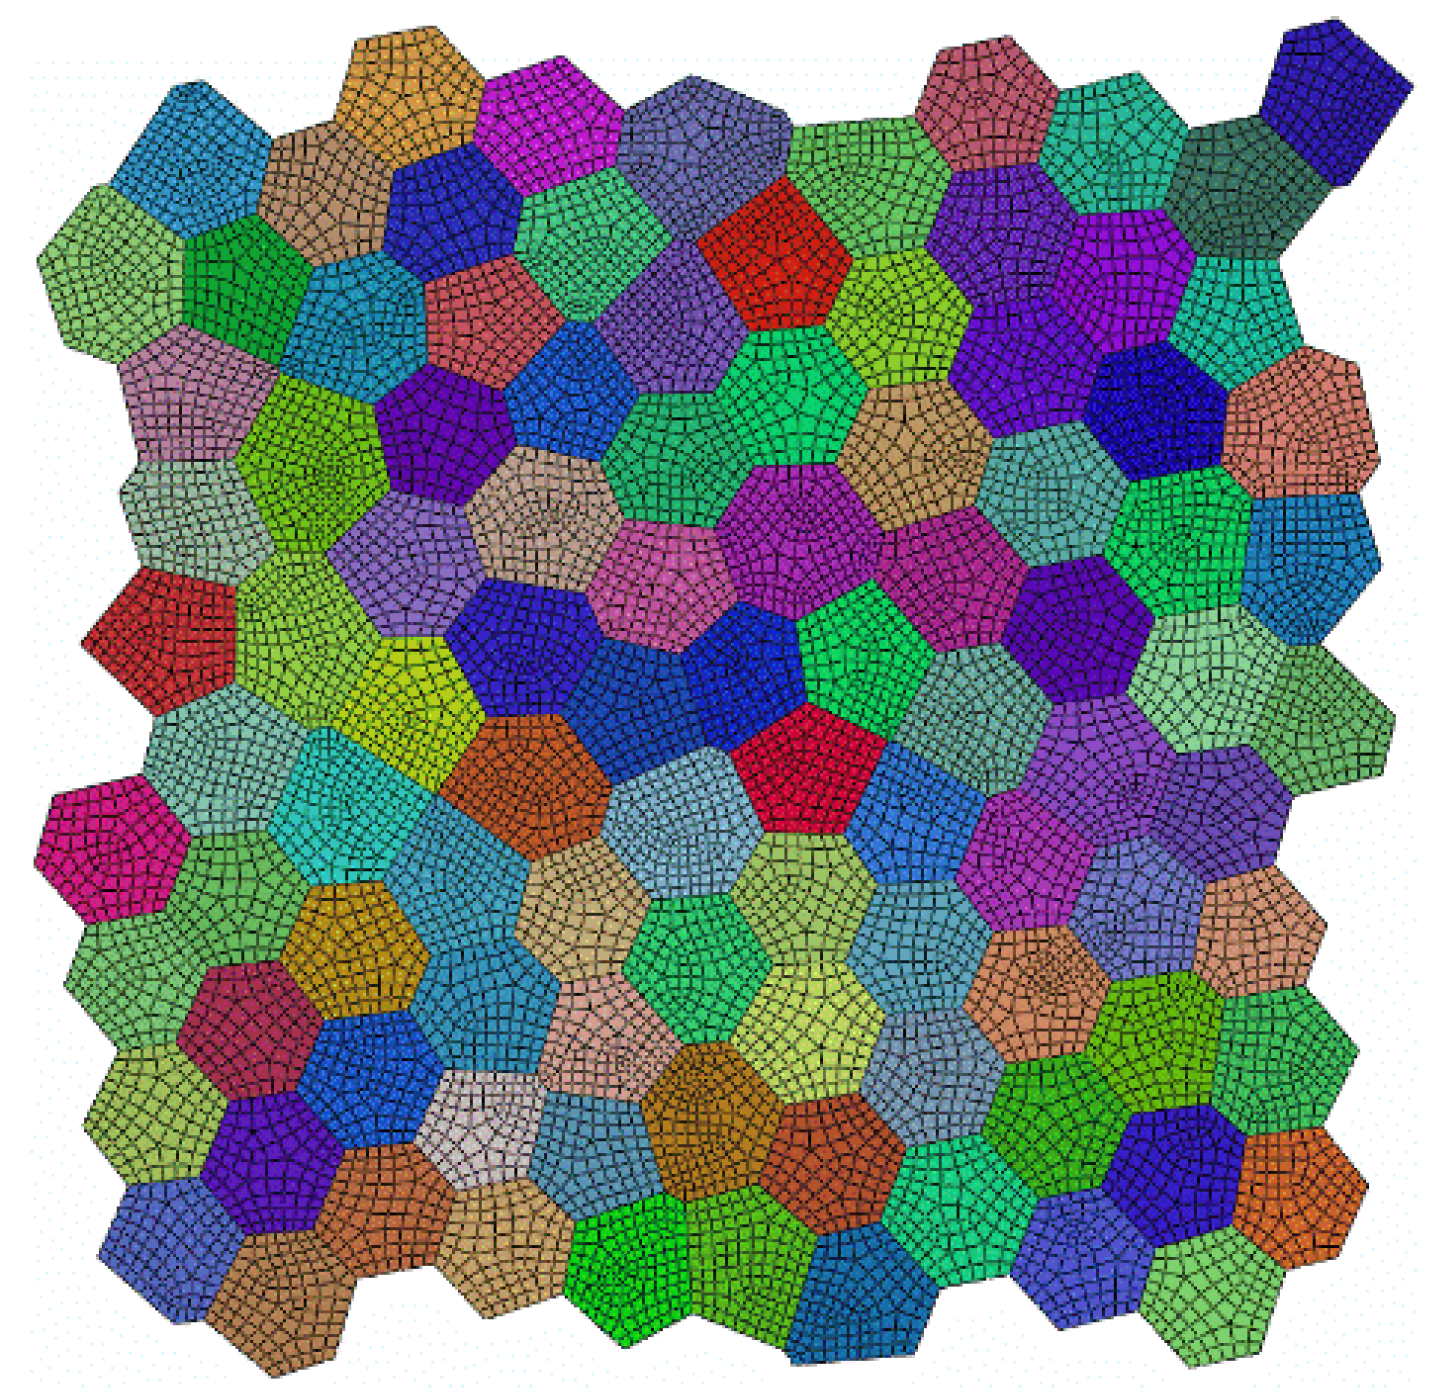
2.1. RVE Generation
2.2. Nonlocal Crystal Plasticity Model
2.3. Homogenization Technique
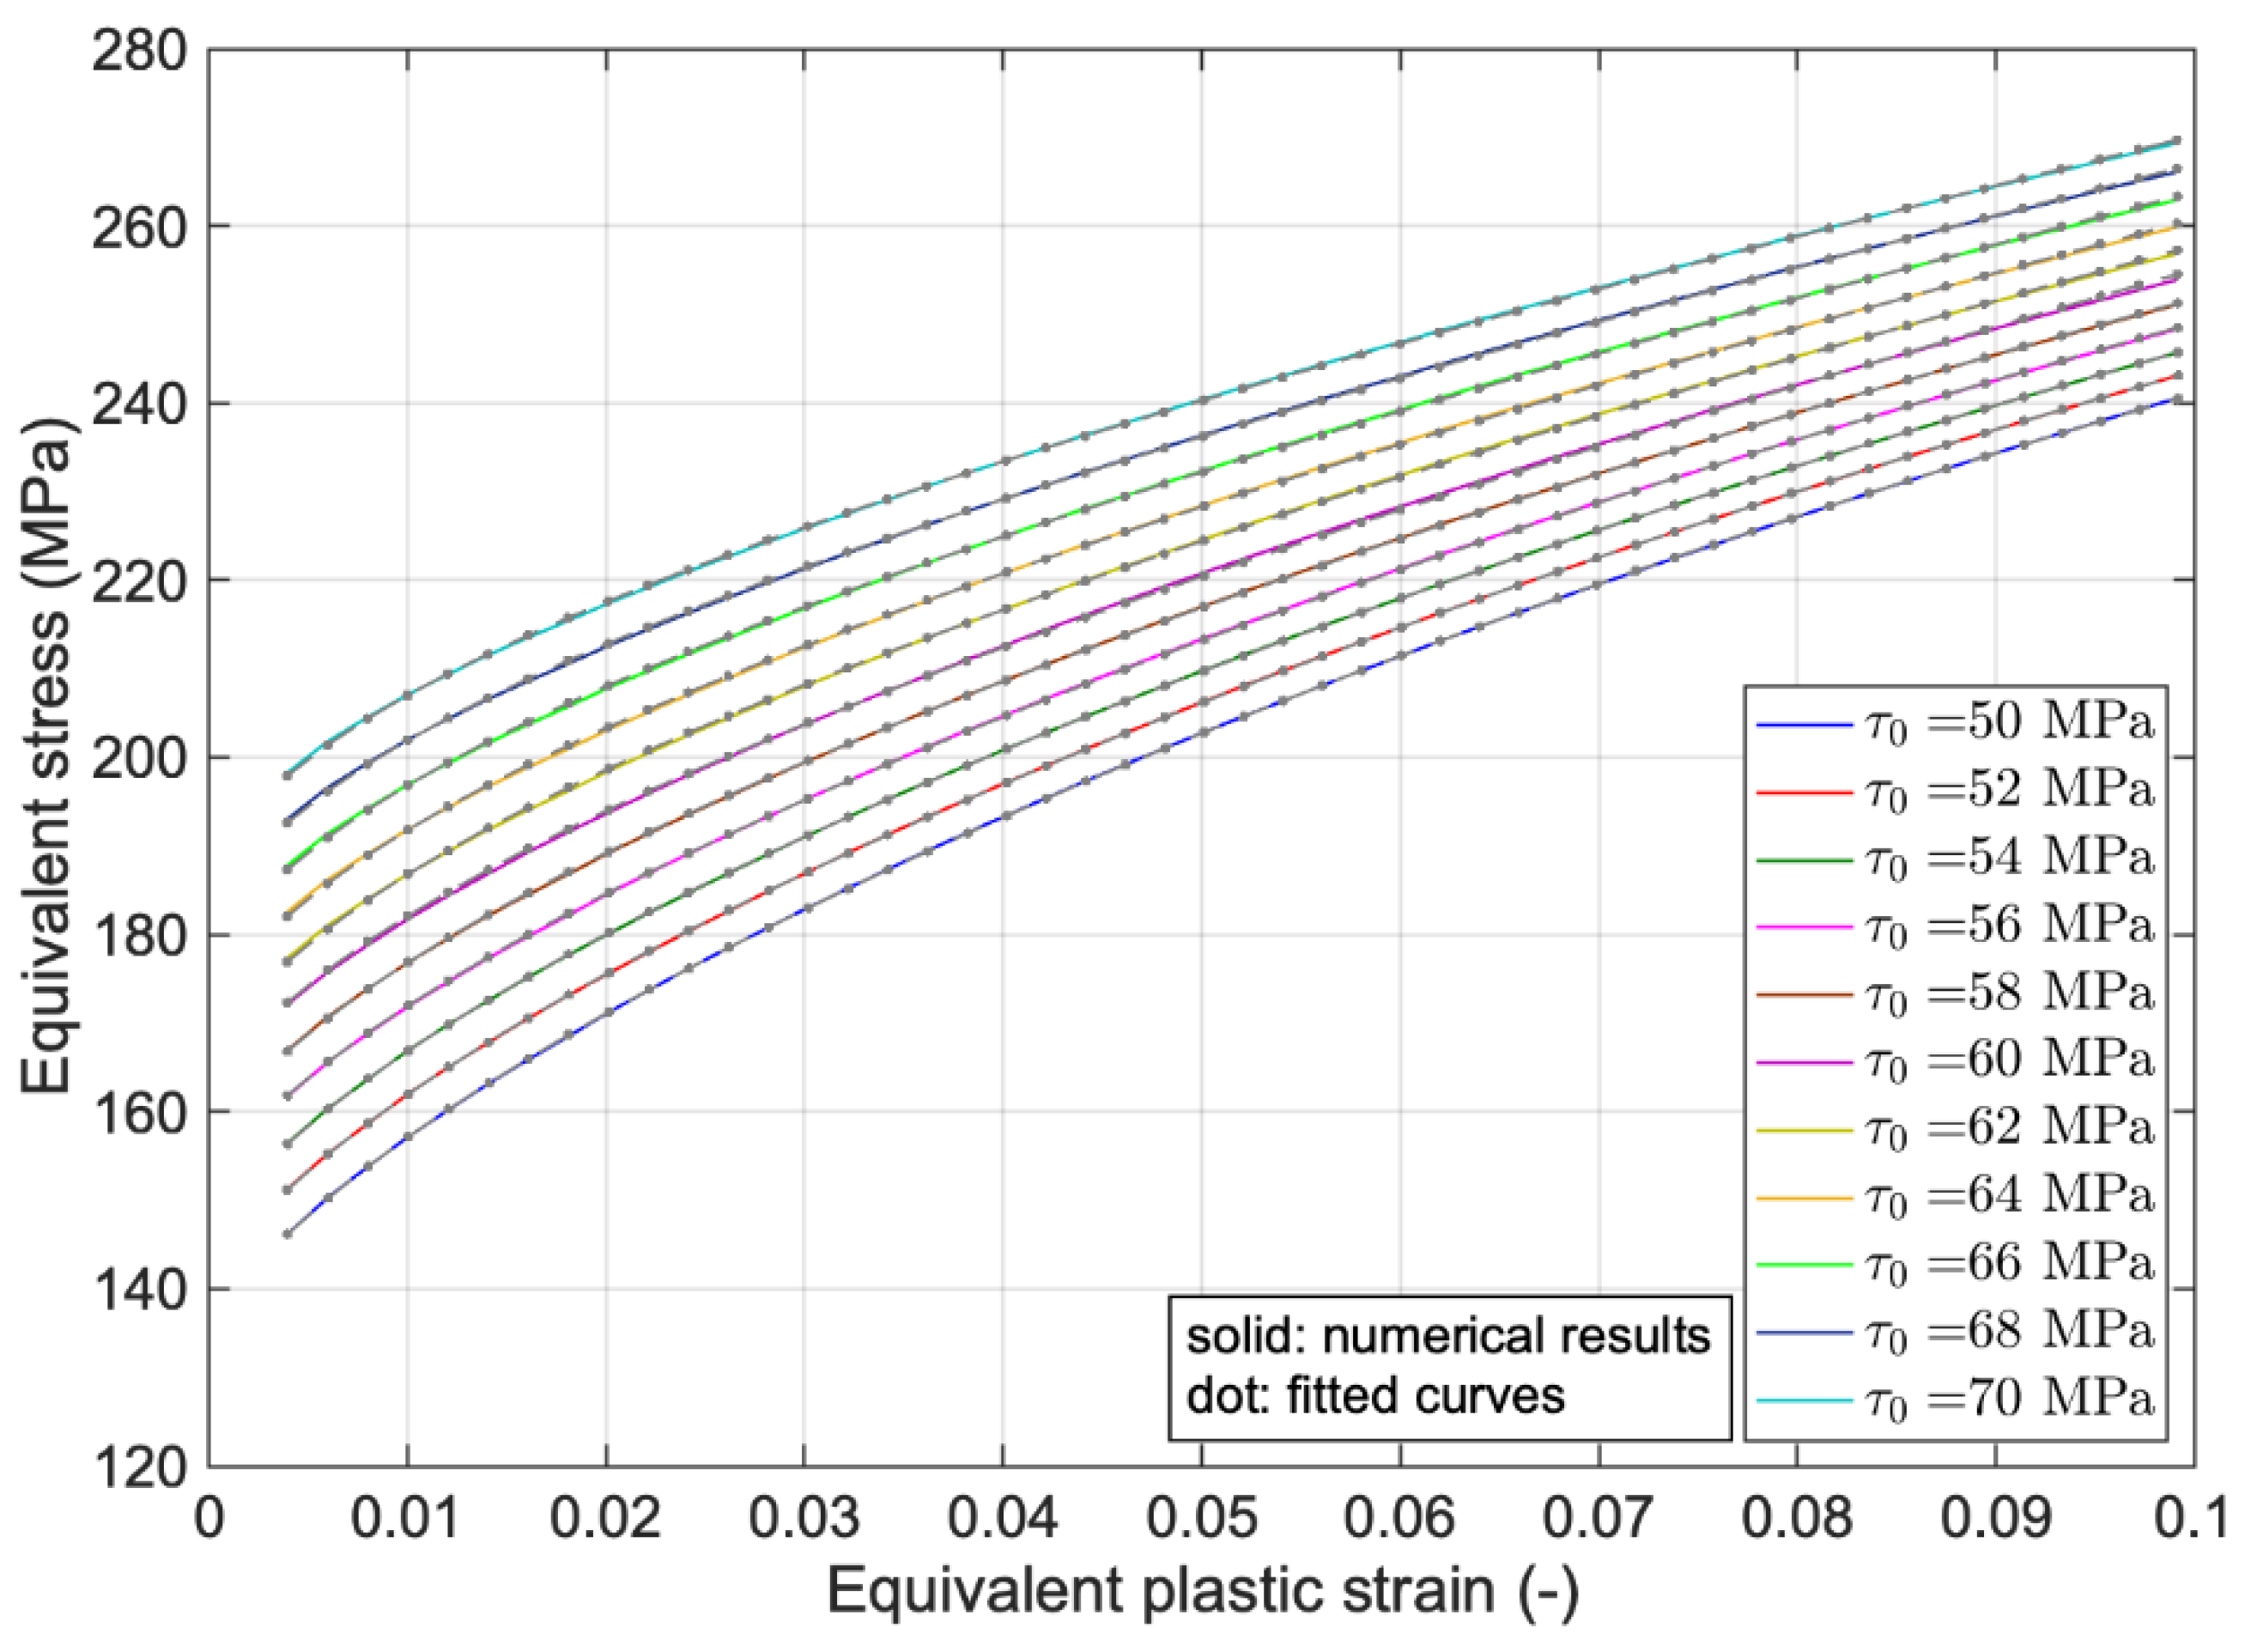
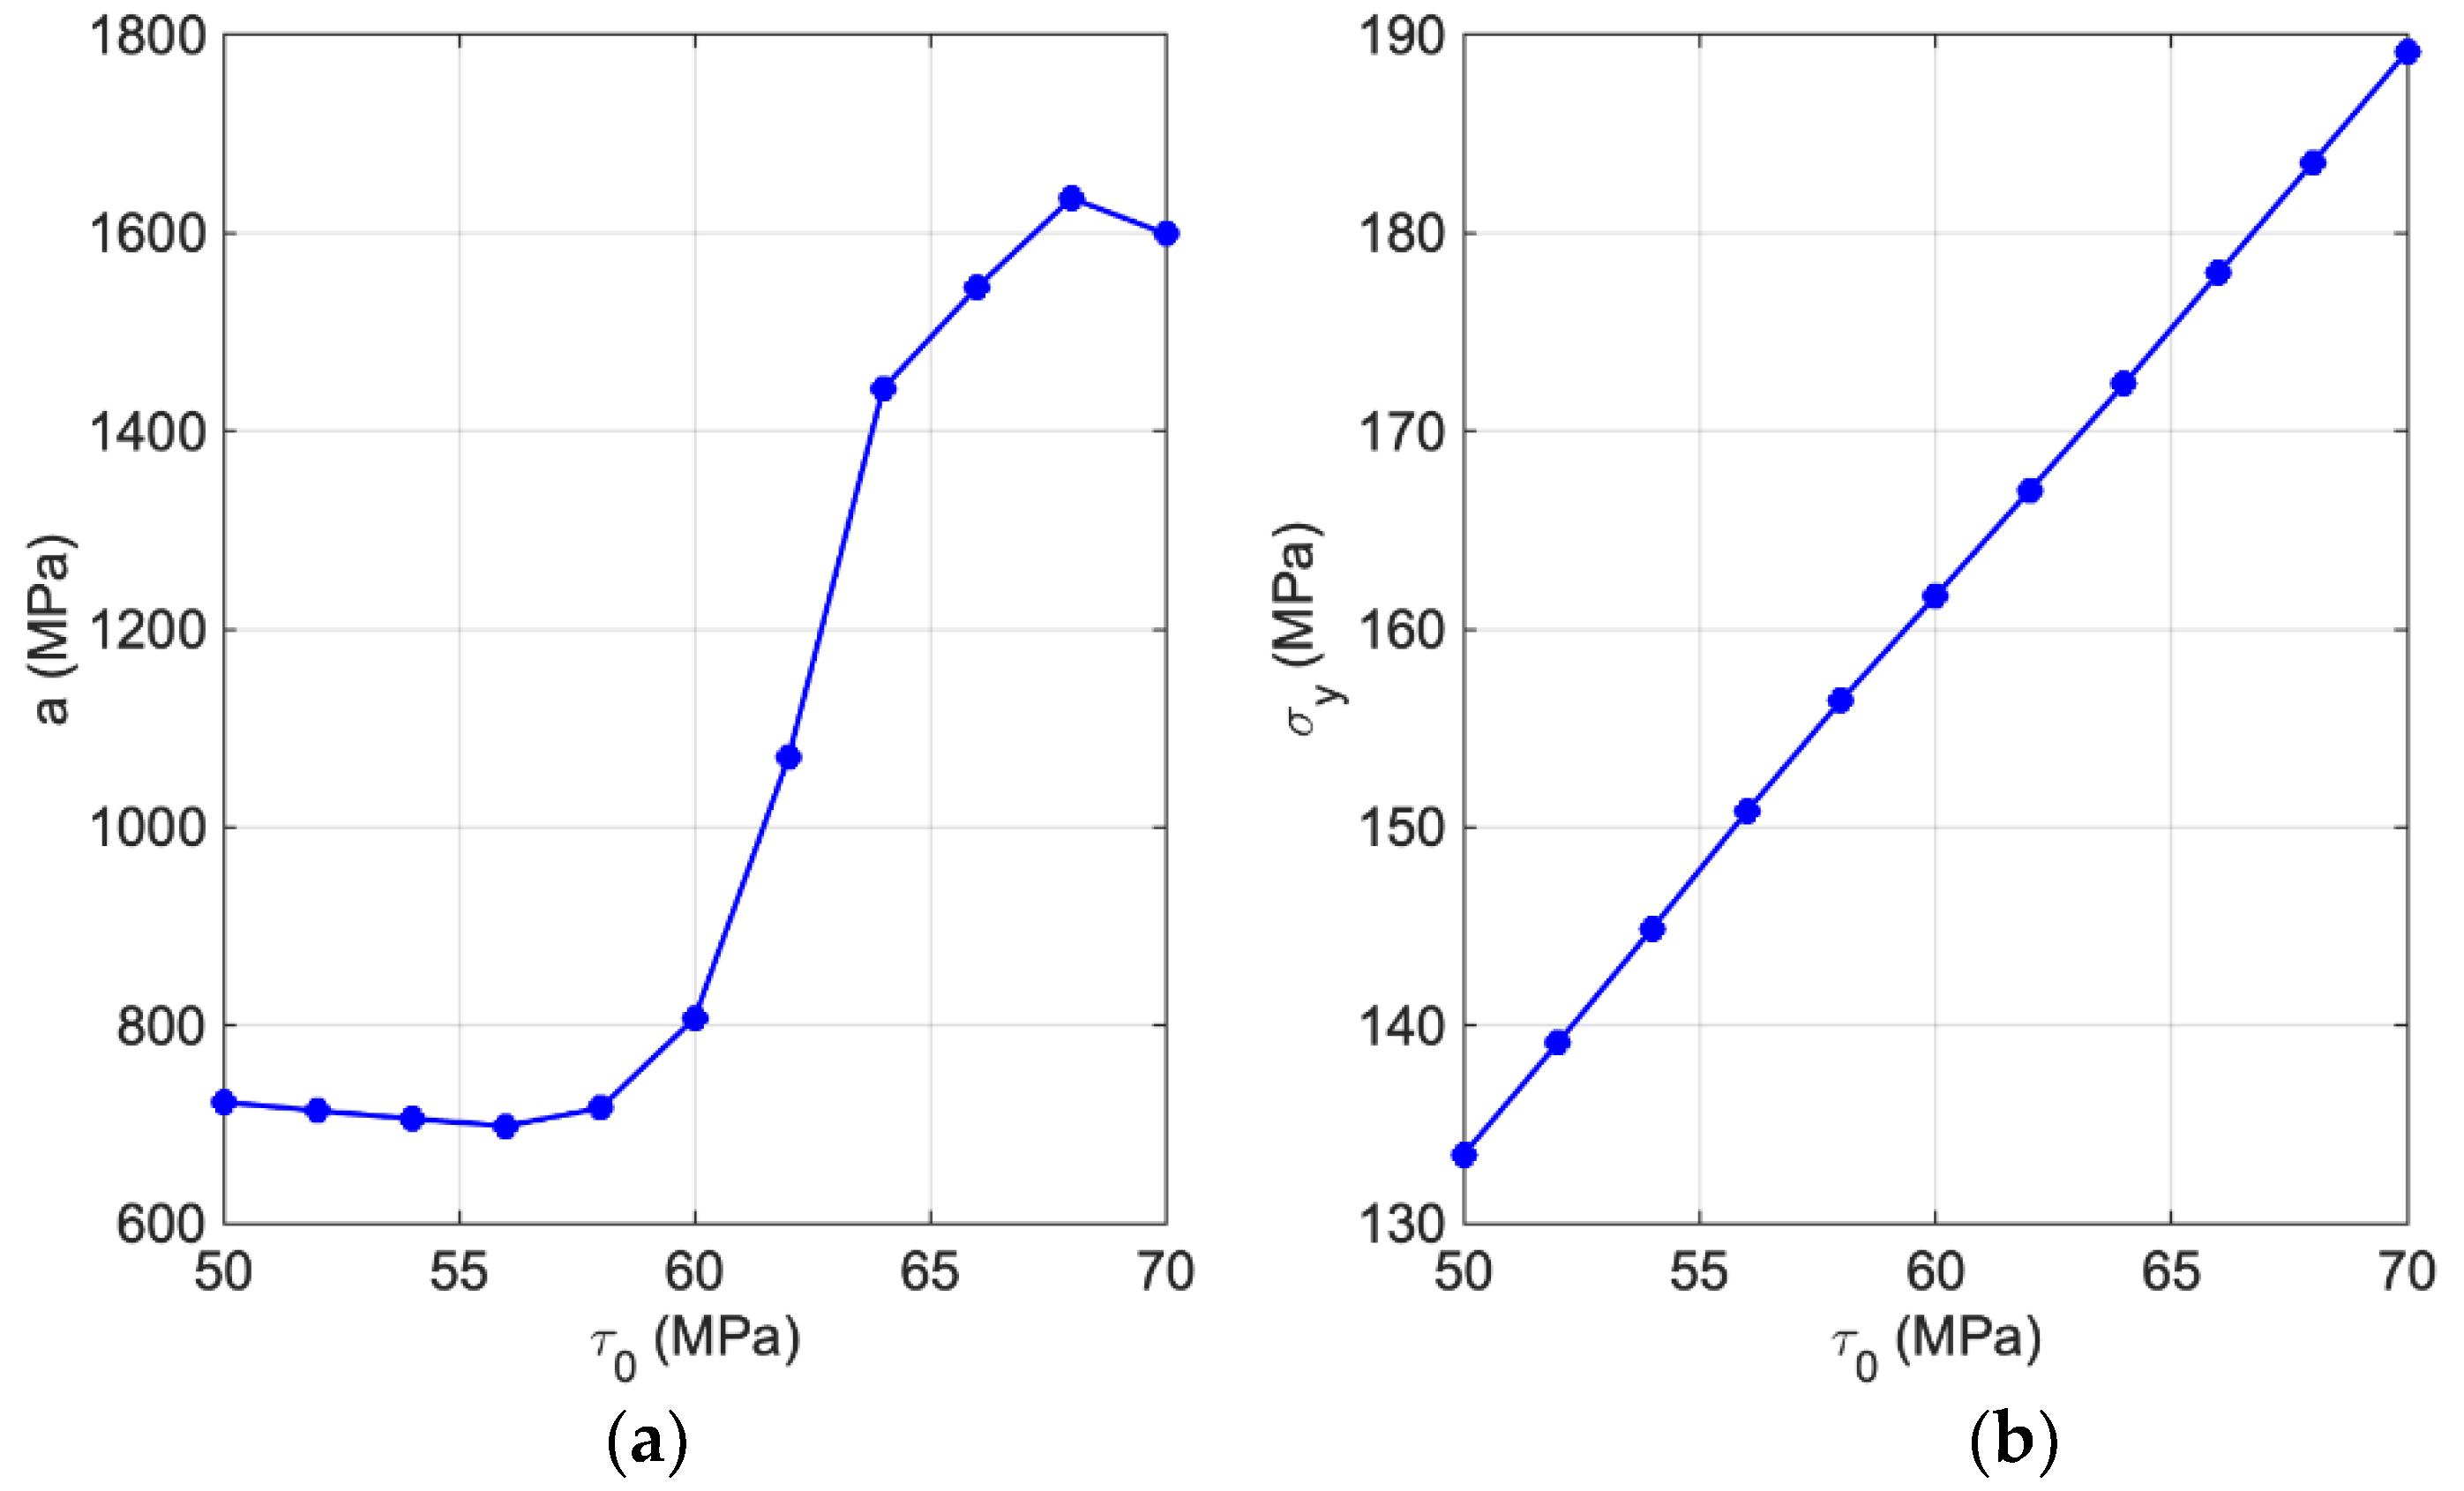
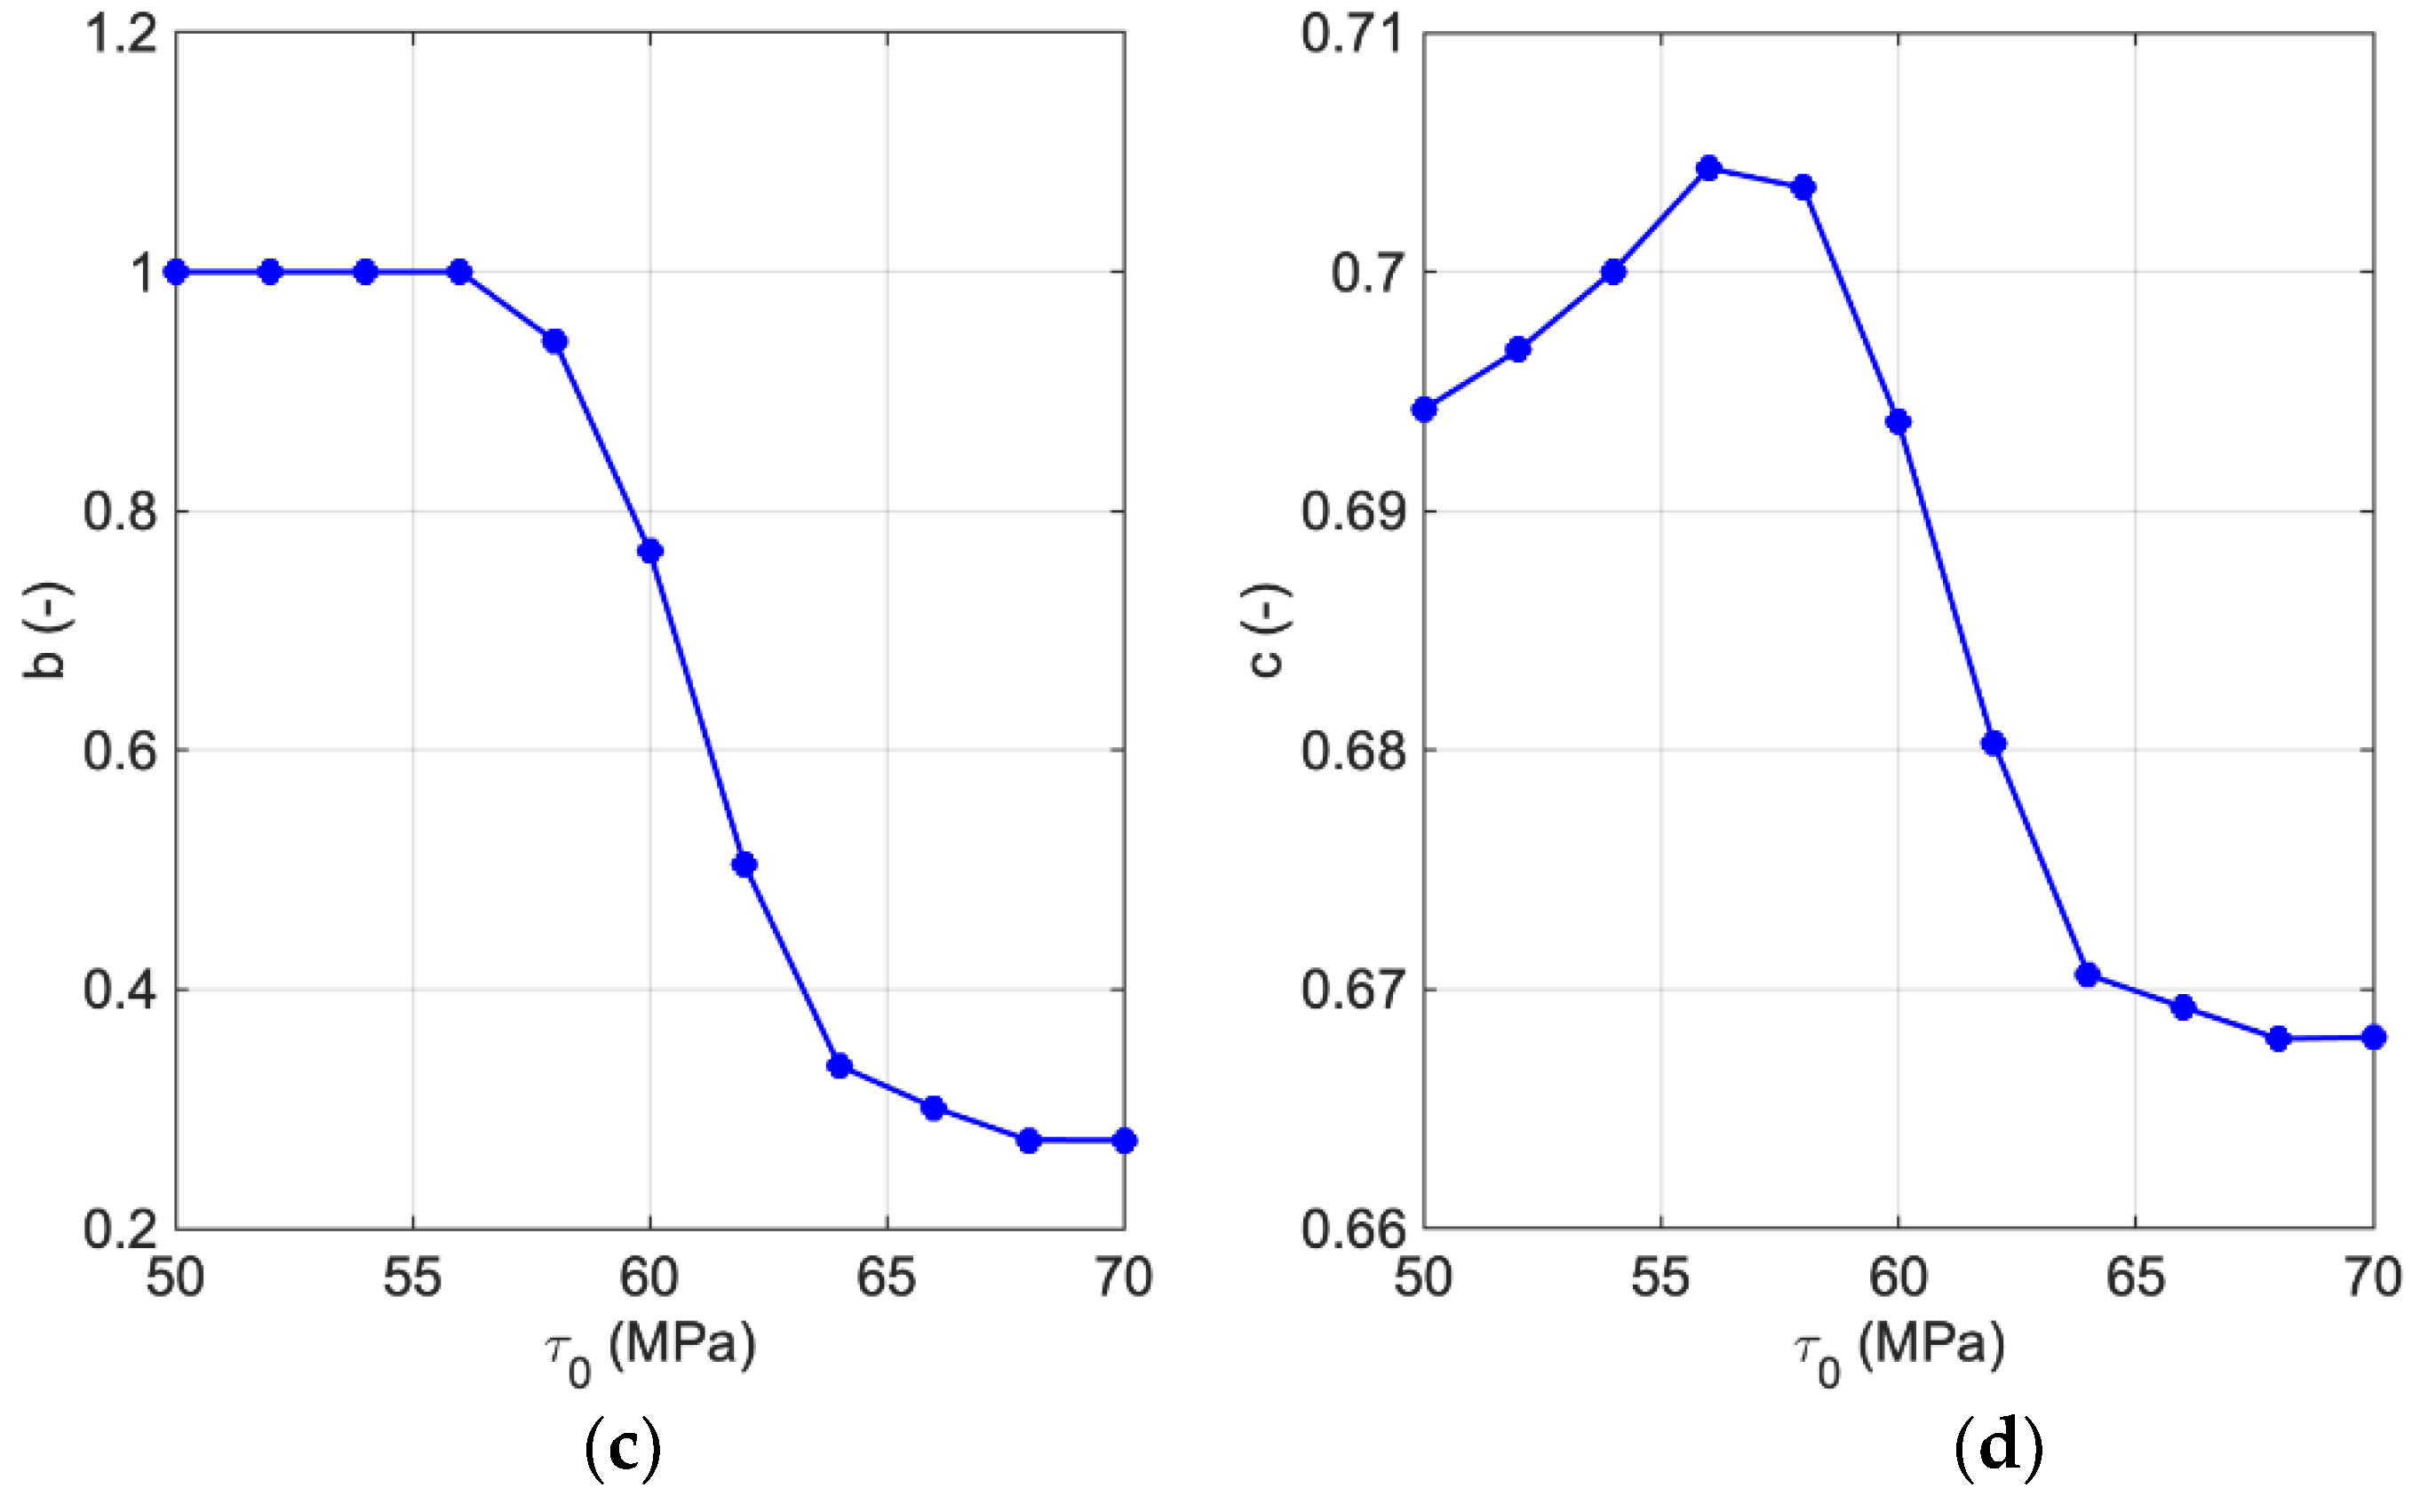
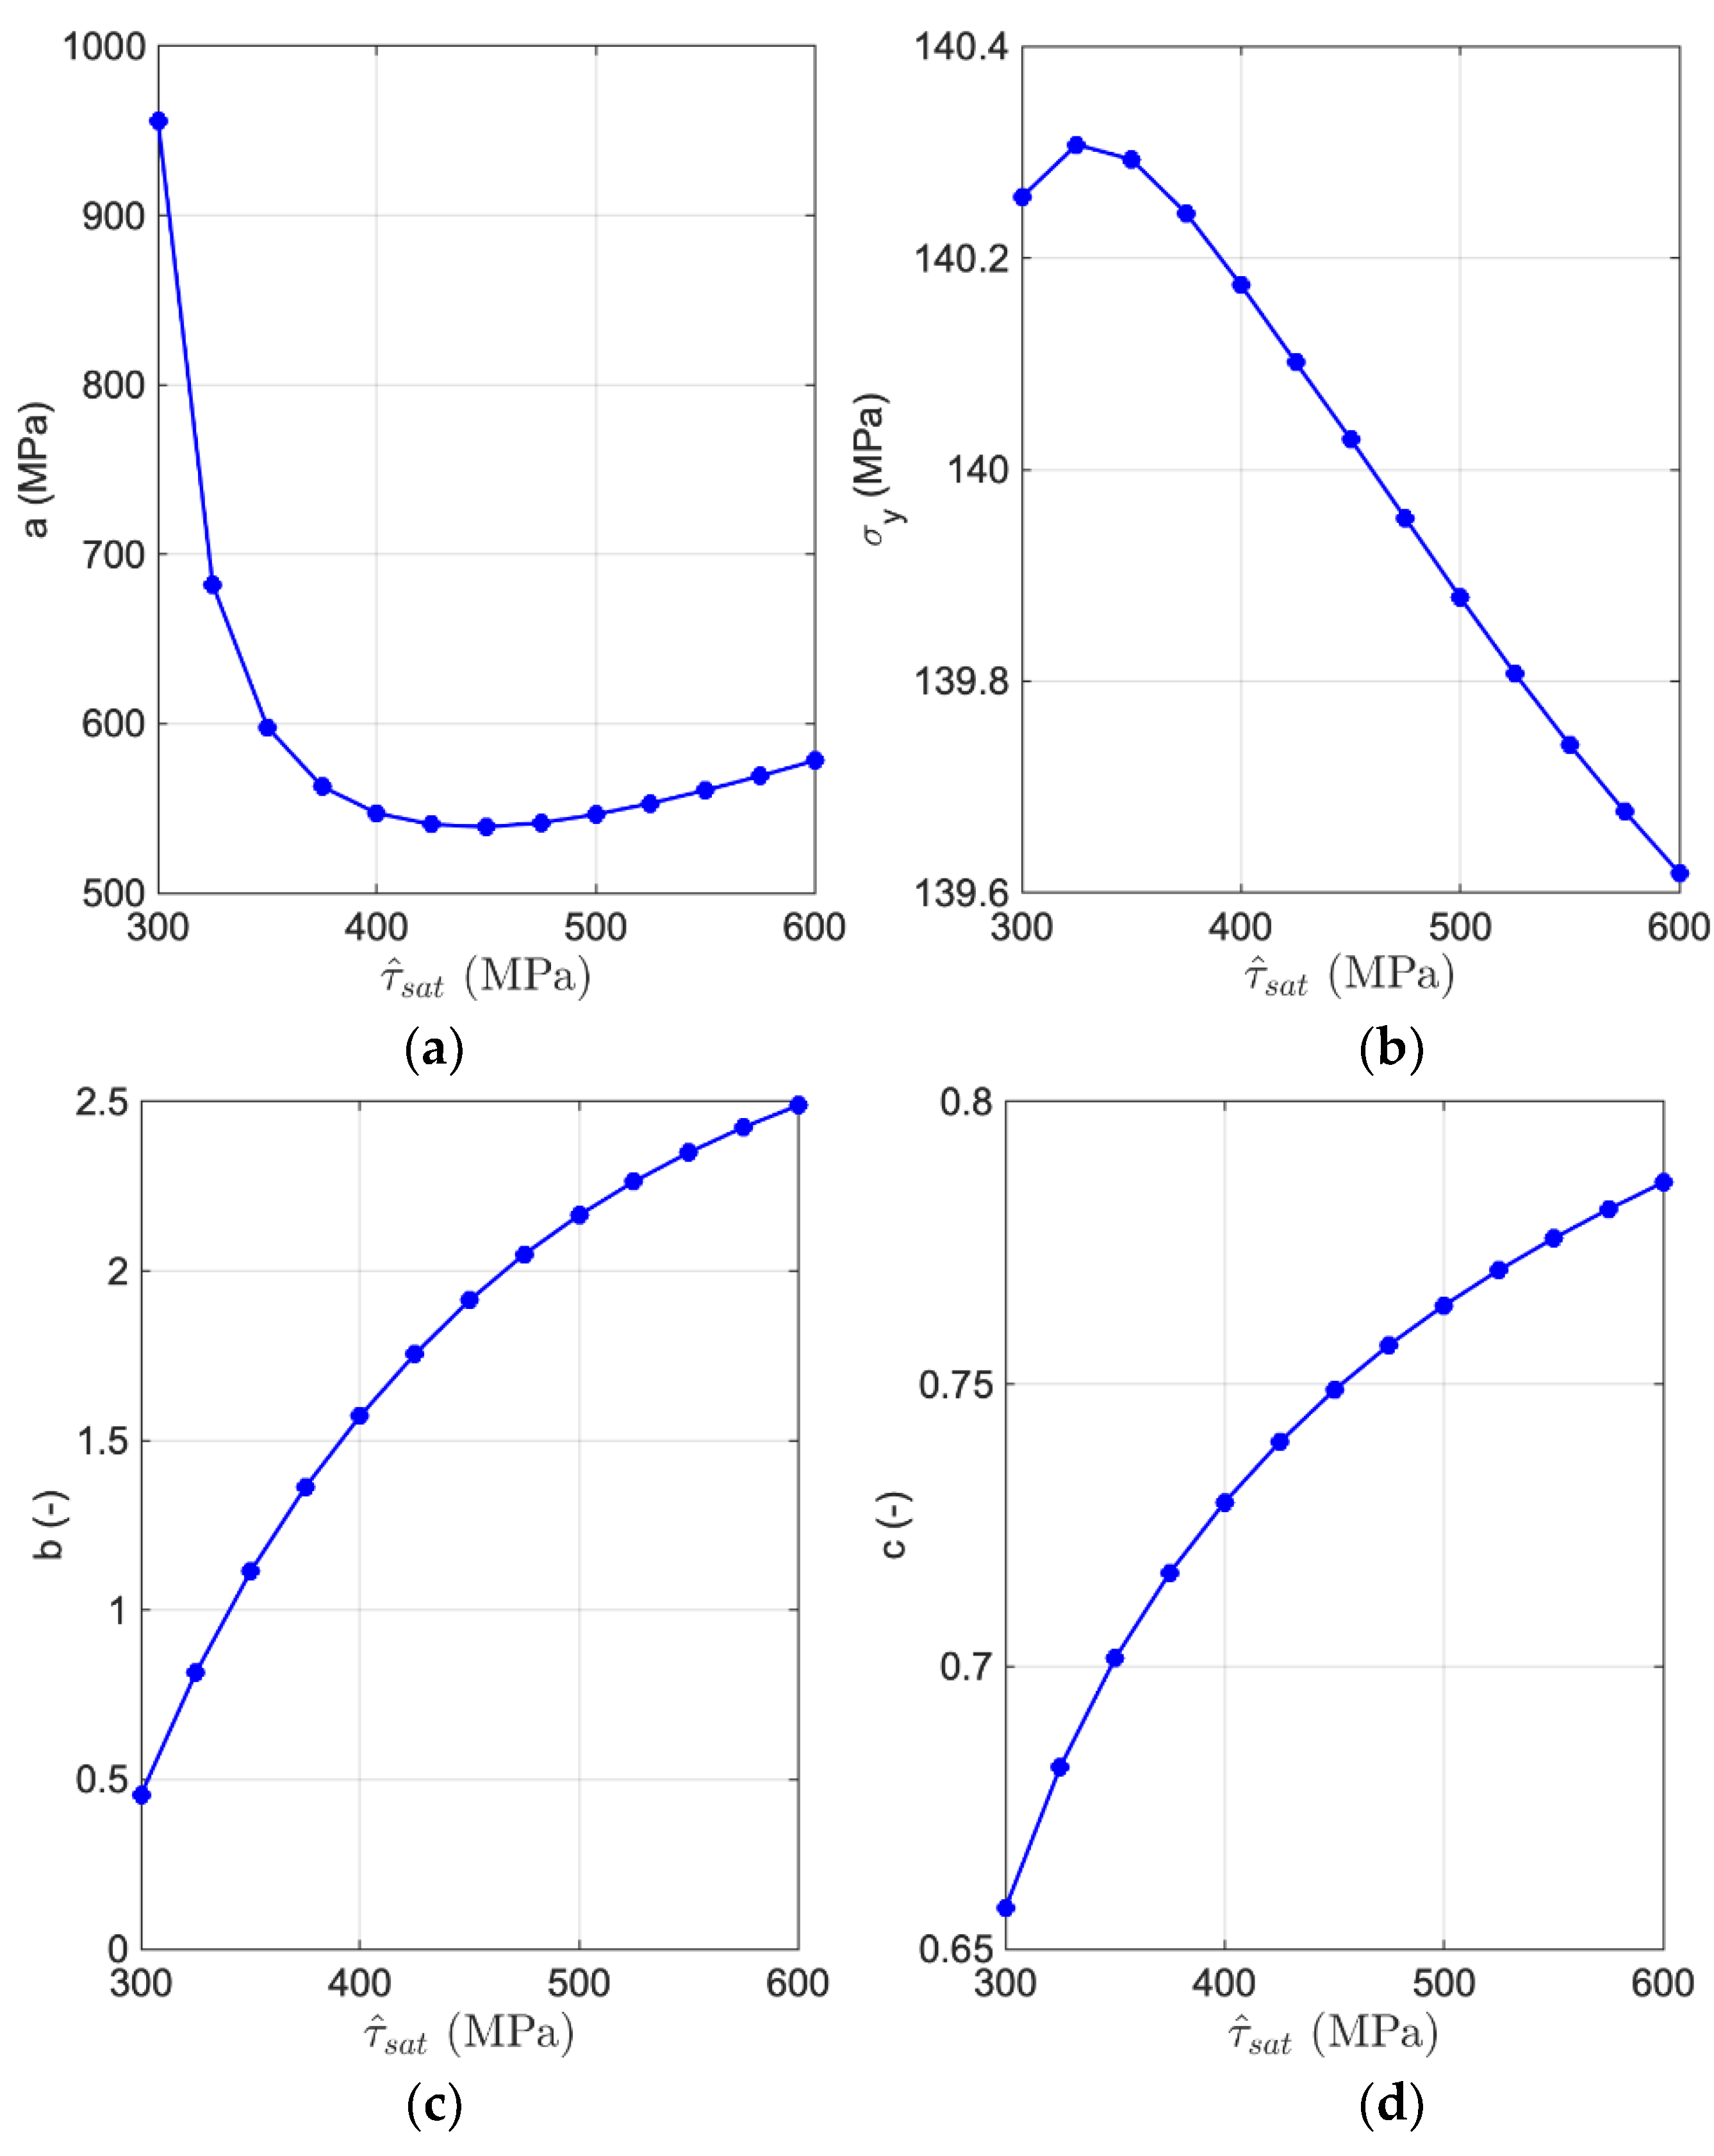
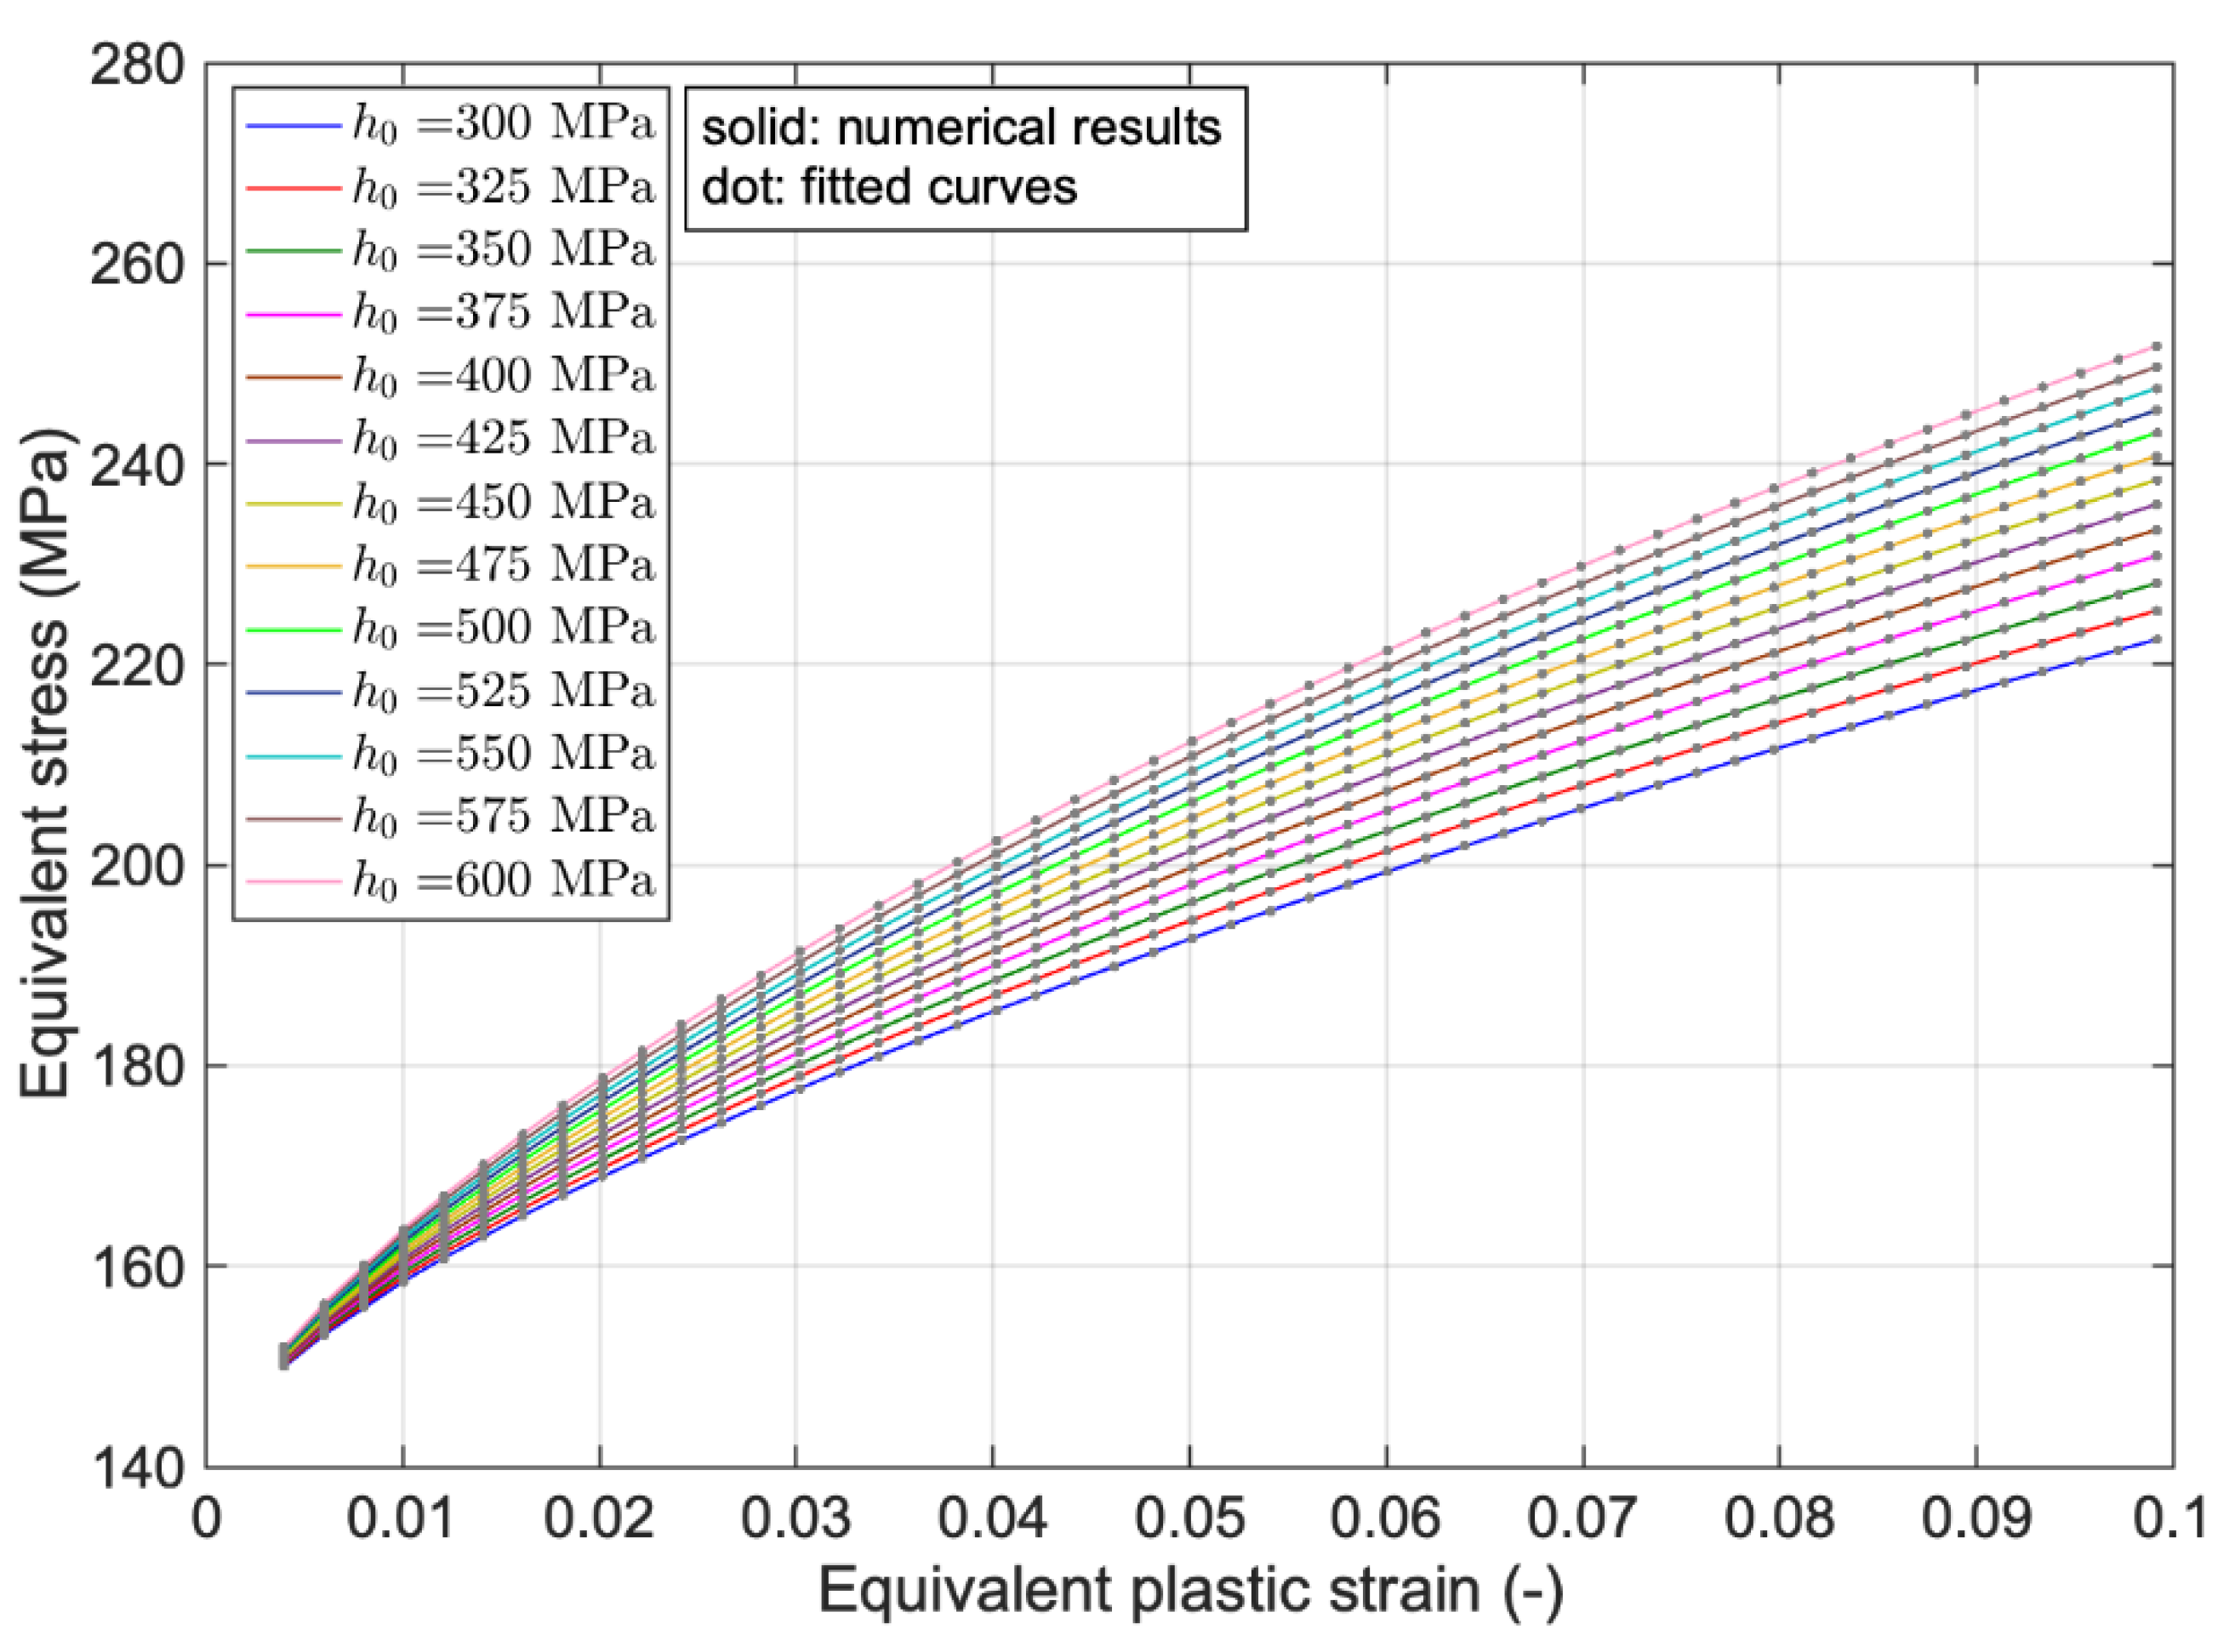
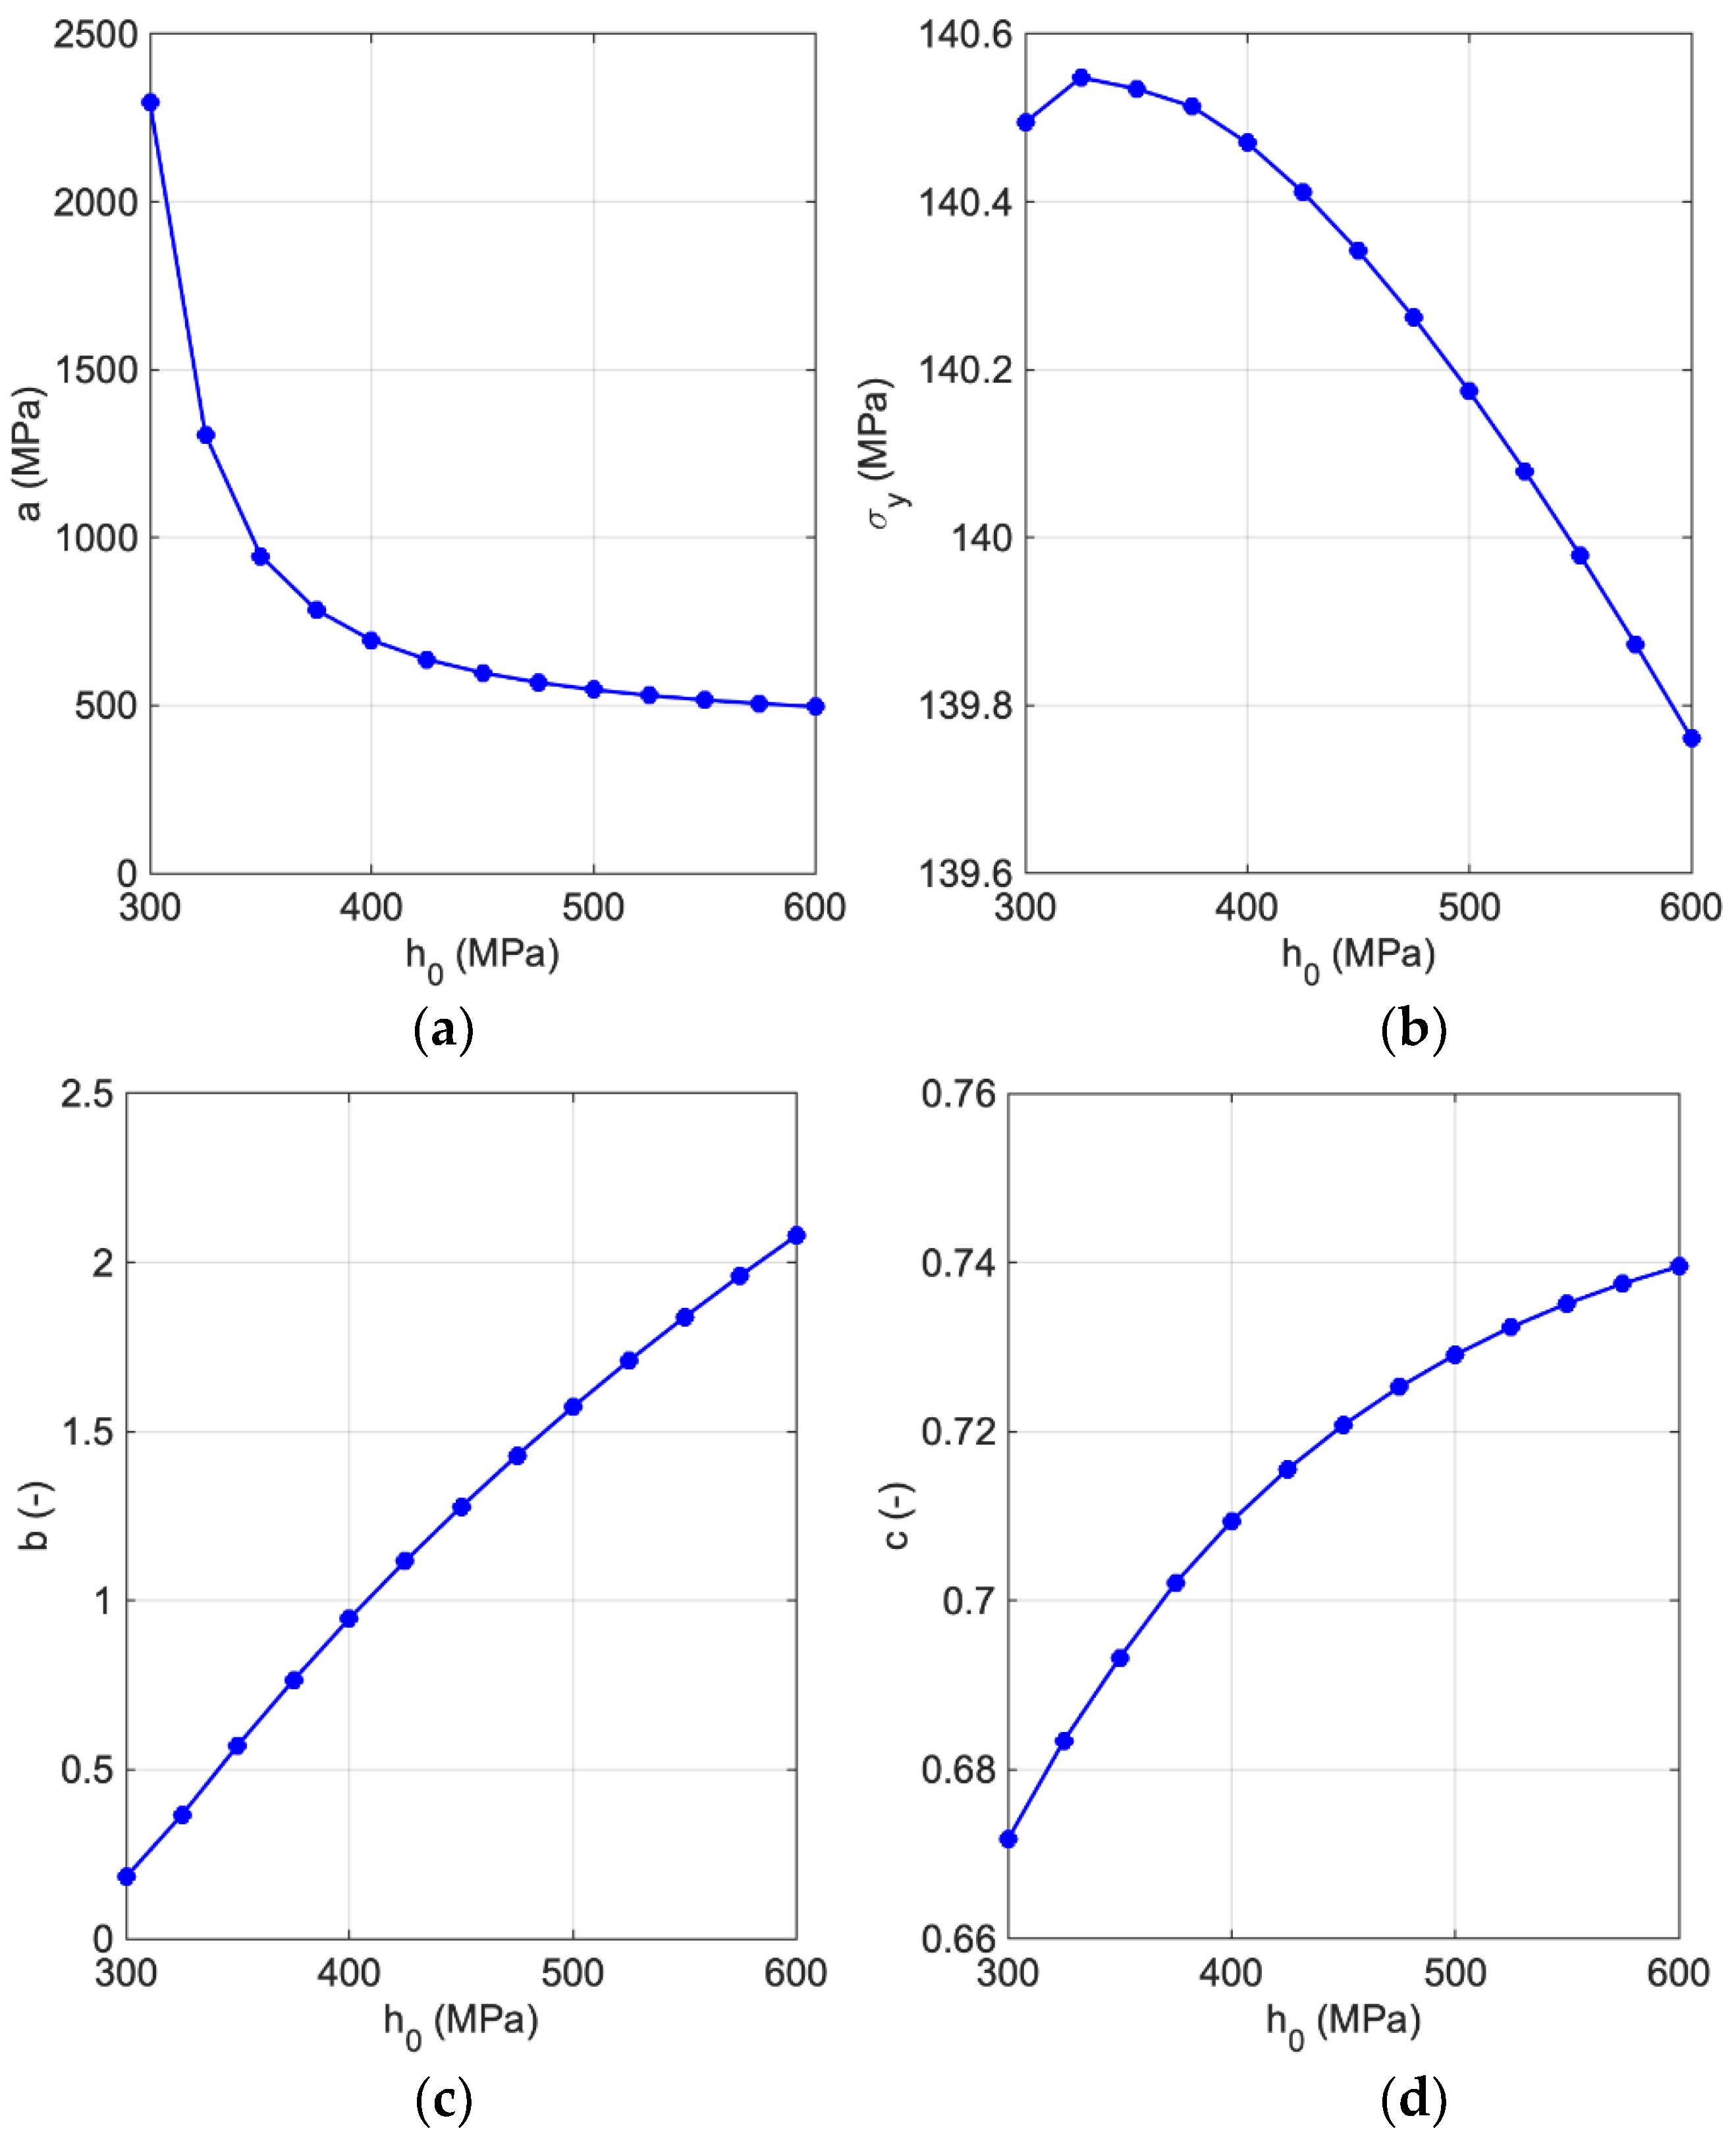
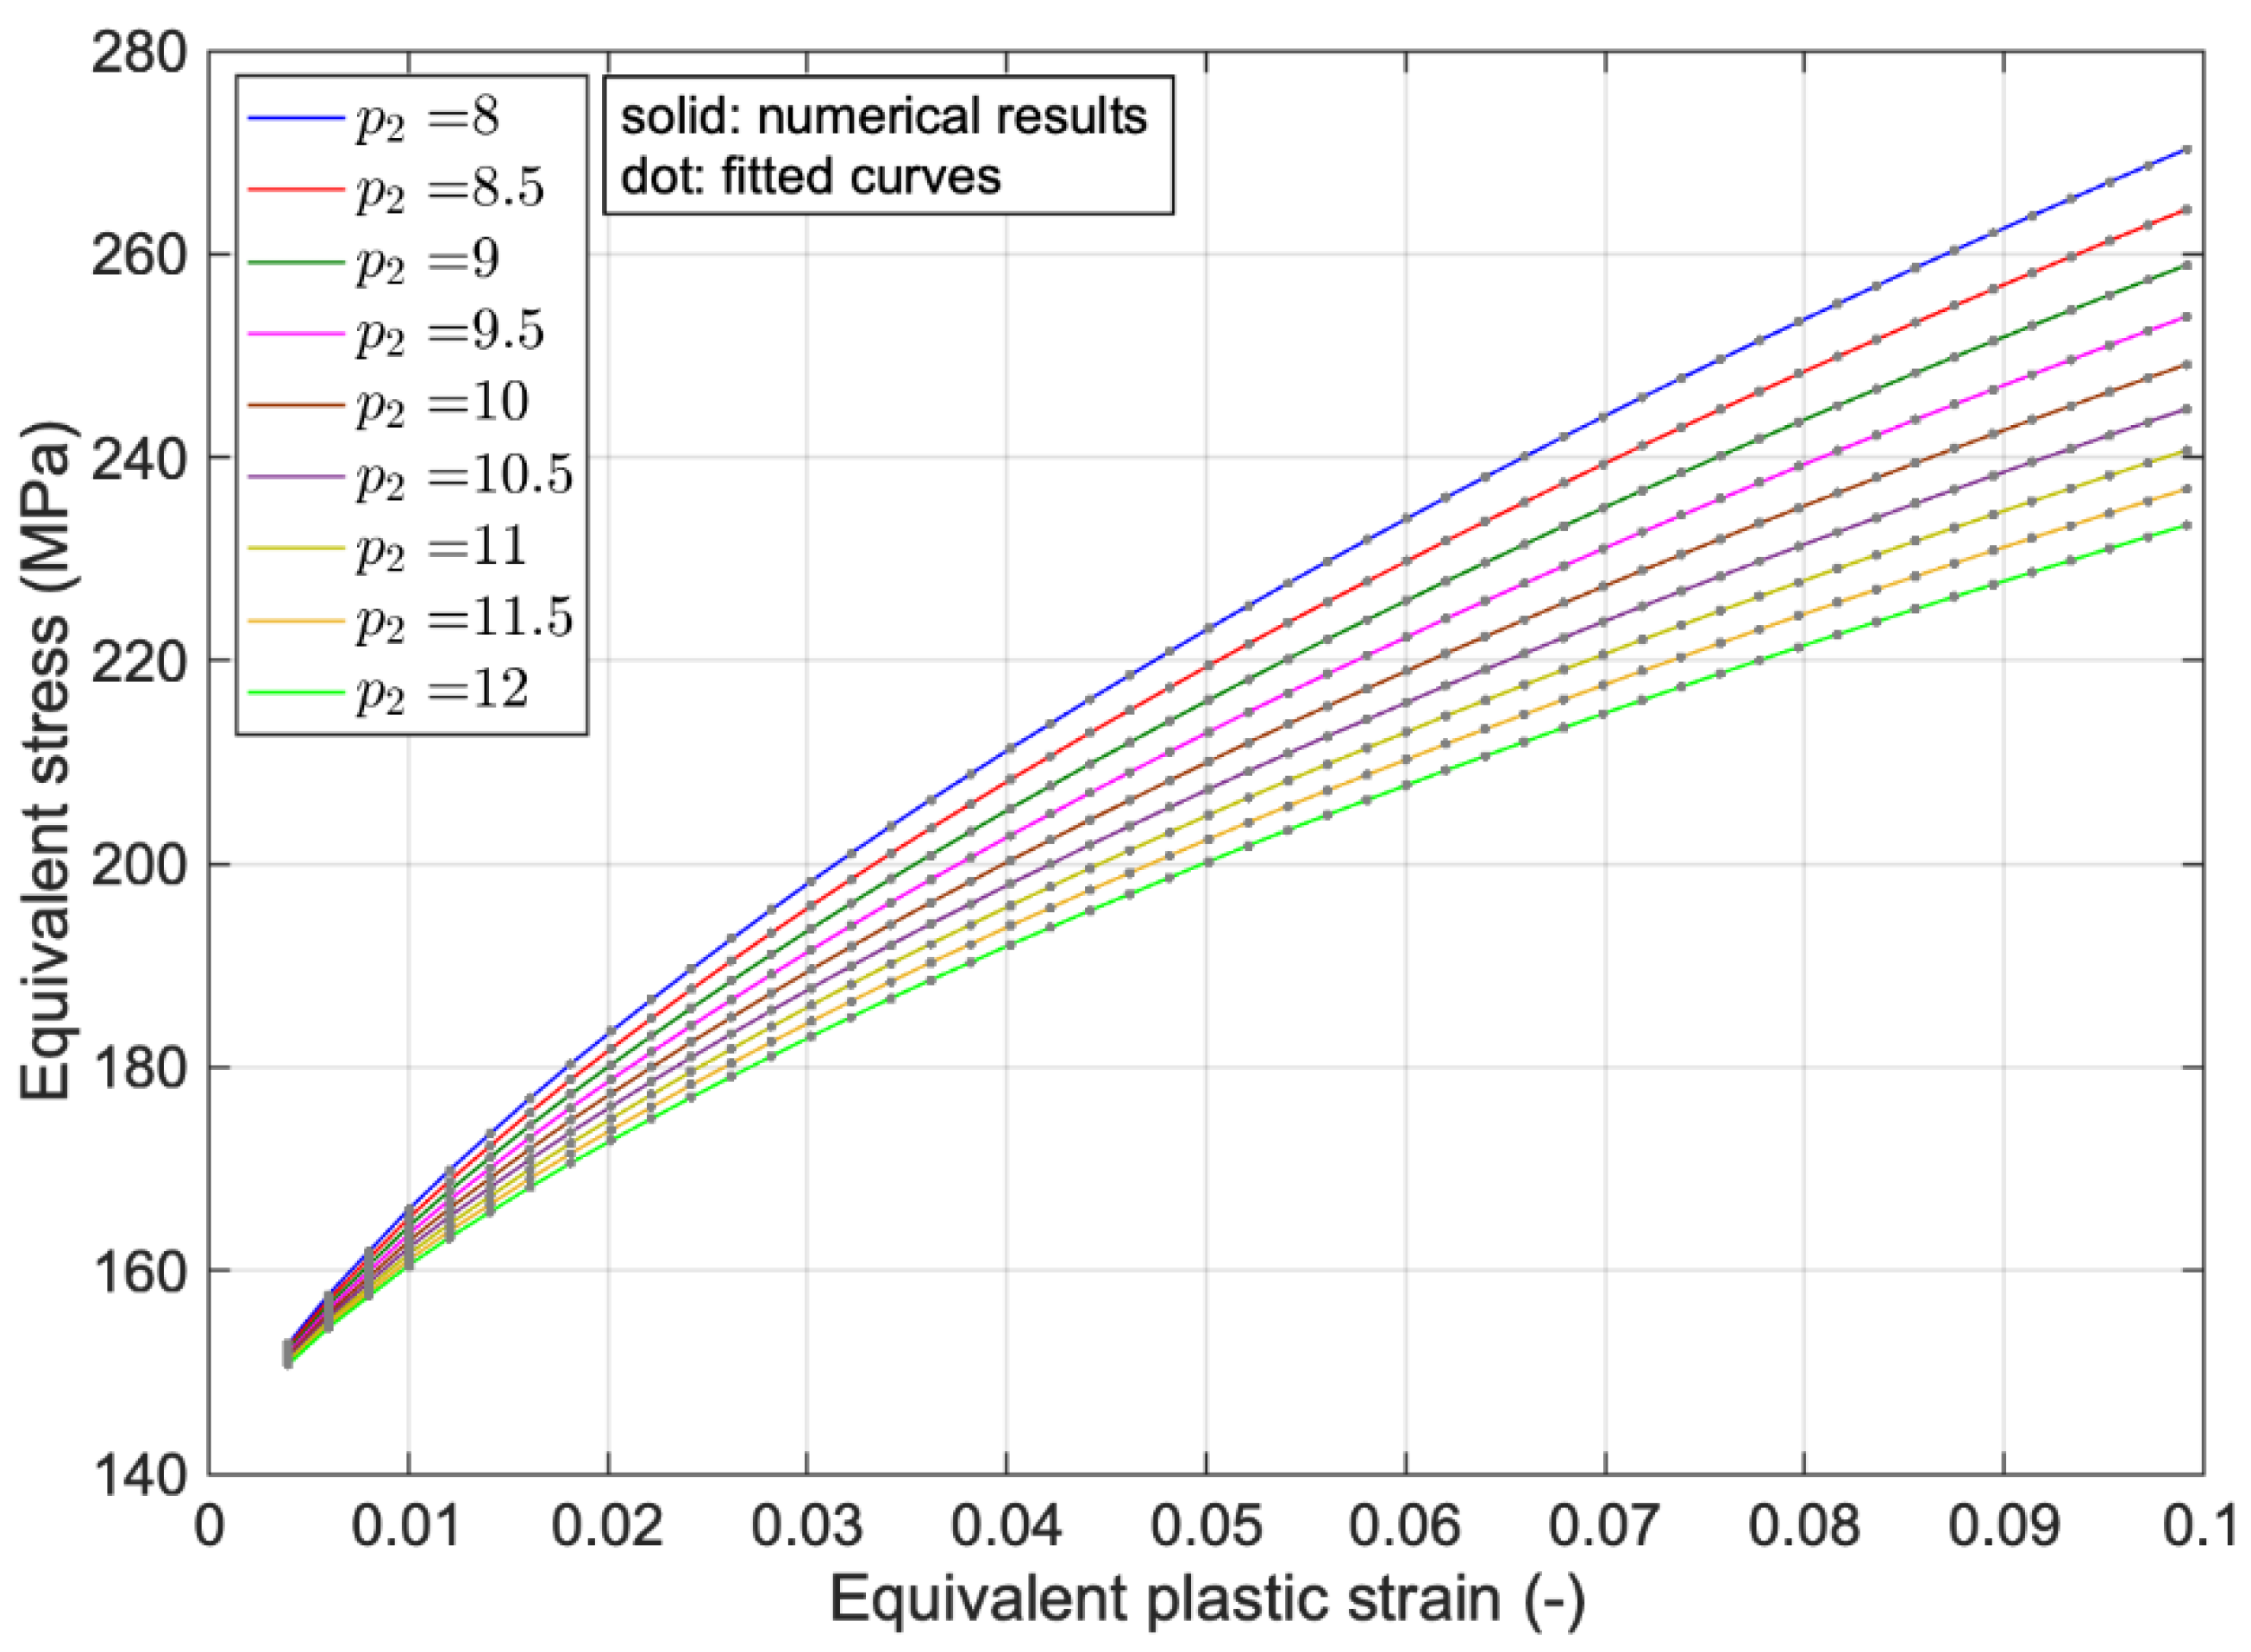
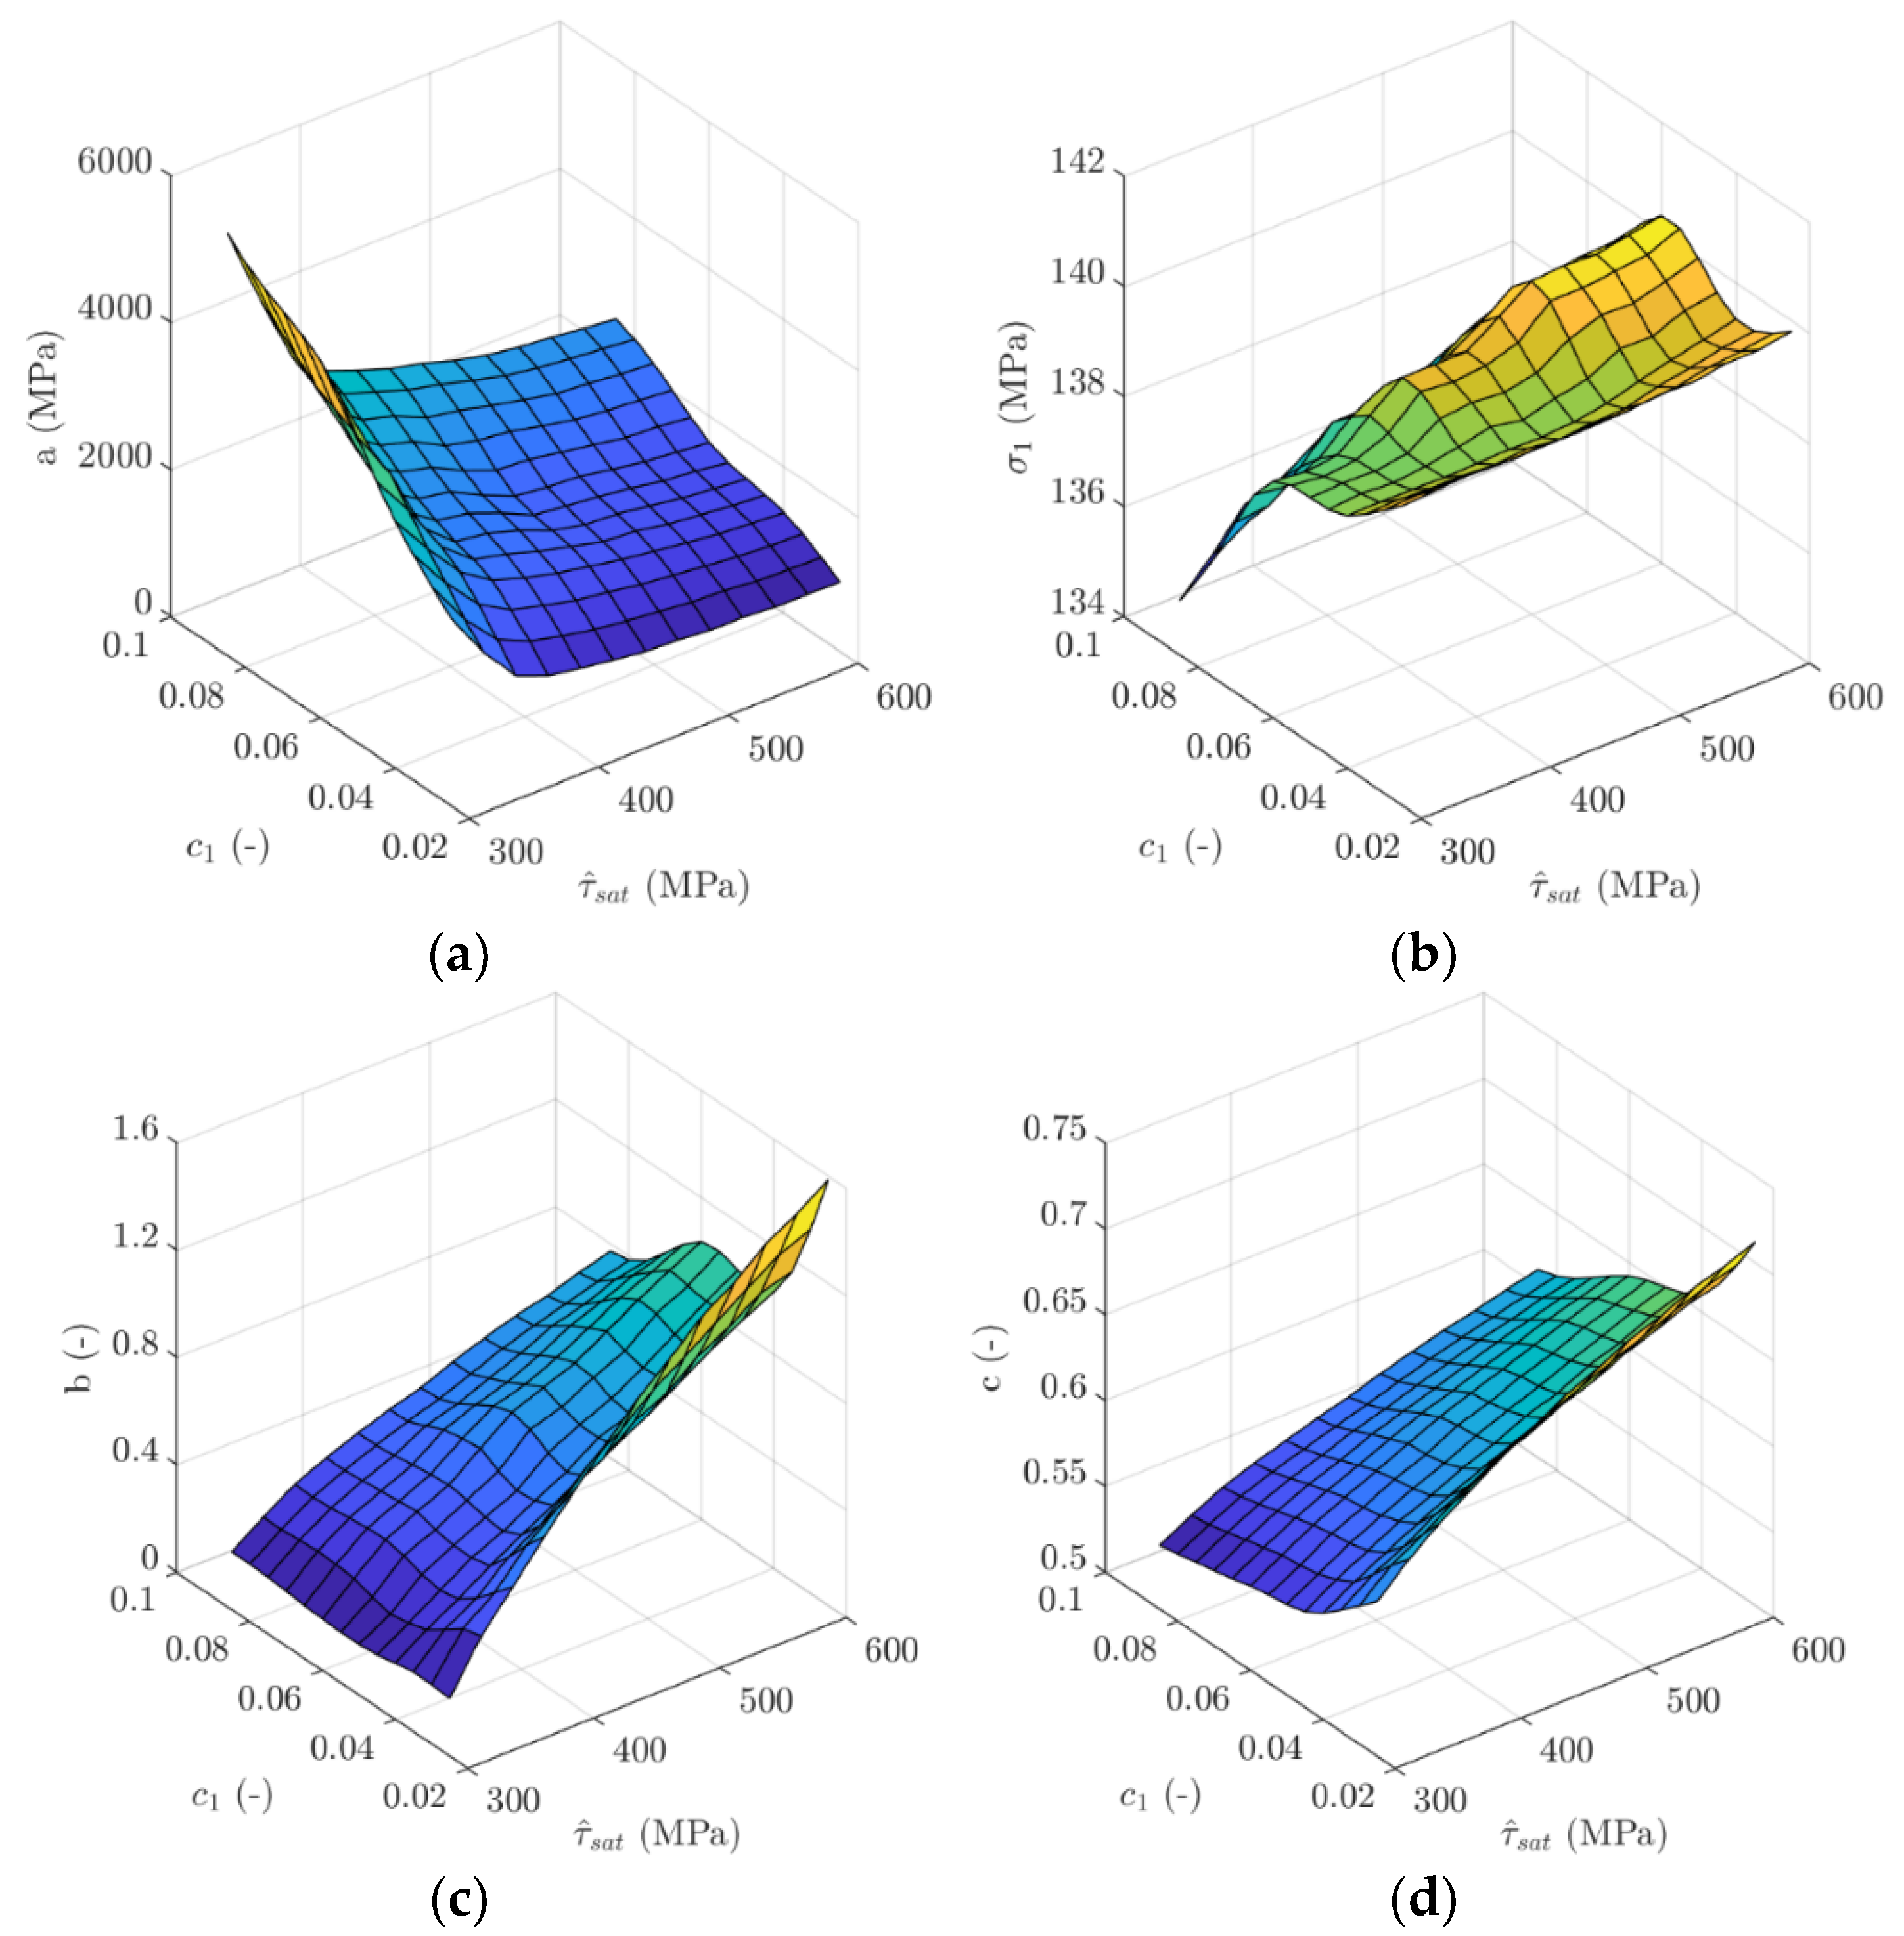
2.4. Empirical Hardening Relation
3. Results and Discussion
4. Conclusions
Author Contributions
Funding
Institutional Review Board Statement
Informed Consent Statement
Conflicts of Interest
References
- Nijssen, R.P.L.; Brøndsted, P. Fatigue as a design driver for composite wind turbine blades. In Advances in Wind Turbine Blade Design and Materials; Woodhead Publishing Series in Energy; Woodhead Publishing: Cambridge, UK, 2013; pp. 175–209. [Google Scholar]
- Nemat-Nasser, S.; Hori, M. Micromechanics: Overall Properties of Heterogeneous Materials, 2nd ed.; Elsevier: North-Holland, The Netherlands, 1999. [Google Scholar]
- Vel, S.S.; Cook, A.C.; Johnson, S.E.; Gerbi, C. Computational homogenization and micromechanical analysis of textured polycrystalline materials. Comput. Methods Appl. Mech. Eng. 2016, 310, 749–779. [Google Scholar] [CrossRef] [Green Version]
- Ryu, S.; Lee, S.; Jung, J.; Lee, J.; Kim, Y. Micromechanics-based homogenization of the effective physical properties of composites with an anisotropic matrix and interfacial imperfections. Front. Mater. 2019, 6, 21. [Google Scholar] [CrossRef]
- Vajragupta, N.; Ahmed, A.; Boeff, M.; Ma, A.; Hartmaier, A. Micromechanical modelling approach to derive the yield surface for BCC and FCC steels for statically informed microstructure models and nonlocal crystal plasticity. Phys. Mesomech. 2017, 20, 343–352. [Google Scholar] [CrossRef]
- Otero, F.; Oller, S.; Martinez, X.; Salomon, O. Numerical homogenization for composite materials analysis. Comparison with other micro mechanical formulations. Compos. Struct. 2015, 122, 405–416. [Google Scholar] [CrossRef] [Green Version]
- Charalambakis, N. Homogenization Techniques and Micromechanics. A Survey and Perspectives. Appl. Mech. Rev. 2010, 63, 030803. [Google Scholar] [CrossRef]
- Vajragupta, N.; Wechsuwanmanee, P.; Lian, J.; Sharaf, M.; Munstermann, S.; Ma, A.; Hartmaier, A.; Bleck, W. The modelling scheme to evaluate the influence of microstructure features on micro-crack formation in DP-steel: The artificial microstructure model and its applications to predict the strain hardening behavior. Comp. Mater. Sci. 2014, 94, 198–213. [Google Scholar] [CrossRef]
- Regener, B.; Krempaszky, C.; Werner, E.; Stockinger, M. Modelling the micromorphology of heat treated Ti6Al4V forgings by means of spatial tessellations feasible for fem analyses of microscale residual stresses. Comp. Mater. Sci. 2012, 52, 77–81. [Google Scholar] [CrossRef]
- Wu, Y.; Zhou, W.; Wang, B.; Yang, F. Modeling and Characterization of Two-Phase Composites by Voronoi Diagram in the Laguerre Geometry Based on Random Close Packing of Spheres. Comp. Mater. Sci. 2010, 47, 951–961. [Google Scholar] [CrossRef]
- Okabe, A.; Boots, B.; Sugihara, K.; Chiu, S.N. Spatial Tessellations: Concepts and Applications of Voronoi Diagrams, 2nd ed.; John Wiley & Sons Ltd.: Hoboken, NJ, USA, 2000. [Google Scholar]
- Roters, F.; Eisenlohr, P.; Bieler, T.R.; Raabe, D. Crystal Plasticity Finite Element Methods in Materials Science and Engineering; WILEY-VCH Verlag GmbH & Co. KGaA: Weinheim, Germany, 2010. [Google Scholar]
- Huang, Y. A User-Material Subroutine Incorporating Single Crystal Plasticity in the ABAQUS Finite Element Program; Mech. Report 178; Division of Engineering and Applied Sciences, Harvard University: Cambridge, MA, USA, 1991. [Google Scholar]
- Raabe, D.; Sachtleber, M.; Zhao, Z.; Roters, F.; Zaefferer, S. Micromechanical and macromechanical effects in grain scale polycrystal plasticity experimentation and simulation. Acta Mater. 2001, 49, 3433–3441. [Google Scholar] [CrossRef]
- Diard, O.; Leclercq, S.; Rousselier, G.; Cailletaud, G. Evaluation of finite element based analysis of 3D multicrystalline aggregates plasticity: Application to crystal plasticity model identification and the study of stress and strain fields near grain boundaries. Int. J. Plast. 2005, 2, 1691–1722. [Google Scholar]
- Aoyagi, Y.; Shizawa, K. Multiscale crystal plasticity modeling based on geometrically necessary crystal defects and simulation on fine-graining for polycrystal. Int. J. Plast. 2007, 23, 1022–1040. [Google Scholar] [CrossRef]
- Mellbin, Y.; Hallberg, H.; Ristinmaa, M. An extended vertex and crystal plasticity framework for efficient multiscale modeling of polycrystalline materials. Int. J. Solids Struct. 2017, 125, 150–160. [Google Scholar] [CrossRef]
- Roters, F.; Eisenlohr, P.; Hantcherli, L.; Tjahjanto, D.D.; Bieler, T.R.; Raabe, D. Overview of constitutive laws, kinematics, homogenization and multiscale methods in crystal plasticity finite-element modeling: Theory, experiments, applications. Acta Mater. 2010, 58, 1152–1211. [Google Scholar] [CrossRef]
- Reuber, C.; Eisenlohr, P.; Roters, F.; Raabe, D. Dislocation density distribution around an indent in single-crystalline nickel: Comparing nonlocal crystal plasticity finite-element predictions with experiments. Acta Mater. 2014, 71, 333–348. [Google Scholar] [CrossRef]
- Stoelken, J.; Evans, A. A microbend test method for measuring the plasticity length scale. Acta Mater. 1998, 457, 5109–5115. [Google Scholar] [CrossRef]
- Suzuki, K.; Matsuki, Y.; Masaki, K.; Sato, M.; Kuroda, M. Tensile and microbend tests of pure aluminum foils with different thicknesses. Mater. Sci. Eng. A 2009, 513, 77–82. [Google Scholar] [CrossRef]
- Hayashi, I.; Sato, M.; Kuroda, M. Stain hardening in bent copper foils. J. Mech. Phys. Solids 2011, 59, 1731–1751. [Google Scholar] [CrossRef]
- Fleck, N.A.; Muller, G.M.; Ashby, M.F.; Hutchinson, J.W. Strain gradient plasticity: Theory and experiment. Acta Metall. Mater. 1994, 42, 475–487. [Google Scholar] [CrossRef]
- Nye, J.F. Some geometrical relations in dislocated crystals. Acta Metall. 1953, 1, 153–162. [Google Scholar] [CrossRef]
- Evers, L.P.; Brekelmans, W.A.M.; Geers, M.G.D. Non-local crystal plasticity model with intrinsic SSD and GND effects. J. Mech. Phys. Solids 2004, 52, 2379–2401. [Google Scholar] [CrossRef]
- Ma, A.; Hartmaier, A. On the influence of isotropic and kinematic hardening caused by strain gradients on the deformation behaviour of polycrystals. Philos. Mag. 2014, 94, 125–140. [Google Scholar] [CrossRef]
- Shahmardani, M.; Vajragupta, N.; Hartmaier, A. Robust optimization scheme for inverse method for crystal plasticity model parametrization. Materials 2020, 13, 735. [Google Scholar] [CrossRef] [Green Version]
- Williams, B.W.; Simha, C.H.M.; Abedrabbo, N.; Mayer, R.; Worswick, M.J. Effect of anisotropy, kinematic hardening, and strain-rate sensitivity on the predicted axial crush response of hydroformed aluminium alloy tubes. Int. J. Impact Eng. 2010, 37, 652–661. [Google Scholar] [CrossRef]
- Siddiq, A.; Schmauder, S. Crystal plasticity parameter identification procedure for single crystalline material during deformation. J. Comp. Appl. Mech. 2006, 7, 1–15. [Google Scholar]
- Oliveira, M.C.; Alves, J.L.; Chaparro, B.M.; Menezes, L.F. Study on the influence of work-hardening modeling in springback prediction. Int. J. Plast. 2007, 23, 516–543. [Google Scholar] [CrossRef] [Green Version]
- Boeff, M. Micromechanical Modelling of Fatigue Crack Initiation and Growth. Ph.D. Thesis, Ruhr-Universität Bochum, Bochum, Germany, 2016. [Google Scholar]
- Plimpton, S. Fast parallel algorithm algorithms for short-range molecular dynamics. J. Comput. Phys. 1995, 117, 1–19. [Google Scholar] [CrossRef] [Green Version]
- Rycroft, C.H.; Grest, G.S.; Landry, J.W.; Bazant, M.Z. Analysis of granular flow in a pebble-bed nuclear reactor. Phys. Rev. E 2006, 74, 021306. [Google Scholar] [CrossRef] [Green Version]
- Sandia National Laboratories. CUBIT 13.2. Available online: https://cubit.sandia.gov/ (accessed on 4 May 2016).
- ABAQUS, Dassault Systems. 2012. Available online: http://130.149.89.49:2080/v6.12/pdf_books/ANALYSIS_2.pdf (accessed on 17 October 2021).
- Kröner, E. On the plastic deformation of polycrystals. Acta Metall. 1961, 9, 155–161. [Google Scholar] [CrossRef]
- Curtin, W.A.; Miller, R.E. Atomistic/continuum coupling in computational materials science. Model. Simul. Mater. Sci. Eng. 2003, 11, R33–R68. [Google Scholar] [CrossRef]
- Becker, R. Effects of strain localization on surface roughening during sheet forming. Acta Mater. 1998, 46, 1385–1401. [Google Scholar] [CrossRef]
- Gottstein, G. Physical Foundations of Materials Science; Springer: Berlin, Germany, 2004. [Google Scholar]
- MathWorks. Curve Fitting Toolbox: User’s Guide (R2015a). 2015. Available online: https://de.mathworks.com/help/curvefit/ (accessed on 18 May 2015).


(MPa) | (MPa) | (MPa) | (−) | (−) | (−) |
|---|---|---|---|---|---|
| 52 | 400 | 500 | 10.7 | 0.001 | 0.01 |
Publisher’s Note: MDPI stays neutral with regard to jurisdictional claims in published maps and institutional affiliations. |
© 2021 by the authors. Licensee MDPI, Basel, Switzerland. This article is an open access article distributed under the terms and conditions of the Creative Commons Attribution (CC BY) license (https://creativecommons.org/licenses/by/4.0/).
Share and Cite
Shahmardani, M.; Vajragupta, N.; Hartmaier, A. Influence of Crystal Plasticity Parameters on the Strain Hardening Behavior of Polycrystals. Crystals 2021, 11, 1473. https://doi.org/10.3390/cryst11121473
Shahmardani M, Vajragupta N, Hartmaier A. Influence of Crystal Plasticity Parameters on the Strain Hardening Behavior of Polycrystals. Crystals. 2021; 11(12):1473. https://doi.org/10.3390/cryst11121473
Chicago/Turabian StyleShahmardani, Mahdieh, Napat Vajragupta, and Alexander Hartmaier. 2021. "Influence of Crystal Plasticity Parameters on the Strain Hardening Behavior of Polycrystals" Crystals 11, no. 12: 1473. https://doi.org/10.3390/cryst11121473