Review

Crystal Plasticity Simulation of Magnesium and Its Alloys: A Review of Recent Advances

by
Mohammadreza Yaghoobi
1,
George Z. Voyiadjis
2,* and
Veera Sundararaghavan
3
1
Materials Science and Engineering, University of Michigan, Ann Arbor, MI 48109, USA
2
Computational Solid Mechanics Laboratory, Department of Civil and Environmental Engineering, Louisiana State University, Baton Rouge, LA 70803, USA
3
Aerospace Engineering, University of Michigan, Ann Arbor, MI 48109, USA
*
Author to whom correspondence should be addressed.
Crystals 2021, 11(4), 435; https://doi.org/10.3390/cryst11040435
Submission received: 17 March 2021 / Revised: 14 April 2021 / Accepted: 15 April 2021 / Published: 17 April 2021
(This article belongs to the Special Issue Applications of Crystal Plasticity in Forming Technologies)

Abstract

:
Slip and extension twinning are the dominant deformation mechanisms in Magnesium (Mg) and its alloys. Crystal plasticity is a powerful tool to study these deformation mechanisms. Different schemes have incorporated crystal plasticity models to capture different properties, which vary from the simple homogenization Taylor model to the full-scale crystal plasticity finite element model. In the current study, a review of works available in the literature that addresses different properties of Mg and its alloys using crystal plasticity modes is presented. In addition to slip and twinning, detwinning is another deformation mechanism that is activated in Mg and its alloys. The different models that capture detwinning will also be addressed here. Finally, the recent experimental frameworks, such as in-situ neutron diffraction, 3D high energy synchrotron X-ray techniques, and digital image correlation under scanning electron microscopy (SEM-DIC), which are incorporated along crystal plasticity models to investigate the properties of Mg and its alloys, are addressed. Future research directions towards improving the deformation response of Mg and its alloys are identified, which can lead to increased deployment of the lightest structural metal in engineering applications.

1. Introduction

Mg alloys can significantly impact many industrial applications such as automobile, aerospace, and transportation, not to mention the energy sector, by effectively reducing the weight of the designed system. This can lead to a significant improvement in fuel economy and reducing emissions [1]. However, the current understanding of commercial Mg alloys and their physical metallurgy is less developed compared to other established structural metals and alloys. To overcome many of the challenges in using Mg alloys in these applications, different aspects of these alloys, including strength, formability, and fatigue resistance, should be enhanced. To fulfil any of these objectives, the underlying deformation mechanisms of Mg alloys should be thoroughly understood.
Two important deformation mechanisms of Mg alloys are plastic slip and extension twinning. Mg alloys have Hexagonal Closest Packed (HCP) crystal structure. In the case of slip, different modes can be activated, including basal a ( { 0001 } 11 2 ¯ 0 ) , prismatic a ( { 10 1 ¯ 0 } 11 2 ¯ 0 ) , pyramidal a ( { 10 1 ¯ 1 } 11 2 ¯ 0 ) , and pyramidal c + a ( { 1 ¯ 1 ¯ 22 } 1 ¯ 1 ¯ 23 ) . In the case of unalloyed Mg polycrystals, the basal mode a has a very low critical resolved shear stress (CRSS) and becomes the dominant plasticity deformation mechanism in most of the loading conditions. In the case of Mg alloys, although the basal mode CRSS increases, it still becomes the lowest among the slip modes. Although the basal mode CRSS is very low, its corresponding resolved shear stress disappears during the tensile deformation along the c-axis. The extension twinning { 10 1 ¯ 2 } 1 ¯ 011 becomes an important deformation mechanism of Mg alloys in this loading condition [2,3,4,5,6,7,8,9]. Similarly, the extension twinning is the controlling deformation mechanism during the compression loading parallel to the basal plane. The highly asymmetric response of Mg alloys for some special orientations can be attributed to the activation of extension twinning, which has a complex morphology and micromechanics [3,10,11,12,13,14,15,16]. Although consideration of slip and twinning mechanisms is enough to describe the response of Mg alloys in most of the loading types, which are monotonic, this is not the case for the loading types, which involve unloading, such as cyclic loading. These loadings are especially important in many applications, such as fatigue. In the case of cyclic loading parallel to the basal plane, twinning occurs during compression loading, which results in the 86.3° reorientation of the basal pole. During subsequent reversed cyclic loading, i.e., tensile loading parallel to the basal plane, the size of the twinned regions shrinks, and in some cases, the twin fully disappears, a phenomenon that is commonly known as detwinning [7,17,18,19,20,21,22]. This twinning and detwinning occur alternately during the cyclic loading of Mg alloys.
In-situ experiments have a key role in unraveling the underlying deformation mechanisms of Mg alloys. Three in-situ experimental schemes, that were used to investigate the Mg alloy response were Digital Image Correlation (DIC), Synchrotron X-ray techniques, and neutron diffraction. In-situ DIC is another experimental technique that is used to address the deformation mechanisms of Mg alloys. Different aspects of Mg alloys have been studied by in-situ DIC, including the effect of twin nucleation on strain field [23], twin morphology [24], and the effect of aging on the accumulation of microscale plasticity [25]. Two common in-situ Synchrotron X-ray techniques of three-dimensional X-ray diffraction (3DXRD) and high-energy diffraction microscopy (HEDM) were incorporated in the investigation of Mg alloy behavior. Aydıner et al. [26] investigated the response of the AZ31 Mg alloy using the 3DXRD technique and analyzed the evolution of stress during deformation. It was observed that the stress state inside the twinned region was different from the untwinned grain. Other studies of Mg alloys have incorporated the in-situ 3DXRD and HEDM to analyze the micromechanics of twinning [27], the effect of age hardening on the deformation behavior [28], evaluate the CRSS for deformation modes [29,30], twin growth [31], and detwinning [7,22,32]. Using in-situ neutron diffraction, it was shown that the twinning in extruded Mg-7.7 at.% Al alloy was manifested as the change in the intensity of diffraction peaks during loading [33]. The in-situ neutron diffraction experiment on the Mg alloy showed that the stress relaxation occurred in the twinned region compared to the untwinned region of grain [34]. In-situ neutron experiments were also used to address the deformation detwinning in Mg alloys [35,36,37,38,39]. Although these in-situ experiments can provide invaluable information regarding the underlying deformation mechanisms of Mg alloys, they are very expensive, time-consuming, and complex. Potential simulation frameworks benefit the research community to complement these experimental observations.
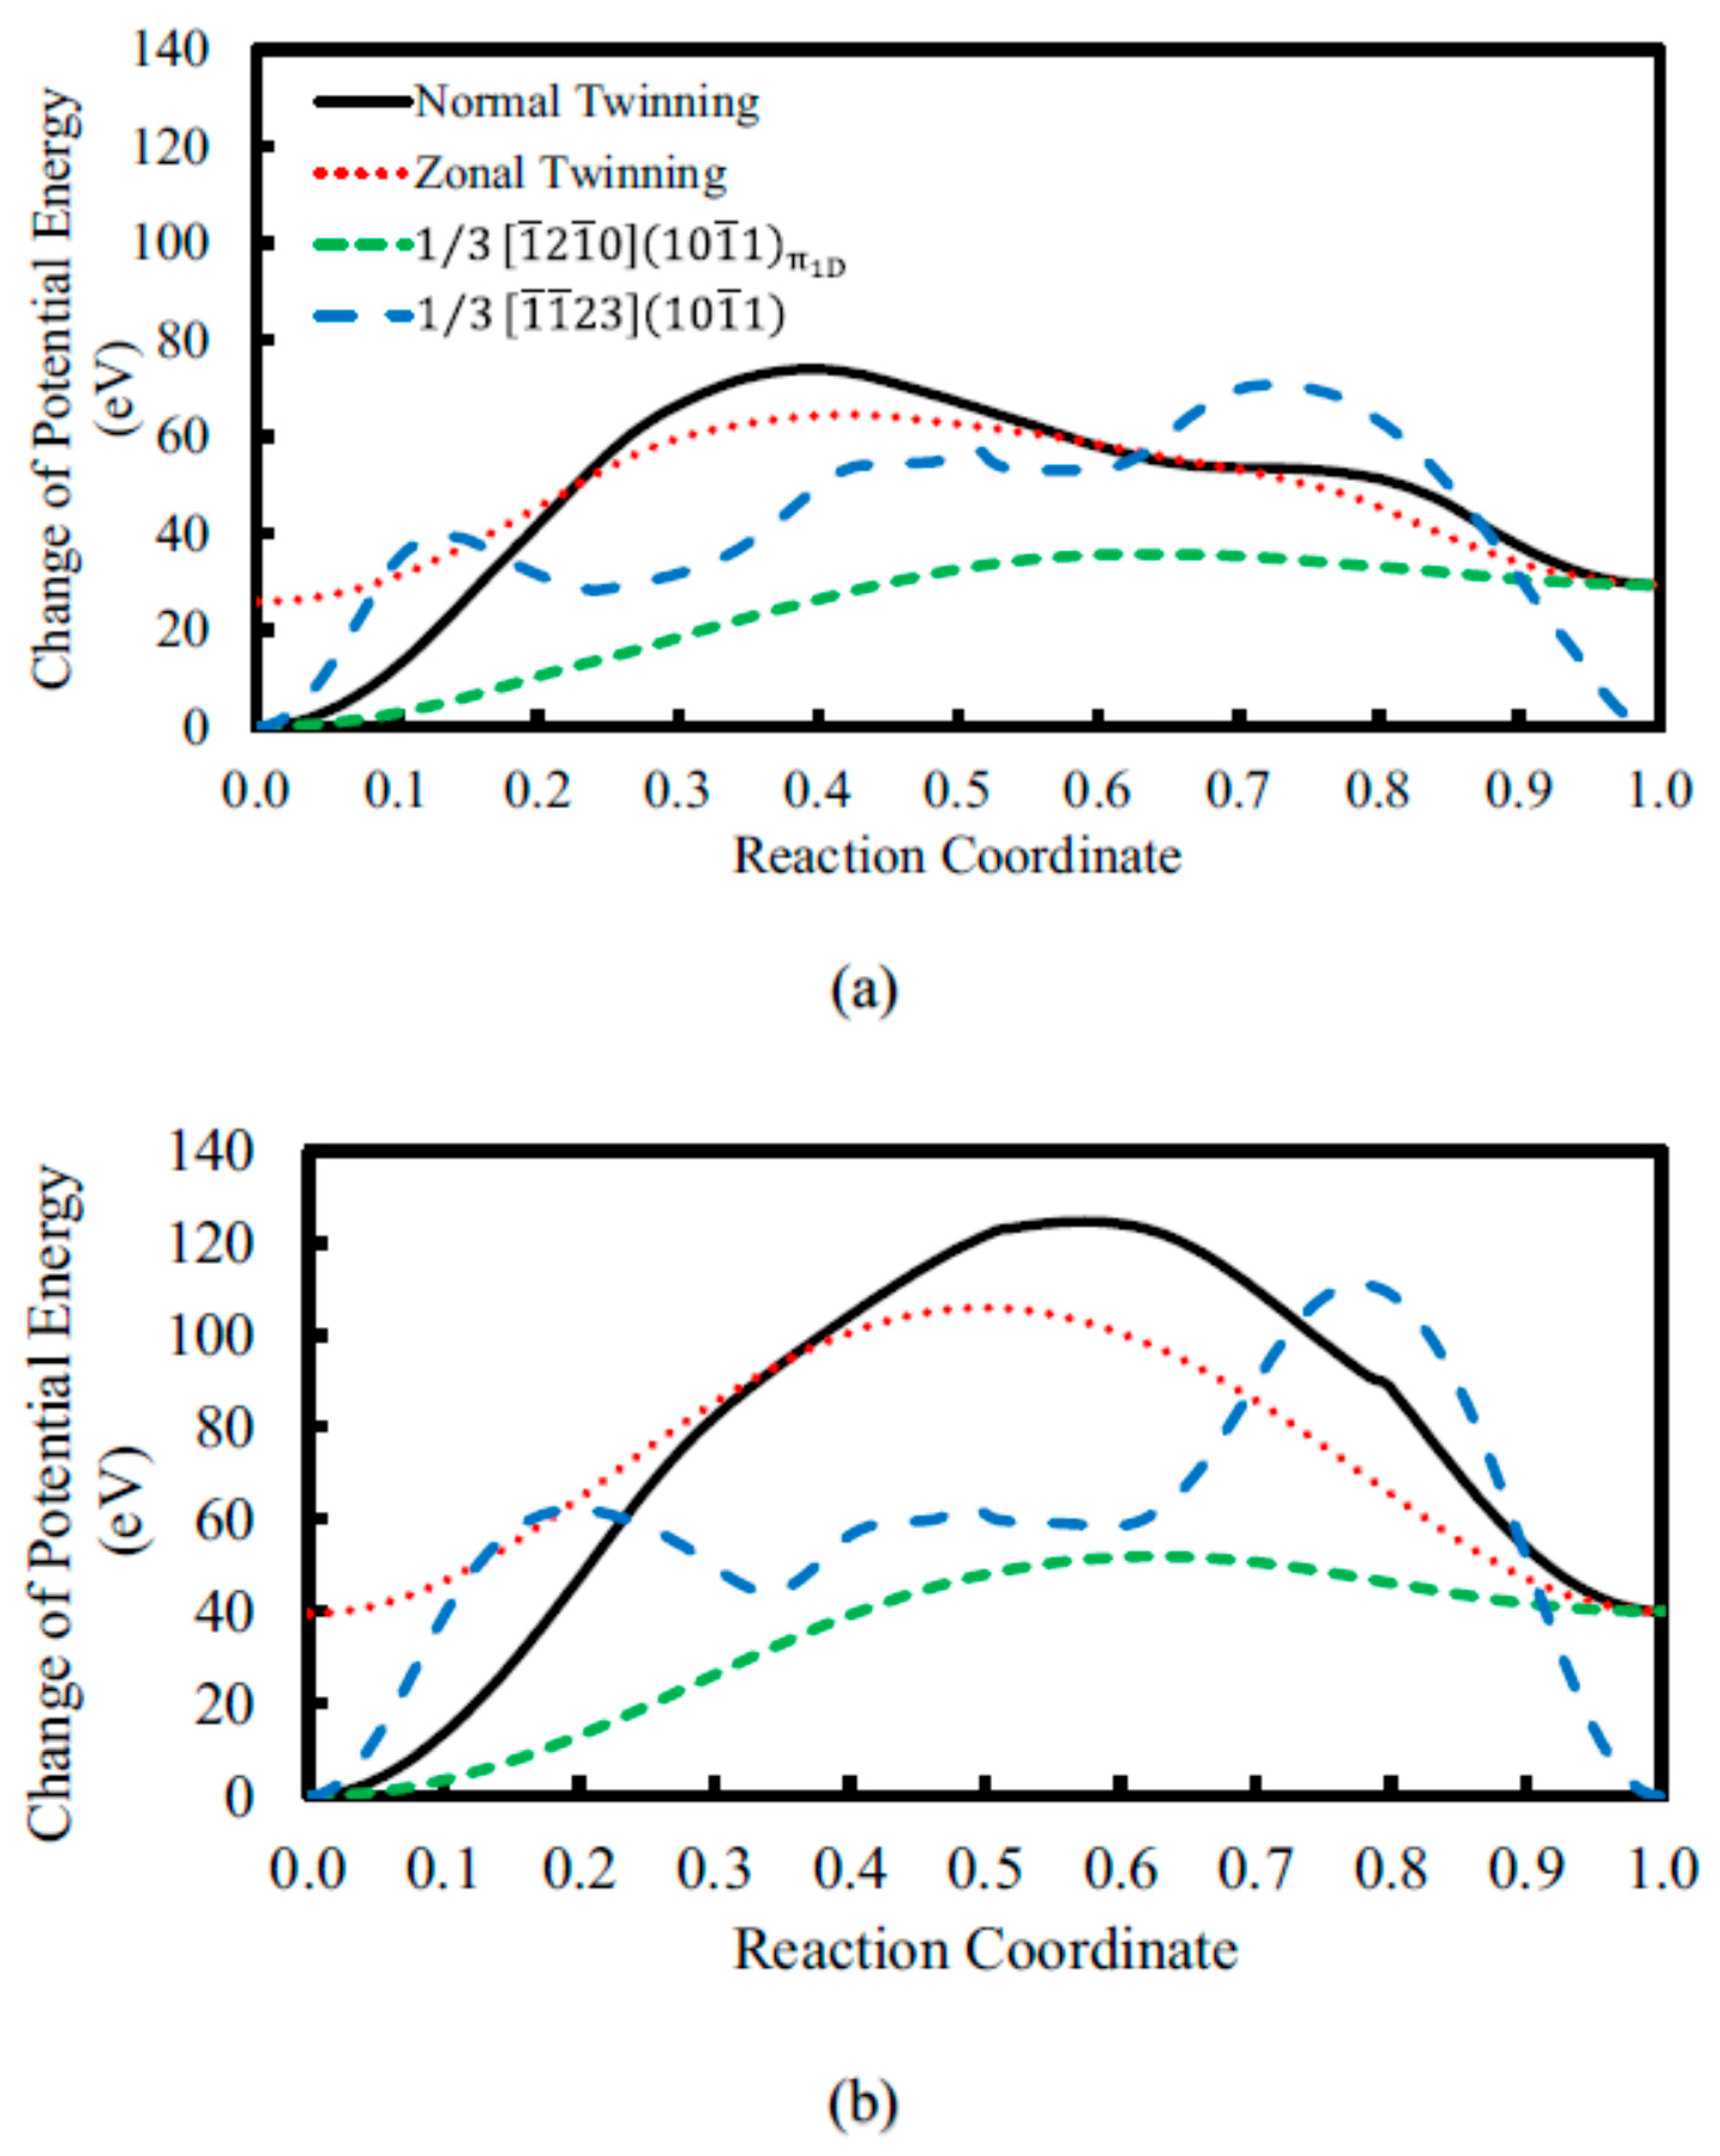
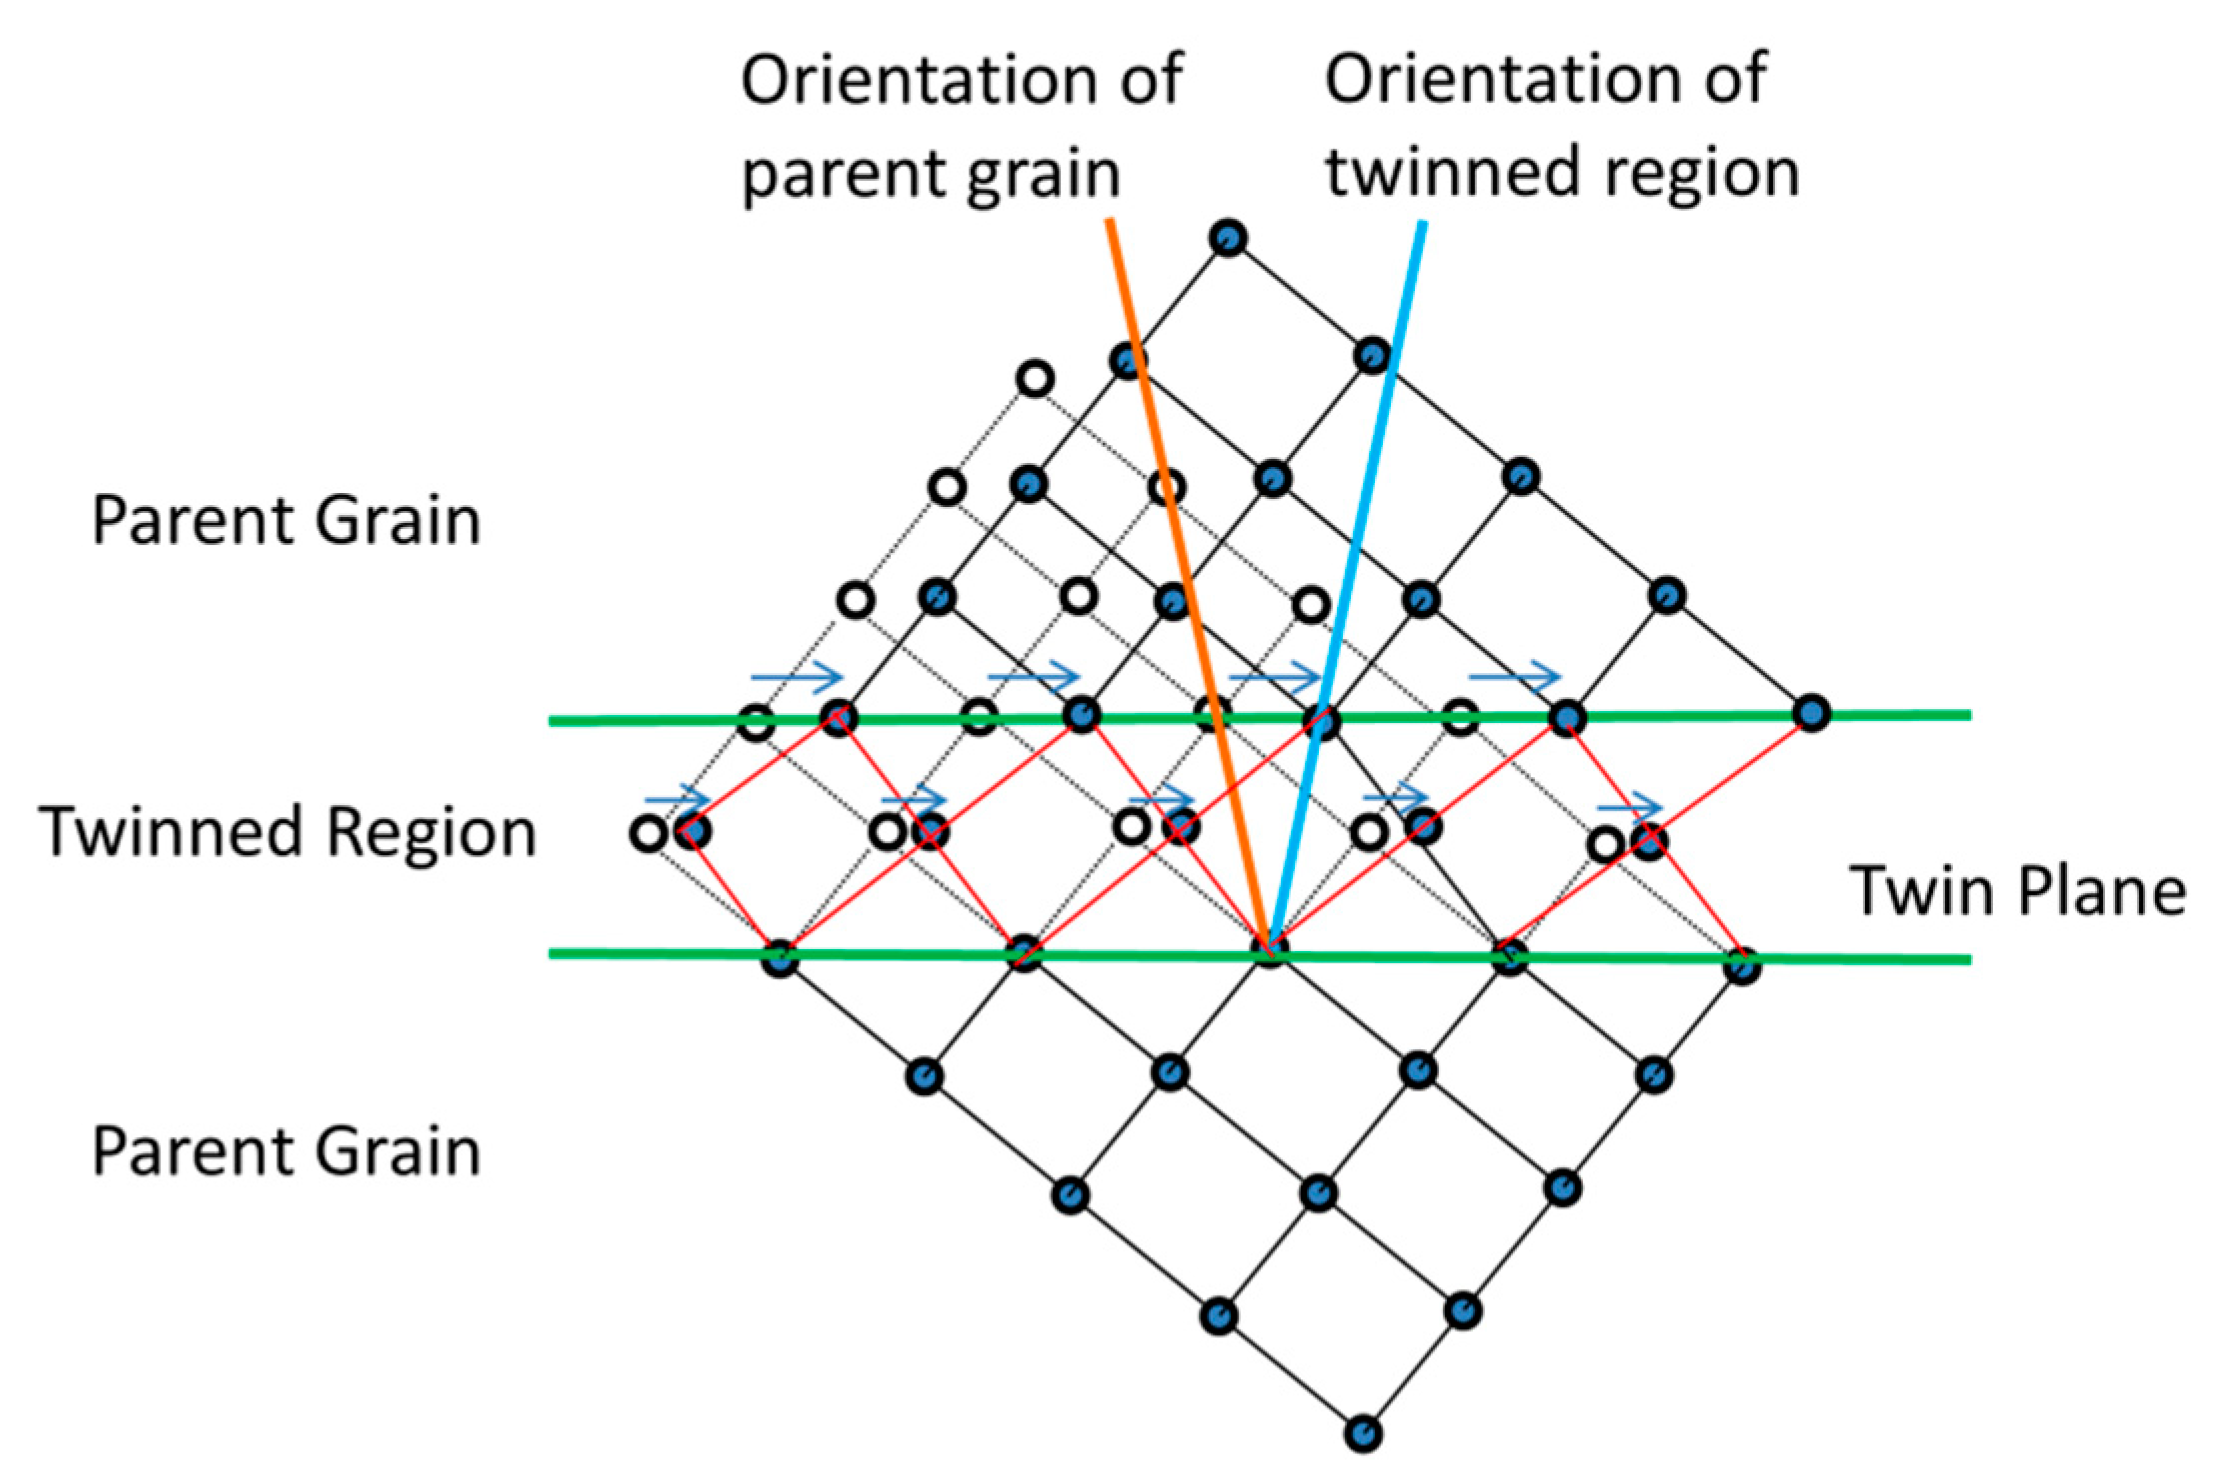
Namakian and Voyiadjis [40] incorporated atomistic simulations and proposed a new mechanism for { 10 1 ¯ 2 } 1 ¯ 011 twinning in which it was postulated that partial stacking faults (PSFs) play a key role in the formation of { 10 1 ¯ 2 } twins. A detailed crystallographic study was conducted for different HCP metals. Accordingly, PSFs were created by 1 3   10 1 ¯ 0 displacement vectors on every other basal plane and created a faulting plane on { 10 1 ¯ 2 } plane. Figure 1 shows the geometrical properties associated with the transformation of the untwinned parent into the twinned child unit cell. The model defines the properties of HCP crystals in a way that atoms can undergo spontaneous cooperative movements within these crystals. Accordingly, considerable stress relaxation occurs due to twin formation. This can be described using a deformation gradient, which shows that the macroscopic effect of the current mechanism is a simple shear process. Namakian et al. [41] incorporated atomistic simulations to model both deformation mechanisms of slip and twinning in single crystal Mg along with the interrelationships on the loose π_1L and dense π_1D first-order crystallographic planes. The generalized stacking fault energy (GSFE) analysis was used to investigate the slip mechanisms to study the 〈c + a〉 dislocation’s core structure, dissociation mechanism, and mobility. Namakian et al. [41] stated that the screw component of a dissociated pyramidal-I 〈a〉 dislocation had a key role in compression twinning (CTW) nucleation. They also showed that CTW can grow by activating pyramidal-I 〈a〉 slip on the preexisting twin boundaries. Figure 2 shows the minimum energy path (MEP) of four deformation mechanisms associated with π_1 plane, including homogeneous CTW nucleation, heterogeneous nucleation mechanism of pyramidal-I 〈c + a〉 slip, i.e., 1 / 3 [ 1 ¯ 1 ¯ 23 ] ( 10 1 ¯ 1 ) slip to CTW [ 1 ¯ 012 ] ( 10 1 ¯ 1 ) (or zonal twinning mechanism), heterogeneous nucleation mechanism of pyramidal- I 〈a〉 slip 1 / 3 [ 1 ¯ 2 1 ¯ 0 ] ( 10 1 ¯ 1 ) to CTW [ 10 1 ¯ 2 ¯ ] ( 10 1 ¯ 1 ) π 1 _ D , and pyramidal-I 〈c + a〉 slip 1 / 3 [ 1 ¯ 1 ¯ 23 ] ( 10 1 ¯ 1 ) using Liu et al. [42] embedded-atom method (EAM) and Wu et al. [43] modified embedded-atom method (MEAM) interatomic potentials. Namakian et al. [41] showed the importance of the interrelationships of non-basal slips and CTW on π_1 plane. They concluded that these interrelationships should be incorporated in simulation frameworks with larger length scales, including crystal plasticity, to accurately capture the mechanical response of Mg.
The deformation mechanisms and response of metallic systems and alloys have been studied using frameworks at different length scales spanning from density functional theory (DFT) [44,45], atomistic simulations [11,40,41,46,47,48,49,50,51,52,53,54,55,56], discrete dislocation dynamics [57,58], and continuum mechanics [59]. However, all these schemes except continuum mechanics suffer from length and time scale gaps to model a real-size sample or experiment. Crystal plasticity (CP) is a very powerful continuum mechanics framework to model the response of Mg alloys with both slip and twinning deformations. Various CP models have been developed to simulate slip and deformation in HCP polycrystals [60,61,62,63,64,65,66,67,68,69]. A combination of CP and finite elements, which is commonly known as CP finite element (CPFE), benefits the advantages of both frameworks. Two main categories of CPFE frameworks were developed to capture both slip and twinning deformations, which were developed by Staroselsky and Anand [63] using rate-independent formulation and Kalidindi [62] using rate-dependent formulation. In the case of Mg and its alloys, the rate-independent framework developed by Staroselsky and Anand [63] was used to model the slip along with twinning [66,68,69]. Kalidindi [62] introduced a modified plastic velocity gradient tensor by incorporating twinning. Various researchers have included twinning into their CPFE framework following the formulations introduced by Kalidindi [62], such as Abdolvand and his coworkers [65,70,71,72] and Zhang and Joshi [67]. Qiao et al. [73] included the stress relaxation due to twinning into the CPFE formulation, a CPFE framework that can capture the stress relaxation effect for twinning. Hama et al. [74] incorporated twinning into the CPFE framework to model the anisotropy of Mg alloy sheets subjected to a two-step loading. Prasad et al. [75] simulated the ductile fracture in pure Mg by adding the twinning to plane strain CPFE.
The CP models were used in combination with other schemes to model twinning. One of these candidates was a viscoplastic self-consistent (VPSC), which was first used by Lebensohn and Tomé [76] to model the twinning that occurred in zirconium alloys. Agnew et al. [77] used the VPSC to model the slip and twinning in Mg alloys. Beyerlein and Tomé [12] simulated the twinning in pure zirconium using VPSC by introducing a probabilistic model for the twin nucleation. Kumar et al. [78] used a full-field elasto-viscoplastic model based on fast Fourier transformation (FFT), which included twinning to model the response of Mg. Lévesque et al. [79] introduced twinning into a Taylor-type CP model to simulate the response of AM30 and AZ31B Mg alloys. The multiscale framework of VPSC-FE was incorporated to simulate the slip and twinning deformations [80,81,82]. Accordingly, the response of each FE material point was defined using an RVE, which was modeled by VPSC. A similar multiscale scheme has been used by Ardeljan et al. [83] and Feather et al. [84] to simulate the response of Mg alloys in which an RVE modeled by a Taylor-type CP defines the constitutive model of an FE material point. A CP model has also been coupled with a phase field method to better describe the twin morphology in HCP metals [85,86].
Most of the studies have focused on the response of the Mg alloys during monotonic loading, which only requires the deformation slip and twinning. In the case of more complex strain paths such as cyclic loading, however, detwinning should also be defined in the CP model. A meso-scale composite grain (CG) model was the first detwinning model, which was included in the VPSC framework [87,88]. An empirical model defines the twin nucleation and propagation in the CG model. Guillemer et al. [89] used a simple phenomenological detwinning model along a self-consistent model to capture the cyclic behavior of extruded Mg. The first physically-based model, which includes both mechanisms, was the Twinning-Detwinning (TDT) model developed by Wang and his coworkers [90,91,92], which was used along the EVPSC framework. Qiao et al. [93] modeled the cyclic response of the ZK60A Mg alloy using the TDT/EVPSC scheme. The twinning and detwinning can be effectively handled by EVPSC framework by introducing new grains as twin nucleation and removing that twinned grain for complete detwinning, while the change in the volume of the twinned grain manifests the twin growth or shrinkage. However, in the case of studying the local variable information in a polycrystal, one cannot use the EVPSC model. One way to obtain the local information is using the CPFE framework to capture twinning and detwinning mechanisms. However, most of the CPFE models introduced to capture the twinning and detwinning mechanisms are phenomenological and neglect some of the main elements of the deformation twinning and detwinning. The biggest challenge in CPFE is that the introduction of twin nucleation, growth, shrinkage, and detwinning is not as straightforward as EVPSC. In the case of Mg and its alloys, the CPFE method has been used recently to model the cyclic behavior, including twinning and detwinning [22,94,95,96,97]. A material point is treated in these models as two states of twinned or not twinned, and the reorientation criteria are commonly based on the most active twinning system, which is called the predominant twinning reorientation (PTR) scheme [61]. Before the reorientation, the stress inside the twinned region does not contribute to the stress state of the material point, while after reorientation, the stress state inside the parent grain is neglected. However, the stress state of the twinned region and untwinned region are not similar, which was shown using in-situ experiments [26,34]. Yaghoobi et al. [9] introduced a multiscale CPFE framework in which the deformation twinning and detwinning were captured using a physically-based TDT model proposed by Wang and his coworkers [90,91,92]. They used a Taylor-type homogenization scheme to model both twinned and untwinned regions, coexisting at a material point.
Traditional crystal plasticity models were developed largely without a connection to grain size and shape effects. In Magnesium alloys, it has been observed that the grain size strengthening follows the Hall–Petch effect [98]. The incorporation of grain size effect into constitutive models for single slip began in 1962 with Armstrong et al. [99], who modified the Hall–Petch equation to correspond to the flow stress on a slip system (the “micro-Hall–Petch relation”). The interrelationship between grain size and texture was not considered until 1983, when Weng [100] employed the mean grain size in the equation for slip system resistance through the micro-Hall–Petch relation. Sun and Sundararaghavan [101] presented a crystal plasticity model for grain size and shape effects where the slip length of each slip system at a material point was considered in a micro-Hall–Petch strengthening term for each slip system. Recent HREBSD experiments [102] in Mg-4Al alloy have revealed the interaction of slip systems and grain boundaries is dependent on not only the slip length but also strongly on the angle between the incoming and emerging slip planes at a grain boundary. In the future, there is a need to better incorporate such insights in crystal plasticity.
In the current work, a review of works available in the literature, which addresses different properties of Mg and its alloys using crystal plasticity models, is presented. In addition to slip and twinning, detwinning is another deformation mechanism, which is activated in Mg and its alloys. The different models that capture detwinning will also be addressed here. Finally, the recent experimental frameworks, such as in-situ neutron diffraction, 3D high energy synchrotron X-ray techniques, and digital image correlation under scanning electron microscopy (SEM-DIC), are incorporated along crystal plasticity models to investigate the properties of Mg and its alloys are addressed. Future research directions towards improving the deformation response of Mg and its alloys are identified, which can lead to increased deployment of the lightest structural metal in engineering applications.

2. Crystal Plasticity Models

2.1. Overview

The CP theory is developed according to the assumption that the plasticity in metals and alloys occurs as a result of slip-on prescribed slip systems. The finite deformation continuum mechanics is usually incorporated to describe the formulation. The deformation gradient tensor F is decomposed as below:
F = F e F p
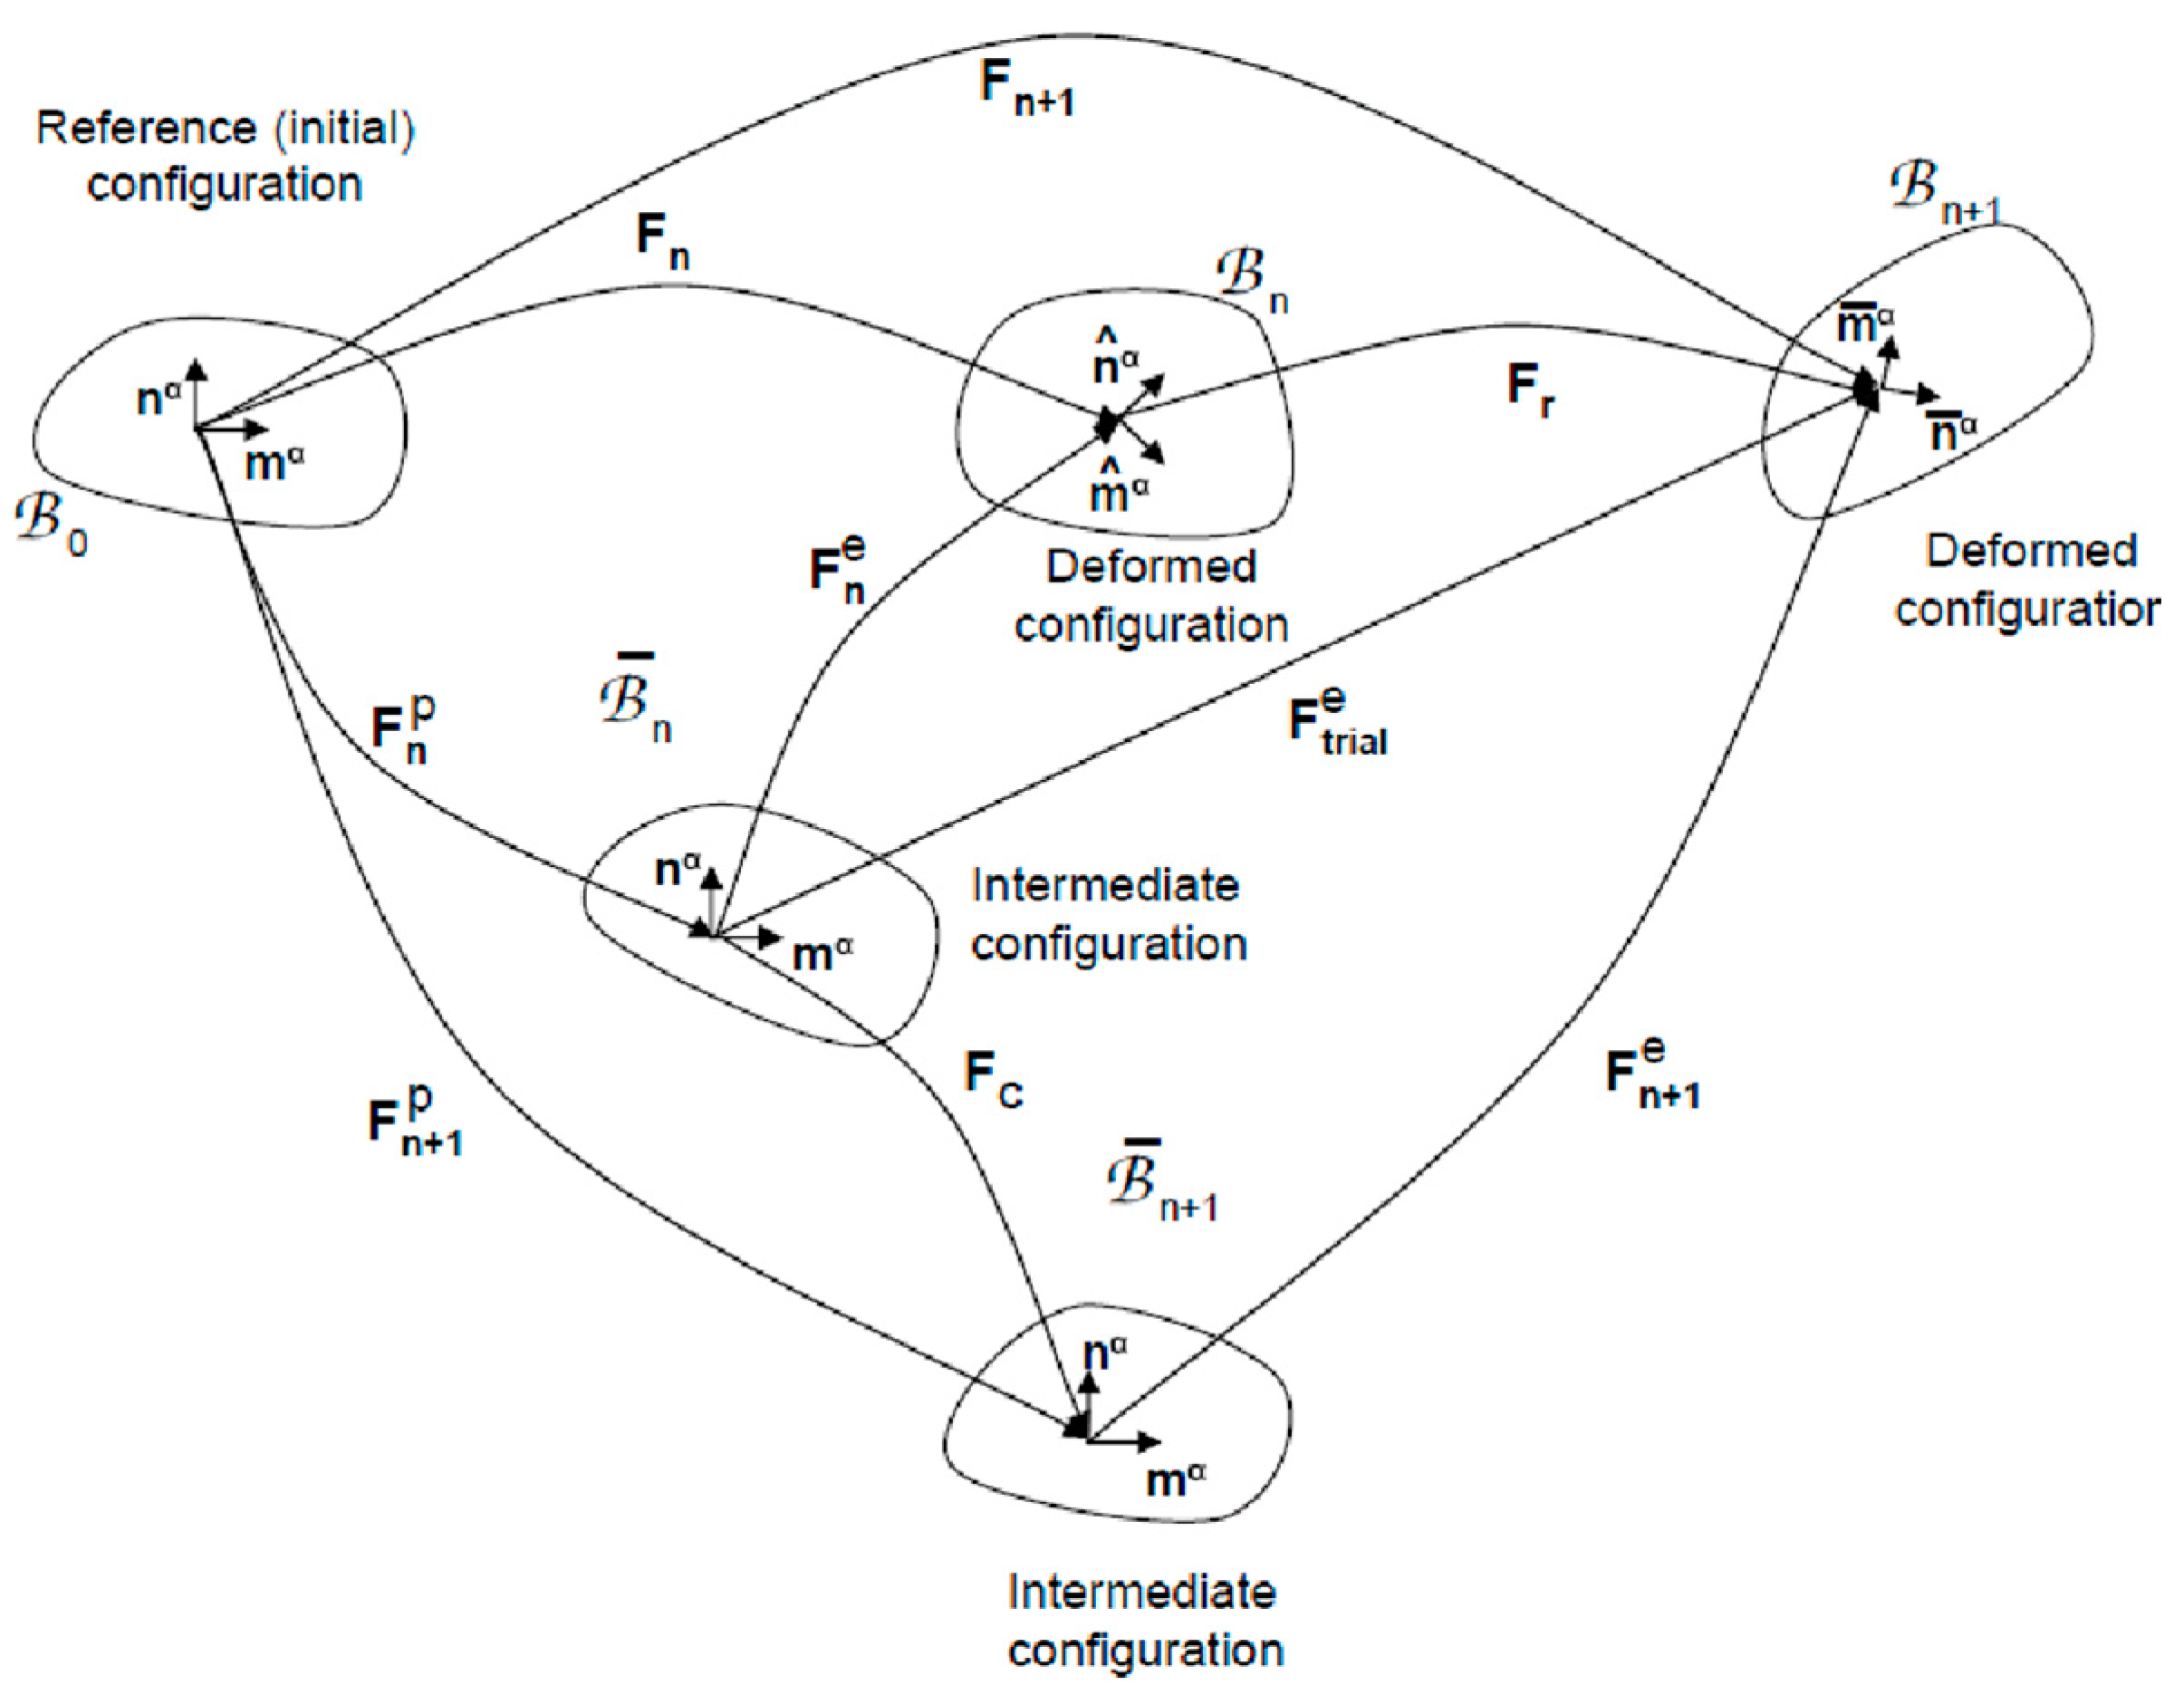
where F e and F p are the elastic and plastic deformation gradients, respectively. Figure 3 shows the deformation described in Equation (1). Elastic distortion of the crystal lattice and plastic slip are two deformation mechanisms, which sustain the applied deformation in this formulation. Accordingly, the macroscopic velocity gradient L can be decomposed as below:
L = L e + L p
where L e and L p are the elastic and plastic velocity gradients, respectively. The novel relation of CP is to link the macroscopic velocity gradient L p to micro deformation γ ˙ α as below:
L p = α = 1 N s γ ˙ α S α
where γ ˙ α is the shearing rate on slip system α , N s is the number of slip systems, and S α is the Schmid tensor for the slip system α , which can be defined as follows:
S α = m α n α
where unit vectors m α and n α denote the slip direction and slip plane normal, respectively, in the deformed configuration.
The resolved shear stress on the slip system α can be obtained as follows:
τ α = σ S α
where σ is the Cauchy stress tensor and operator denotes the standard inner product of tensors. The shearing rate on the α th slip system γ α can be calculated depending on if the CP formulation is rate-independent or rate-dependent. In the case of a rate-independent model, the yield surface is defined for each system, i.e., f α , as follows:
f α = | τ α | s α
where s α is the slip resistance for slip system α. The values of γ ˙ α is then obtained using the yield surface and considering the hardening model, which describes the evolution of slip resistance.
In the case of rate-dependent formulation, the evolution of shearing rate on the α th slip system γ α can be defined as follows:
γ ˙ α = γ ˙ 0 | τ α s α | 1 / m sign [ τ α ]
where γ ˙ 0 and m are the material parameters denoting the reference shearing rate and rate sensitivity of the material. One should note that the kinematic hardening is neglected in both Equations (6) and (7).

2.2. Twinning

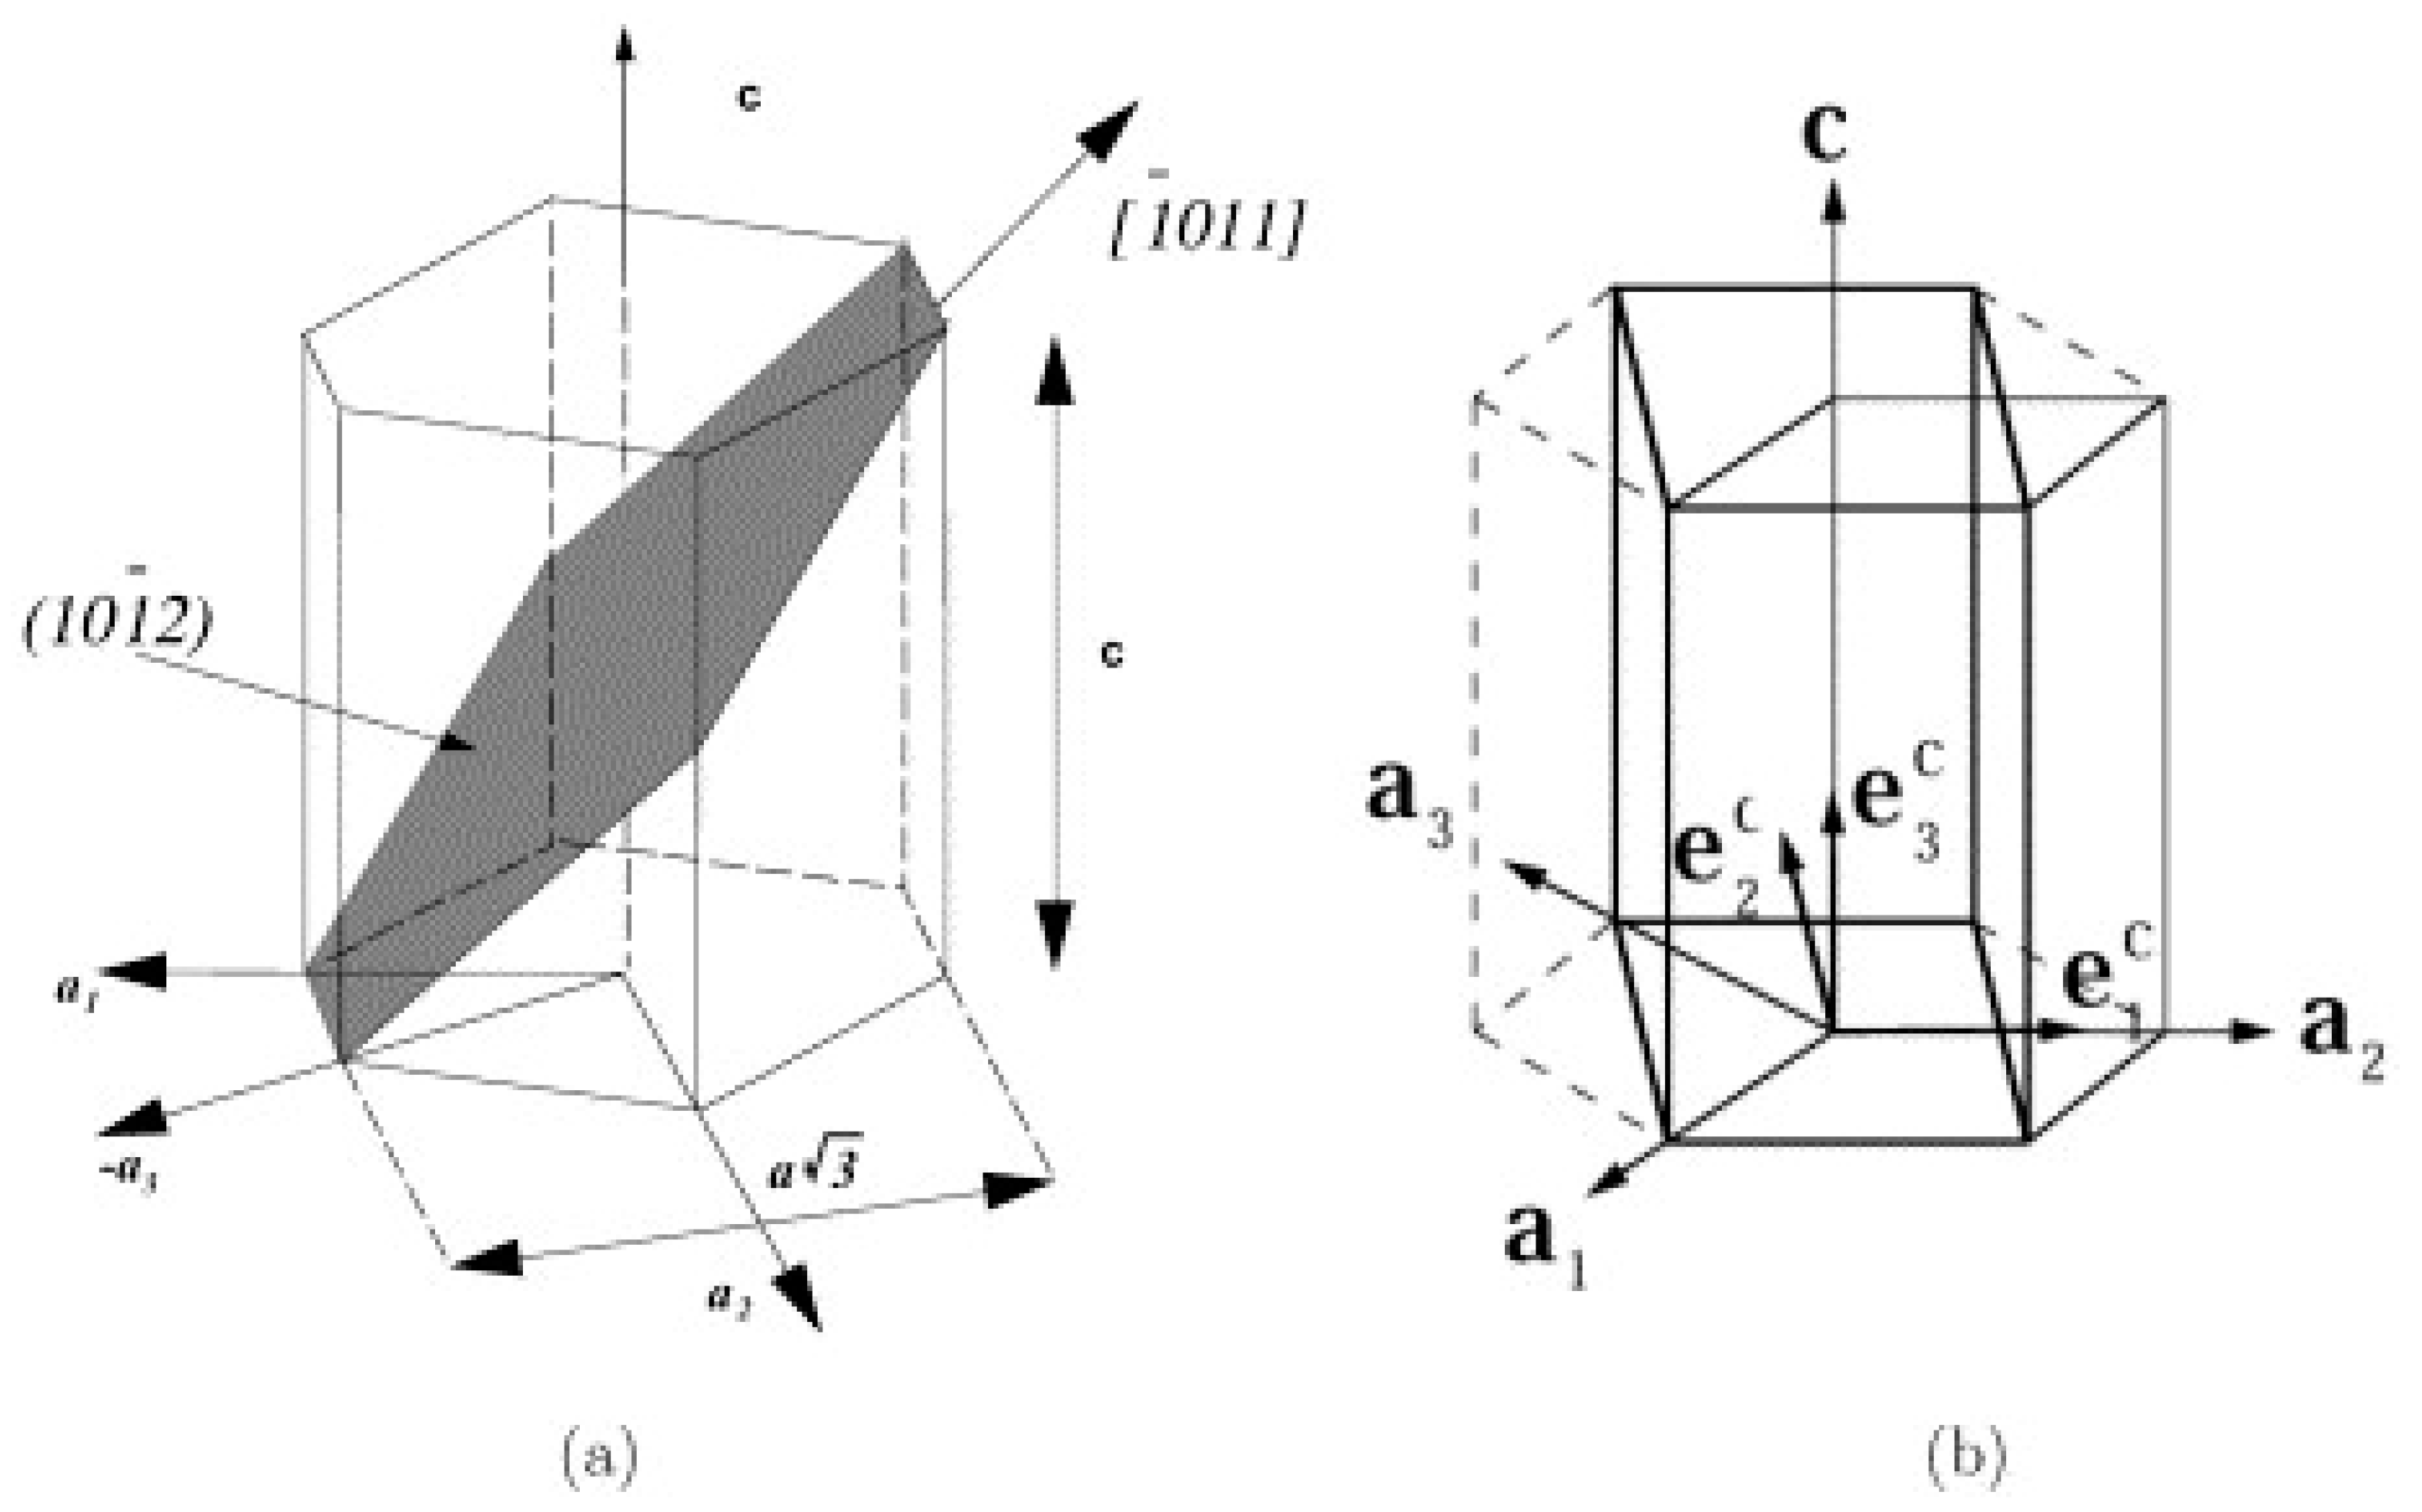
In the case of Mg and its alloys, extension twinning { 10 1 ¯ 2 } 1 ¯ 011 is very important, along with the plastic slip (Figure 4). The simplest modification to include twinning into the CP formulation is to consider twinning as pseudo-slip systems (See, e.g., Staroselsky and Anand [64]), and their contribution to the plastic velocity gradient tensor can be described as follows:
L p = α = 1 N s + N t γ ˙ α S α  
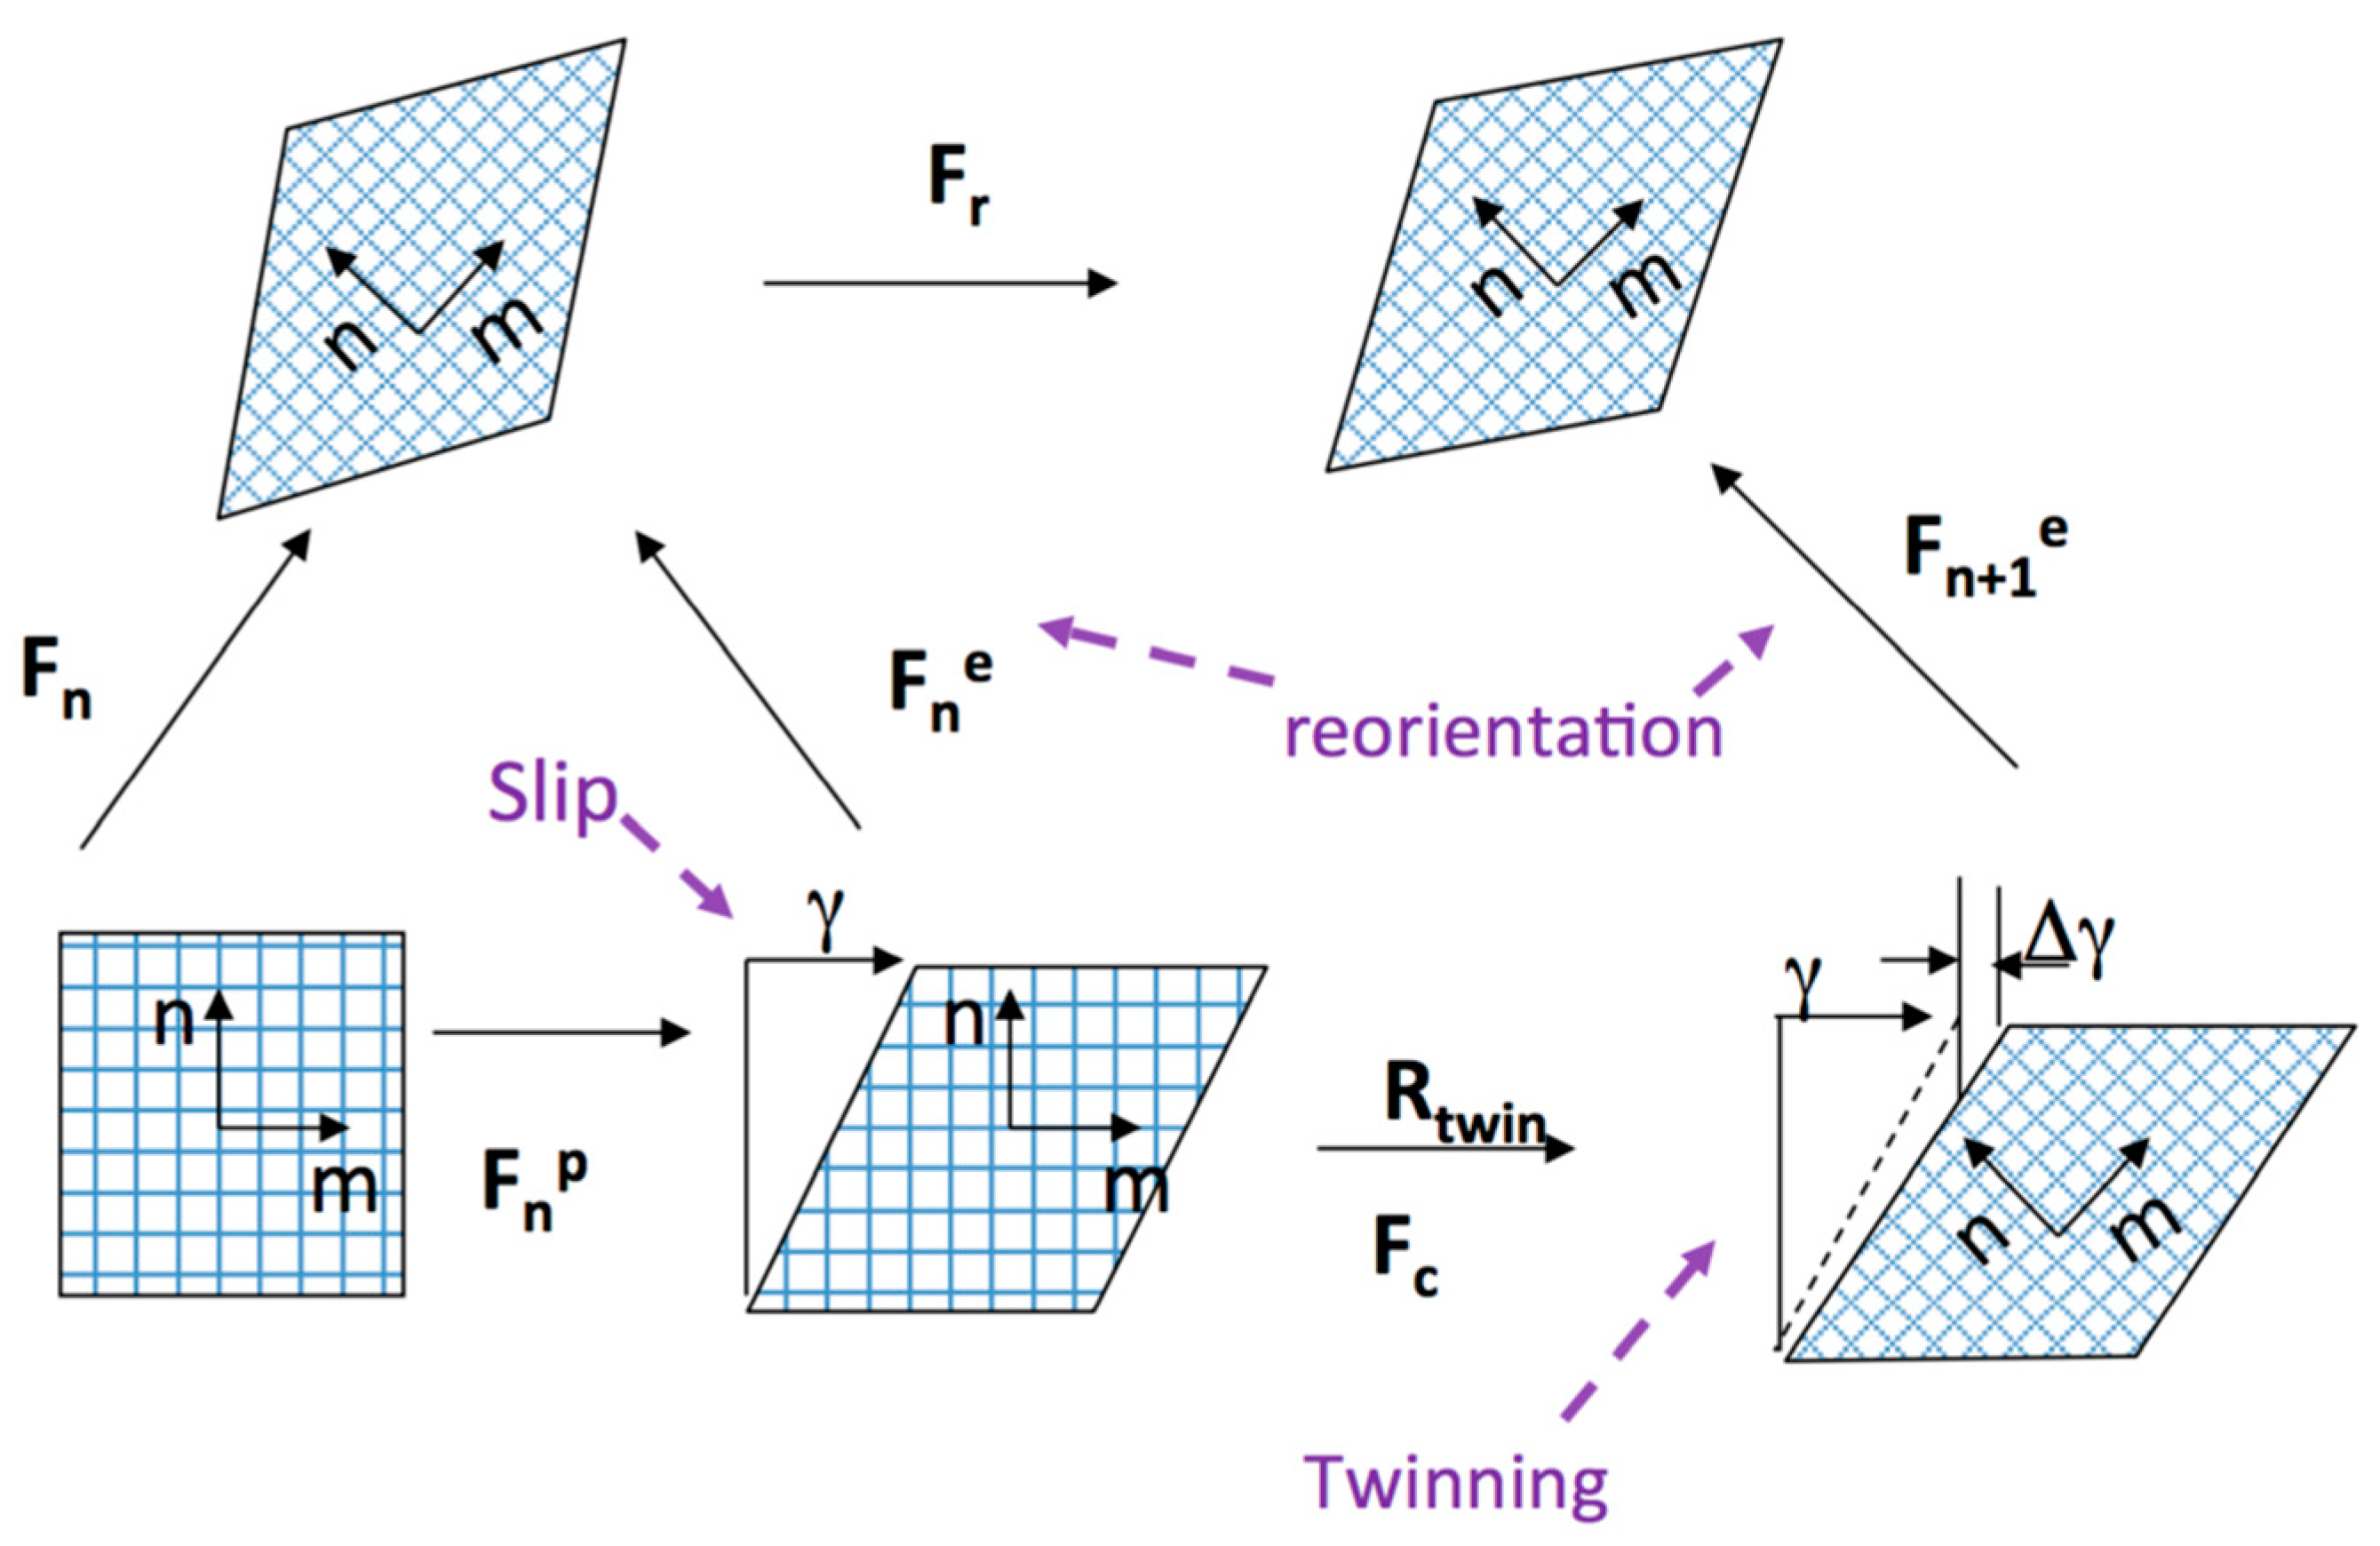
where N t is the number of twinning systems. Figure 5 shows the kinetics of slip and twinning defined in Equation (8). The relation between the plastic slip of twinning systems and their corresponding twin volume fraction can be described as follows:
f ˙ β = γ ˙ β S
where f ˙ β is the rate of change in twin volume fraction of twin pseudo-slip system β and S is the characteristic twin shear strain, which defines the amount of shear associated with twinning. The value of S depends on the c / a ratio, which can be defined as follows [104]:
S = 3 c / a c / a 3
where a and c are depicted in Figure 4. In the case of Mg and its alloys, the S = 0.129 .
Although the twin pseudo-slip system’s contribution to plastic velocity gradient tensor is similar to that of the slip systems, they are not precisely treated similarly due to the polar nature of twinning. In other words, only the tensile component of stress along the c-axis can trigger the extension twinning. This is reflected in the CP formulation for the twinning pseudo-slip systems as follows:
{ i f   σ : S β 0 τ β = 0 i f   σ : S β > 0 τ β = σ : S β
Kalidindi [62] further enhanced the effect of twinning on crystal plasticity formulation. The work considers the contribution of stress in both untwinned and twinned region as follows:
σ = ( 1 β = 1 N t f β ) σ mt + β = 1 N t f β σ tw , β
where f β is the reoriented volume fraction of grain according to the twin system β . Kalidindi [62] then presented the modified macroscopic plastic velocity gradient tensor L p , which includes the contribution of multiple twinned systems as below:
L p = ( 1 β = 1 N t f β ) α = 1 N s γ ˙ α S sl α + α = 1 N t S f ˙ β S tw β + β = 1 N t f β ( α = 1 N s t w γ ˙ α S sl tw α   )  
where S sl α , S tw β , and S sl tw α denote the Schmid tensors for the slip systems in parent grain, twin systems in parent grain, and slip systems in twinned children, respectively. N s t w denotes the number of slip systems in the twinned region. Equation (10) describes three mechanisms contributing to the plastic velocity gradient L p . The first term defines the contribution of slip inside the parent grain, the second term defines the contribution of twin systems in parent grain, and the third term is the summation of the contributions of slip systems in all twinned children.
In the twinning models, there is a key part that should be defined as the reorientation. Figure 6 shows the crystallography of the deformation twinning, which includes the untwinned region (parent grain) and twinned region (child). While Equation (9) defines the amount of twin volume required for a certain amount of shear strain, it does not define the reorientation in the model. Different criteria have been introduced for the reorientation. Van Houtte [60] was the first researcher to propose a method for reorientation. In this method, reorientation of the grain is decided depending on the volume fractions calculated at every incremental step along with using a random criterion. Tomé et al. [61] modified the model presented by Van Houtte [60] using the predominant twin reorientation scheme (PTR) in which the grain is reoriented according to its predominant twin variant as the integration of twin volume throughout the time satisfy specific criteria.

2.3. Stress Relaxation

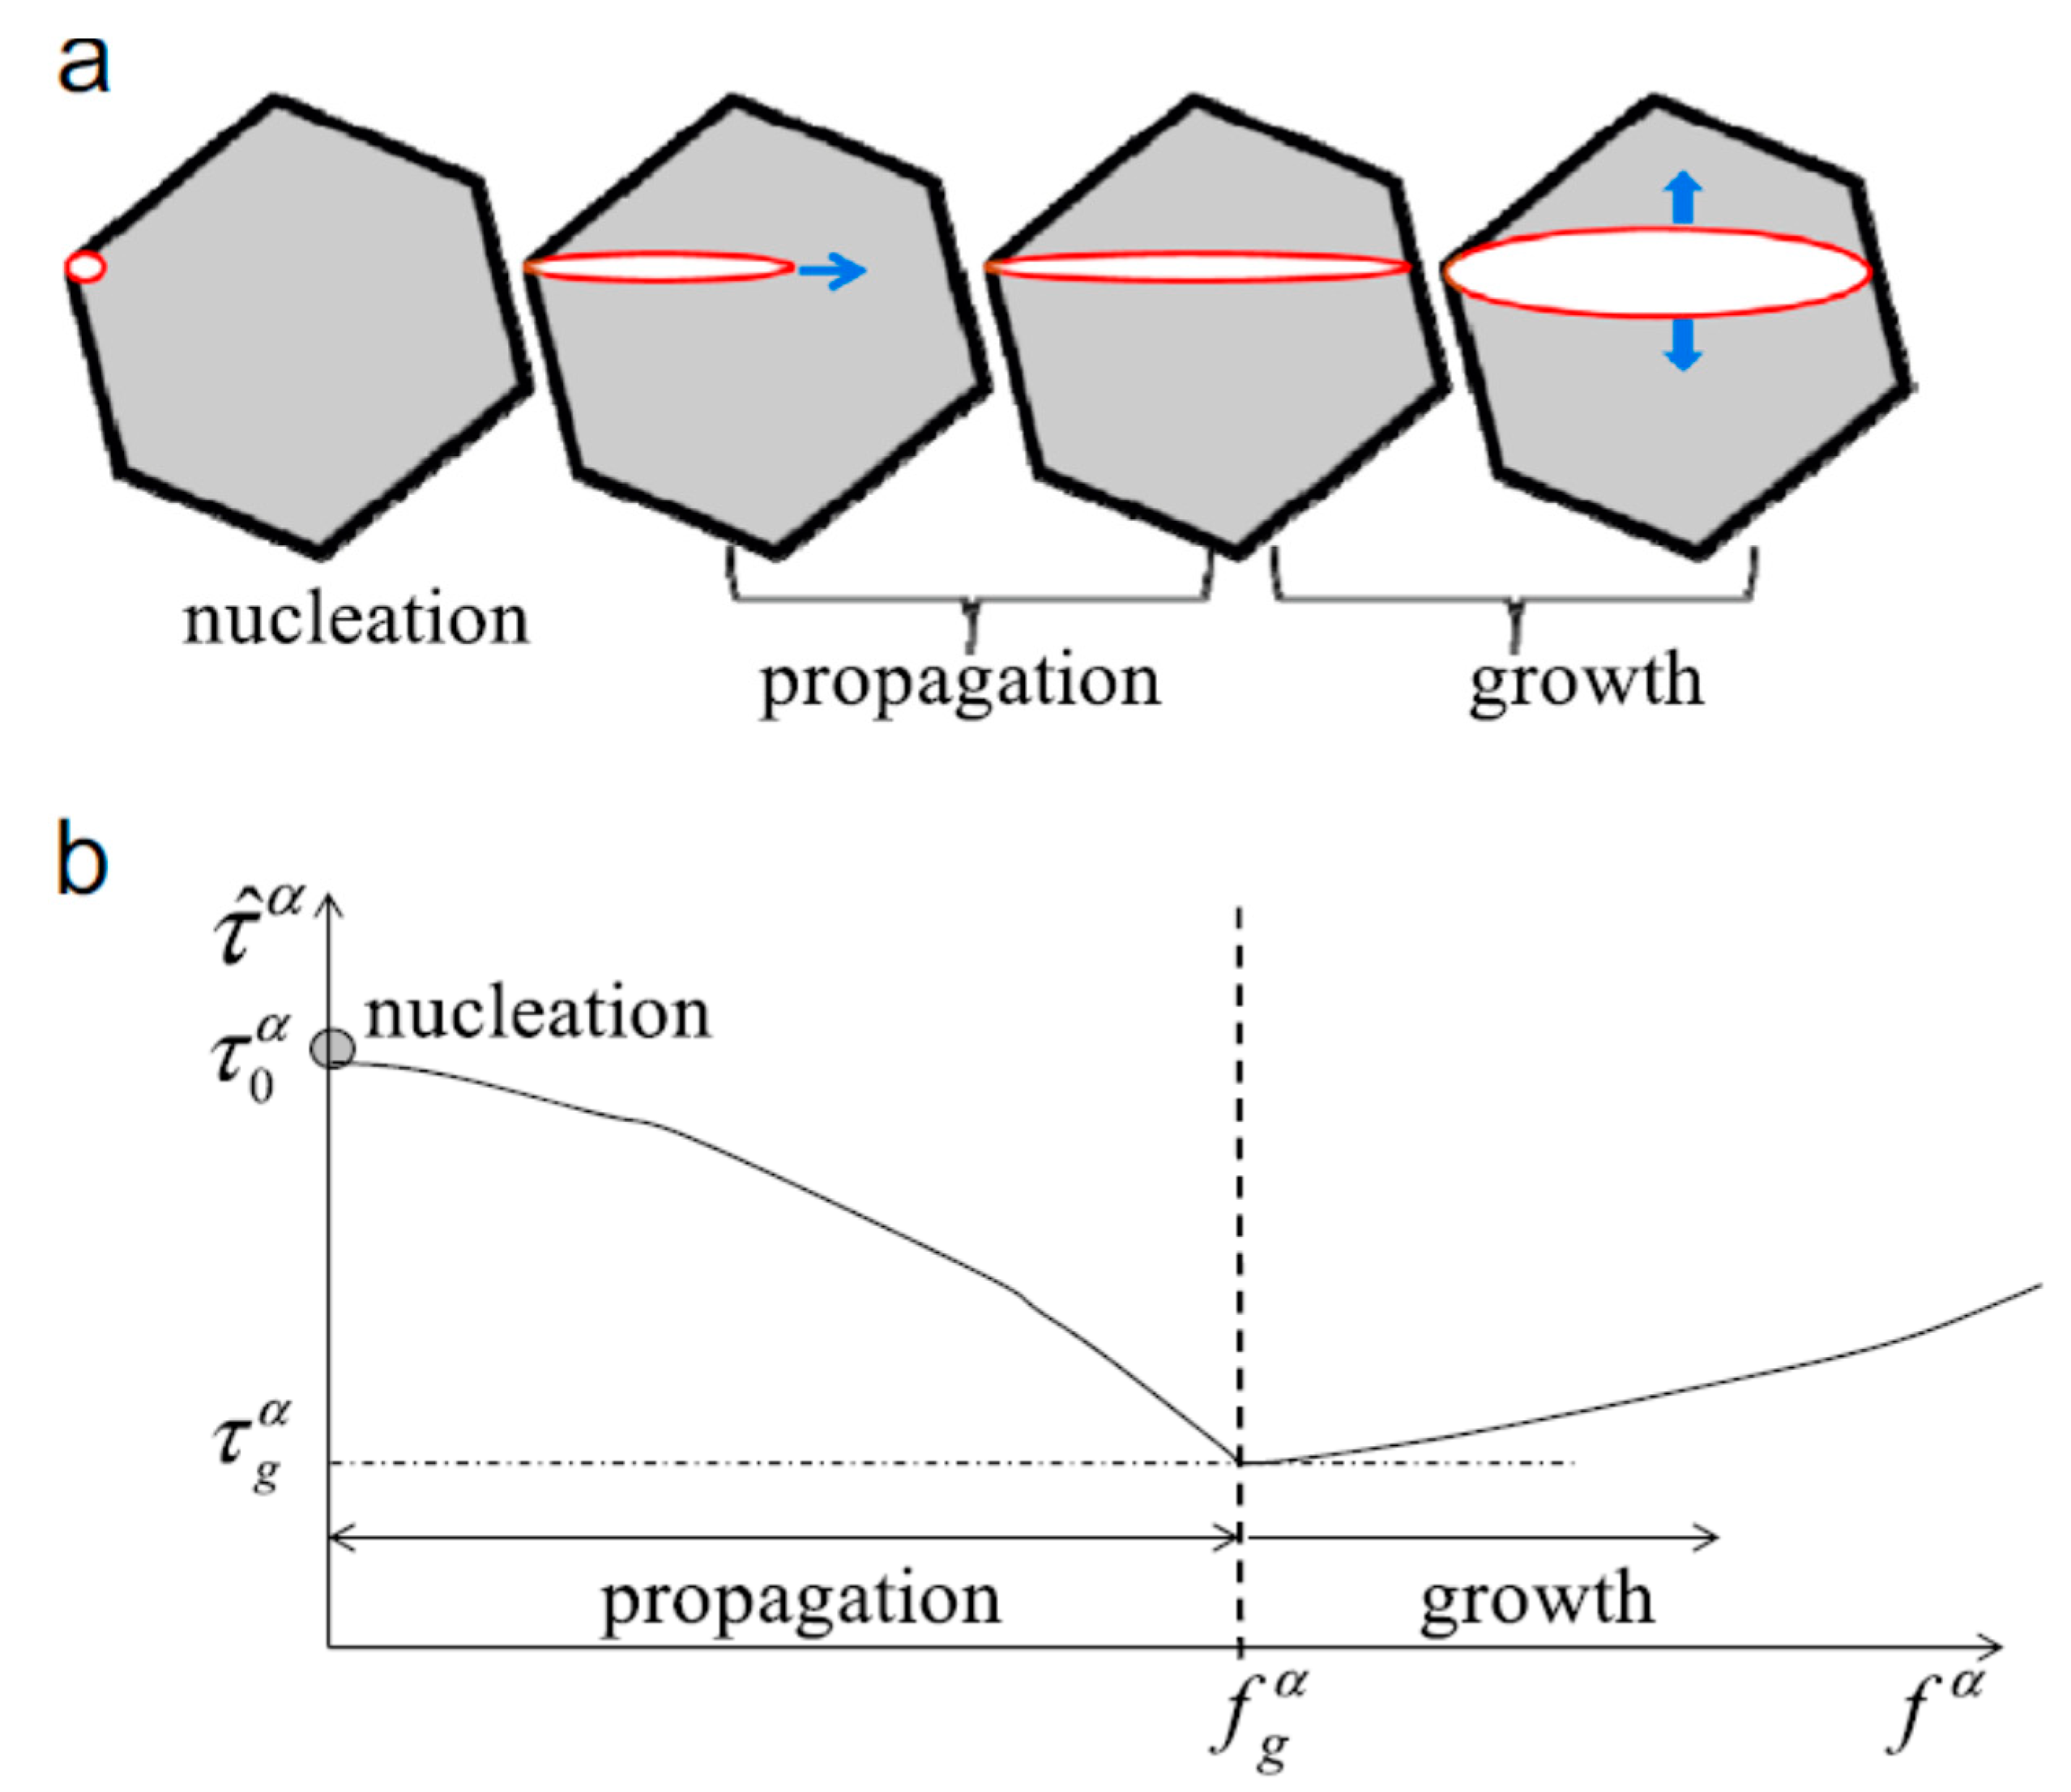
The in-situ neutron diffraction experiment on the Mg alloy showed that the stress relaxation occurs in the twinned region compared to the untwinned region of grain [34]. Different crystal plasticity models were incorporated to capture the stress relaxation during twinning. The simplest model is to consider larger CRSSs for twin nucleation than growth [12,93]. Wu et al. [105] presented a comprehensive physically-based twin model implemented in the EVPSC framework. They presented this twin model, which was called ‘TNPG,’ to capture twin nucleation, propagation, and growth for magnesium alloys (Figure 7). In Figure 7a, the twinning process initiates with twin nucleation. It is assumed that the grain boundary is the preferred nucleation site. As the twin propagates according to Figure 7b, stress relaxation occurs. Different notation is used throughout the current review for twinning resistance as s α compared to the one used by Wu et al. [105], which used τ ^ α (Figure 7). The twinning resistance s α decreases during the propagation phase until it reaches its minimum value of s g α when the twin volume is f α = f g α . Afterward, the twinning resistance increases due to the hardening occurring in the twin thickening process. Wu et al. [105] captured the stress relaxation by modifying the twin systems resistances s α as follows:
s α = { s 0 α s 0 α s g α f g α f α             ( if   f α f g α ) s g α + ( s 1 α + h 1 α Γ α ) ( 1 exp ( h 0 α s 1 α Γ α ) )             ( if   f α > f g α )
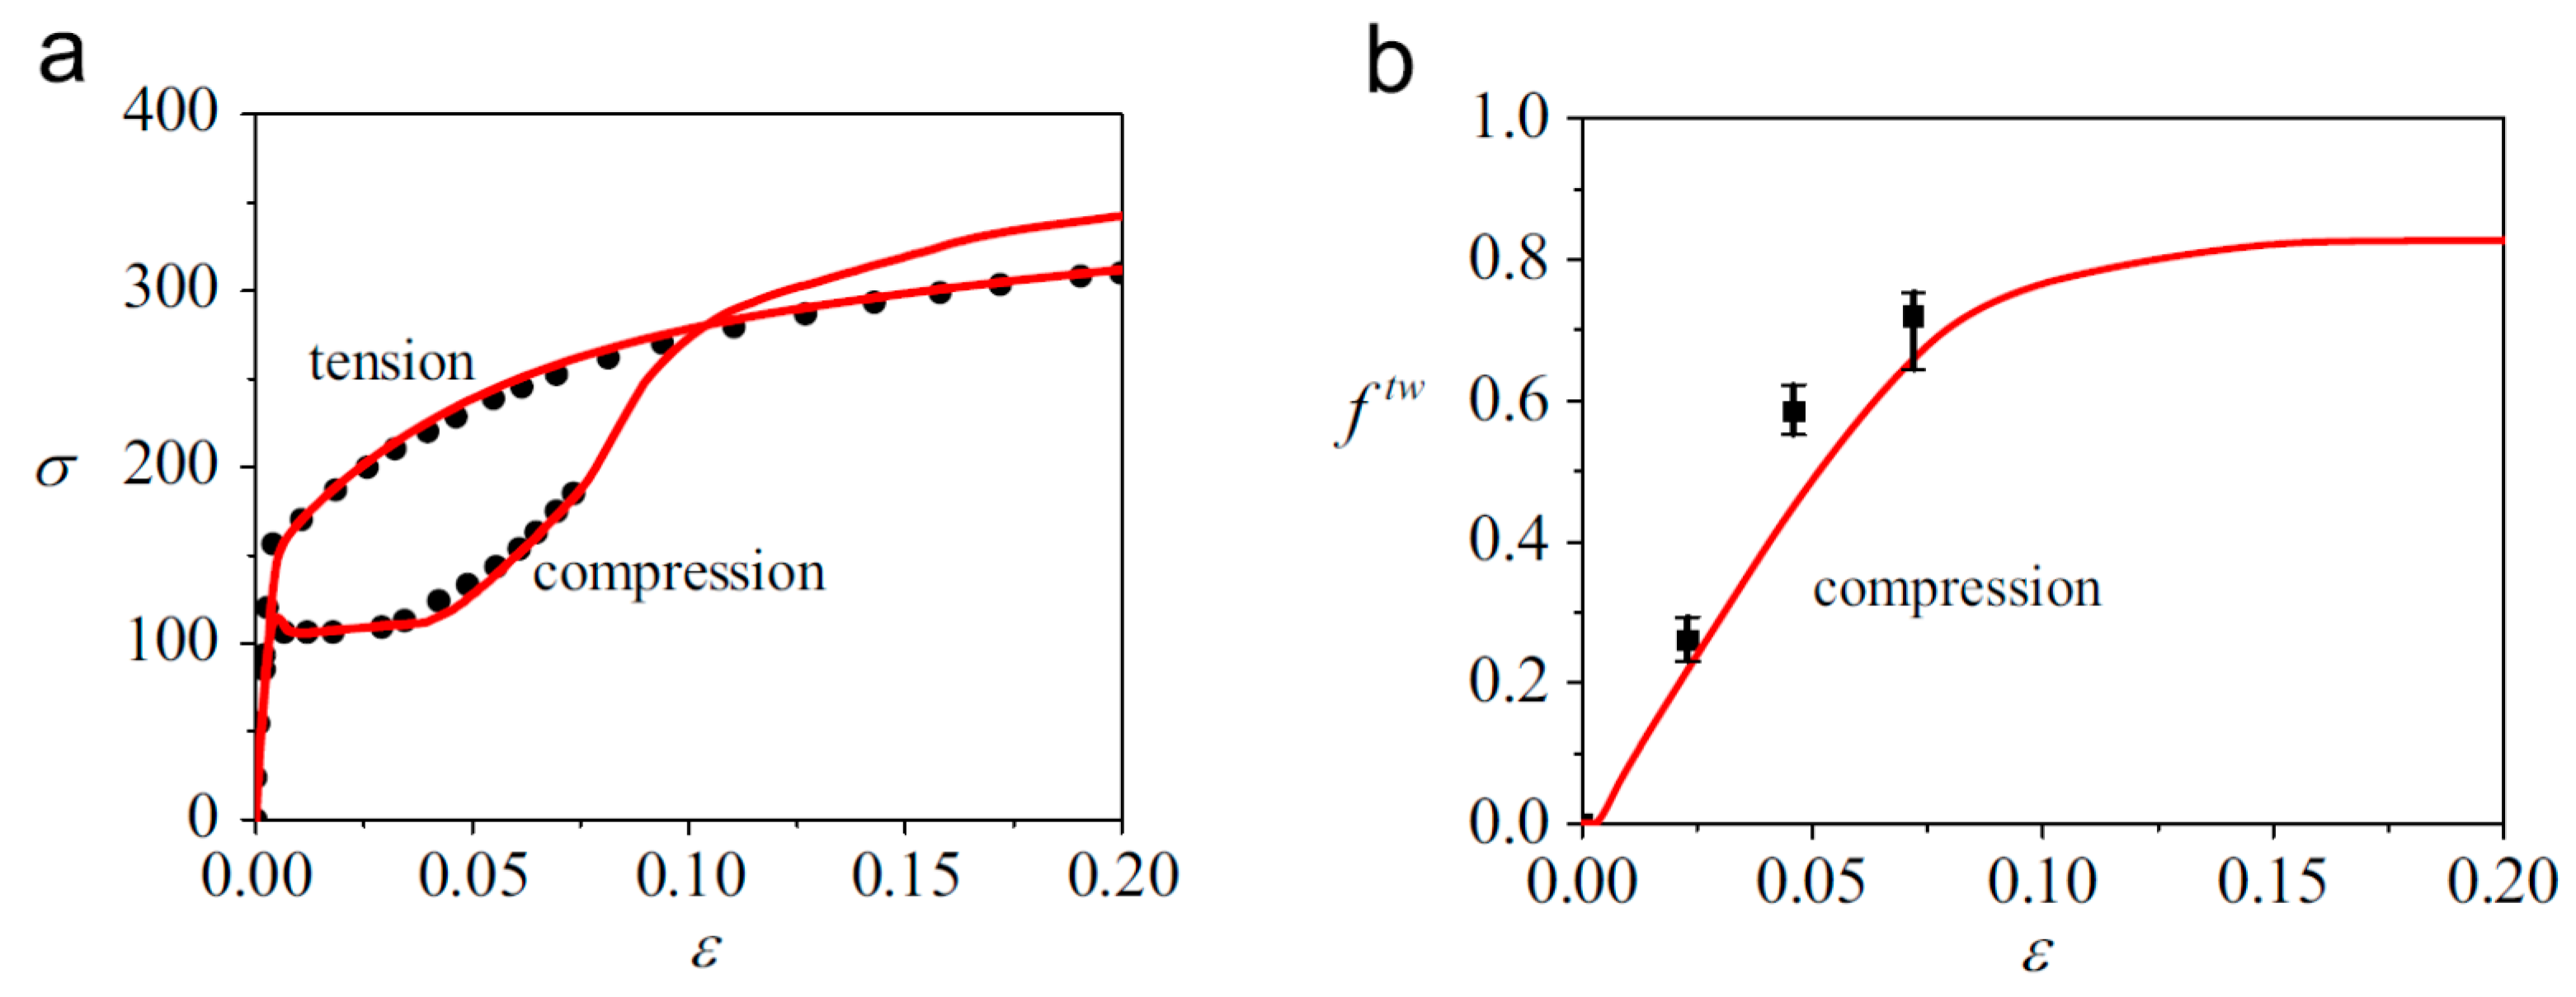
where Γ α is the accumulated shear of α th twinning system, which is calculated after its corresponding twin volume f α surpass f g α (see Figure 7). They used this model to capture the stress-strain response of AZ31B Mg alloy obtained by Lou et al. [106]. They also compared the predicted twin volume versus the experimental results. Figure 8 shows that the model developed by Wu et al. [105] can successfully capture both the stress-strain and twin volume during uniaxial compression and tension. Qiao et al. [73] reviewed the available scheme to model stress relaxation in the CPFE framework. They used the model developed by Wu et al. [105] for EVPSC and incorporated it in the CPFE model to capture the stress relaxation in Mg single crystal during twinning.

2.4. Detwinning

In the case of more complex strain paths, the detwinning mechanism should also be included in addition to twinning and slip modes. Various models address the detwinning along twinning and slip modes using crystal plasticity [22,87,88,89,94,95,96,97]. Here, a physically-based Twinning-Detwinning (TDT) model is elaborated, which was developed by Wang and his coworkers [90,91,92] for the EVPSC framework and extended later on for the CPFE framework [9]. In this model, the twinning and detwinning mechanisms can be divided into 4 major operations as follows (Figure 9):
  • Operations A: Twin nucleation and growth due to parent grain reduction.
  • Operations B: Twin growth due to the twinned child propagation.
  • Operations C: Twin shrinkage due to the parent propagation.
  • Operations D: Detwinning in the twinned child.
The polarity of simple twinning model should be modified for these operations. In the parent grain, the crystallographic systems include N s slip systems, N t twin systems for Operation A, and N t twin systems for Operation C. In the case of the twin child, the crystallographic systems include N s t w slip systems, one twin system for Operation D, and one twin system for Operation B. Operation A can get activated in parent grain for when the resolved shear in the twin system k is larger than the corresponding slip resistance, i.e., τ N s + k > s N s + k . Operation B is activated in the twin child, which is nucleated by the activation of β th twin variant, when τ β N s   t w + 2 < 0   and   | τ β N s t w + 2 | > s β N s t w + 2 . Operation C initiates in the parent grain for the k th twin variant when τ N s + N t   + k < 0   and   | τ N s + N t + k | > s N s + N t + k . Operation D initiates inside the twin child, which is nucleated by the activation of β th twin variant, when τ β N s t w + 1 > s β N s t w + 1 .
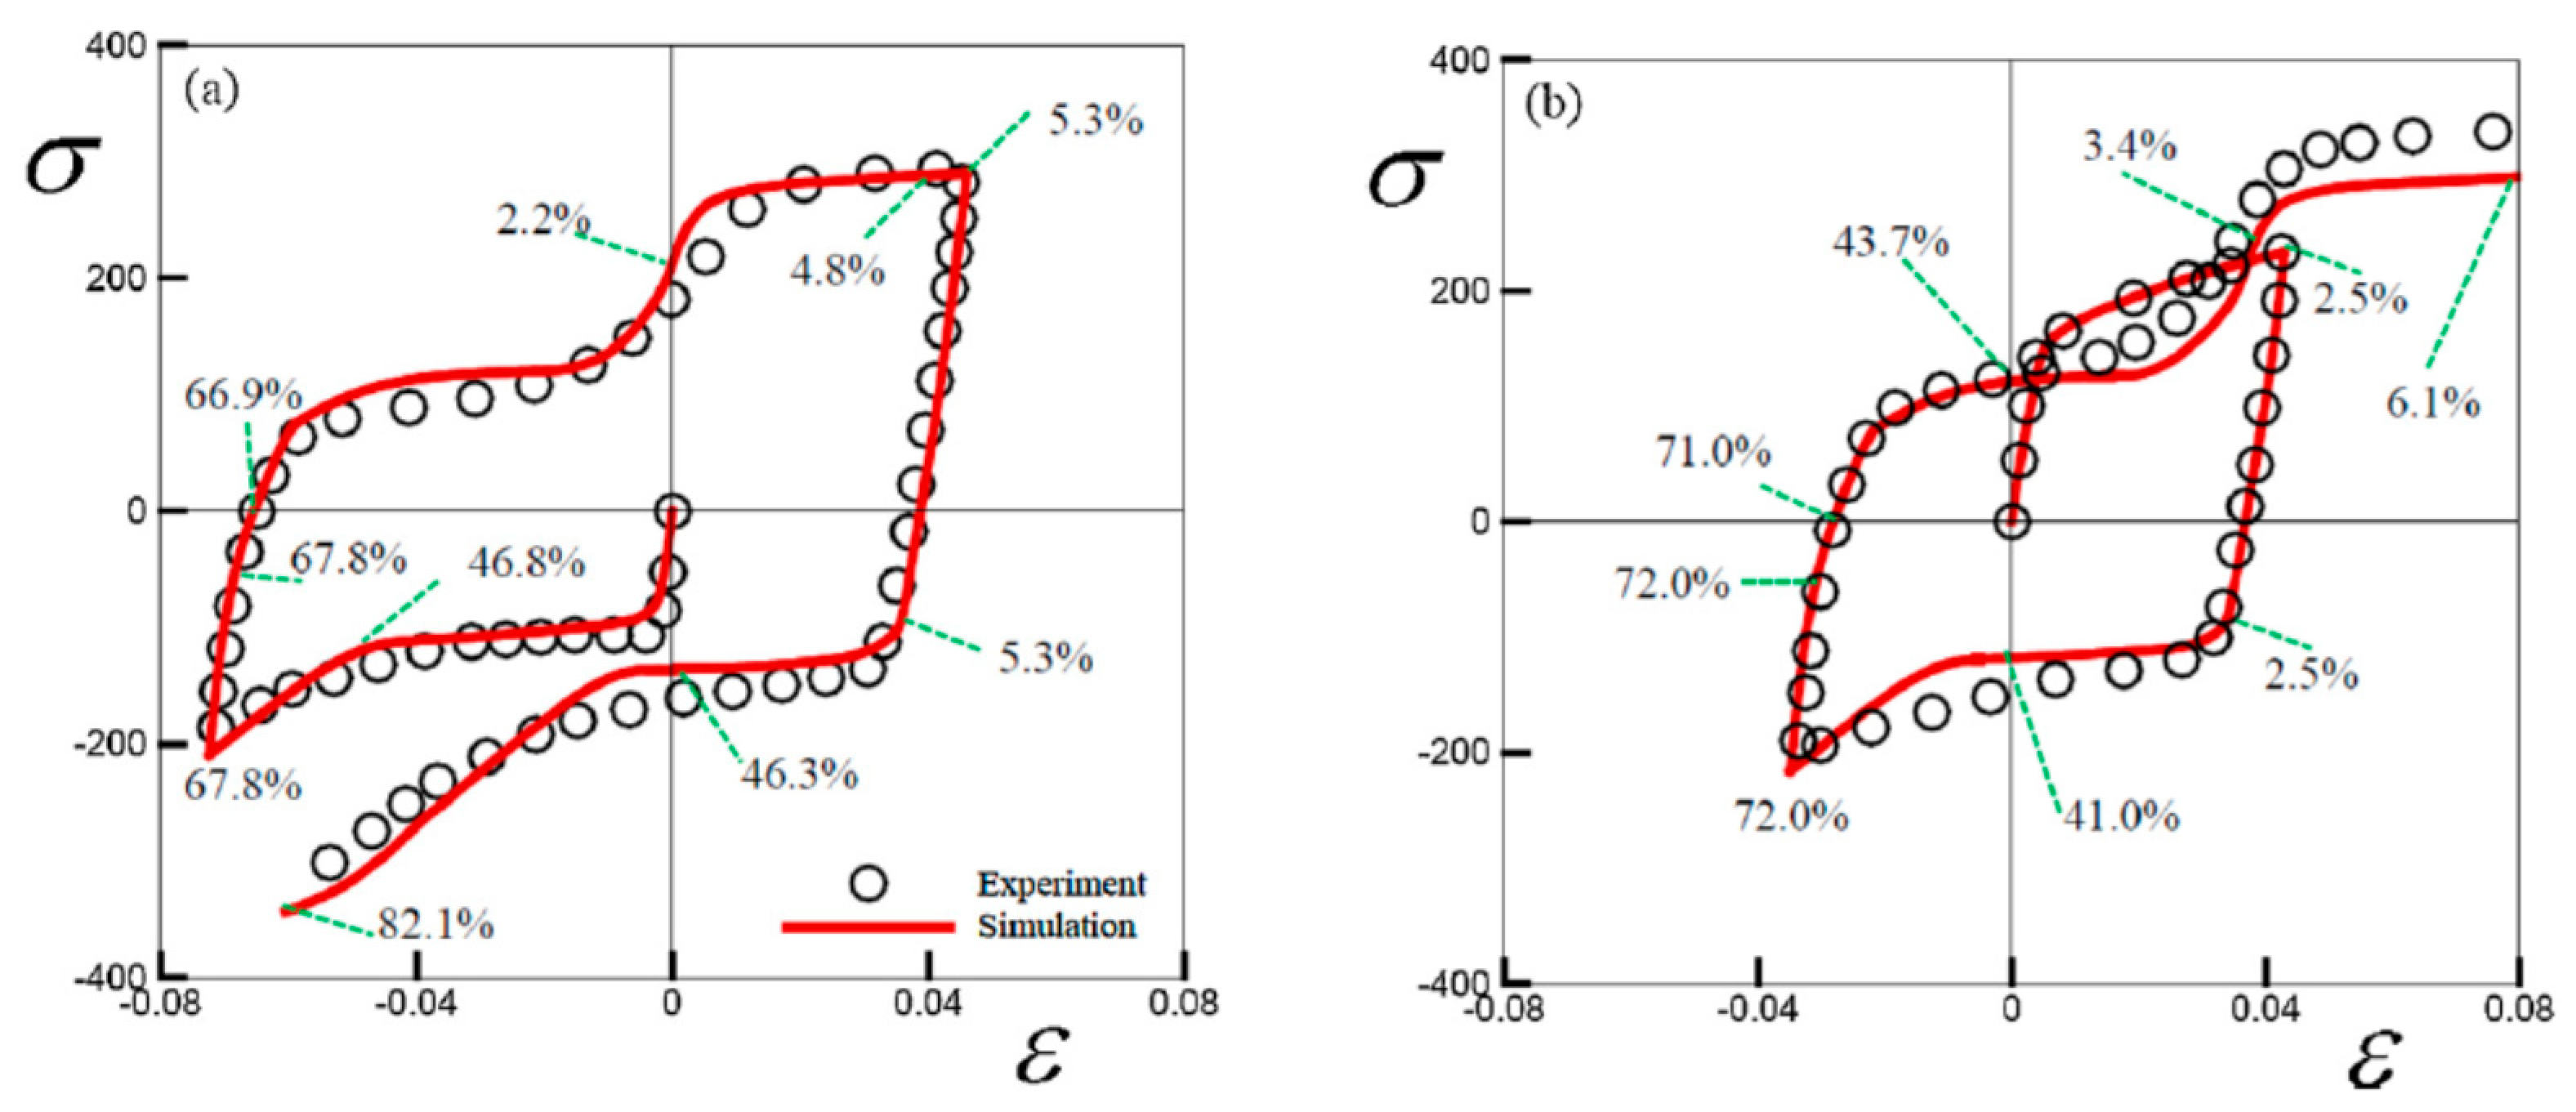
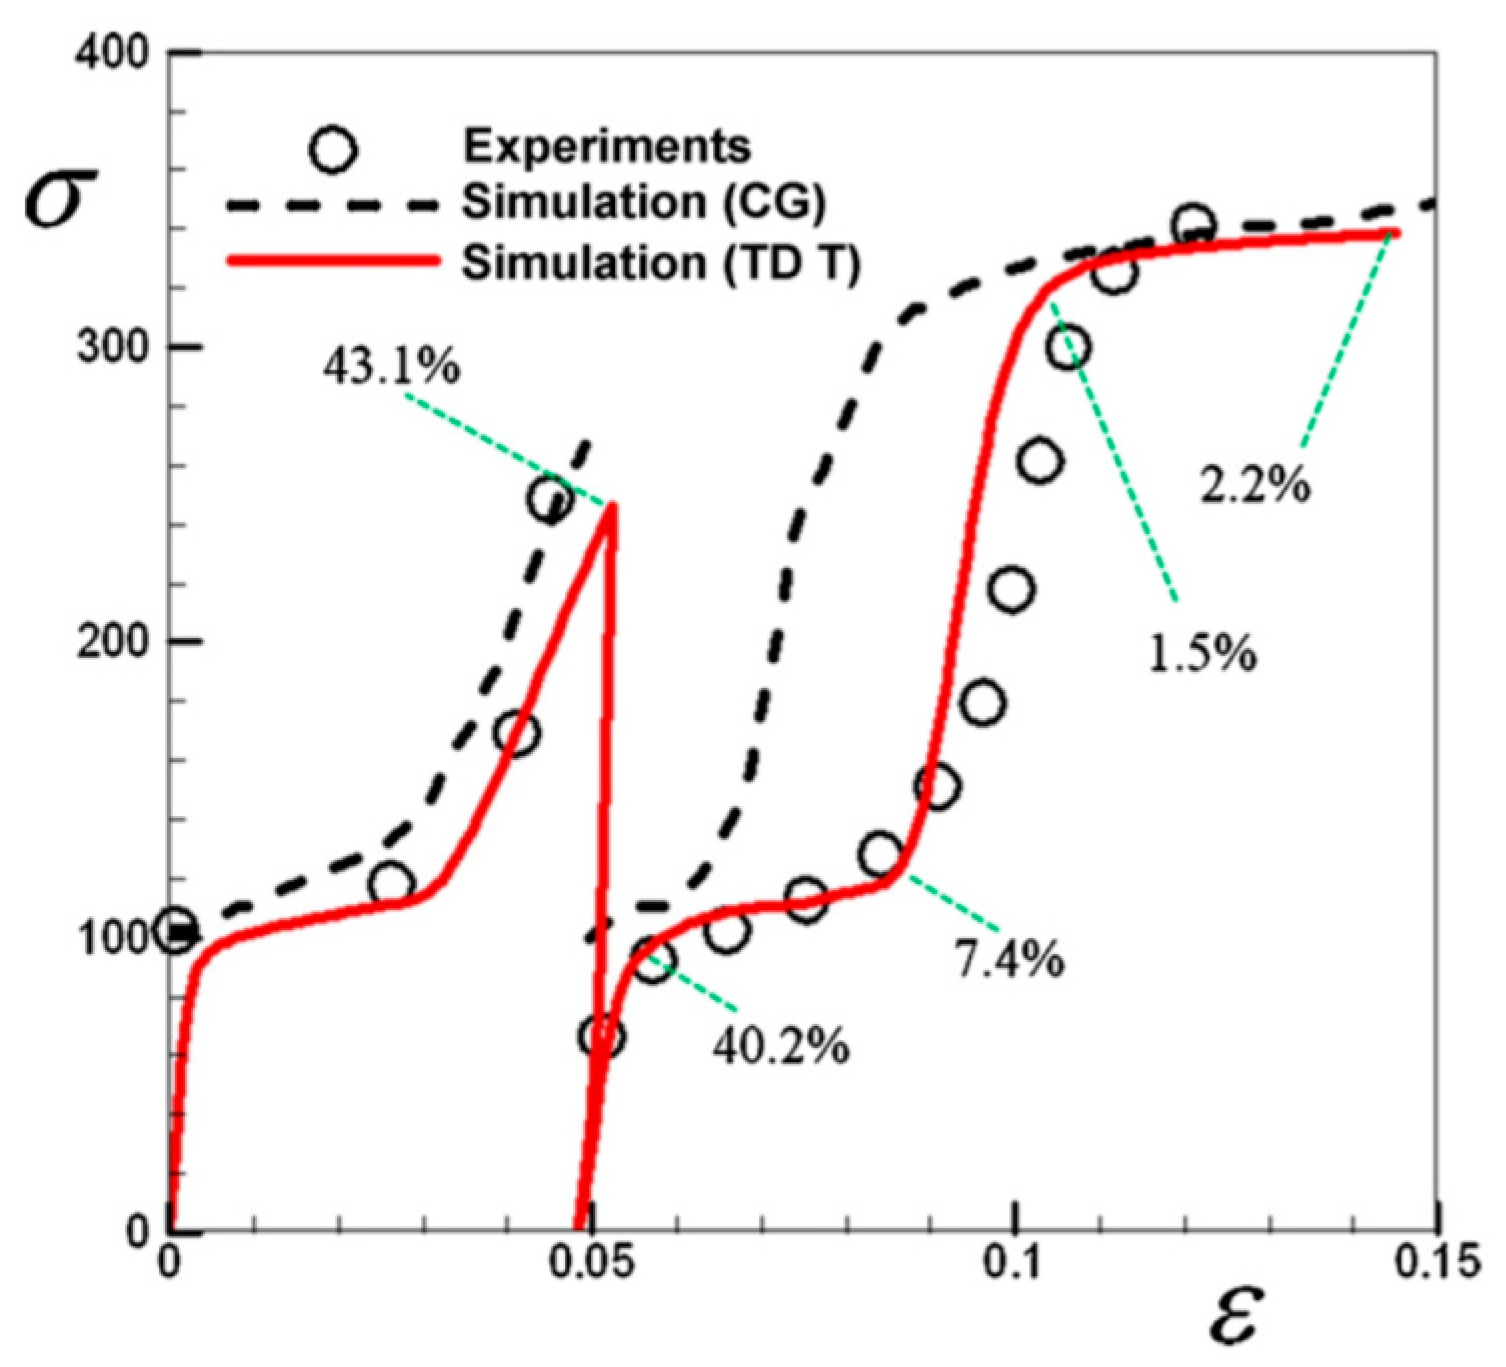
In the TDT/EVPSC model developed by Wang and his coworkers [90,91,92], the twinned child is manifested as a new grain, and the Operations A-D is reflected by the change in the volume of the parent and twin grains. Wang et al. [90] used the developed TDT model to capture the cyclic response of AZ31B Mg alloy for complex loading paths. They compared the model prediction versus the experimental data provided by Lou et al. [106] (Figure 10). They also showed the variation of twin volume and how the deformation twinning and detwinning governs the twin volume and stress-strain curve shape. Furthermore, they compared the prediction of TDT/EVPSC model versus the CG results reported by Proust et al. [88] for the experimental results of AZ31B Mg alloy subjected to the case of in-plane compression followed by through-thickness compression (Figure 11). Although the CG model was able to capture some features of twinning-detwinning mechanisms, the TDT/EVPSC model considerably enhances the accuracy of the simulation results.
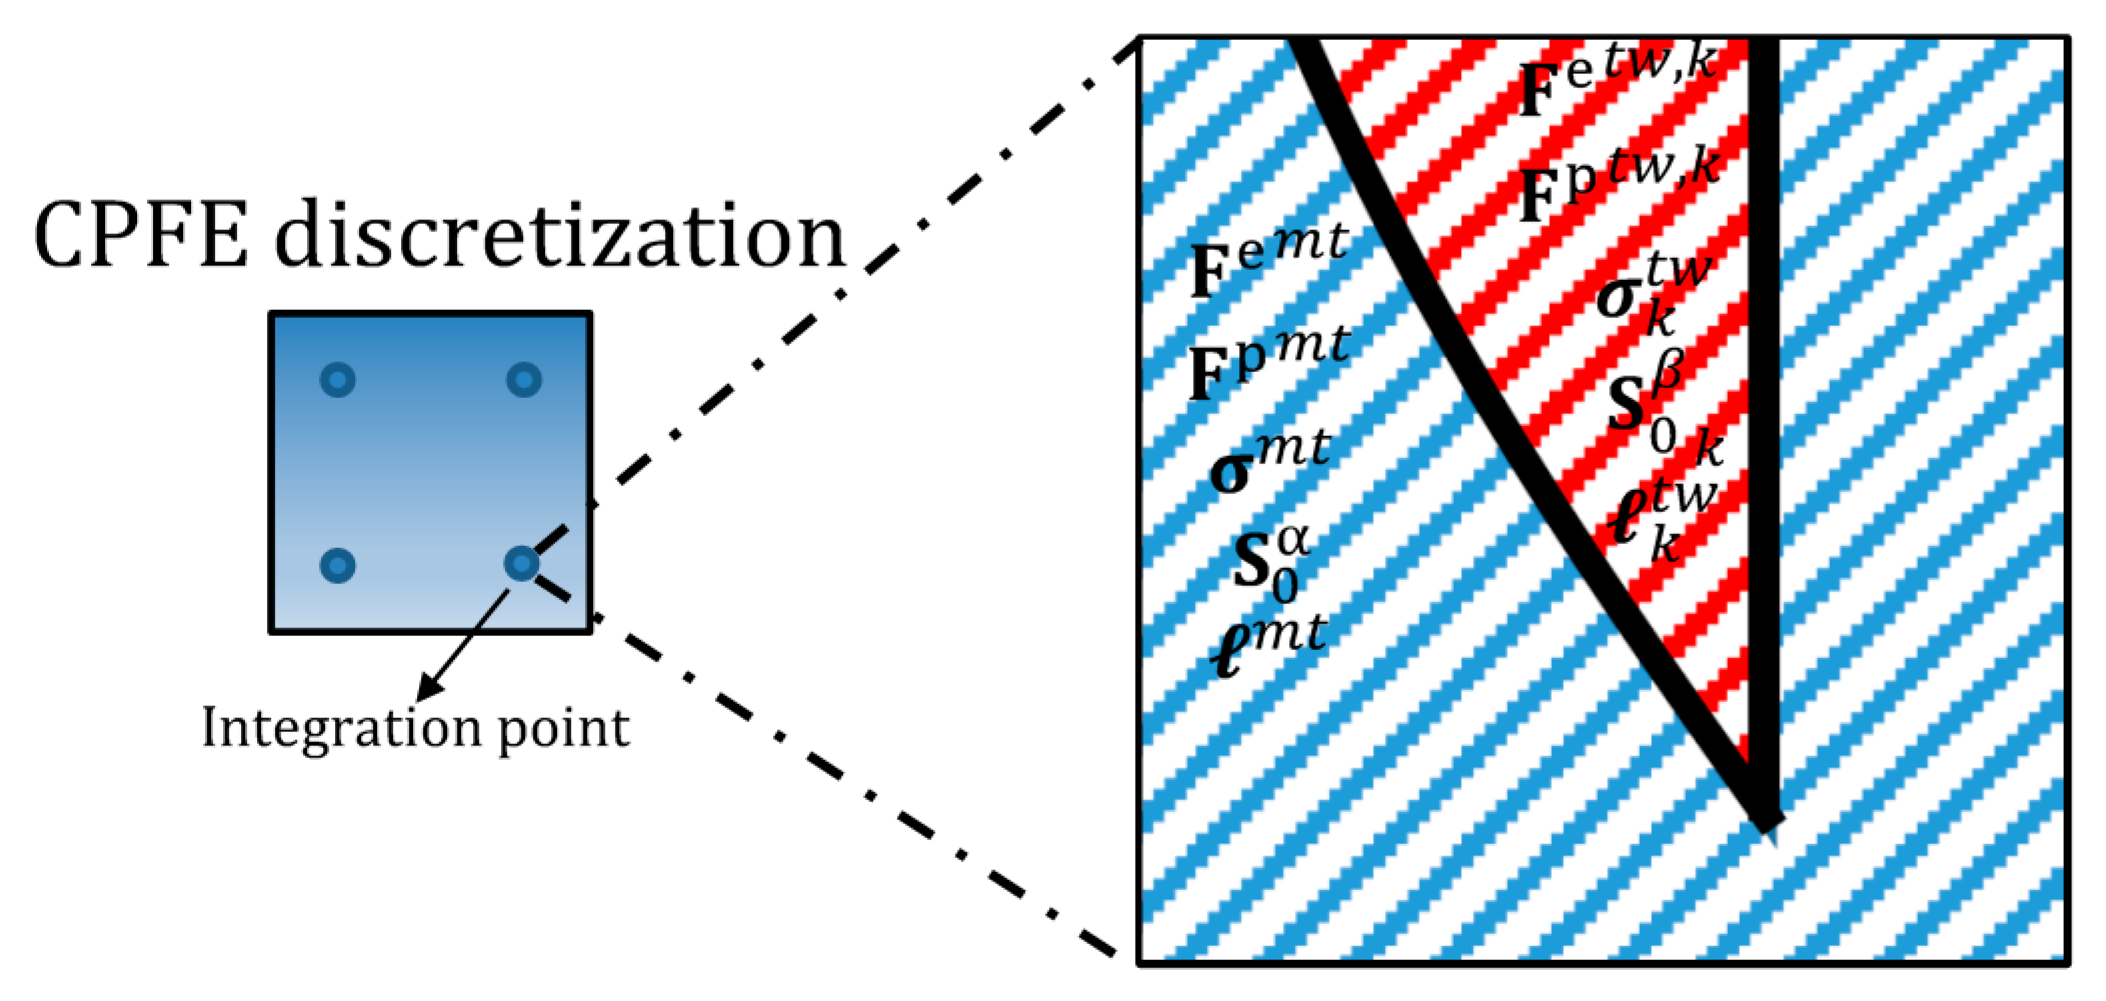
Unlike the EVPSC framework, the TDT operations are not trivial to apply to a material point in the case of CPFE framework. Yaghoobi et al. [9] used a multiscale framework in which the untwinned and twinned regions were considered within a sub-scale model at a material point and the stresses homogenized using a Taylor-type scheme (Figure 12). This allows multiple variants to coexist at a material point, which avoids the need for the selection of predominant variants as in the PTR models. They implemented the model in an open-source CPFE software PRISMS-Plasticity [103]. The twin volume evolution of a material point for the β th twin variant is obtained as below:
f ˙ β = [ 1 β = 1 N t f β ] ( γ ˙ N s + β γ ˙ N s + N t + β ) S f β ( γ ¯ ˙ β N s t w + 1 γ ¯ ˙ β N s t w + 2 ) S
where γ ˙ N s + β and γ ˙ N s + N t + β are the shear rate inside the parent corresponds to operations A and C, and γ ¯ ˙ β N   s t w + 1 and γ ¯ ˙ β N s t w + 2 are the shear rates within the child nucleated due to the activation of the β th twin system.
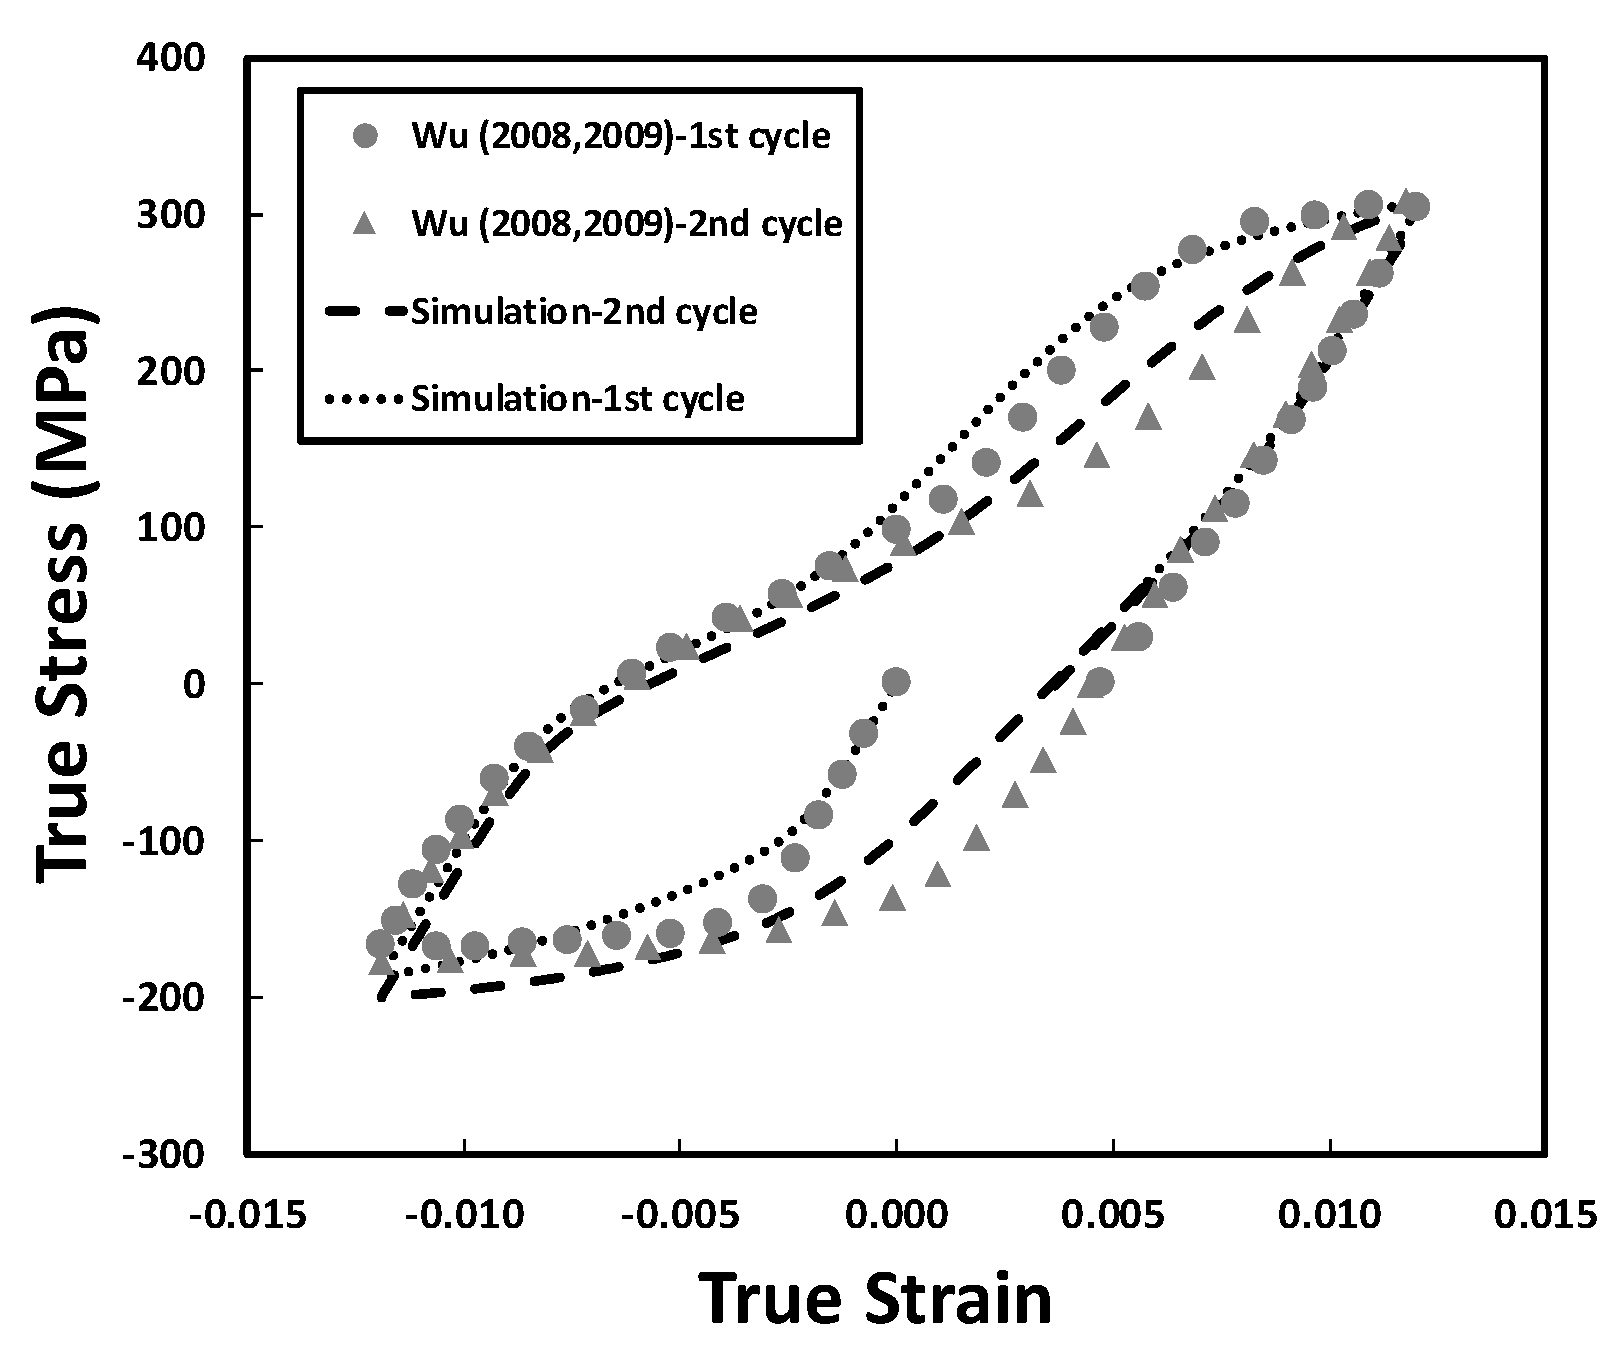
Yaghoobi et al. [9] calibrated the model using the uniaxial experimental data of extruded ZK60A Mg alloy presented by Wu [107] (Figure 13). The predictions of the modeled cyclic response of the ZK60A alloy along the extrusion direction were compared with the experimental data by Wu et al. [17] and Wu [107]. Yaghoobi et al. [9] further studied the cyclic response of ZK60A by comparing the predicted twin variation versus the normalized intensity of the { 0002 } diffraction peak along the longitudinal direction measured by Wu et al. [35] and Wu [107]. The result showed that not only can the multiscale TDT CPFE framework successfully capture the cyclic stress-strain response of the ZK60A (Figure 14), it can also capture the deformation twinning and detwinning during the cyclic loading (Figure 15). Furthermore, Yaghoobi et al. [9] showed the evolution of predicted basal ( 0001 ) pole figures at strains of ε = ± 1.2 % (Figure 16). It was shown that the deformation twinning resulted in the reorientation of the basal pole, which intensifies in the basal { 0002 } peak in the loading direction at max compressive strains of ε = 1.2 % (Figure 16b,d). On the other hand, the detwinning mechanism removed the increased basal { 0002 } peak intensity at a max tensile strain of ε = 1.2 % (Figure 16c,e).

3. In-situ Experiments

3.1. In-Situ DIC Experiments

3.1.1. Microscale Deformation Mechanisms

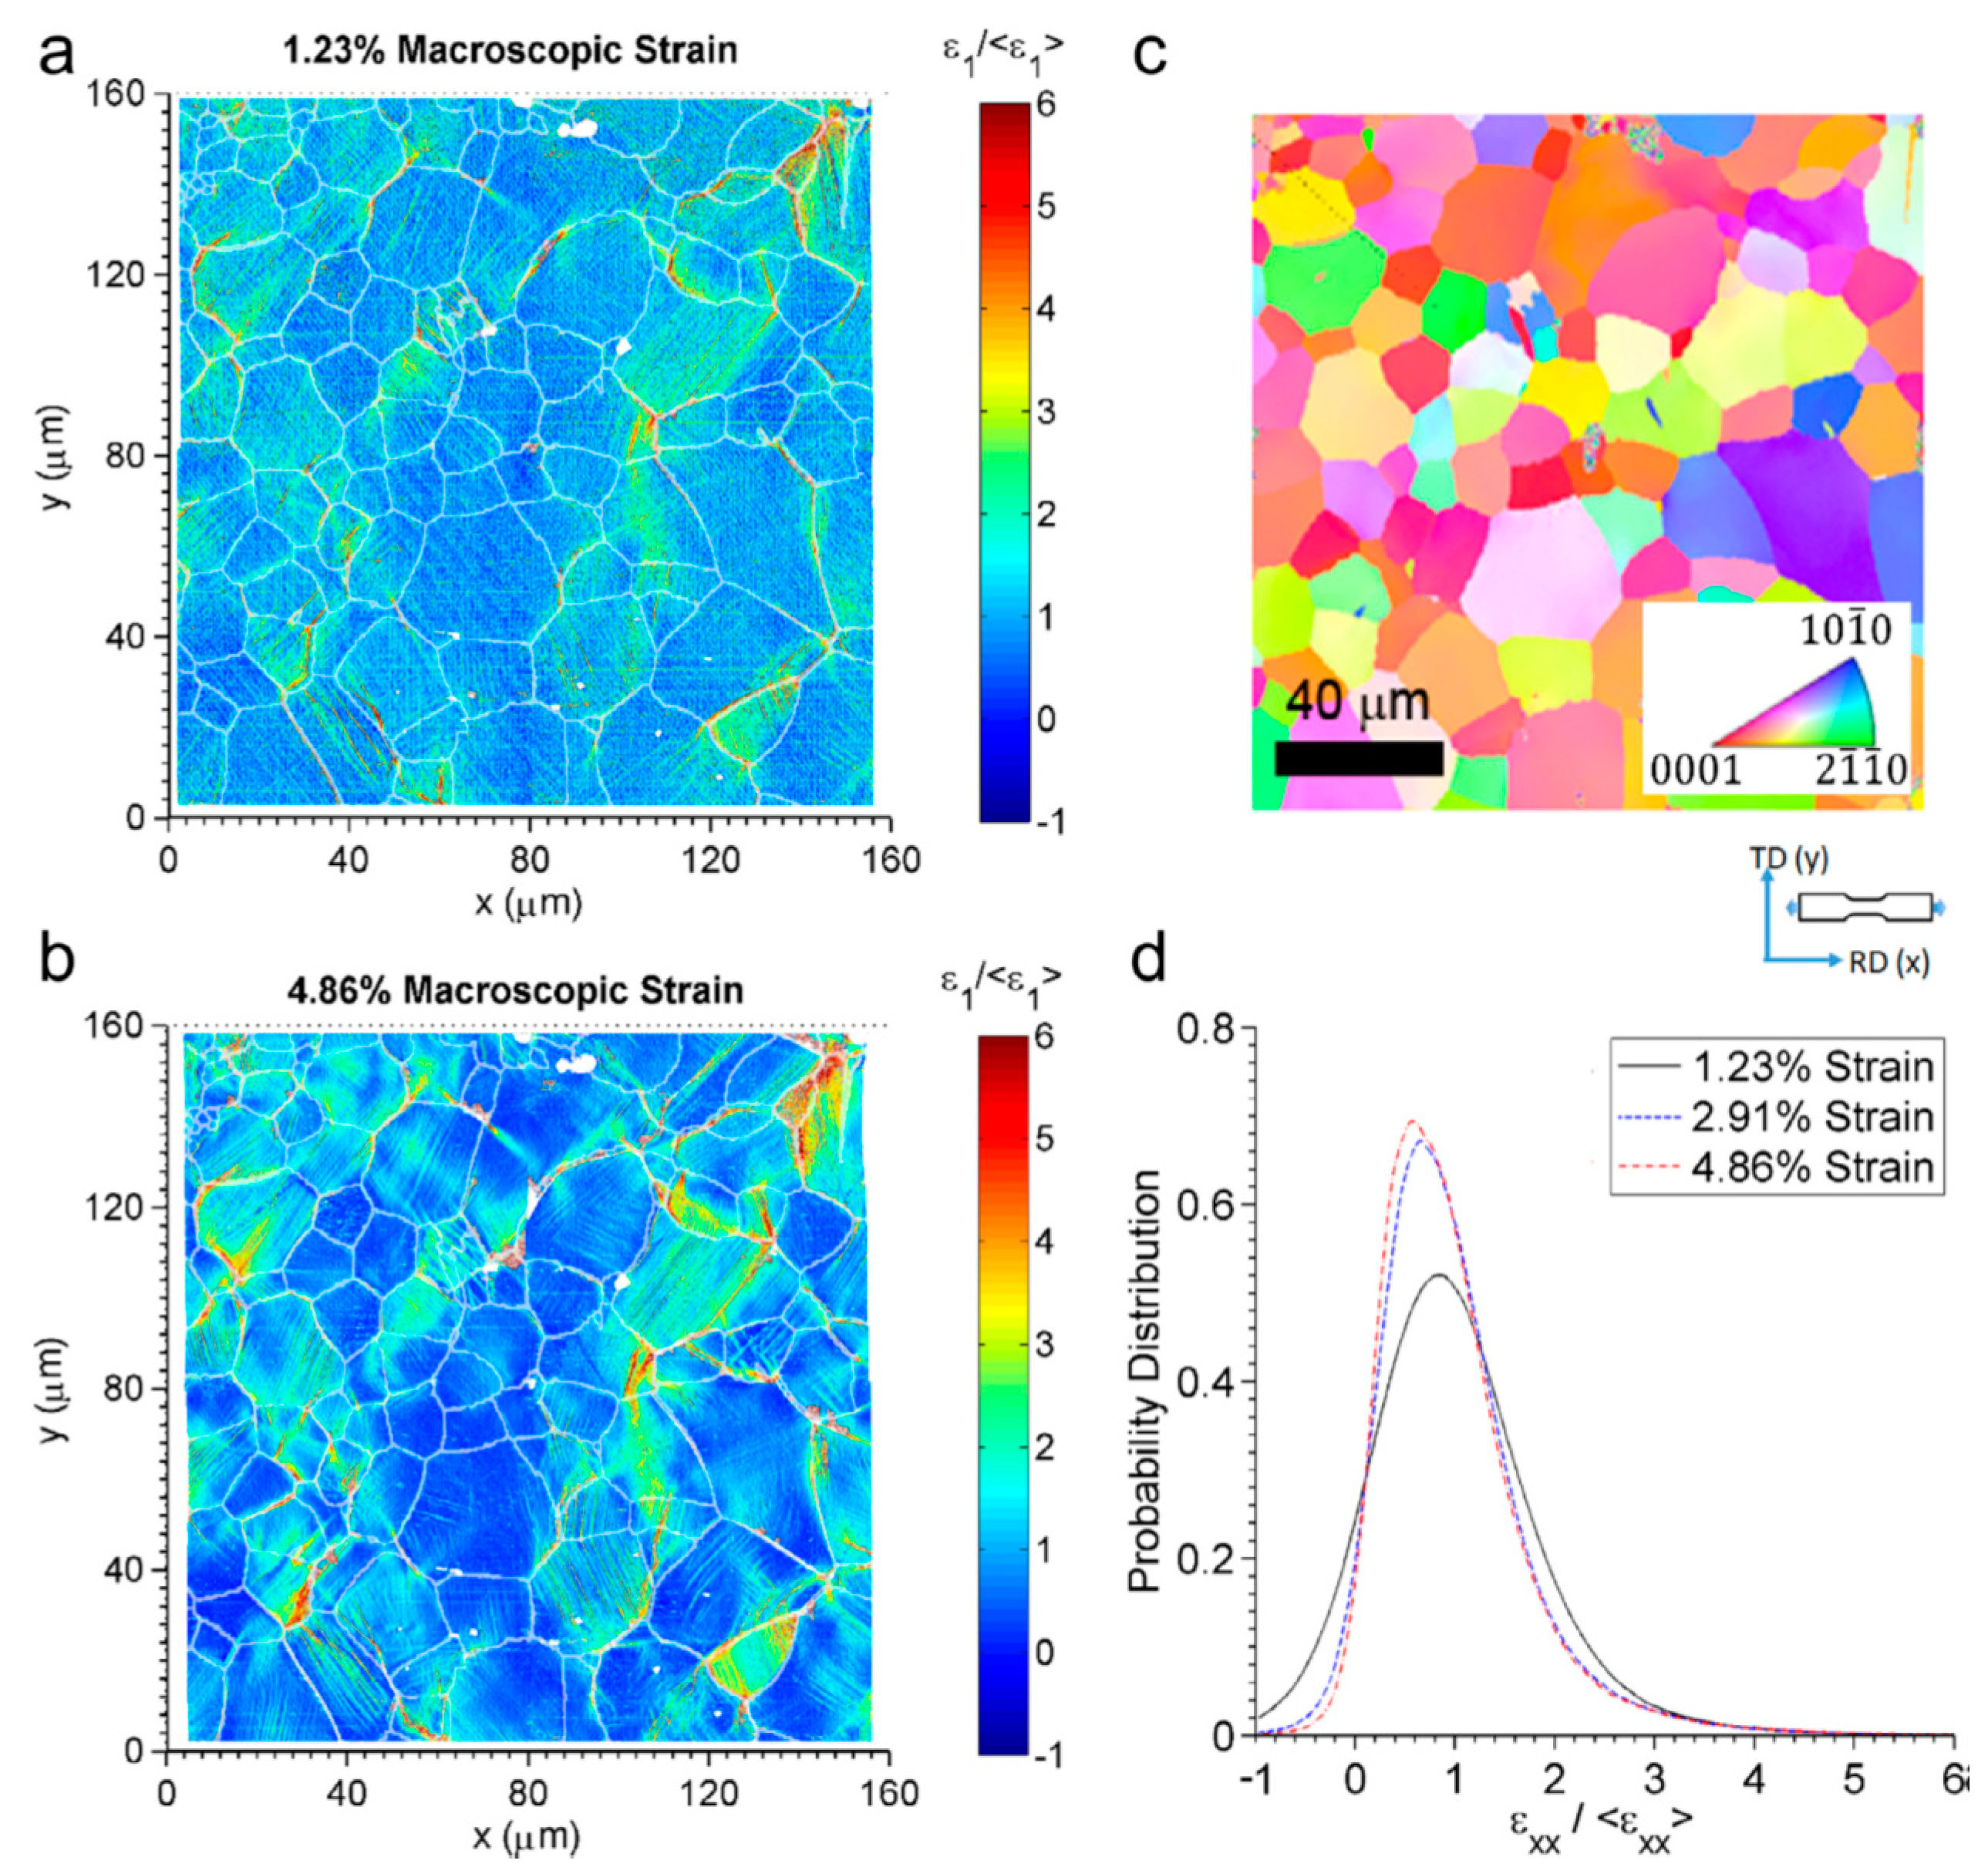
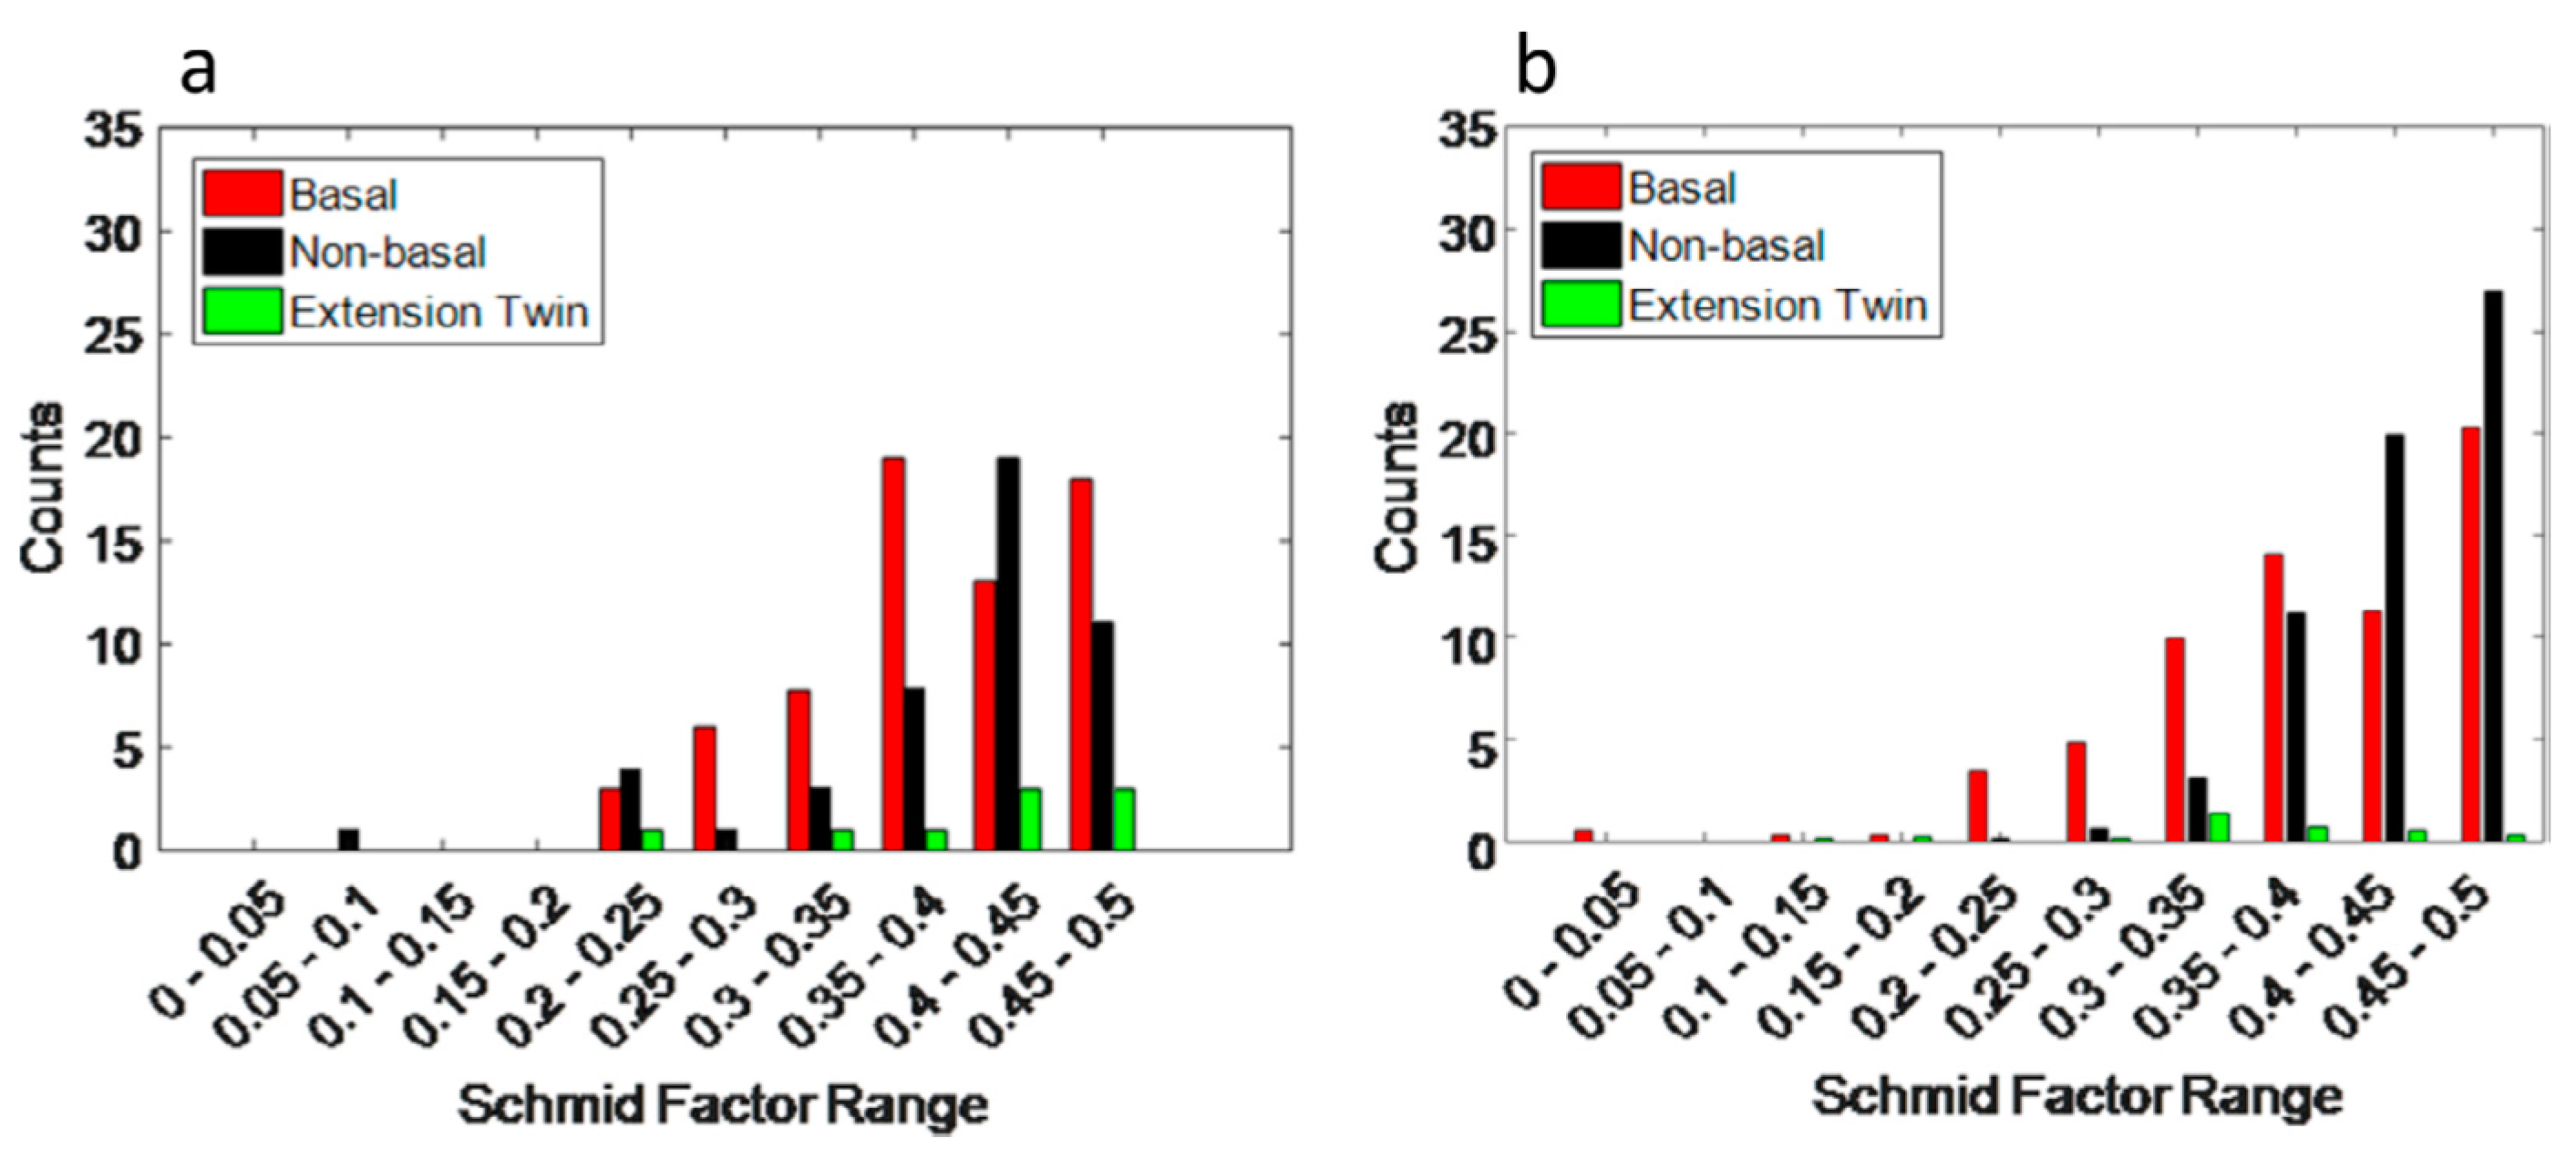
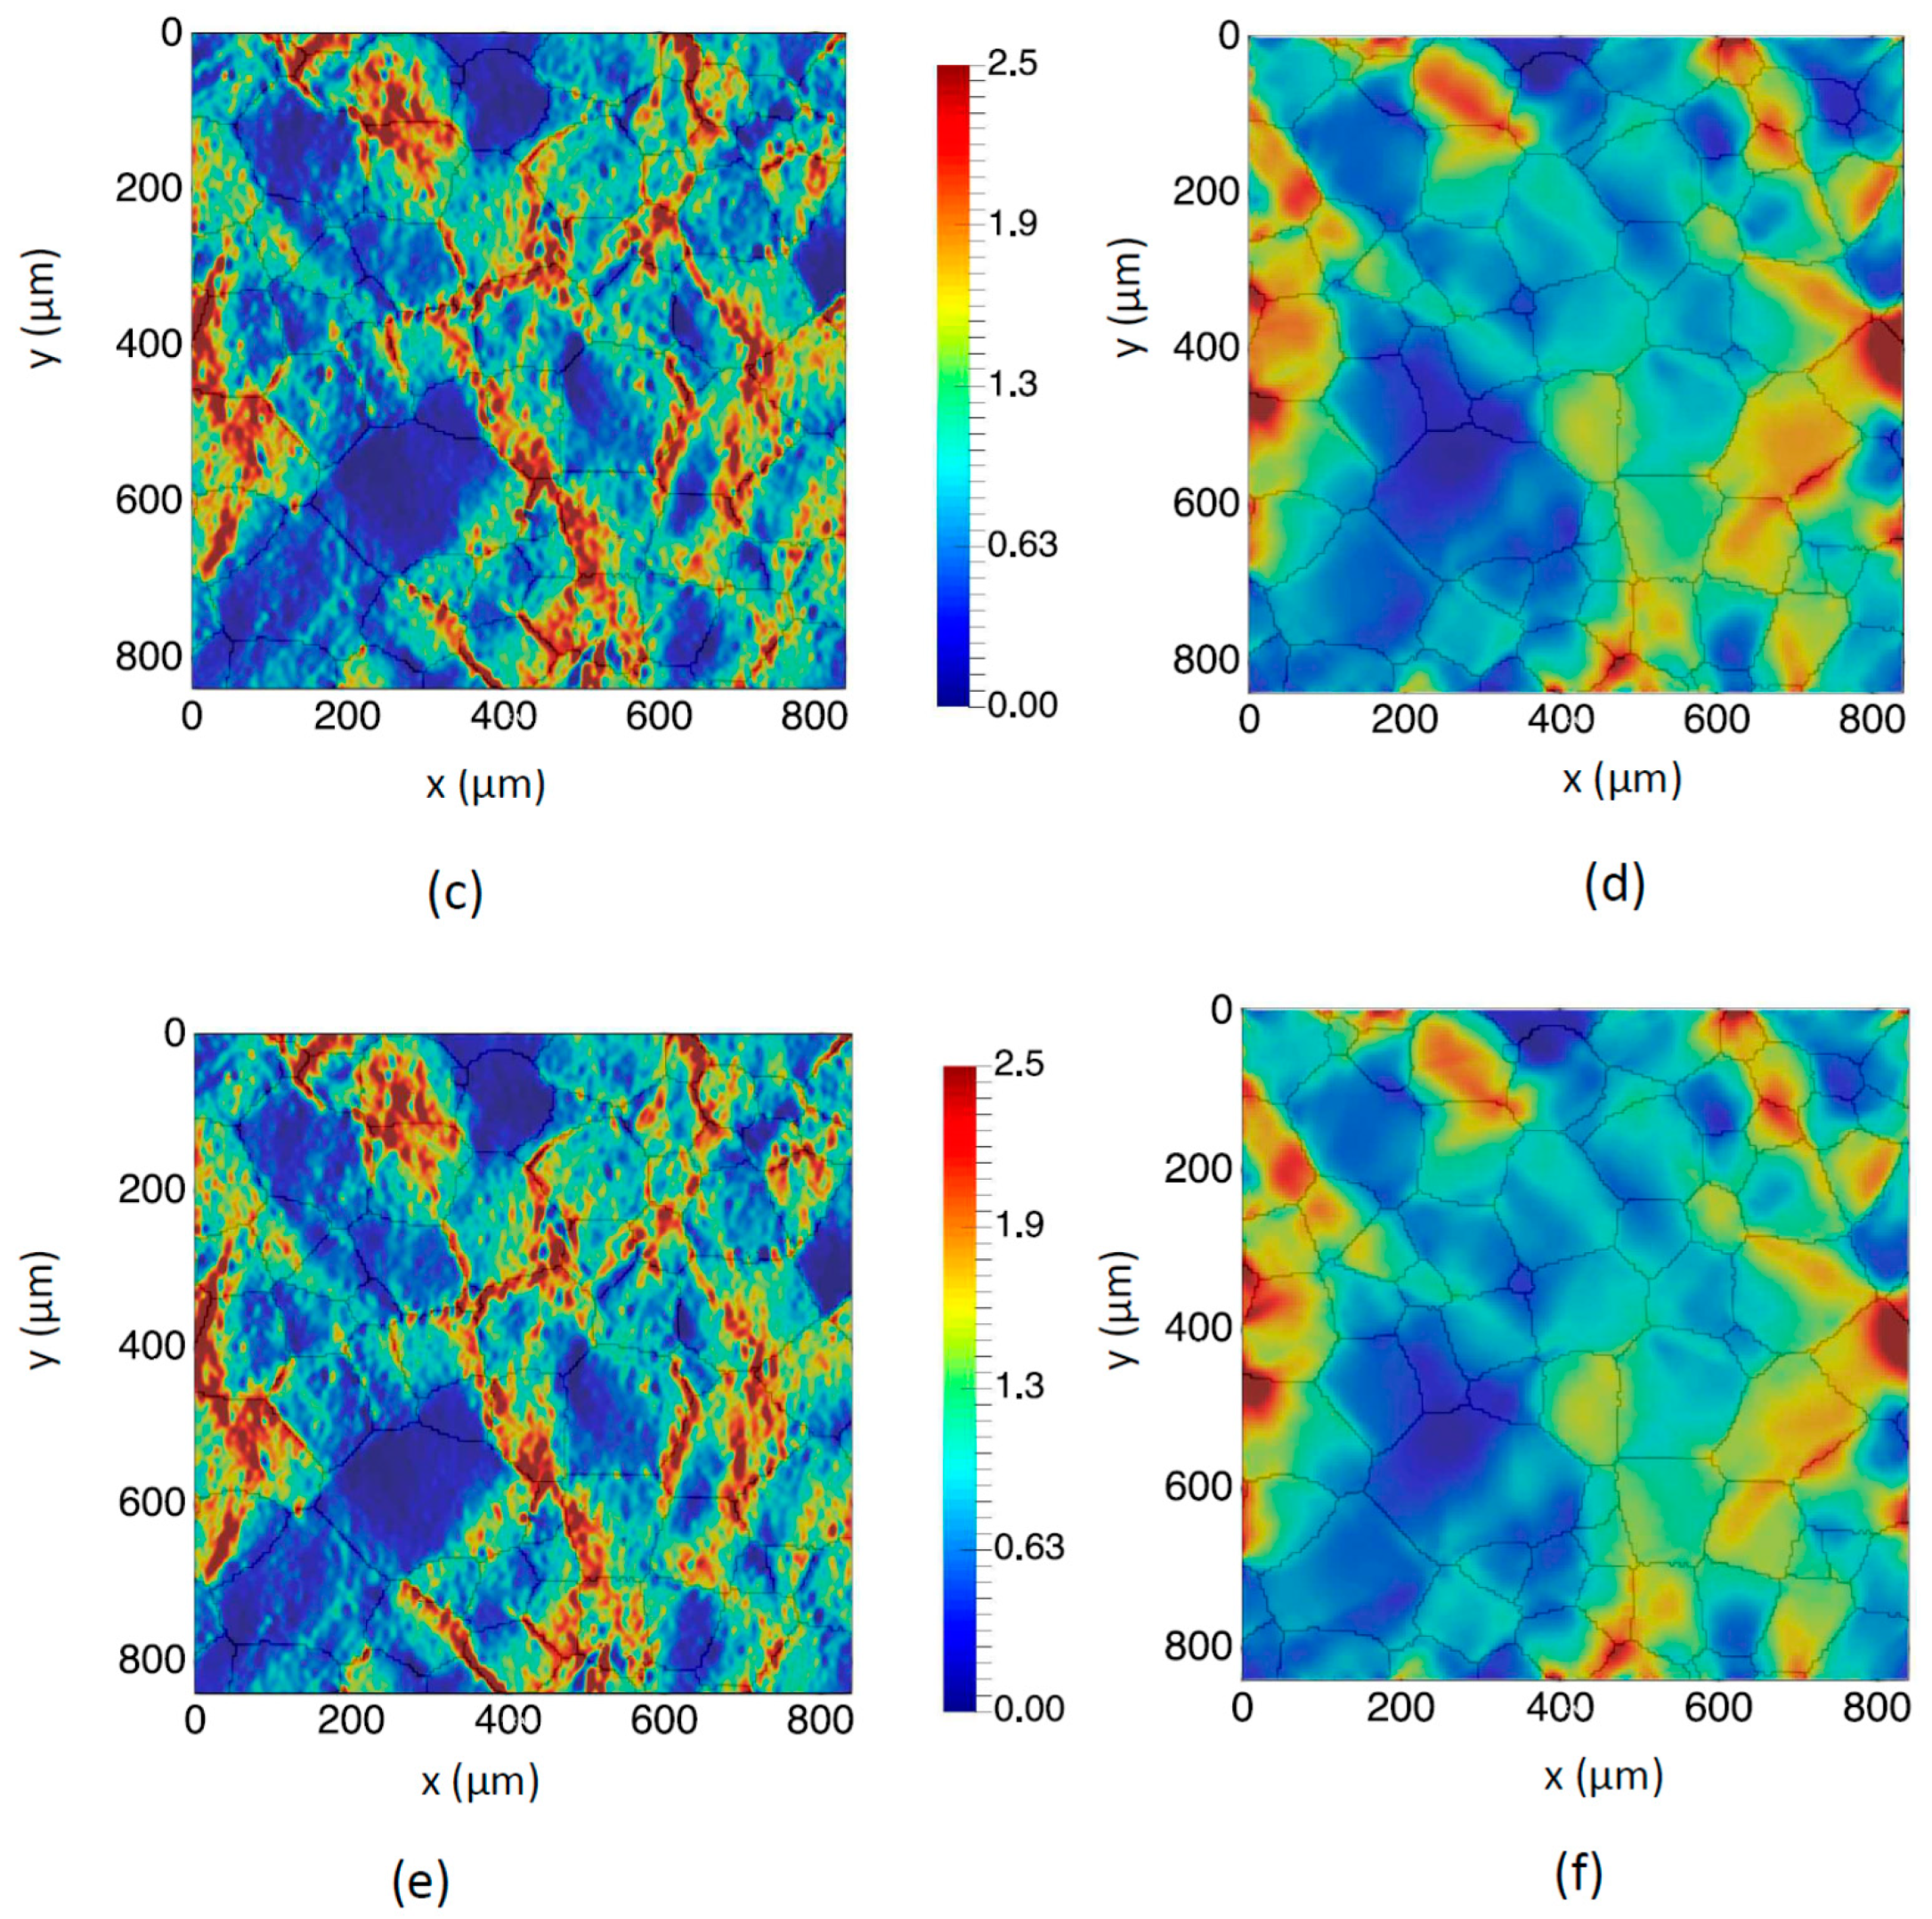
Githens et al. [25] used the in-situ DIC under scanning electron microscopy (SEM-DIC) to study the deformation mechanisms of WE43-T5 Mg alloy with weak basal texture subjected to uniaxial tension and compression along the rolling direction. The SEM-DIC technique provided the full-field strain maps. They first investigated the response of the WE43 alloy during uniaxial tension (Figure 17). They showed that the heterogeneous pattern of strain does not vary after the yield point. They also studied the strain probability distribution, which confirms that the strain map does not vary after yielding ( ε   =   2.91% and 4.86%). However, this pattern is different from the one before yielding ( ε   =   1.23%). They simulated the sample using CPFE simulation open-source software of PRISMS-Plasticity [103] and compared the predicted strain map with the experimental observations, which agrees well (Figure 18).
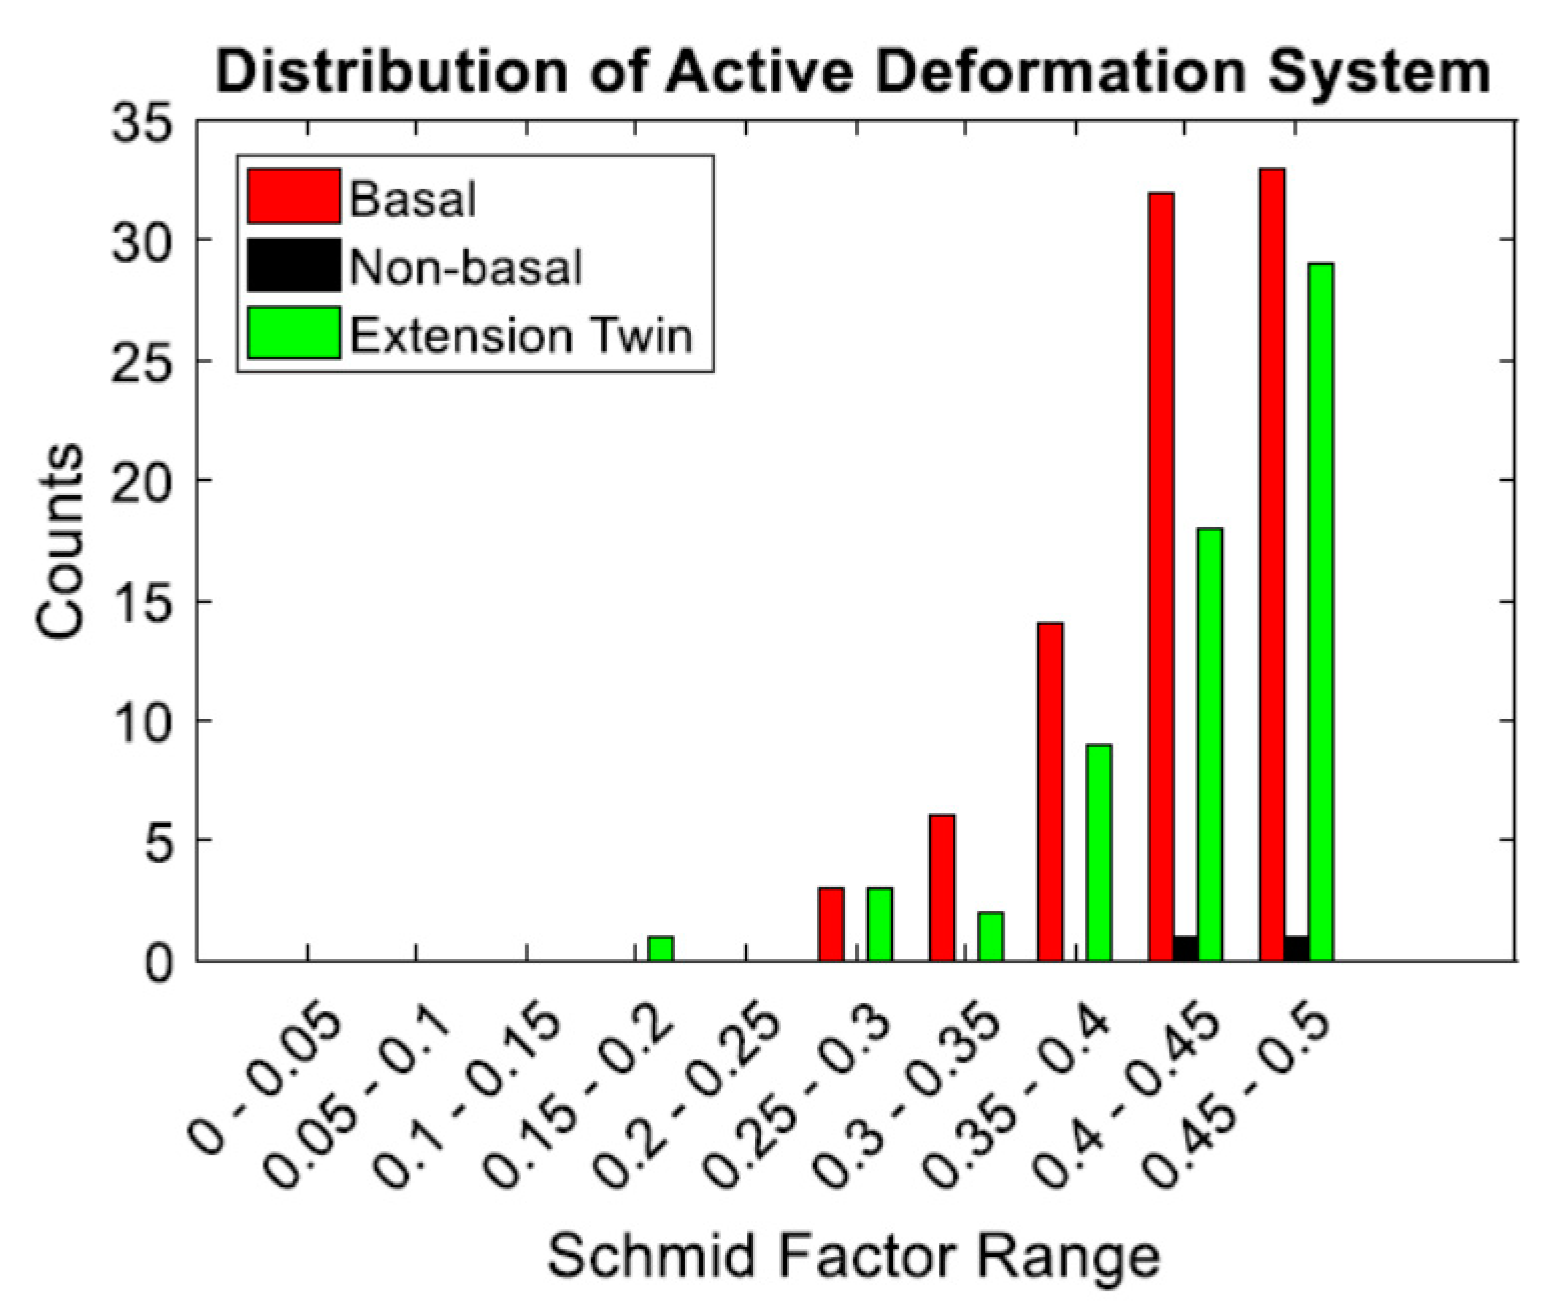
They not only verified the CPFE framework using the SEM-DIC results, but they also resolved and categorized the strain from individual slip traces for the first time in any Mg alloy, as shown in Figure 18a. They used this information to categorize the active slip/twinning modes with respect to their nominal Schmid factors in both SEM-DIC and CPFE results (Figure 19). The results show that the basal modes sustain the most plastic deformation during uniaxial tension. The non-basal slip modes are less active. The least active is the extension twinning, which is because of the tested sample texture and loading direction. Githens et al. [25] also studied the distribution of active slip/twin modes during the compression loading (Figure 20). The activity of extension twinning is considerably increased during compression compared to the tensile loading (Figure 19). In addition, the non-basal slip modes contribution to the deformation is very limited during compression (Figure 20).

3.1.2. Effects of Heat Treatment

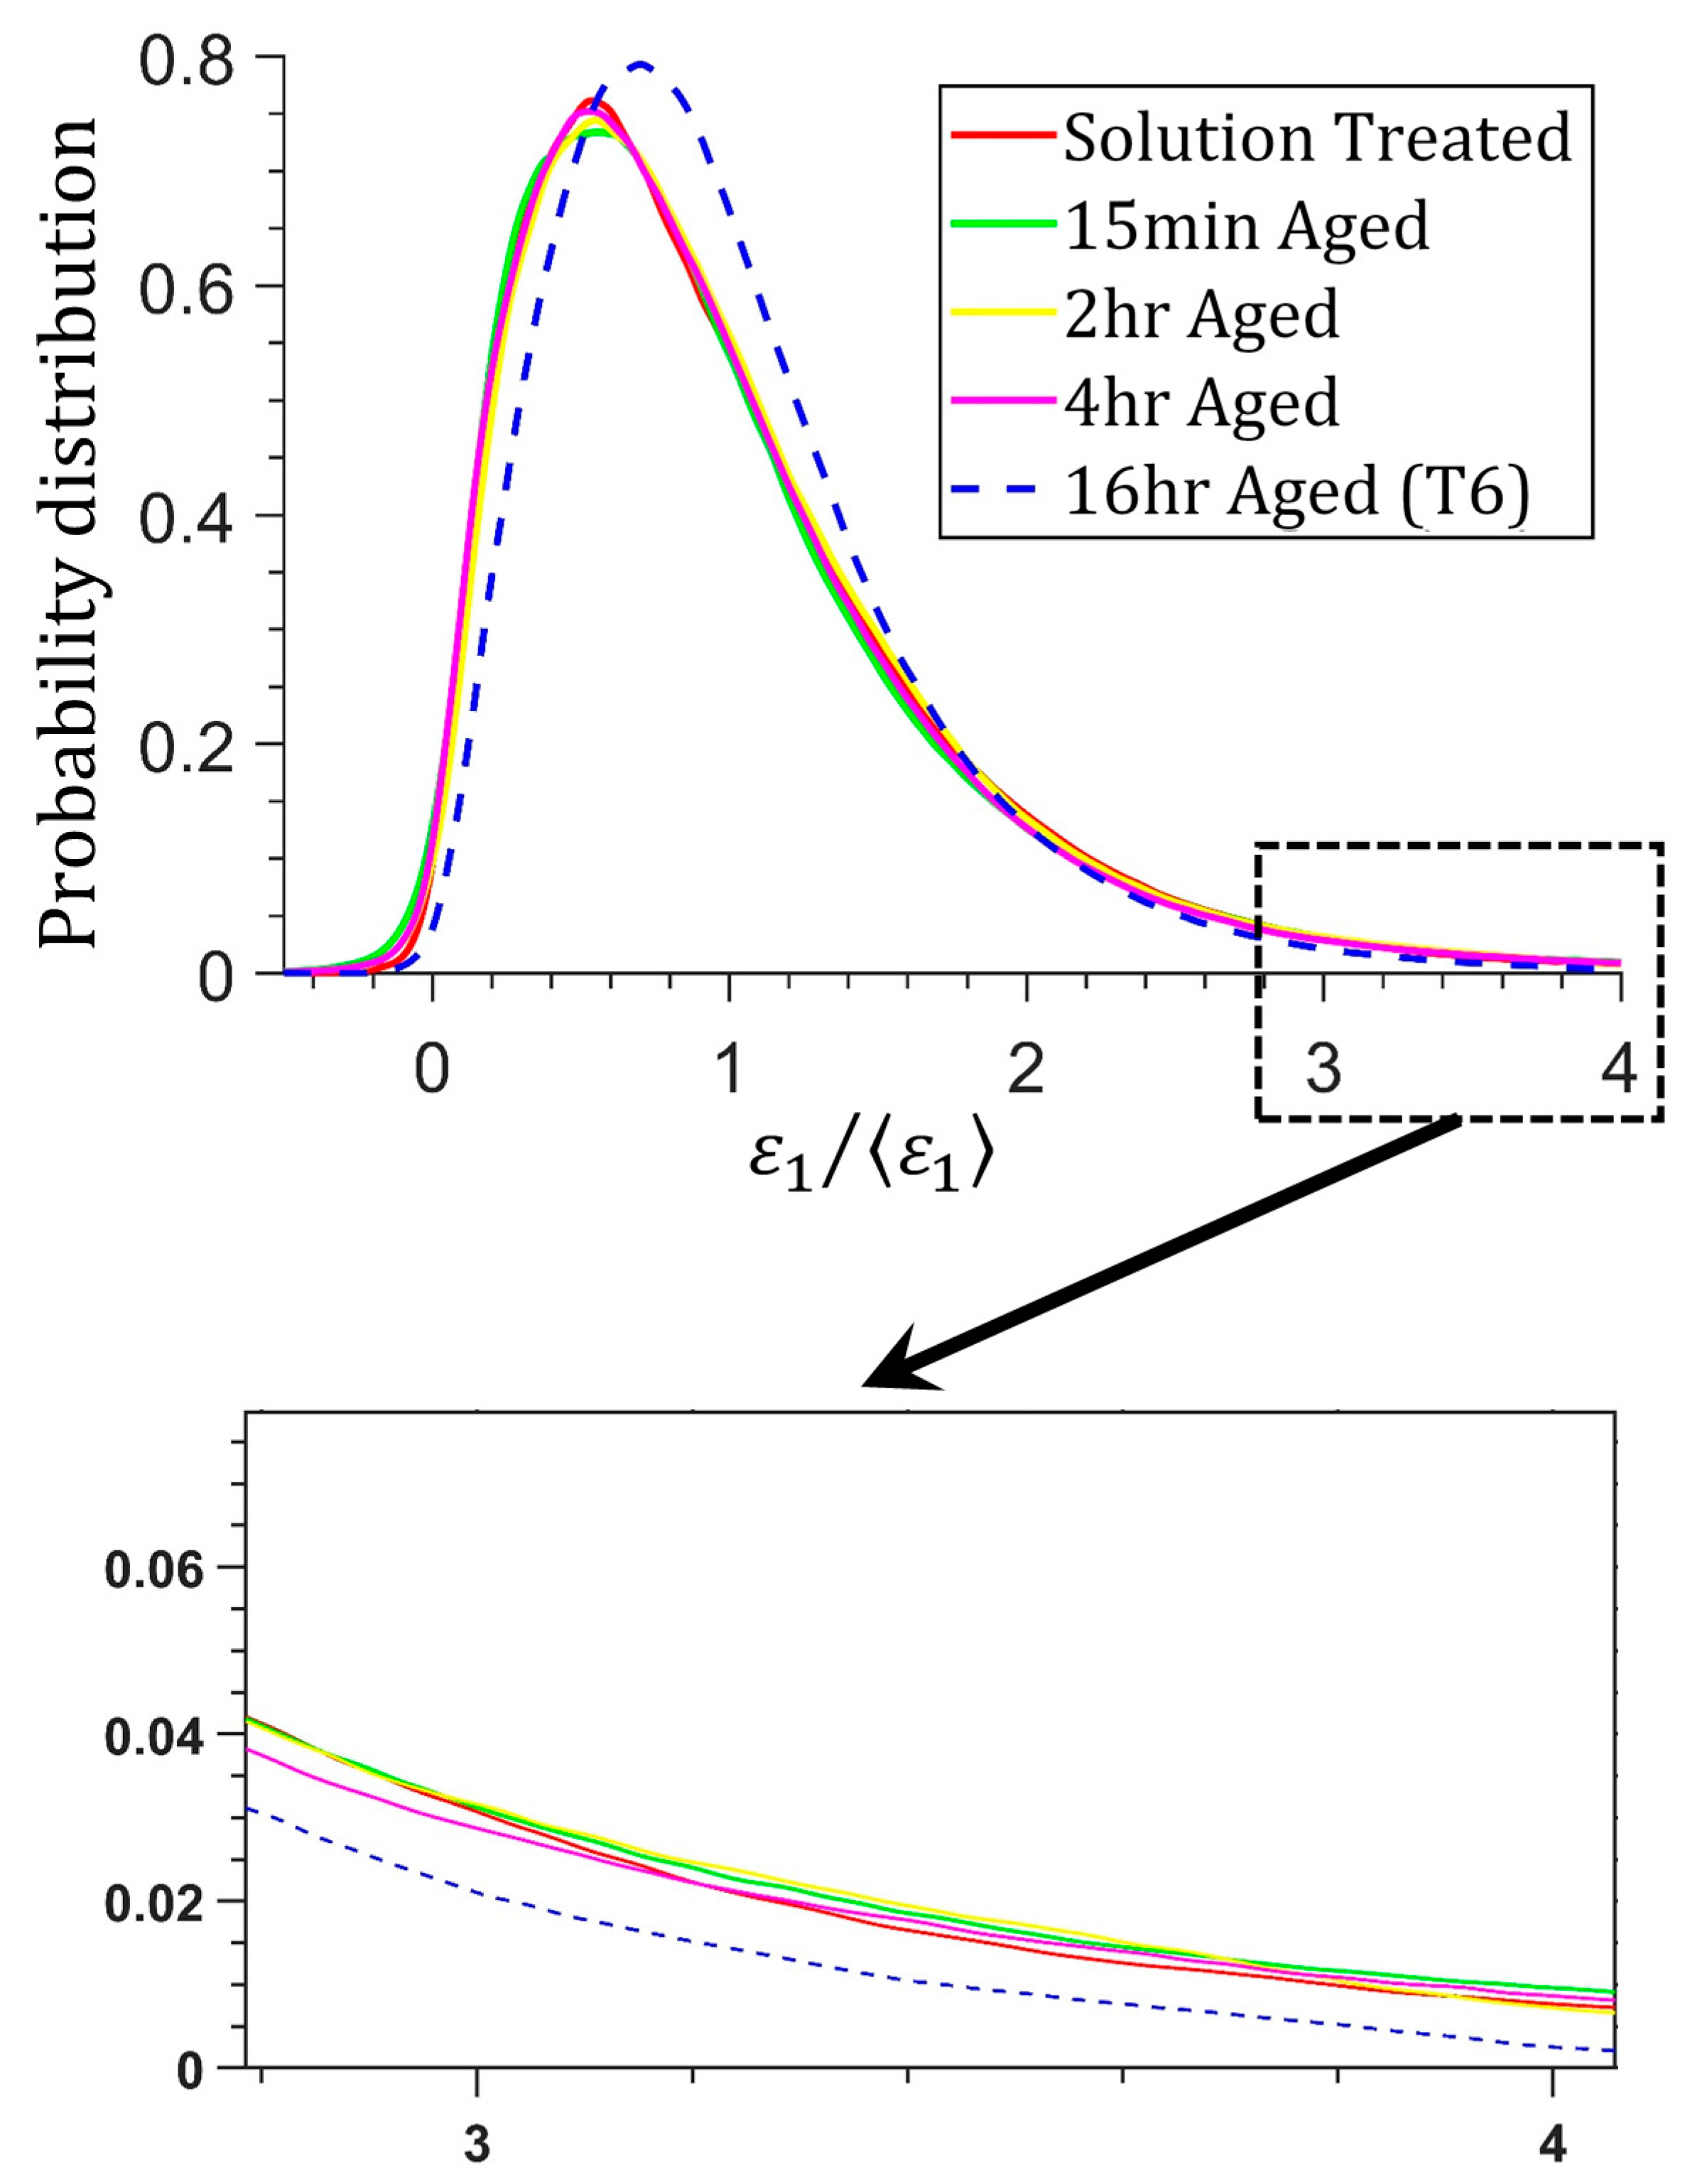
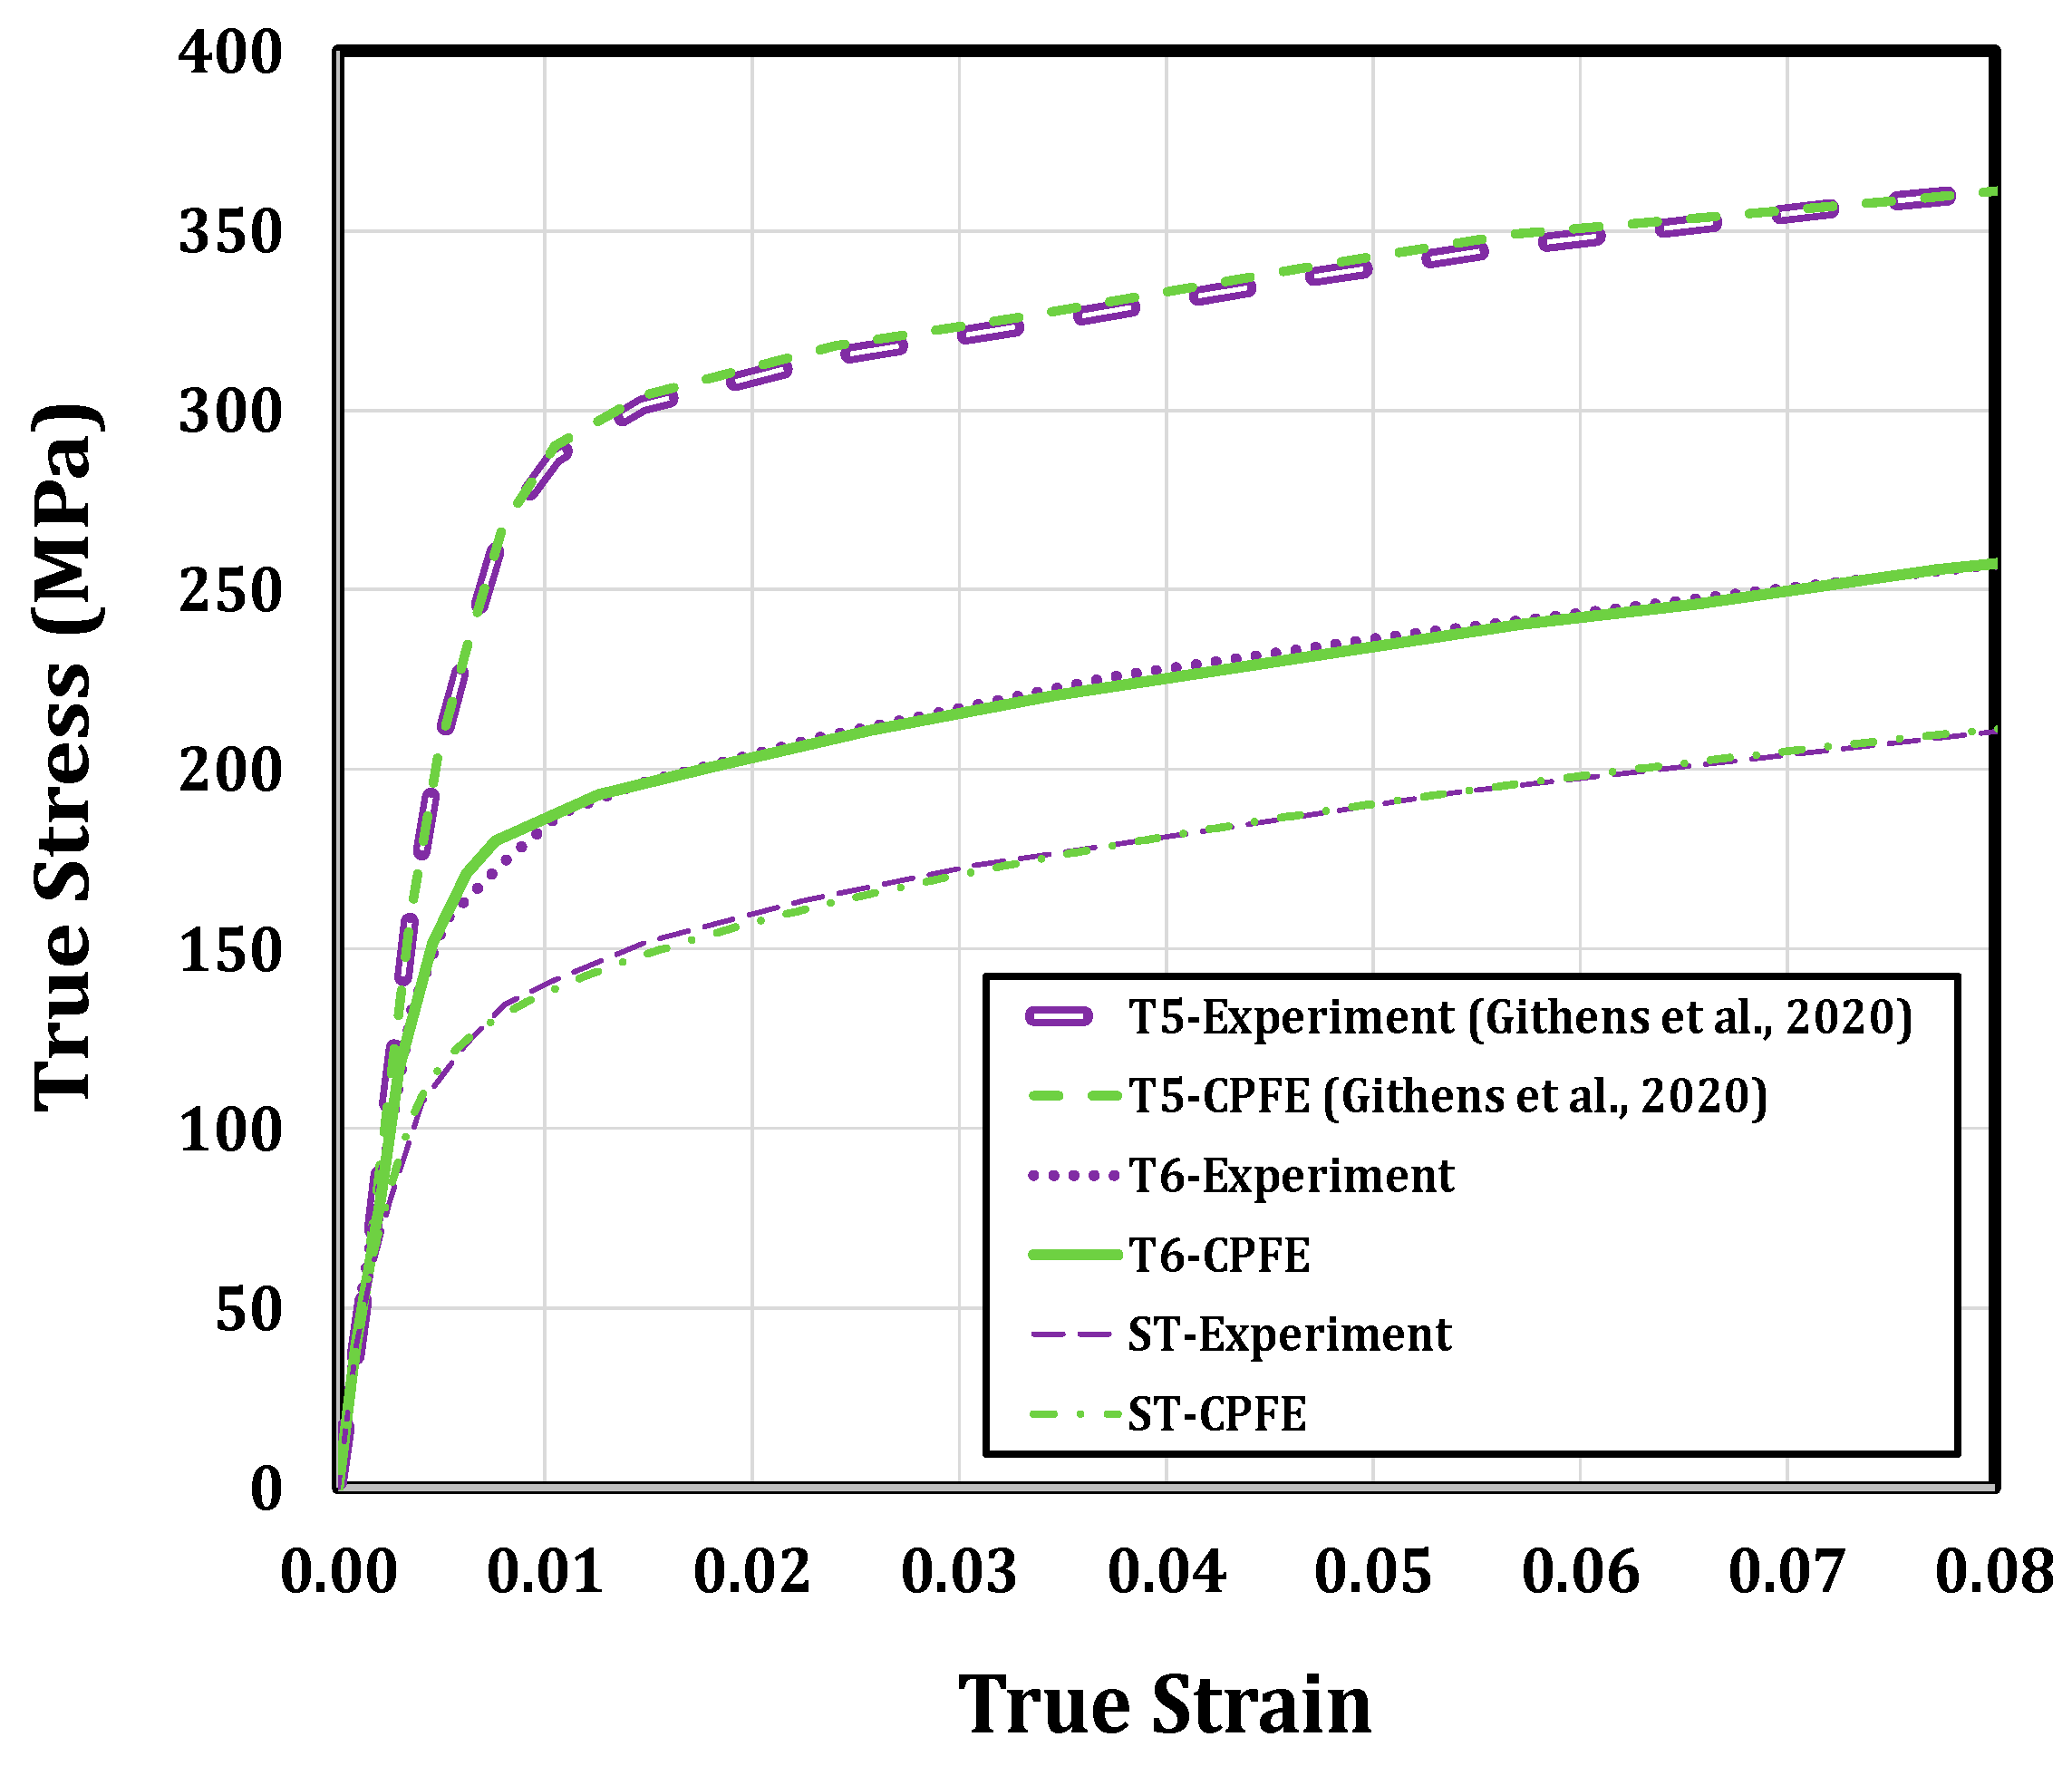
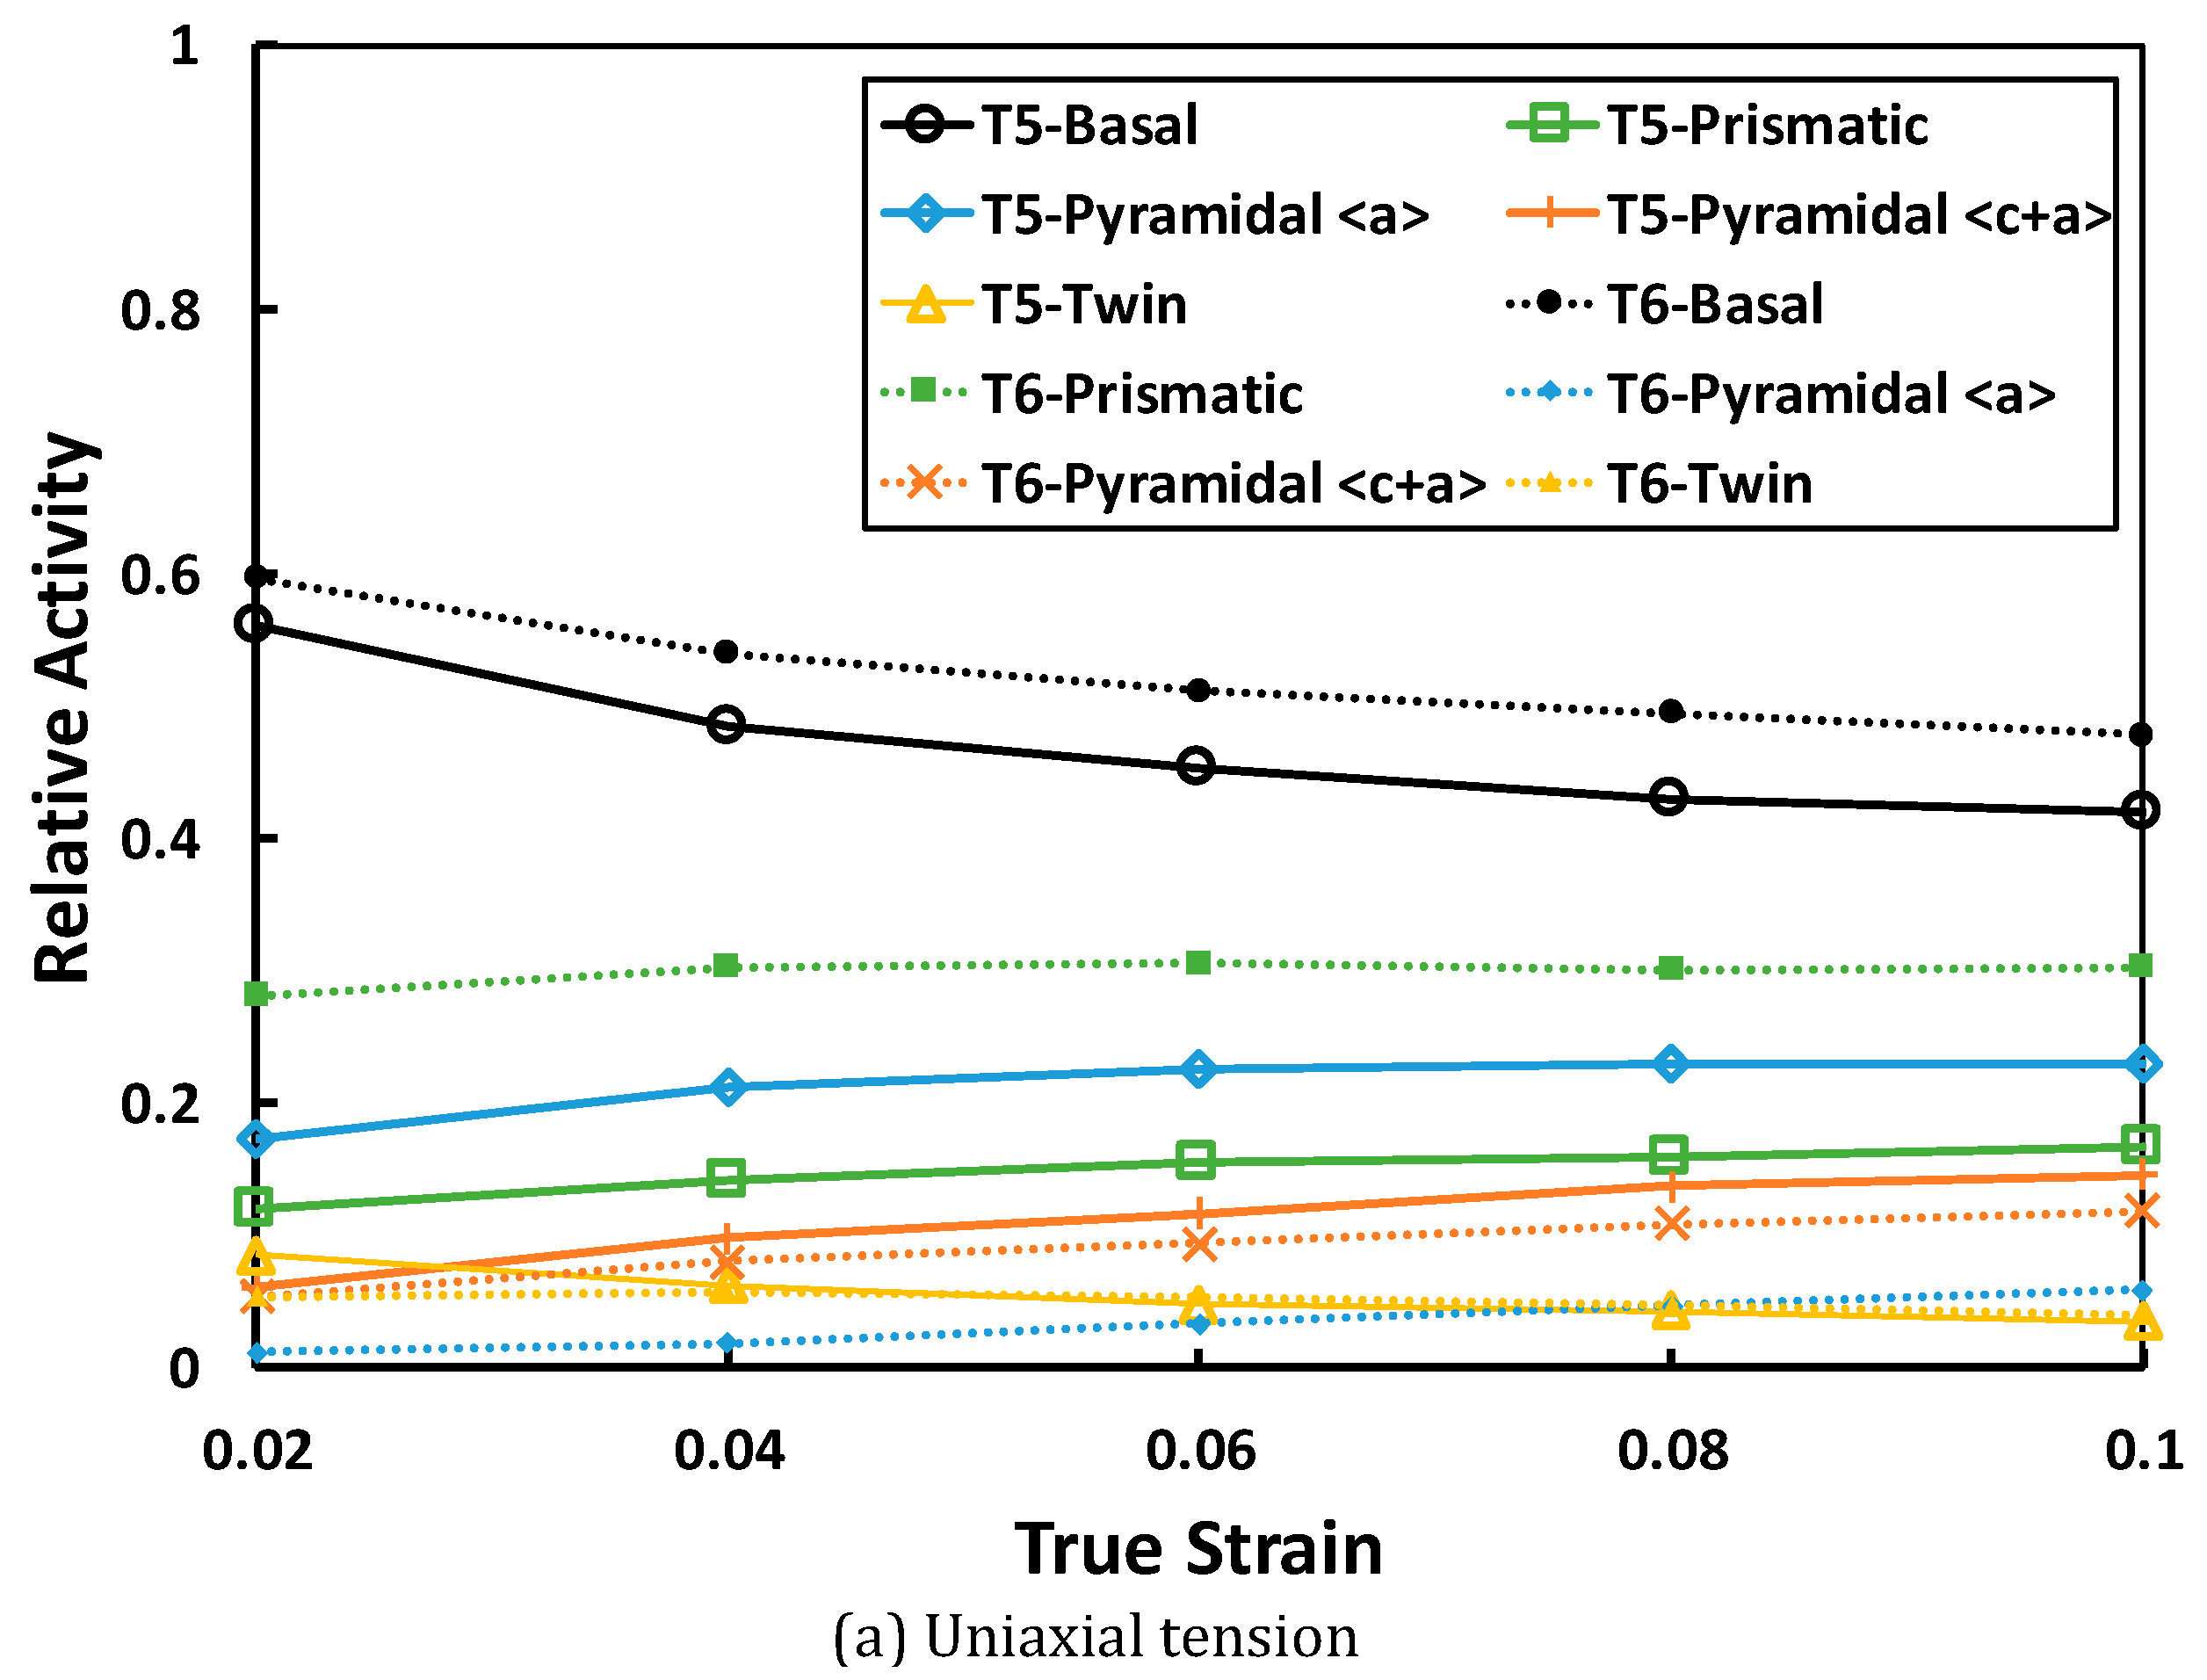
Ganesan et al. [8] incorporated the in-situ DIC along the SEM technique to investigate the effect of heat treatment on the response of WE43 Mg alloy with the weak basal texture. They started with the WE43-T5 sample and applied different heat treatment conditions of the solution treated (ST) and aging times of 15 min, 2 h, 4 h, and 16 h (T6 condition). They investigated the effect of heat treatment on the macro responses of WE43 Mg (Figure 21). The results showed that the T5 condition had the highest yield stress, which can be attributed to its finer grain size. Within the heat-treated samples, the T6 condition had the maximum yield strength, which was due to the role of precipitates. Each of the samples was then subjected to the in-situ uniaxial tension loading along the rolling direction, where the SEM-DIC technique was used to gather the deformation maps. Figure 22 shows the normalized maximum principal strain maps at ε   =   3.23% in samples with different aging times. They showed that the strain map of the sample with T6 condition had fewer localized strains. In order to quantitatively investigate their observation, Ganesan et al. [8] studied the strain probability distribution of the tested samples (Figure 23). They showed that it is ~ 3.84 more probable to find a localized strain of 4 × ( Average   applied   strain ) in underaged samples compared to the T6 condition.
They further investigated the effect of heat treatment using the CPFE simulation. They validated the CPFE framework and showed that the simulation can capture the stress-strain response of samples with different heat treatment conditions (Figure 24). They further validated the simulation by predicting the strain map of WE43-T6 at different tensile strains (Figure 25). The results showed that not only can the CPFE capture the macro responses, but it can also accurately model the local field maps. After validation of the CPFE framework, Ganesan et al. [8] used the CPFE simulation to investigate the deformation mechanisms involved in the response of T5 and T6 conditions. Accordingly, they compared the contribution of each deformation mode for each of these heat treatment conditions of T5 and T6 during uniaxial tension and compression (Figure 26). They showed that the heat treatment condition alters the contribution of different deformation modes. A sample with a T5 condition has finer grains, which alter the CRSS of deformation modes. For instance, they obtained the ratio of C R S S prismatic / C R S S pyramidal a = 1.02 in the T5 condition, while this ratio was 0.88 for the T6 condition. They stated that this was the underlying mechanism for more active pyramidal a in the T5 condition compared to the activity of prismatic, while pyramidal a slip mode was nearly inactive in the T6 condition. Finally, Ganesan et al. [8] used the CPFE simulation results to capture the Hall–Petch constant for different deformation modes in WE43 Mg alloy, which were 4.53, 11.33, 8.9, 11.18, 5.1 MPa × mm 1 / 2 for different deformation modes of basal, prismatic, pyramidal a , pyramidal c + a , and extension twinning, respectively.

3.2. In-Situ Synchrotron X-ray Techniques

3.2.1. Micromechanics of Twinning

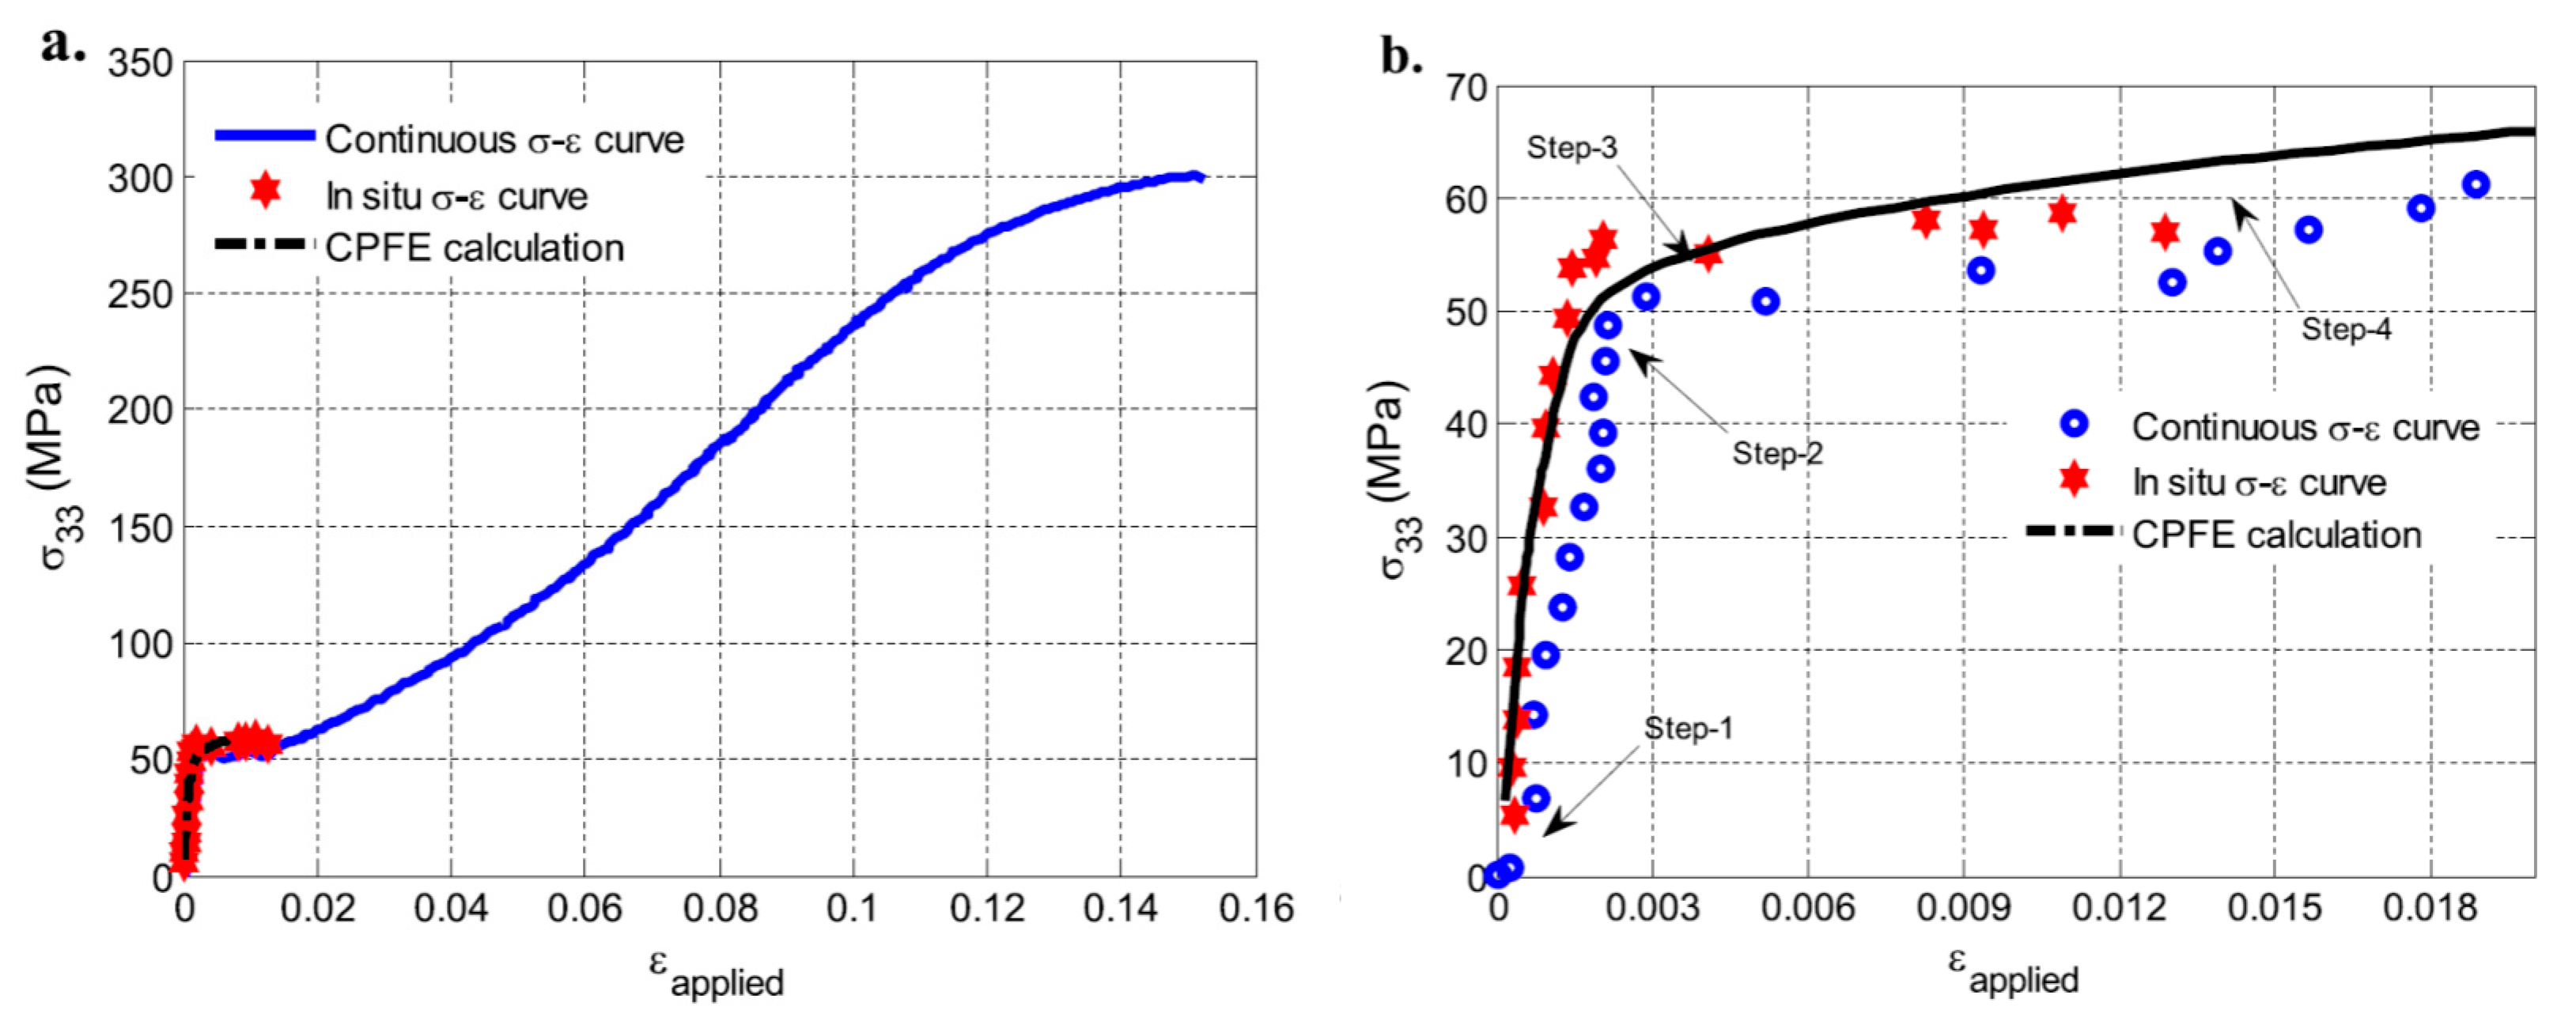
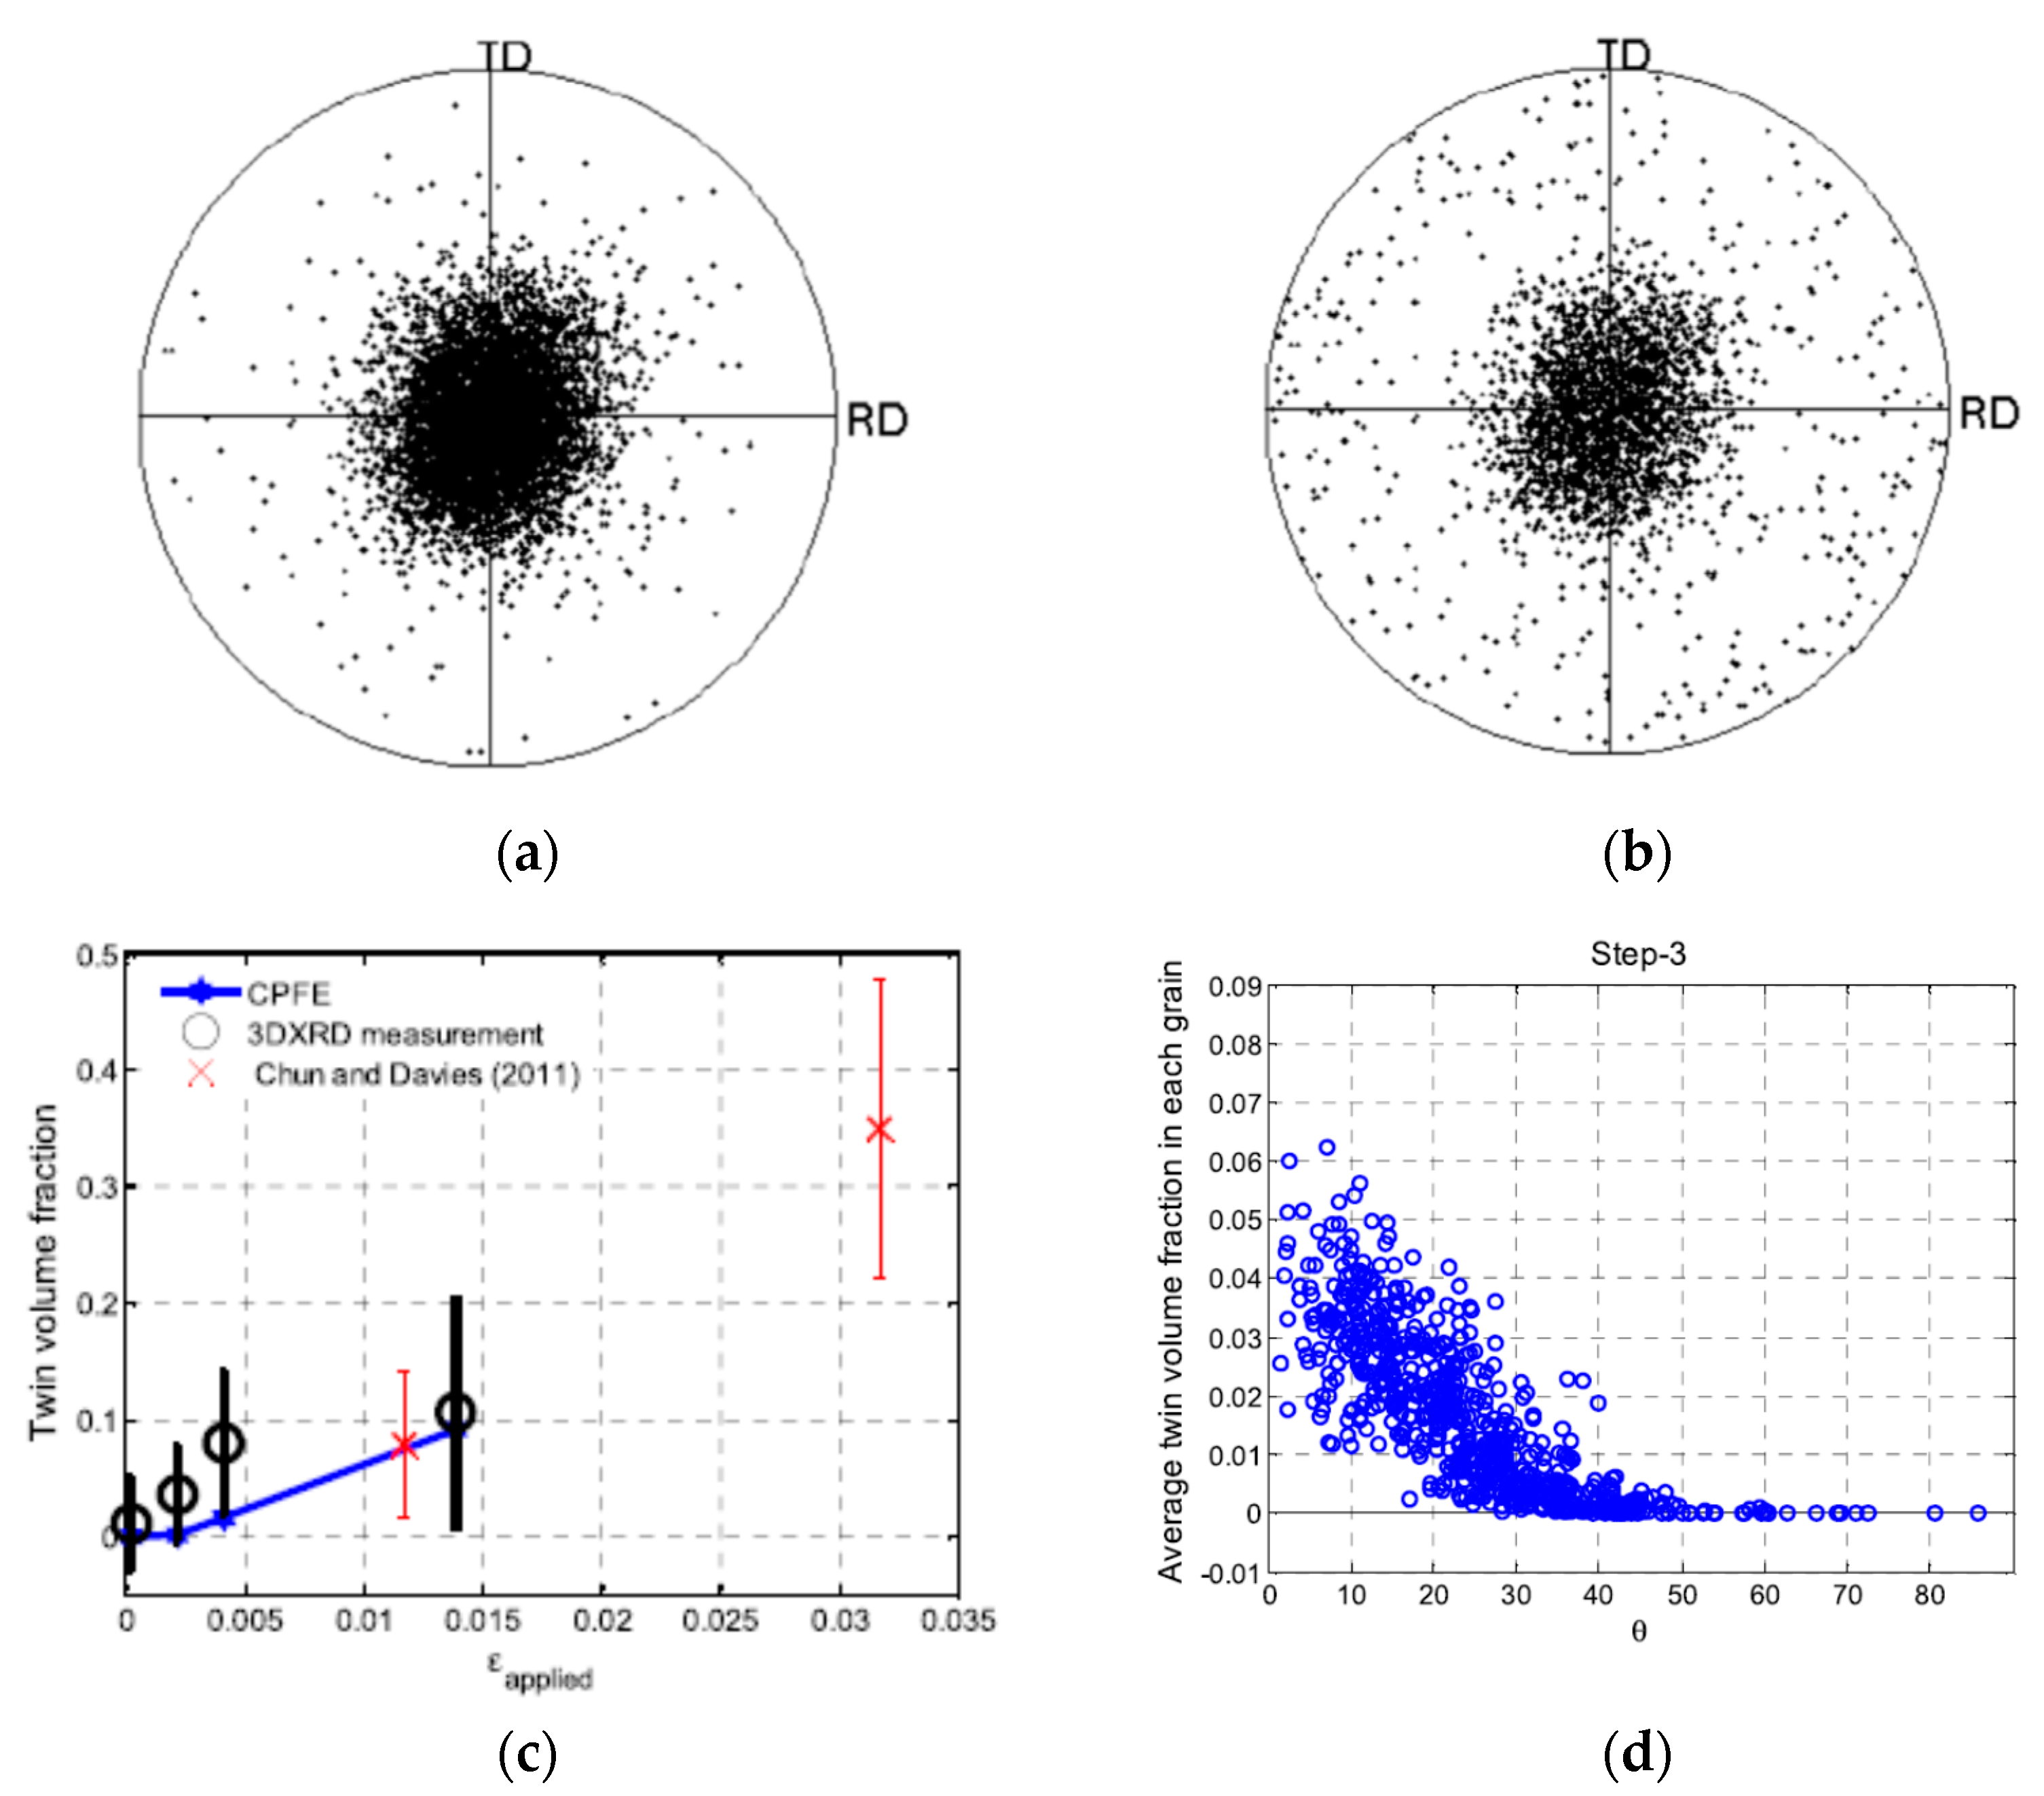
Abdolvand et al. [27] used a combination of CPFE and in-situ 3DXRD experiments to investigate deformation twinning in the AZ31B Mg alloy. They applied the uniaxial tension on the sample with the texture favored for twinning during the loading and used the in-situ 3DXRD to study the microstructural evolution. They calibrated the CPFE model to capture the stress-strain response, as shown in Figure 27. They also studied the effect of twinning on texture. Accordingly, they measured the { 0002 } pole figures at a tensile strain of ε = 0 % and ε = 0.4 % . In the case of ε = 0 % , as shown in Figure 28a, basal poles were observed to be aligned almost parallel to the normal direction. However, in the case of ε = 0.4 % , as shown in Figure 28b, the deformation twinning reorients the { 0002 } poles, which were observed towards the rolling direction and transverse direction on the outer edges of the pole figure.
Abdolvand et al. [27] also predicted the twin volume fraction using the CPFE simulation, which agrees well with the measured twin volume fraction (Figure 28c). They further investigated the CPFE simulation results by studying the variation of predicted twin volume versus misorientation angle ( θ ) between normal to the basal plane of the grain and the loading direction predicted by CPFE at a tensile strain of ε = 0.4 % (Figure 28d). In the case of grains with θ > 40 ° , no twinning was predicted by CPFE. Furthermore, the scatter of twin volume for grains with similar θ showed that global θ was not the only governing factor of twinning volume as the effect of the local neighborhood and load sharing considerably varied the predicted twin volume fraction.
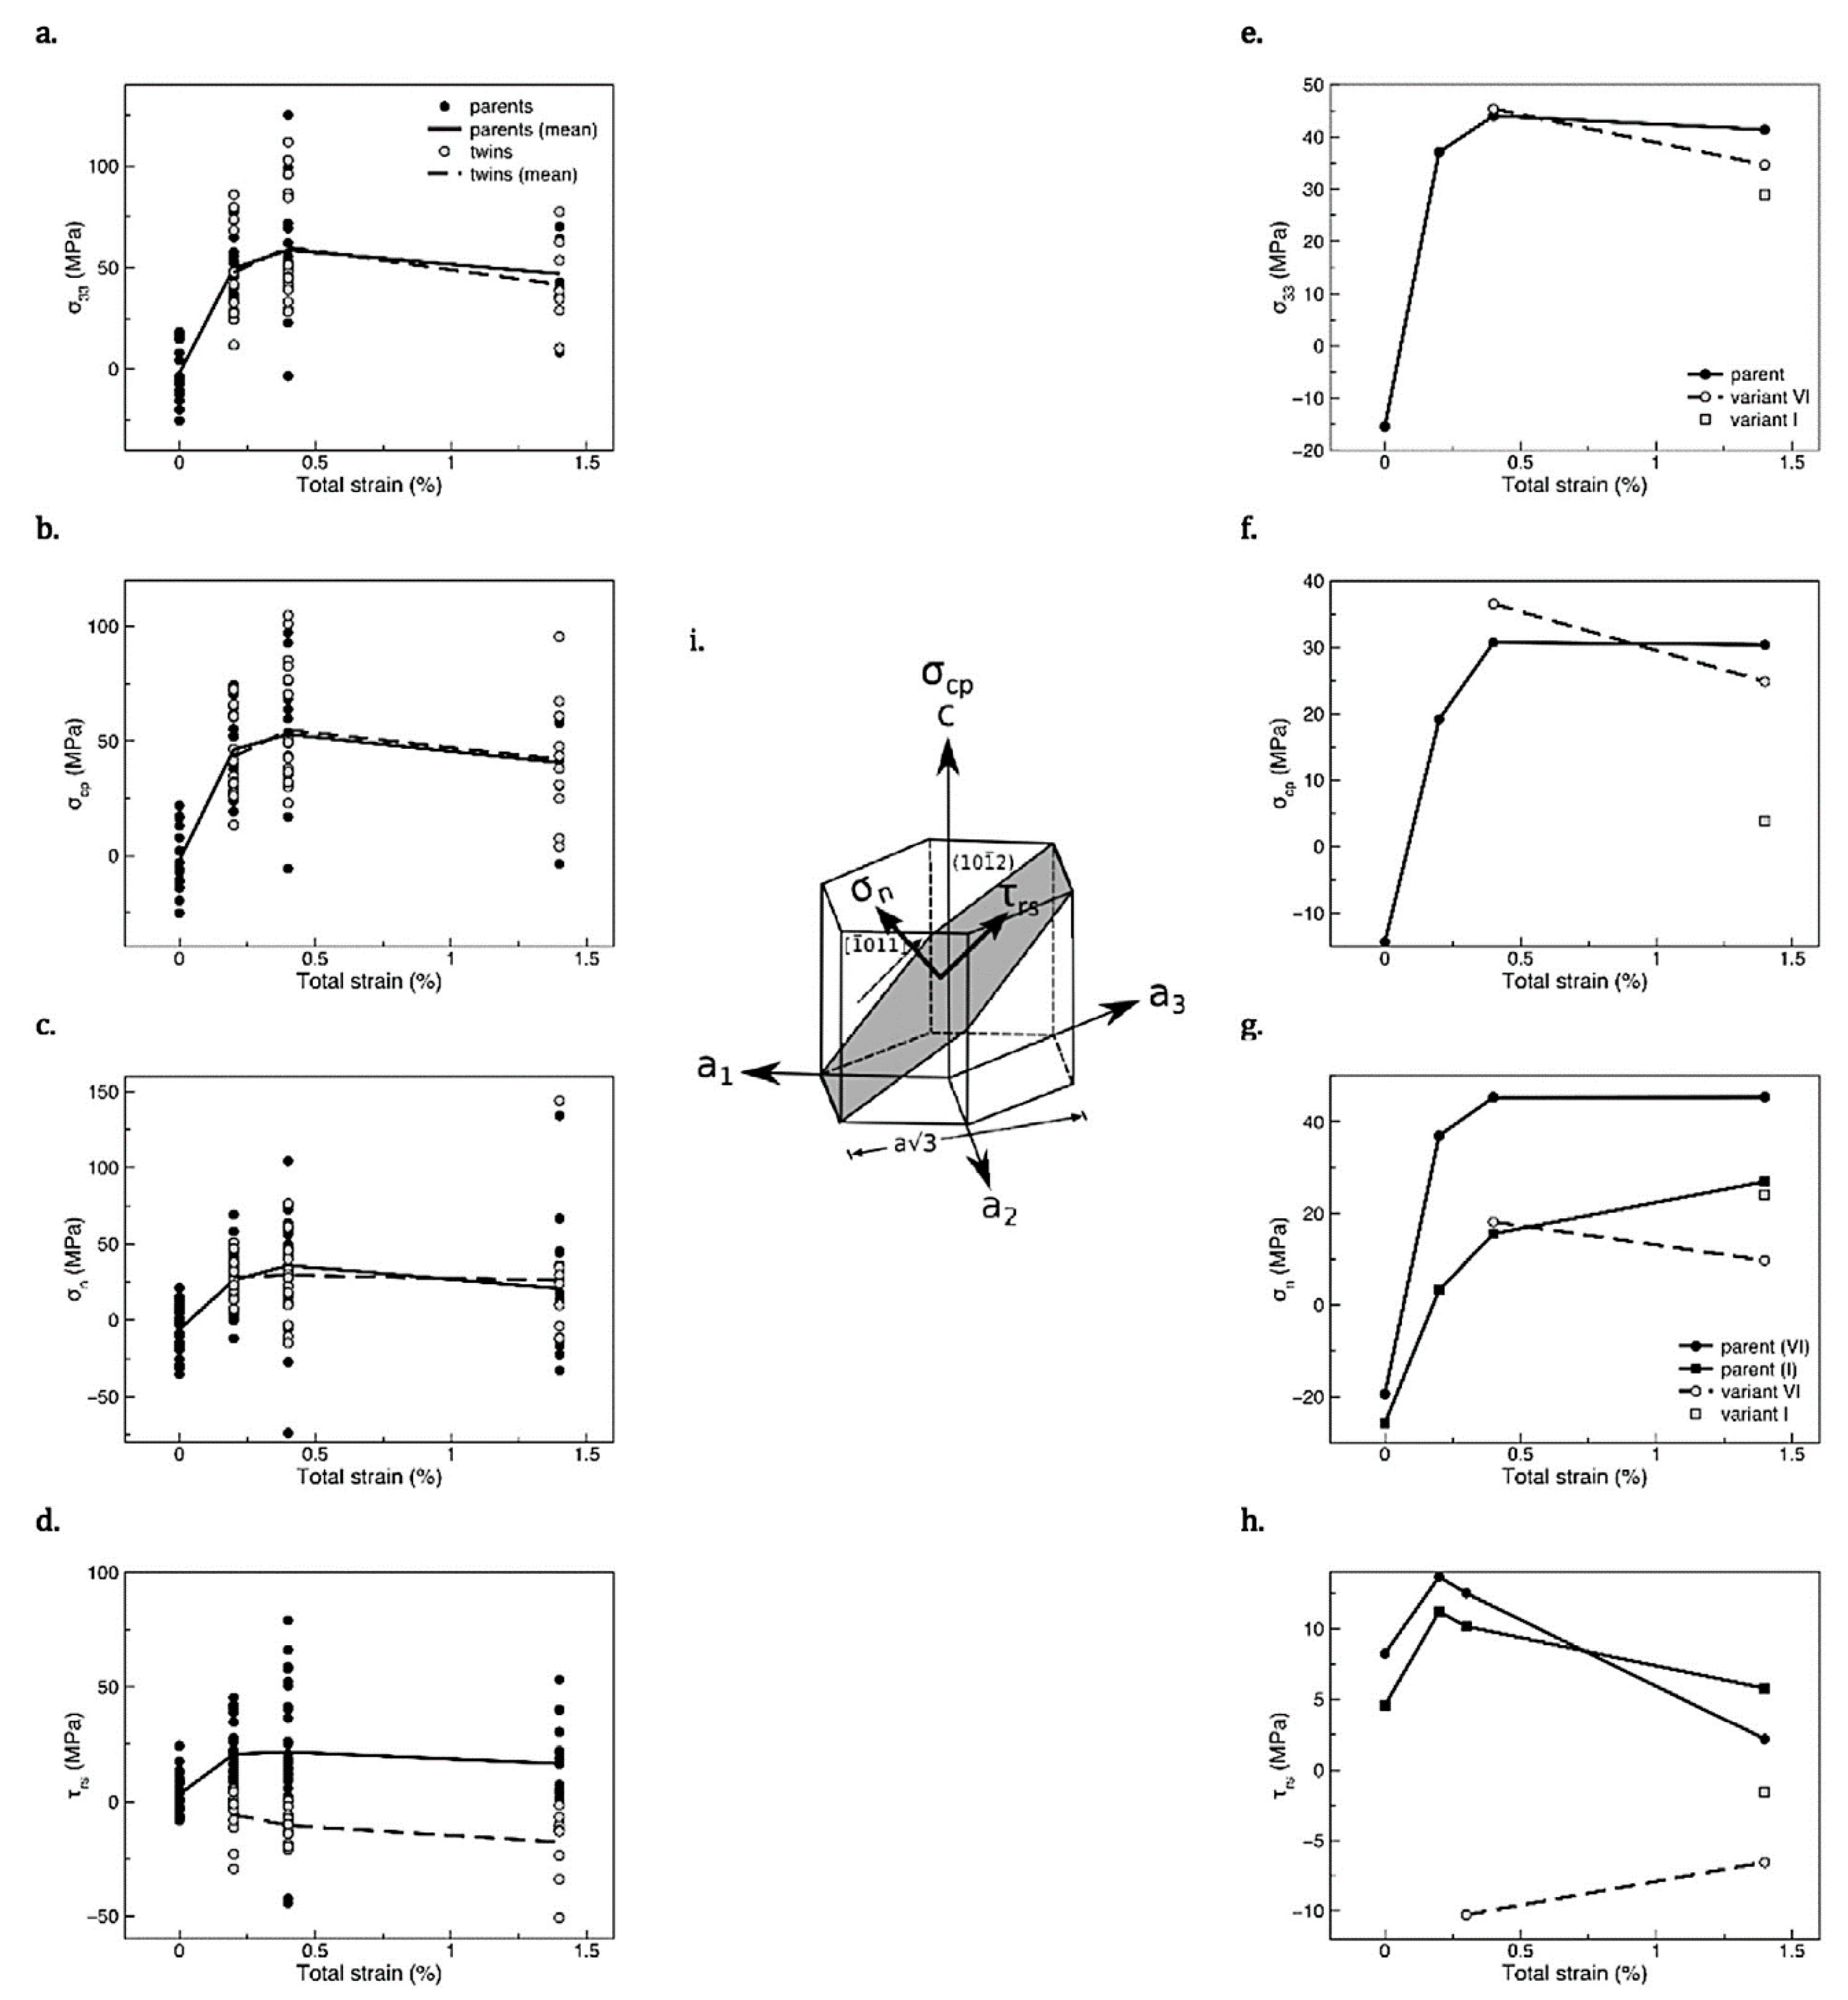
Another important subject Abdolvand et al. [27] addressed was the stress inside the twinned children and parent grains using the in-situ 3DXRD results (Figure 29). They selected 15 parent grains along 20 twinned children nucleated within those parent grains. Figure 29i shows different components of the stress presented in the results summary. Different stress components were the normal stress σ 33 , stress along the c-axis of the untwinned parent σ c p , and normal and shear stress according to the twinned child plane, i.e., σ n and τ r s , respectively. The mean value of each stress was represented by a line. Abdolvand et al. [27] observed that the mean normal stress σ 33 and σ c p almost followed the applied stress trend. Because of the texture (c-axis is almost aligned with the loading direction), the values of σ 33 and σ c p were close. The values of σ n in untwinned parents and twinned children grains were close, which were in the region of 23 30 MPa, which did not vary considerably during the loading. Interestingly, Abdolvand et al. [27] observed that the shear stress, which was resolved on the twinning plane, i.e., τ r s , was considerably different in untwinned parent and twinned children grains. They reported that the average value of τ r s in untwinned parent grains was 22 MPa higher than that of the twinned children grains. To further analyze the experimental results, Abdolvand et al. [27] focused on an untwinned parent grain with its two twinned children grains, as shown in Figure 29e–h, which were nucleated due to the activation of the twin variants 1 and 6. The twin variant 1 was nucleated at the normal stress of σ n ~ 20 MPa, which was close to that of the parent, as shown in Figure 29a–d. The twin variant 6 appeared at the strain value of 0.4%, in which the shear stress τ r s is ~ 19 MPa in the untwinned parent grain and ~ 10 MPa for the twinned grain. The results showed that the shear stress, which was resolved on the twinning plane, i.e., τ r s , was smaller for both twin variants compared to the parent grains, which was in line with the results shown in Figure 29a–d.

3.2.2. Detwinning

The deformation slip and twinning mechanisms were enough to define the response of the Mg alloys during simple monotonic loadings. However, in the case of complex loading paths, such as cyclic loadings, this was not the case. One should also define the detwinning mechanisms in these cases, as described in Section 2.3. In-situ Synchrotron X-ray techniques have contributed to investigate the detwinning mechanisms. In the case of Mg and its alloys, Murphy-Leonard et al. [7] incorporated the HEDM technique to investigate the twinning-detwinning in pure Mg. They applied cyclic loading with three different applied strains of 0.4%, 0.52%, and 0.75%. The sample was extruded, and loading was applied along the extrusion direction. The c-axis was mostly perpendicular to the extrusion direction. Accordingly, extension twinning was a favored mechanism during compression loading. To monitor the twin volume, Murphy-Leonard et al. [7] measured the X-Ray diffraction peaks of the basal { 0   0   0   2 } planes. In other words, initially, there was no basal { 0   0   0   2 } peak intensity along the loading direction. As a twinned child is nucleated and grows, a 86.3° reorientation of the basal pole occurs within a parent grain, and the peak intensity starts increasing. Accordingly, Murphy-Leonard et al. [7] introduced the formulation for the twin volume fraction ϕ based on the HEDM data as follows:
ϕ = I L D I N D 0
where I L D is the basal { 0   0   0   2 } peak intensity along the loading direction, and I N D 0 is the initial basal { 0   0   0   2 } peak intensity along the normal direction.
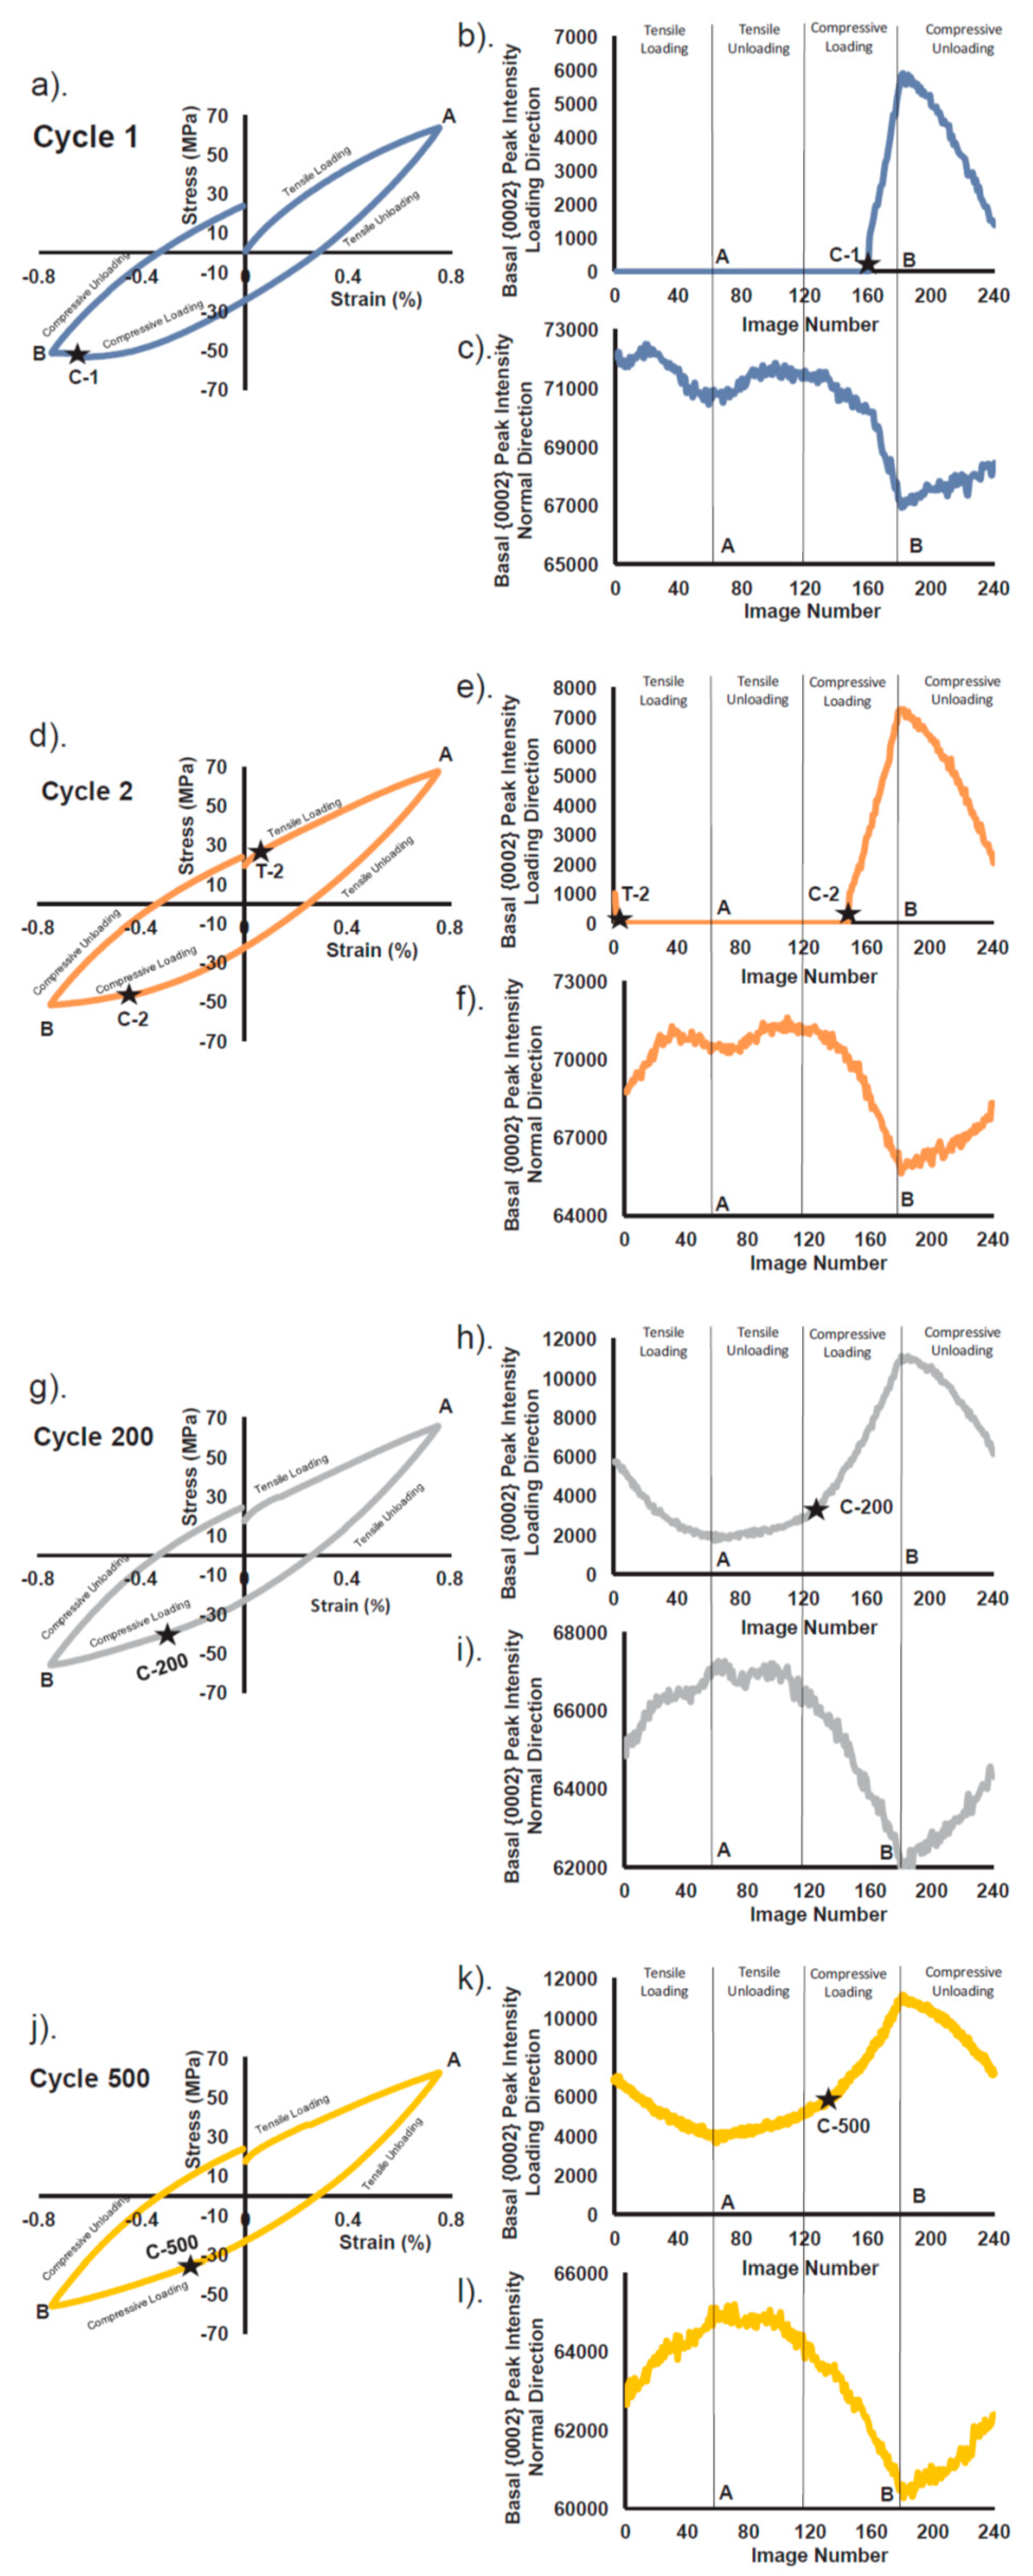
Figure 30 shows the cyclic response of the sample at different loading cycles, including the stress-strain loops, basal { 0   0   0   2 } peak intensity along the loading direction, and basal { 0   0   0   2 } peak intensity along the normal direction. In cycle 1, Figure 30b shows that the basal { 0   0   0   2 } peak intensity along the loading direction remained zero during the tensile part of the loading, which means there no twin nucleation during the initial tensile loading. The basal { 0   0   0   2 } peak intensity along the loading direction started increasing at the C-1 point in compression and kept increasing until point B, which was the maximum compression loading. At the same time, at point C-1, Figure 30c shows that the basal { 0   0   0   2 } peak intensity along the normal direction started dropping. This was in fact, the reorientation of the c-axis along the normal direction towards the loading direction due to twinning.
As soon as unloading starts, the basal { 0   0   0   2 } peak intensity along the loading direction starts decreasing, while the basal { 0   0   0   2 } peak intensity along the normal direction starts increasing. In other words, the previously twinned children during compression loading were reoriented back to the parent grains. The twin exhaustion occurred at the point T-2 during the second loading cycle, as shown in Figure 30d–f. The variation of basal { 0   0   0   2 } peak intensity in the second cycle followed the same trend similar to the first cycle. However, the twinning initiates at smaller compressive strains C-2 compared to C-1 in the first cycle. In both cycles 1 and 2, the twin was fully exhausted in the tensile loading. However, as shown in Figure 30g–i, all the twinned children were not fully detwinned as the minimum twin volume fraction can be observed at the maximum tension strain A. This twin volume content was named residual twins. Murphy-Leonard et al. [7] showed that the residual twins increased by the number of cycles. One can compare the residual twins in loading cycle 500 at maximum tensile strain (point A) to that of loading cycle 200 to observe the increase in the residual twin content as the number of loading cycle increases.
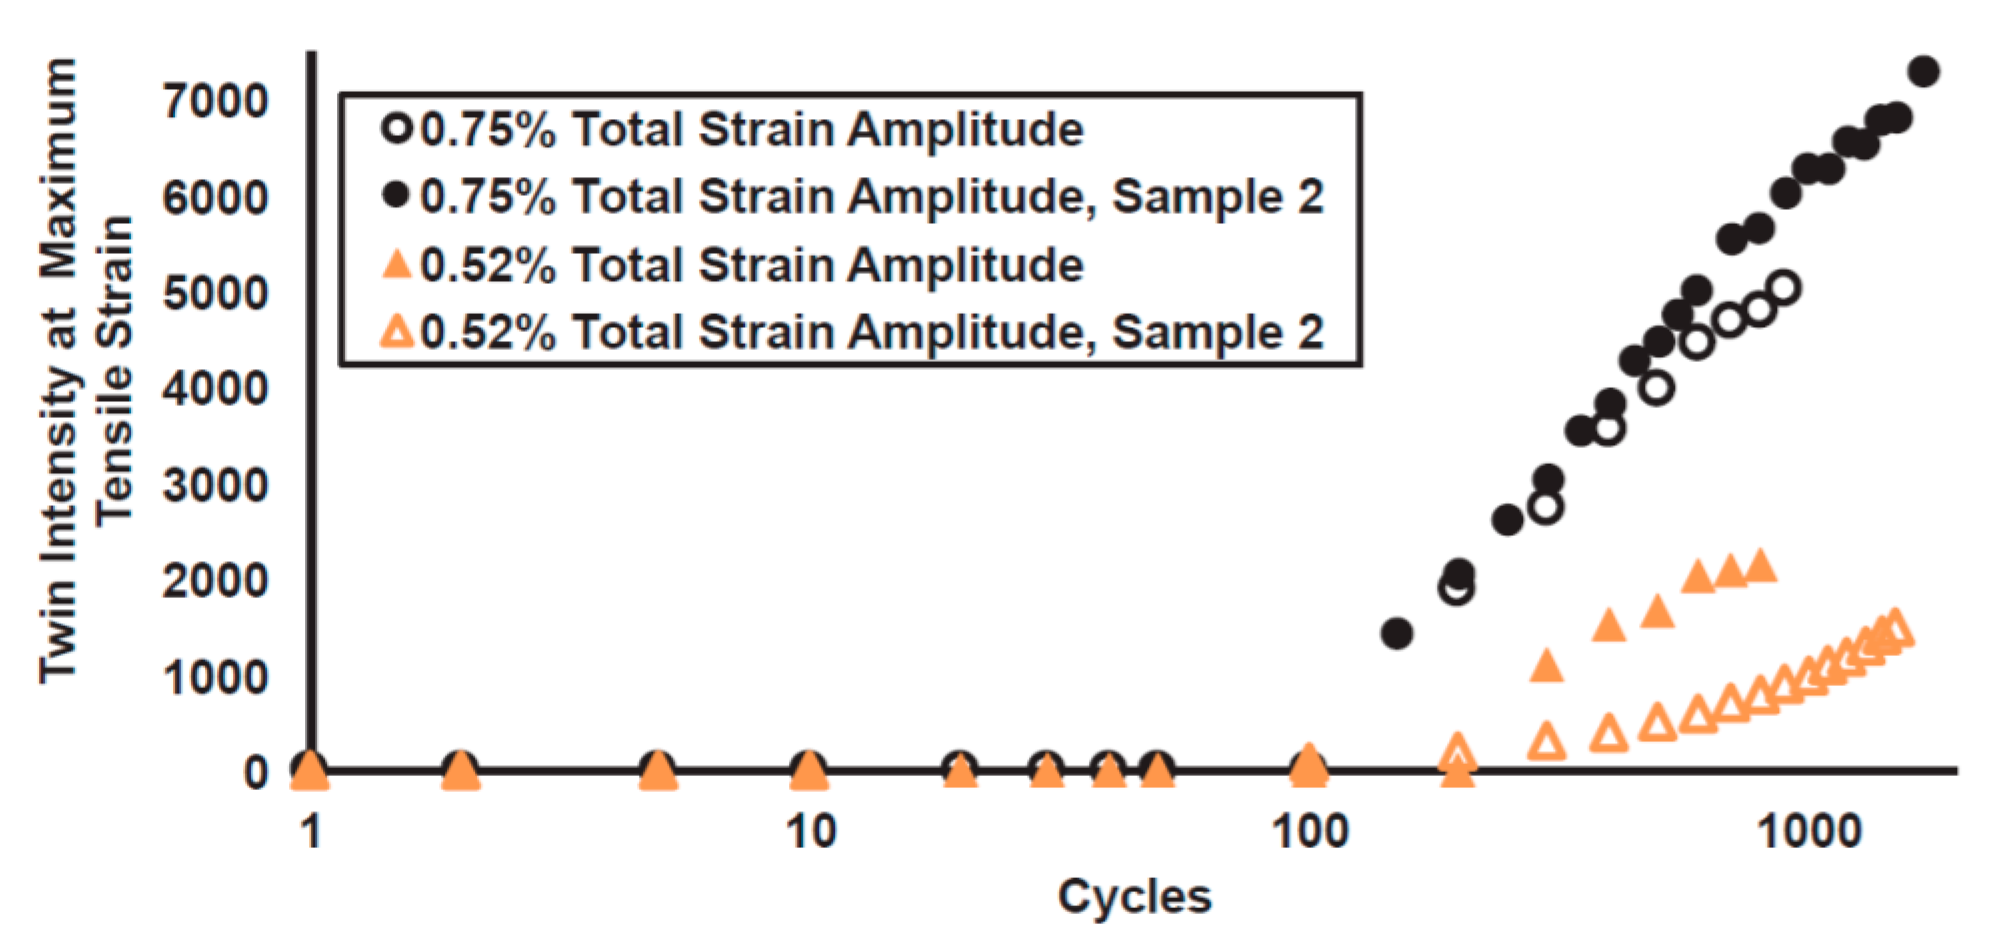
Murphy-Leonard et al. [7] also investigated the variation of twin initiation stress and detwinning exhaustion stress versus the number of cycles, as shown in Figure 31, in the case of cyclic loadings with the strain amplitude of 0.75% and 0.52%. The results showed that as the number of cycles increased, the magnitude of twinning initiation stress decreased while the magnitude of the twin exhaustion stress increased. They further investigated the results and analyzed the variation of twin intensity at maximum tensile strain, which can be inferred as the twin residuals, versus the number of cycles in the case of cyclic loadings with the strain amplitude of 0.75% and 0.52%, as shown in Figure 32. The results showed that before the loading cycle 100, there was no twinning intensity at maximum tensile strain independent of the strain amplitude, i.e., there were no residual twins. In the cases of loading cycles higher than 100, the residual twin content increased as the number of cycles increased. Furthermore, the residual twin content of samples subjected to the strain amplitude of 0.75% was larger than those subjected to the strain amplitude of 0.52%. In other words, the residual twin content increased by the strain amplitude. An open-source CPFE software PRISMS-Plasticity [103] was later used to capture the cyclic response of the sample, as shown in Figure 33. The results showed that the CPFE simulation can successfully capture the experimental cyclic stress-strain response.

3.3. In-Situ Neutron Diffraction

Micromechanics of Twinning

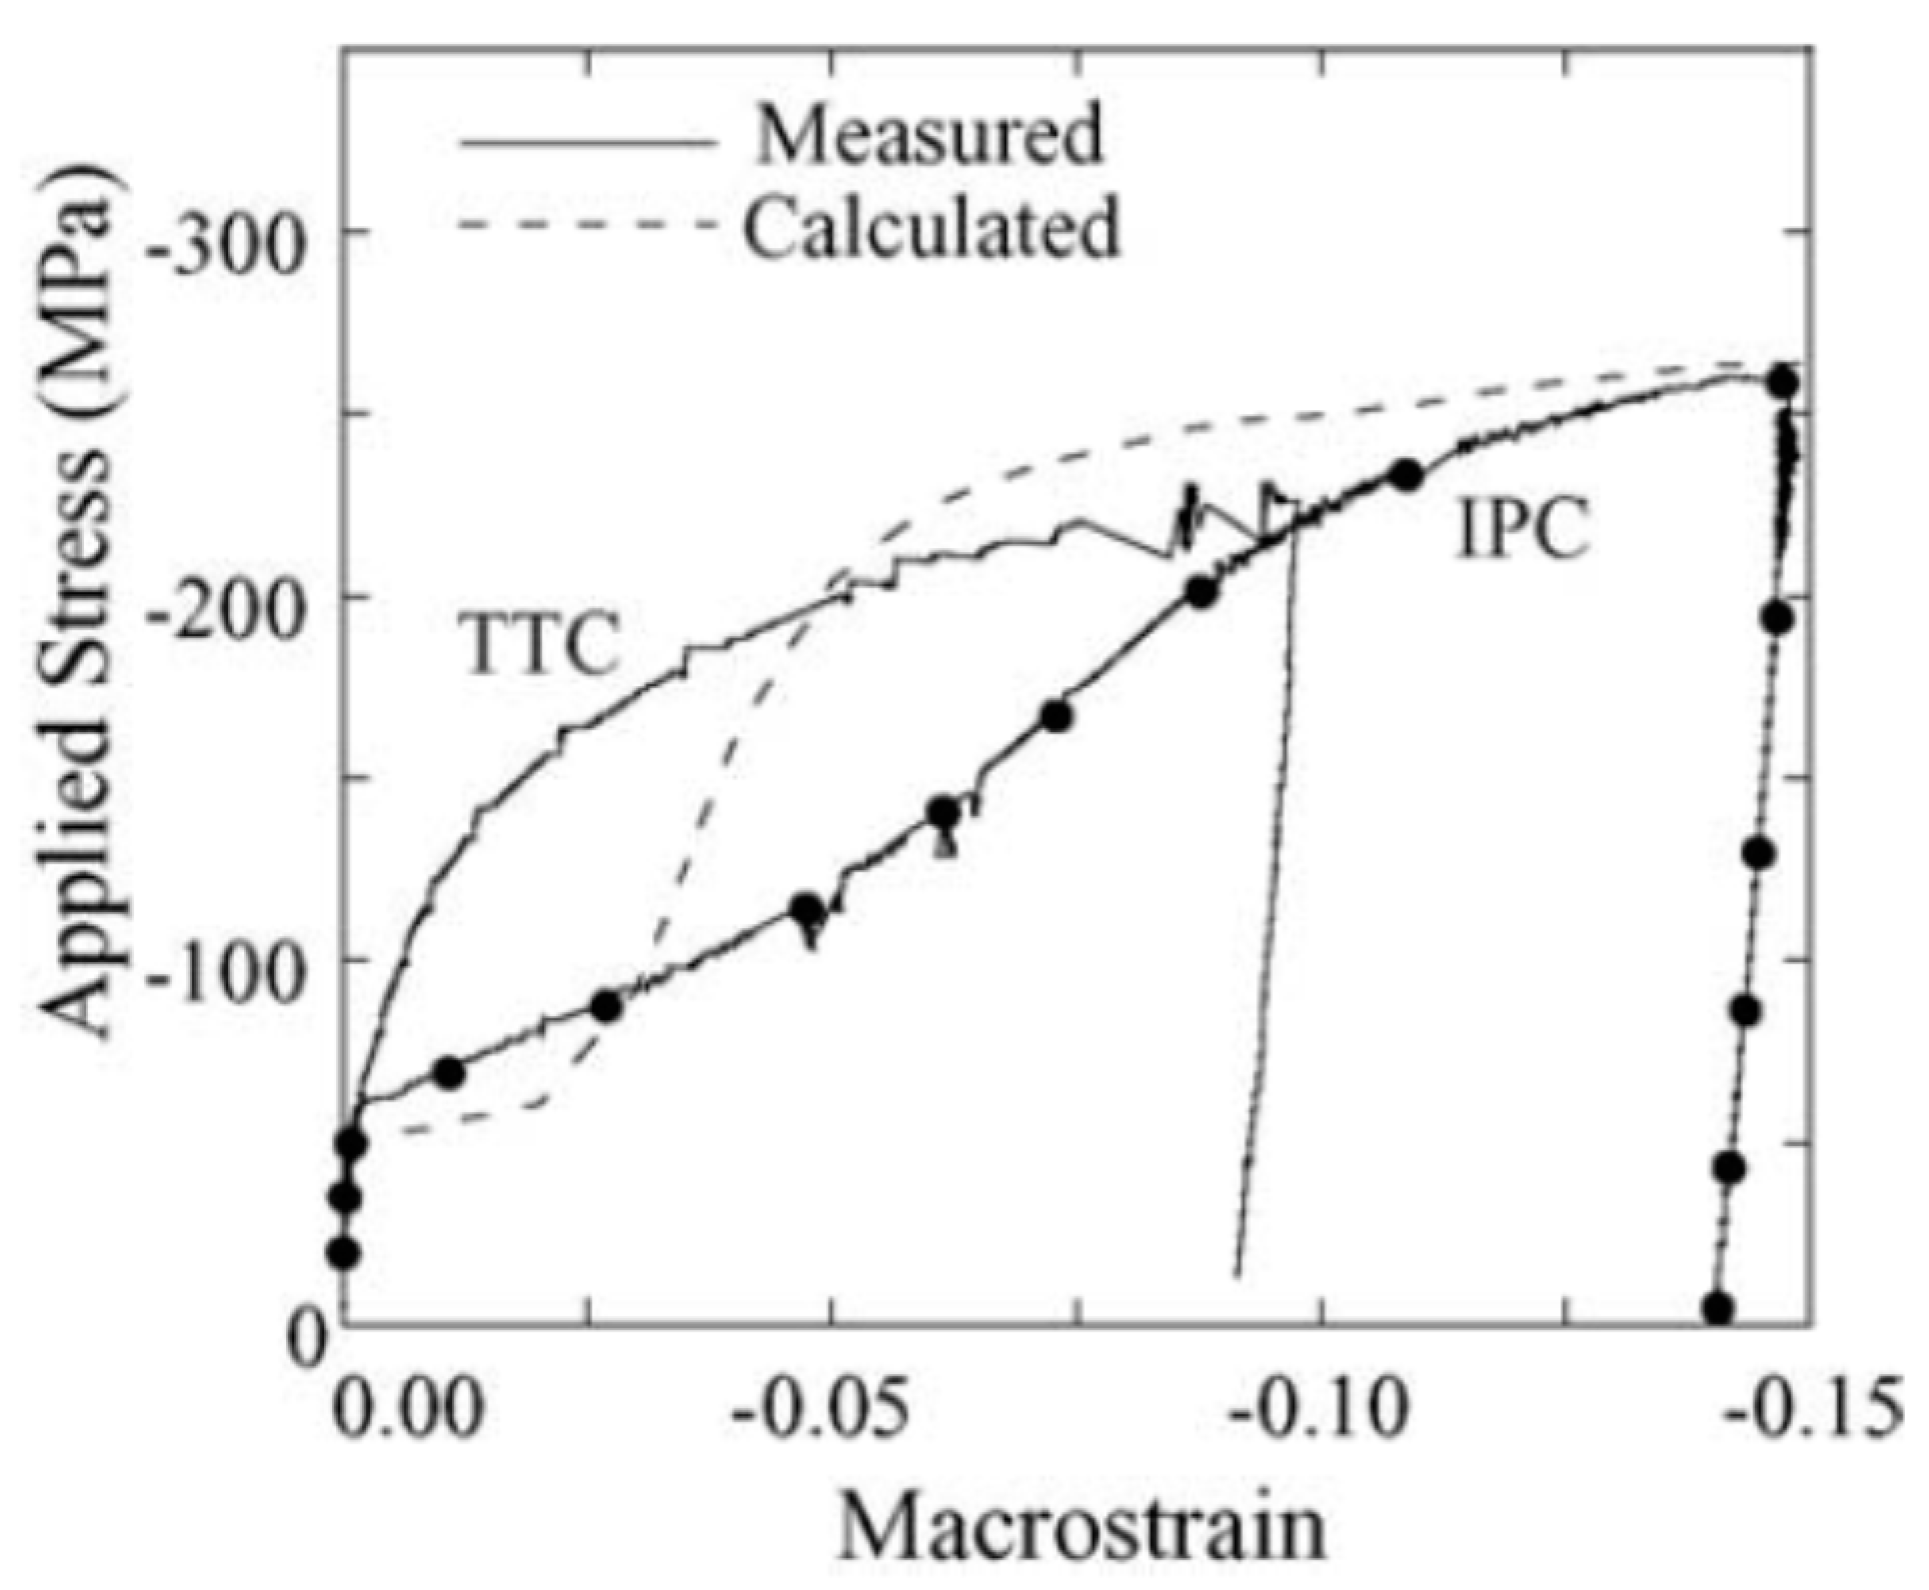
Brown et al. [34] incorporated the in-situ neutron diffraction to investigate the evolution of internal strain and texture during extension twinning in the AZ31B Mg alloy. They applied different loading paths that include in-plane compression (IPC), in-plane tension (IPT), and through-thickness compression (TTC), where the c-axis of most of the grains were perpendicular to the loading direction. Among these three loading paths, the extension twinning was the governing deformation mechanism in the IPC, which was the main focus of their study [34]. They used the VPSC framework to simulate the sample response during in-plane compression. Figure 34 presents the stress-strain responses of AZ31B Mg alloy during TTC and IPC. The circles on the IPC curve represent the strains at which the in-situ neutron diffraction measurements were conducted. The VPSC results were also presented as the dashed line for the IPC loading. The stress-strain response of IPC loading yields at the stress value of ~ 60 MPa, which was followed by a plateau with a small hardening rate. This plateau is commonly attributed to the role of extension twinning [34]. The hardening rate starts increasing at the inflection point that occurs at the strain of ~ 5%. For strain values larger than ~ 8%, the stress during IPC becomes equal or larger than that of the TTC loading, and the rate of work hardening decreases again.
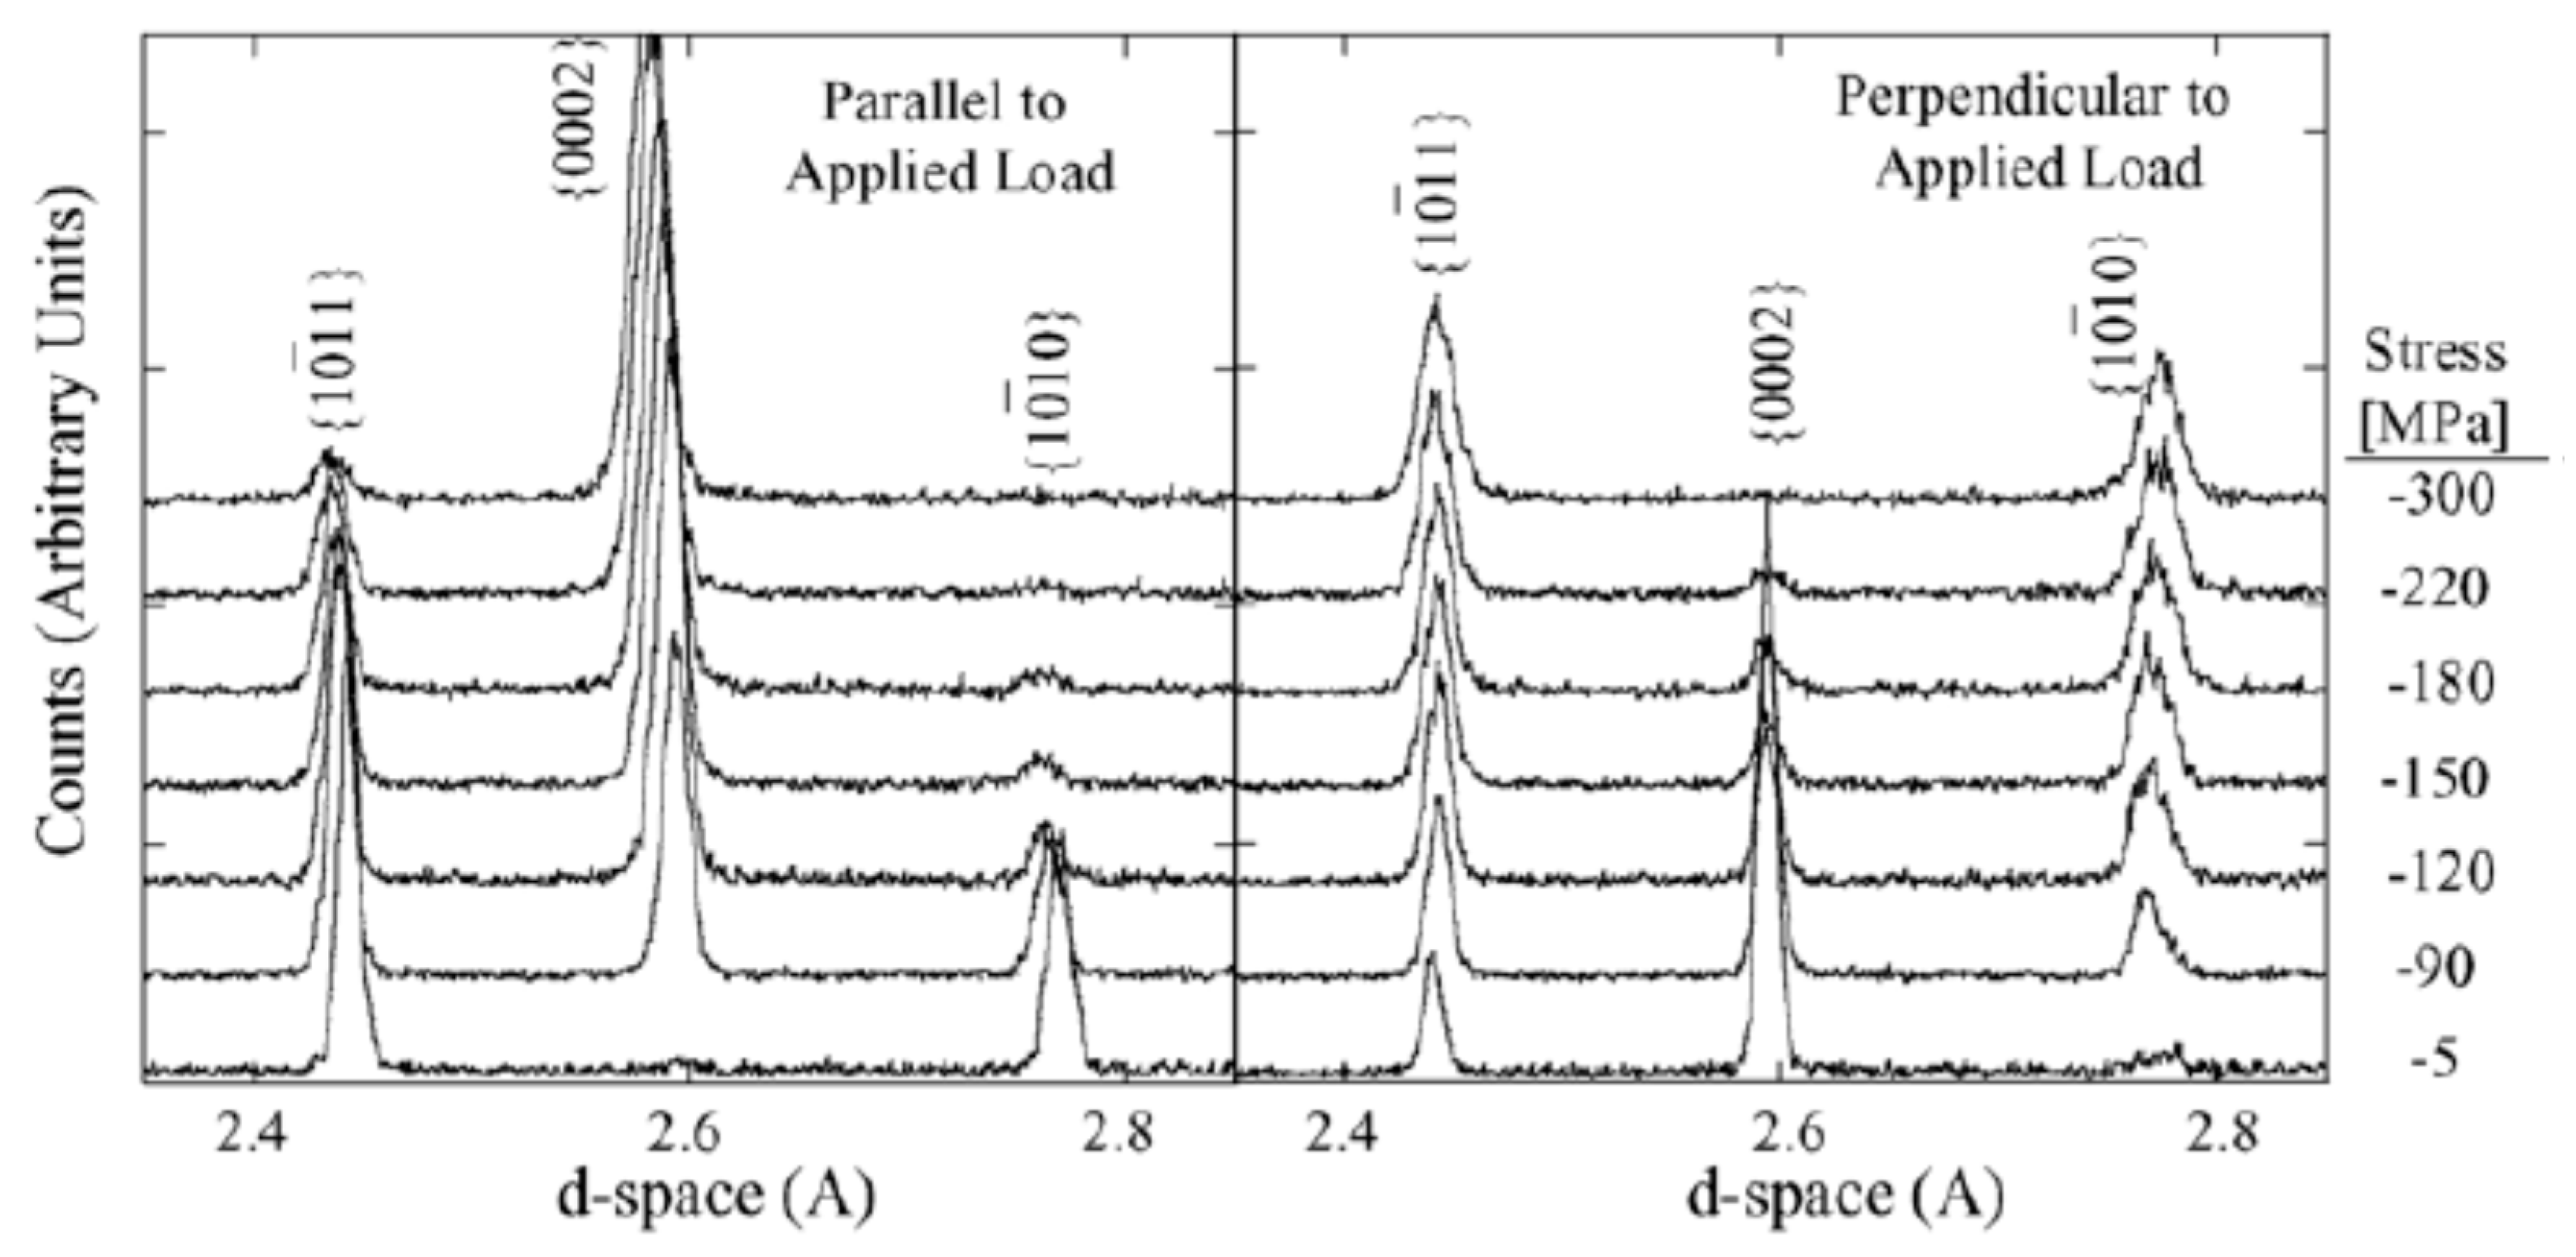
Brown et al. [34] investigated the diffraction pattern of the AZ31B Mg alloy subjected to the IPC loading path in parallel and perpendicular detector banks at different stress values, as shown in Figure 35. Initially, the parallel detector banker does not detect any diffraction peaks from { 0   0   0   2 } , while the transverse detector bank shows very strong diffraction peaks from { 0   0   0   2 } . As the applied compression increases, the diffraction peaks intensity detected by the parallel detector banker increases, while the one detected by the transverse detector bank decreases. Brown et al. [34] stated that the increase in the diffraction peaks intensity of { 0   0   0   2 } detected by the parallel detector banker manifests the development of twinned grains. Accordingly, they measured the twinning variation and showed that the twinning initiates at the strain ~ 1%. It was observed that the twinning volume linearly increases with the applied strain up to a strain ~ 6%. The twinning is then saturated at the strain ~ 8%, with the maximum twinning volume fraction of 80%. Brown et al. [34] mentioned that the variation of twin volume fraction is almost proportional to the increase in the diffraction peaks intensity of { 0   0   0   2 } detected by the parallel detector banker, with the slope of 0.145 per unit plastic strain. The VPSC predicted faster twin formation, which saturates at the strain ~ 4%. The increased hardening rate at larger strain observed in Figure 34 can be attributed to the twin saturation and initiation of pyramidal slip in the twinned regions [34].
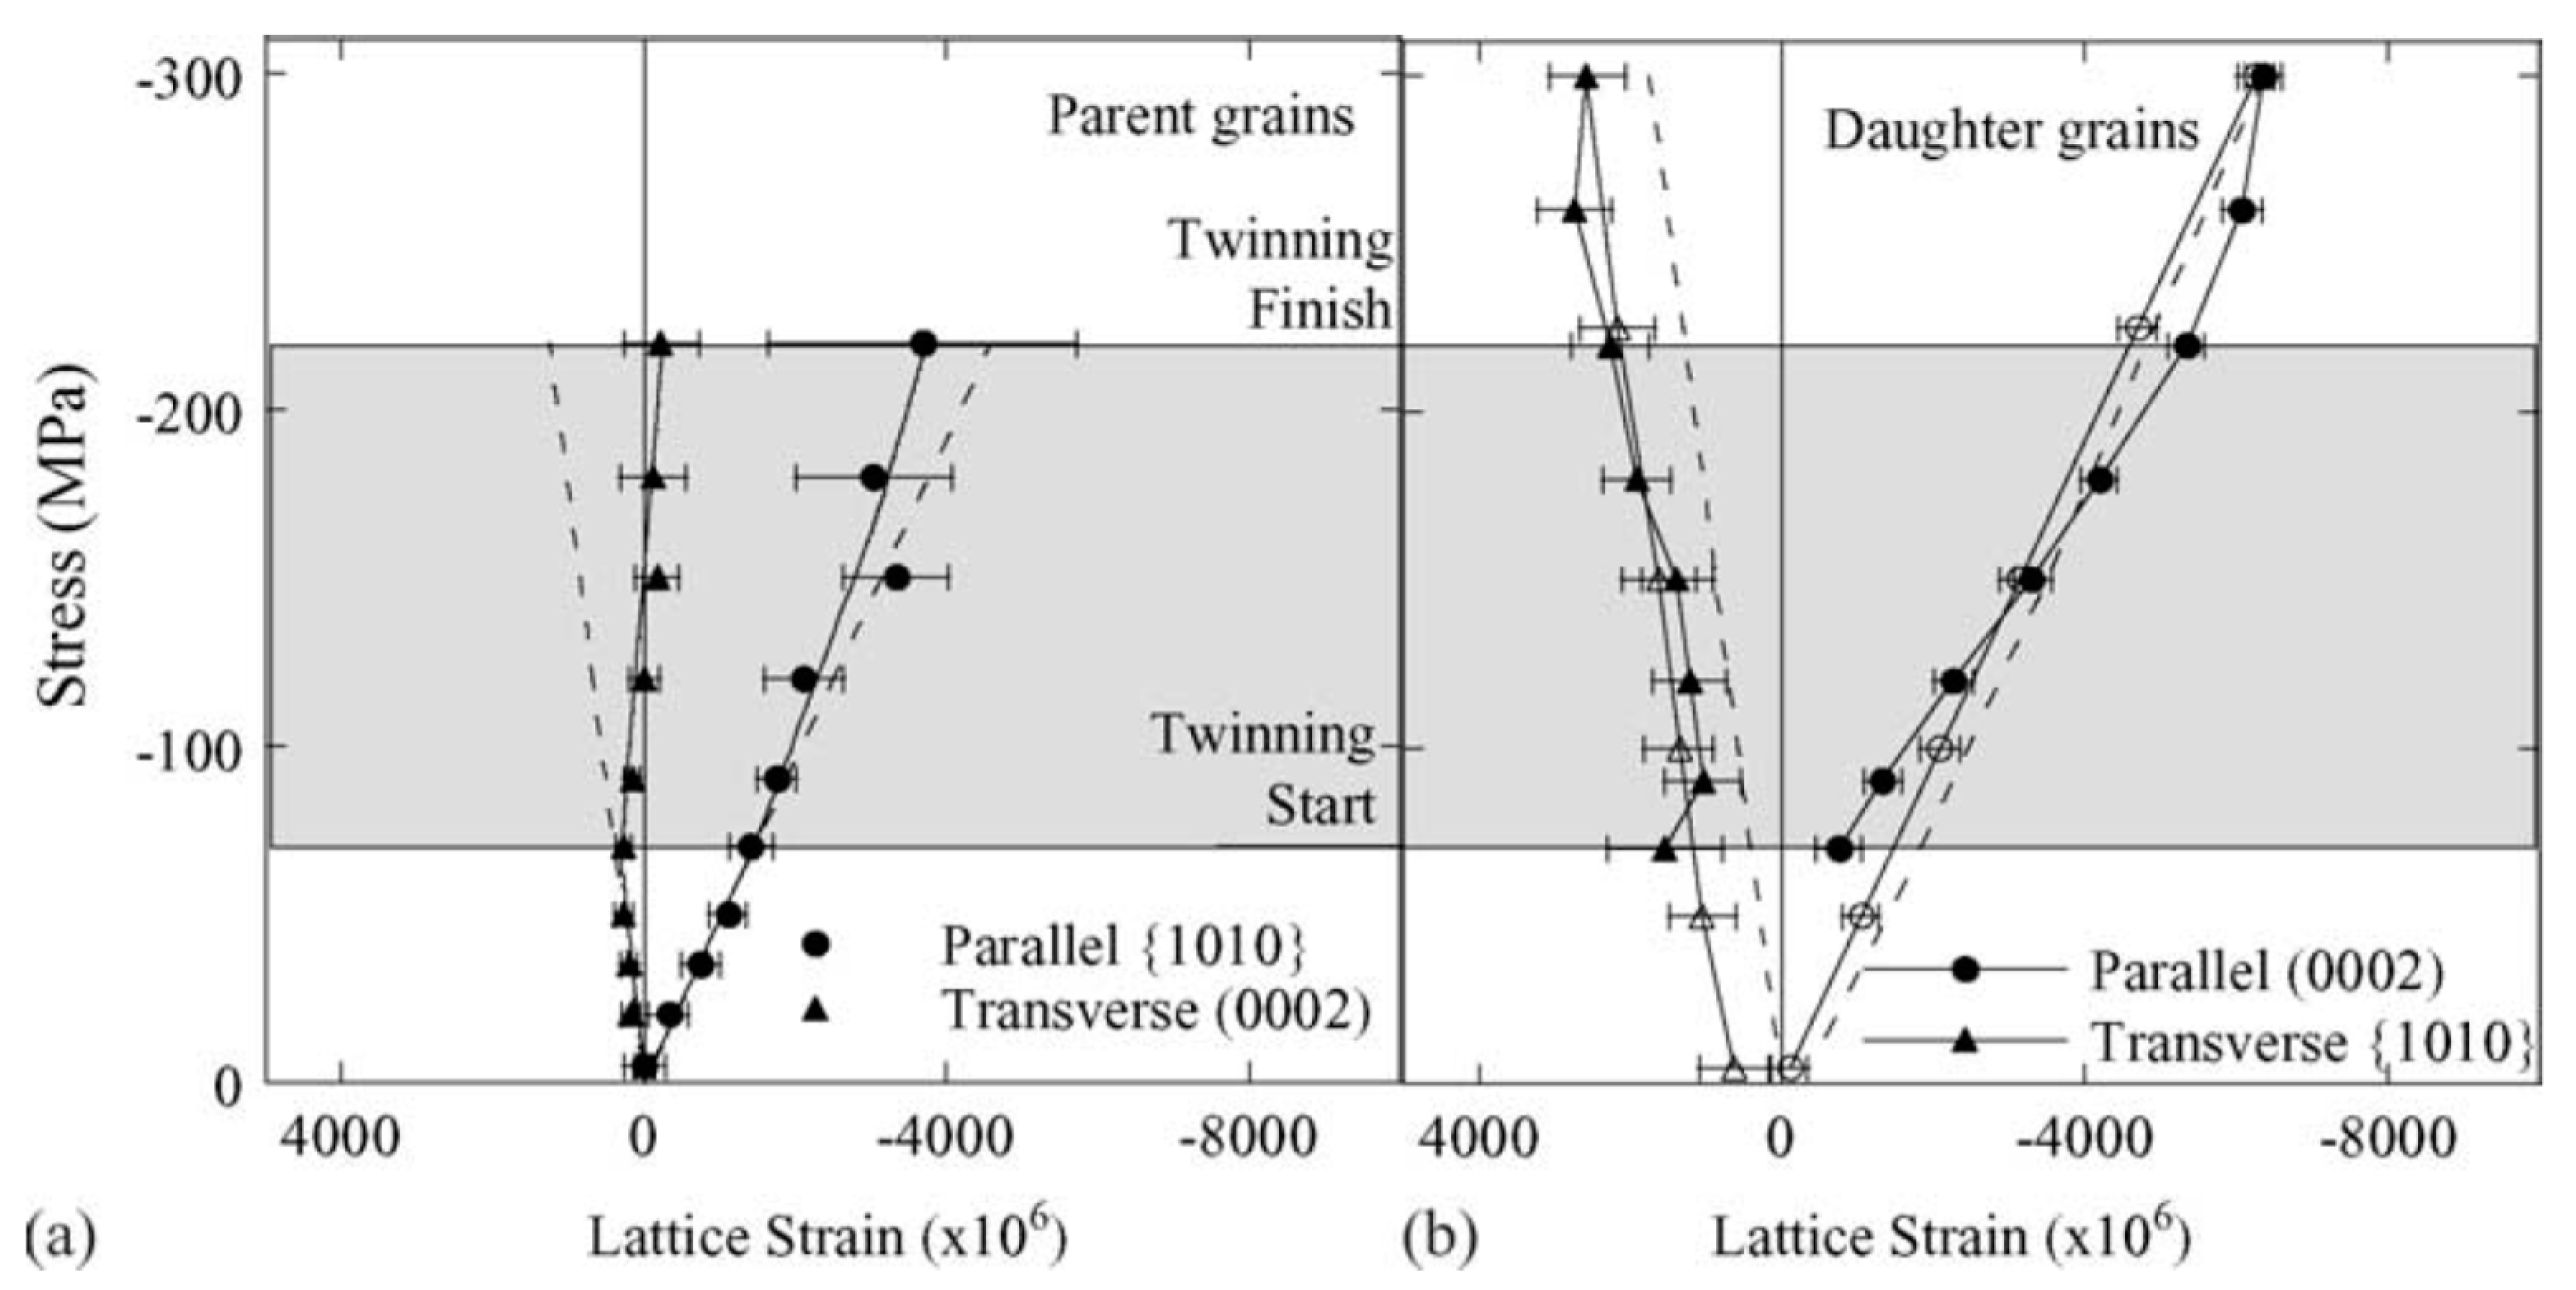
Figure 36 shows the variation of lattice strain parallel and perpendicular to the loading axis in untwinned parent grains and daughter twinned grains versus the applied load [34]. Brown et al. [34] obtained the lattice strain for a grain orientation contributing to a given ( h   k   l ) diffraction peak as follows:
ε = d h k l d 0 h k l d 0 h k l
where d 0 denotes the unstrained interatomic spacing, which can be approximated by the initial interplanar spacing. Figure 36a shows the internal strain in the untwinned parent grain parallel and normal to the loading axis versus the applied load. The theoretical linear elastic relation is shown as dashed lines. Prior to the applied compressive stress of 70 MPa, the untwinned parent grains behave according to the linear elasticity. Afterward, the lattice strain becomes less than the elastic prediction as other grains with different orientations, including the daughter grains, which sustain stresses larger than average applied stress.
Figure 36b shows the internal strain in the daughter twinned grains parallel and normal to the loading axis versus the applied load. The lattice strain in daughter grains can be first identified at the compressive applied stress of 70 MPa, where twin reorientation occurs. Brown et al. [34] reported an interesting observation in which the lattice strain of newly twinned daughters was 700   μ ε , which was considerably less than the untwinned parent and the surrounding grains. In other words, the daughter twinned grains were in a relaxed state compared to the surrounding grains. In the region of applied compressive loading of 70   MPa 220   MPa , the increase in lattice strain was much larger than the elastic prediction. The stress/lattice strain slope was reported as 32 GPa, which was smaller than the elastic slope of 48 GPa calculated for grains with basal pole parallel to the loading axis. This can be attributed to the fact that the daughter twinned grains were hard orientations and sustain more elastic strain compared to the untwinned parent and surrounding grains, which have soft orientations and deform inelastically [34]. For applied stress greater than 220 MPa, one can see an inflection point in the variation of lattice strain versus the applied loading as the variation of strain sustained by the daughter grain is less than the elastic prediction.
Brown et al. [34] calculated the CRSS required for twin formation using the in-situ neutron diffraction experimental data. They observed that the twin formation occurs at the stress in the region of 50   MPa 70   MPa . In the case of the tested sample, the maximum Schmid factor is 0.499, which leads to the twinning CRSS of 25 to 35 MPa for AZ31B Mg alloy. In the last step, Brown et al. [34] tried to derive how much strain is sustained by twinning. They derived the contribution of twin to the total plastic strain as follows:
Δ ε twin Δ ε plastic = 0.32 S Δ υ Δ ε plastic
where the coefficient 0.32 is obtained based on the texture of tested AZ31B Mg alloy, S is the characteristic twin shear strain defined in Equation (10), and υ is the twin volume fraction. They estimated that 61% of the plastic deformation is sustained by twinning mechanisms at the strain of 5%. Afterward, the twinning rate versus the strain decreases in which it saturates at the strain of 8%. At this strain, 42% of the plastic deformation is sustained by the twinning mechanism.

4. Conclusions and Future Works

In the present study, the crystal plasticity models, which have been incorporated for Mg and its alloys, are reviewed. These models include different deformation mechanisms such as plastic slip, twinning, and detwinning. The recent experimental frameworks, such as in-situ neutron diffraction, 3D high energy synchrotron X-ray techniques, and digital image correlation under scanning electron microscopy, which have been incorporated along crystal plasticity models to investigate the properties of Mg and its alloys, are also reviewed. Although many studies have tried to model the behavior of Mg and its alloys using crystal plasticity, which was often coupled by the advanced in-situ techniques, there are still some critical challenges that need to be addressed. A summary is presented for the future challenges as below:
  • Real-time crystal plasticity simulation coupled to in-situ experiments to guide identification of outliers that can in-turn improve crystal plasticity theories.
  • A general map to include the effect of alloying for a variety of Mg alloys using crystal plasticity models along with synchrotron X-ray techniques in a consistent framework.
  • Using machine learning techniques to learn the crystal plasticity models and generate surrogate models which can be used to design specific Mg alloy loading paths to achieve target properties.
  • Developing a crystal plasticity model with a physically based twinning and detwinning model, which include the correct isotropic and kinematic hardenings to capture the appropriate cyclic response of Mg alloy. This is extremely important in the prediction of fatigue simulation using crystal plasticity simulation.
  • Developing an integrated framework of crystal plasticity models and phase field simulation to better capture the twin morphology in Mg alloys.
  • The interaction of slip modes and twinning and detwinning mechanisms, which is typically reflected as latent hardening in crystal plasticity models.
  • Improved modeling of slip/twin and grain boundary interactions: Effects of grain size in different Mg alloys using crystal plasticity models, specifically via micro-Hall Petch models whose parameters can be inferred through experiments [98,102] and including the effect of grain boundary on twin nucleation and growth in crystal plasticity models.
  • Integrating the crystal plasticity models of Mg and its alloys with the PRISMS-Fatigue framework [109] to investigate the effects of texture, grain morphology, sample size, multiaxial strain, and strain amplitude on their fatigue response.
  • Coupling the crystal plasticity models with phase-field simulations to address the effect of deformation mechanisms such as plastic slip and twinning on the dynamic recrystallization of Mg alloys.

Author Contributions

Conceptualization, M.Y., G.Z.V., and V.S.; methodology, M.Y., G.Z.V., and V.S.; formal analysis, M.Y.; investigation, M.Y., G.Z.V., and V.S.; resources, G.Z.V.; data curation, M.Y.; writing—original draft preparation, M.Y.; writing—review and editing, M.Y., G.Z.V., and V.S.; visualization, M.Y.; supervision, G.Z.V. and V.S.; project administration, M.Y., G.Z.V., and V.S.; funding acquisition, G.Z.V., M.Y., and V.S. All authors have read and agreed to the published version of the manuscript.

Funding

The current work is partially funded by the NSF EPSCoR CIMM project under award #OIA-1541079. In addition, this work is partially supported by the U.S. Department of Energy, Office of Basic Energy Sciences, Division of Materials Sciences and Engineering under Award#DE-SC0008637 as part of the Center for Predictive Integrated Structural Materials Science (PRISMS Center) at the University of Michigan. We also acknowledge the financial cost-share support of the University of Michigan College of Engineering and Office of the Vice President for Research.

Acknowledgments

George Z. Voyiadjis acknowledges the funding from NSF EPSCoR CIMM project under award #OIA-1541079. Mohammadreza Yaghoobi and Veera Sundararaghavan acknowledge the funding from U.S. Department of Energy, Office of Basic Energy Sciences, Division of Materials Sciences and Engineering under Award#DE-SC0008637 as part of the Center for Predictive Integrated Structural Materials Science (PRISMS Center) at the University of Michigan. Mohammadreza Yaghoobi and Veera Sundararaghavan also acknowledge the financial cost-share support of the University of Michigan College of Engineering and Office of the Vice President for Research.

Conflicts of Interest

The authors declare no conflict of interest.

References

  1. Cole, G.S. Summary of “Magnesium vision 2020: A North American automotive strategic vision for magnesium”. In Essential Readings in Magnesium Technology; Springer: Cham, Switzerland, 2016; pp. 35–40. [Google Scholar]
  2. Begum, S.; Chen, D.; Xu, S.; Luo, A.A. Low cycle fatigue properties of an extruded AZ31 magnesium alloy. Int. J. Fatigue 2009, 31, 726–735. [Google Scholar] [CrossRef]
  3. Beyerlein, I.J.; Capolungo, L.; Marshall, P.E.; McCabe, R.J.; Tome, C.N. Statistical analyses of deformation twinning in magnesium. Philos. Mag. 2010, 90, 2161–2190. [Google Scholar] [CrossRef]
  4. Mirza, F.A.; Chen, D.; Li, D.; Zeng, X. Low cycle fatigue of a rare-earth containing extruded magnesium alloy. Mater. Sci. Eng. A 2013, 575, 65–73. [Google Scholar] [CrossRef]
  5. Mokdad, F.; Chen, D. Strain-controlled low cycle fatigue properties of a rare-earth containing ZEK100 magnesium alloy. Mater. Des. 2015, 67, 436–447. [Google Scholar] [CrossRef]
  6. Yu, Q.; Jiang, Y.; Wang, J. Cyclic deformation and fatigue damage in single-crystal magnesium under fully reversed strain-controlled tension–compression in the [1 01¯0] direction. Scr. Mater. 2015, 96, 41–44. [Google Scholar] [CrossRef] [Green Version]
  7. Murphy-Leonard, A.D.; Pagan, D.C.; Beaudoin, A.; Miller, M.P.; Allison, J.E. Quantification of cyclic twinning-detwinning behavior during low-cycle fatigue of pure magnesium using high energy X-ray diffraction. Int. J. Fatigue 2019, 125, 314–323. [Google Scholar] [CrossRef] [Green Version]
  8. Ganesan, S.; Yaghoobi, M.; Githens, A.; Chen, Z.; Daly, S.; Allison, J.E.; Sundararaghavan, V. The effects of heat treatment on the response of WE43 Mg alloy: Crystal plasticity finite element simulation and SEM-DIC experiment. Int. J. Plast. 2021, 137, 102917. [Google Scholar] [CrossRef]
  9. Yaghoobi, M.; Allison, J.E.; Sundararaghavan, V. Multiscale modeling of twinning and detwinning behavior of HCP polycrystals. Int. J. Plast. 2020, 127, 102653. [Google Scholar] [CrossRef]
  10. Capolungo, L.; Beyerlein, I.J. Nucleation and stability of twins in hcp metals. Phys. Rev. B 2008, 78, 024117. [Google Scholar] [CrossRef]
  11. Wang, J.; Hirth, J.; Tomé, C. (1¯012) Twinning nucleation mechanisms in hexagonal-close-packed crystals. Acta Mater. 2009, 57, 5521–5530. [Google Scholar] [CrossRef]
  12. Beyerlein, I.J.; Tomé, C.N. A probabilistic twin nucleation model for HCP polycrystalline metals. Proc. R. Soc. A Math. Phys. Eng. Sci. 2010, 466, 2517–2544. [Google Scholar] [CrossRef] [Green Version]
  13. Beyerlein, I.J.; McCabe, R.J.; Tomé, C.N. Effect of microstructure on the nucleation of deformation twins in polycrys-talline high-purity magnesium: A multi-scale modeling study. J. Mech. Phys. Solids 2011, 59, 988–1003. [Google Scholar] [CrossRef]
  14. Zheng, S.; Beyerlein, I.; Wang, J.; Carpenter, J.; Han, W.; Mara, N. Deformation twinning mechanisms from bimetal interfaces as revealed by in situ straining in the TEM. Acta Mater. 2012, 60, 5858–5866. [Google Scholar] [CrossRef]
  15. Barrett, C.D.; el Kadiri, H. The roles of grain boundary dislocations and disclinations in the nucleation of {1 0 1 2} twinning. Acta Mater. 2014, 63, 1–15. [Google Scholar] [CrossRef]
  16. Beyerlein, I.J.; Kumar, M.A. The Stochastic Nature of Deformation Twinning: Application to HCP Materials. In Handbook of Materials Modeling: Methods: Theory and Modeling; Andreoni, W., Yip, S., Eds.; Springer International Publishing: Cham, Switzerland, 2018; pp. 1–39. [Google Scholar]
  17. Wu, L.; Jain, A.; Brown, D.; Stoica, G.; Agnew, S.; Clausen, B.; Fielden, D.; Liaw, P. Twinning–detwinning behavior during the strain-controlled low-cycle fatigue testing of a wrought magnesium alloy, ZK60A. Acta Mater. 2008, 56, 688–695. [Google Scholar] [CrossRef]
  18. Koike, J.; Fujiyama, N.; Ando, D.; Sutou, Y. Roles of deformation twinning and dislocation slip in the fatigue failure mechanism of AZ31 Mg alloys. Scr. Mater. 2010, 63, 747–750. [Google Scholar] [CrossRef]
  19. Yu, Q.; Zhang, J.; Jiang, Y. Fatigue damage development in pure polycrystalline magnesium under cyclic tension-compression loading. Mater. Sci. Eng. A 2011, 528, 7816–7826. [Google Scholar] [CrossRef]
  20. Zhang, J.; Yu, Q.; Jiang, Y.; Li, Q. An experimental study of cyclic deformation of extruded AZ61A magnesium alloy. Int. J. Plast. 2011, 27, 768–787. [Google Scholar] [CrossRef]
  21. Wu, W.; Lee, S.Y.; Paradowska, A.M.; Gao, Y.; Liaw, P.K. Twinning–detwinning behavior during fatigue-crack propagation in a wrought magnesium alloy AZ31B. Mater. Sci. Eng. A 2012, 556, 278–286. [Google Scholar] [CrossRef]
  22. Zhang, H.; Jérusalem, A.; Salvati, E.; Papadaki, C.; Fong, K.S.; Song, X.; Korsunsky, A.M. Multi-scale mechanisms of twinning-detwinning in magnesium alloy AZ31B simulated by crystal plasticity modeling and validated via in situ synchrotron XRD and in situ SEM-EBSD. Int. J. Plast. 2019, 119, 43–56. [Google Scholar] [CrossRef]
  23. Aydıner, C.C.; Telemez, M.A. Multiscale deformation heterogeneity in twinning magnesium investigated with in situ image correlation. Int. J. Plast. 2014, 56, 203–218. [Google Scholar] [CrossRef]
  24. Paudel, Y.; Indeck, J.; Hazeli, K.; Priddy, M.W.; Inal, K.; Rhee, H.; Barrett, C.D.; Whittington, W.R.; Limmer, K.R.; el Kadiri, H.; et al. Characterization and modeling of {101¯ 2} twin banding in magnesium. Acta Mater. 2020, 183, 438–451. [Google Scholar] [CrossRef]
  25. Githens, A.; Ganesan, S.; Chen, Z.; Allison, J.; Sundararaghavan, V.; Daly, S. Characterizing microscale deformation mechanisms and macroscopic tensile properties of a high strength magnesium rare-earth alloy: A combined experimental and crystal plasticity approach. Acta Mater. 2020, 186, 77–94. [Google Scholar] [CrossRef]
  26. Aydıner, C.C.; Bernier, J.V.; Clausen, B.; Lienert, U.; Tomé, C.N.; Brown, D.W. Evolution of stress in individual grains and twins in a magnesium alloy aggregate. Phys. Rev. B 2009, 80, 024113. [Google Scholar] [CrossRef] [Green Version]
  27. Abdolvand, H.; Majkut, M.; Oddershede, J.; Schmidt, S.; Lienert, U.; Diak, B.J.; Withers, P.J.; Daymondd, M.R. On the deformation twinning of Mg AZ31B: A three-dimensional synchrotron X-ray diffraction experiment and crystal plasticity finite element model. Int. J. Plast. 2015, 70, 77–97. [Google Scholar] [CrossRef] [Green Version]
  28. Lentz, M.; Klaus, M.; Wagner, M.; Fahrenson, C.; Beyerlein, I.J.; Zecevic, M.; Reimers, W.; Knezevic, M. Effect of age hardening on the deformation behavior of an Mg–Y–Nd alloy: In-situ X-ray diffraction and crystal plasticity modeling. Mater. Sci. Eng. A 2015, 628, 396–409. [Google Scholar] [CrossRef]
  29. Kada, S.R.; Lynch, P.A.; Kimpton, J.A.; Barnett, M.R. In-situ X-ray diffraction studies of slip and twinning in the presence of precipitates in AZ91 alloy. Acta Mater. 2016, 119, 145–156. [Google Scholar] [CrossRef]
  30. Greeley, D.; Yaghoobi, M.; Pagan, D.; Sundararaghavan, V.; Allison, J. Using synchrotron radiation to improve under-standing of deformation of polycrystalline metals by measuring, modelling and publishing 4D information. Iop Conf. Ser. Mater. Sci. Eng. 2019, 580, 012017. [Google Scholar] [CrossRef]
  31. Li, L.; Yuanzhi, W.; Jie, W.; Xiao, L.C. In situ analysis of deformation twins within a magnesium polycrystal: (II) twin growth. Micron 2019, 119, 8–16. [Google Scholar] [CrossRef] [PubMed]
  32. Zhang, N.; Zhang, Y.; Chen, S.; Li, Z.; Xie, H.; Lu, L.; Yao, X.; Luo, S. Onset of detwinning in Mg-3Al-1Zn alloy: A synchrotron-based X-ray diffraction study. Scr. Mater. 2021, 190, 113–117. [Google Scholar] [CrossRef]
  33. Gharghouri, G.C.W.M.A.; Gharghouri, M.A.; Weatherly, G.C.; Embury, J.D.; Root, J. Study of the mechanical properties of Mg-7.7at.% Al by in-situ neutron diffraction. Philos. Mag. A 1999, 79, 1671–1695. [Google Scholar] [CrossRef]
  34. Brown, D.; Agnew, S.; Bourke, M.; Holden, T.; Vogel, S.; Tomé, C. Internal strain and texture evolution during deformation twinning in magnesium. Mater. Sci. Eng. A 2005, 399, 1–12. [Google Scholar] [CrossRef]
  35. Wu, L.; Agnew, S.; Brown, D.; Stoica, G.; Clausen, B.; Jain, A.; Fielden, D.; Liaw, P. Internal stress relaxation and load redistribution during the twinning–detwinning-dominated cyclic deformation of a wrought magnesium alloy, ZK60A. Acta Mater. 2008, 56, 3699–3707. [Google Scholar] [CrossRef]
  36. Muránsky, O.; Carr, D.; Šittner, P.; Oliver, E. In situ neutron diffraction investigation of deformation twinning and pseudoelastic-like behaviour of extruded AZ31 magnesium alloy. Int. J. Plast. 2009, 25, 1107–1127. [Google Scholar] [CrossRef]
  37. Wu, L.; Agnew, S.; Ren, Y.; Brown, D.; Clausen, B.; Stoica, G.; Wenk, H.; Liaw, P. The effects of texture and extension twinning on the low-cycle fatigue behavior of a rolled magnesium alloy, AZ31B. Mater. Sci. Eng. A 2010, 527, 7057–7067. [Google Scholar] [CrossRef]
  38. Wu, W.; Qiao, H.; An, K.; Guo, X.; Wu, P.; Liaw, P.K. Investigation of deformation dynamics in a wrought magnesium alloy. Int. J. Plast. 2014, 62, 105–120. [Google Scholar] [CrossRef] [Green Version]
  39. Wu, W.; Liaw, P.K.; An, K. Unraveling cyclic deformation mechanisms of a rolled magnesium alloy using in situ neutron diffraction. Acta Mater. 2015, 85, 343–353. [Google Scholar] [CrossRef] [Green Version]
  40. Namakian, R.; Voyiadjis, G.Z. An atomic displacive model for 101¯21¯011 twinning in hexagonal close packed metals with the emphasis on the role of partial stacking faults in formation of {101¯2} twins. Acta Mater. 2018, 150, 381–393. [Google Scholar] [CrossRef]
  41. Namakian, R.; Voyiadjis, G.Z.; Kwaśniak, P. On the slip and twinning mechanisms on first order pyramidal plane of magnesium: Molecular dynamics simulations and first principal studies. Mater. Des. 2020, 191, 108648. [Google Scholar] [CrossRef]
  42. Liu, X.-Y.; Ohotnicky, P.P.; Adams, J.B.; Rohrer, C.L.; Hyland, R.W., Jr. Anisotropic surface segregation in Al − Mg alloys. Surf. Sci. 1997, 373, 357–370. [Google Scholar] [CrossRef]
  43. Wu, Z.; Francis, M.F.; Curtin, W.A. Magnesium interatomic potential for simulating plasticity and fracture phenomena. Model. Simul. Mater. Sci. Eng. 2015, 23, 015004. [Google Scholar] [CrossRef] [Green Version]
  44. Yasi, J.A.; Hector, L.G.; Trinkle, D.R. First-principles data for solid-solution strengthening of magnesium: From geometry and chemistry to properties. Acta Mater. 2010, 58, 5704–5713. [Google Scholar] [CrossRef] [Green Version]
  45. Ghazisaeidi, M.; Hector, L.; Curtin, W. Solute strengthening of twinning dislocations in Mg alloys. Acta Mater. 2014, 80, 278–287. [Google Scholar] [CrossRef] [Green Version]
  46. Olmsted, D.L.; HectorJr, L.G.; A Curtin, W.; Clifton, R.J. Atomistic simulations of dislocation mobility in Al, Ni and Al/Mg alloys. Model. Simul. Mater. Sci. Eng. 2005, 13, 371–388. [Google Scholar] [CrossRef] [Green Version]
  47. Wang, J.; Hoagland, R.G.; Hirth, J.P.; Misra, A. Atomistic modeling of the interaction of glide dislocations with “weak” interfaces. Acta Mater. 2008, 56, 5685–5693. [Google Scholar] [CrossRef]
  48. Yaghoobi, M.; Voyiadjis, G.Z. Effect of boundary conditions on the MD simulation of nanoindentation. Comput. Mater. Sci. 2014, 95, 626–636. [Google Scholar] [CrossRef]
  49. Voyiadjis, G.Z.; Yaghoobi, M. Large scale atomistic simulation of size effects during nanoindentation: Dislocation length and hardness. Mater. Sci. Eng. A 2015, 634, 20–31. [Google Scholar] [CrossRef]
  50. Yaghoobi, M.; Voyiadjis, G.Z. Atomistic simulation of size effects in single-crystalline metals of confined volumes during nanoindentation. Comput. Mater. Sci. 2016, 111, 64–73. [Google Scholar] [CrossRef]
  51. Yaghoobi, M.; Voyiadjis, G.Z. Size effects in fcc crystals during the high rate compression test. Acta Mater. 2016, 121, 190–201. [Google Scholar] [CrossRef]
  52. Voyiadjis, G.Z.; Yaghoobi, M. Size and strain rate effects in metallic samples of confined volumes: Dislocation length distribution. Scr. Mater. 2017, 130, 182–186. [Google Scholar] [CrossRef]
  53. Yaghoobi, M.; Voyiadjis, G.Z. Microstructural investigation of the hardening mechanism in fcc crystals during high rate deformations. Comput. Mater. Sci. 2017, 138, 10–15. [Google Scholar] [CrossRef]
  54. Yaghoobi, M.; Voyiadjis, G.Z. The effects of temperature and strain rate in fcc and bcc metals during extreme defor-mation rates. Acta Mater. 2018, 151, 1–10. [Google Scholar] [CrossRef]
  55. Shahbeyk, S.; Voyiadjis, G.Z.; Habibi, V.; Astaneh, S.H.; Yaghoobi, M. Review of Size Effects during Micropillar Com-pression Test: Experiments and Atomistic Simulations. Crystals 2019, 9, 591. [Google Scholar] [CrossRef] [Green Version]
  56. Saffarini, M.H.; Voyiadjis, G.Z.; Ruestes, C.J.; Yaghoobi, M. Ligament size dependency of strain hardening and ductil-ity in nanoporous gold. Comput. Mater. Sci. 2021, 186, 109920. [Google Scholar] [CrossRef]
  57. Fan, H.; Aubry, S.; Arsenlis, A.; El-Awady, J.A. The role of twinning deformation on the hardening response of poly-crystalline magnesium from discrete dislocation dynamics simulations. Acta Mater. 2015, 92, 126–139. [Google Scholar] [CrossRef] [Green Version]
  58. Wei, D.; Zaiser, M.; Feng, Z.; Kang, G.; Fan, H.; Zhang, X. Effects of twin boundary orientation on plasticity of bicrystalline copper micropillars: A discrete dislocation dynamics simulation study. Acta Mater. 2019, 176, 289–296. [Google Scholar] [CrossRef]
  59. Voyiadjis, G.Z.; Yaghoobi, M. Size Effects in Plasticity: From Macro to Nano; Academic Press: Cambridge, MA, USA, 2019. [Google Scholar]
  60. Houtte, P. Simulation of the rolling and shear texture of brass by the Taylor theory adapted for mechanical twinning. Acta Met. 1978, 26, 591–604. [Google Scholar] [CrossRef]
  61. Tomé, C.; Lebensohn, R.; Kocks, U. A model for texture development dominated by deformation twinning: Application to zirconium alloys. Acta Met. Mater. 1991, 39, 2667–2680. [Google Scholar] [CrossRef] [Green Version]
  62. Kalidindi, S.R. Incorporation of deformation twinning in crystal plasticity models. J. Mech. Phys. Solids 1998, 46, 267–290. [Google Scholar] [CrossRef]
  63. Staroselsky, A.; Anand, L. Inelastic deformation of polycrystalline face centered cubic materials by slip and twinning. J. Mech. Phys. Solids 1998, 46, 671–673. [Google Scholar] [CrossRef]
  64. Staroselsky, A.; Anand, L. A constitutive model for hcp materials deforming by slip and twinning: Application to magnesium alloy AZ31B. Int. J. Plast. 2003, 19, 1843–1864. [Google Scholar] [CrossRef]
  65. Abdolvand, H.; Daymond, M.R.; Mareau, C. Incorporation of twinning into a crystal plasticity finite element model: Evolution of lattice strains and texture in Zircaloy-2. Int. J. Plast. 2011, 27, 1721–1738. [Google Scholar] [CrossRef]
  66. Fernández, A.; Prado, M.T.P.; Wei, Y.; Jérusalem, A. Continuum modeling of the response of a Mg alloy AZ31 rolled sheet during uniaxial deformation. Int. J. Plast. 2011, 27, 1739–1757. [Google Scholar] [CrossRef] [Green Version]
  67. Zhang, J.; Joshi, S.P. Phenomenological crystal plasticity modeling and detailed micromechanical investigations of pure magnesium. J. Mech. Phys. Solids 2012, 60, 945–972. [Google Scholar] [CrossRef]
  68. Fernández, A.; Jérusalem, A.; Gutiérrez-Urrutia, I.; Pérez-Prado, M.T. Three-dimensional investigation of grain boundary-twin interactions in a Mg AZ31 alloy by electron backscatter diffraction and continuum modeling. Acta Mater. 2013, 61, 7679–7692. [Google Scholar] [CrossRef]
  69. Liu, Y.; Wei, Y. A polycrystal based numerical investigation on the temperature dependence of slip resistance and texture evolution in magnesium alloy AZ31B. Int. J. Plast. 2014, 55, 80–93. [Google Scholar] [CrossRef] [Green Version]
  70. Abdolvand, H.; Daymond, M.R. Internal strain and texture development during twinning: Comparing neutron dif-fraction measurements with crystal plasticity finite-element approaches. Acta Mater. 2012, 60, 2240–2248. [Google Scholar] [CrossRef]
  71. Abdolvand, H.; Daymond, M.R. Multi-scale modeling and experimental study of twin inception and propagation in hexagonal close-packed materials using a crystal plasticity finite element approach; part II: Local behavior. J. Mech. Phys. Solids 2013, 61, 803–818. [Google Scholar] [CrossRef]
  72. Abdolvand, H.; Majkut, M.; Oddershede, J.; Wright, J.P.; Daymond, M.R. Study of 3-D stress development in parent and twin pairs of a hexagonal close-packed polycrystal: Part II—Crystal plasticity finite element modeling. Acta Mater. 2015, 93, 235–245. [Google Scholar] [CrossRef]
  73. Qiao, H.; Barnett, M.; Wu, P. Modeling of twin formation, propagation and growth in a Mg single crystal based on crystal plasticity finite element method. Int. J. Plast. 2016, 86, 70–92. [Google Scholar] [CrossRef]
  74. Hama, T.; Tanaka, Y.; Uratani, M.; Takuda, H. Deformation behavior upon two-step loading in a magnesium alloy sheet. Int. J. Plast. 2016, 82, 283–304. [Google Scholar] [CrossRef] [Green Version]
  75. Prasad, N.S.; Narasimhan, R.; Suwas, S. Effects of lattice orientation and crack tip constraint on ductile fracture initiation in Mg single crystals. Int. J. Plast. 2017, 97, 222–245. [Google Scholar] [CrossRef]
  76. Lebensohn, R.; Tomé, C. A self-consistent anisotropic approach for the simulation of plastic deformation and texture development of polycrystals: Application to zirconium alloys. Acta Met. Mater. 1993, 41, 2611–2624. [Google Scholar] [CrossRef]
  77. Agnew, S.; Yoo, M.; Tomé, C. Application of texture simulation to understanding mechanical behavior of Mg and solid solution alloys containing Li or Y. Acta Mater. 2001, 49, 4277–4289. [Google Scholar] [CrossRef]
  78. Kumar, M.A.; Kanjarla, A.K.; Niezgoda, S.R.; Lebensohn, R.A.; Tomé, C.N. Numerical study of the stress state of a deformation twin in magnesium. Acta Mater. 2015, 84, 349–358. [Google Scholar] [CrossRef]
  79. Lévesque, J.; Mohammadi, M.; Mishra, R.K.; Inal, K. An extended Taylor model to simulate localized deformation phenomena in magnesium alloys. Int. J. Plast. 2016, 78, 203–222. [Google Scholar] [CrossRef]
  80. Segurado, J.; Lebensohn, R.A.; Llorca, J.; Tomé, C.N. Multiscale modeling of plasticity based on embedding the viscoplastic selfconsistent formulation in implicit finite elements. Int. J. Plast. 2012, 28, 124–140. [Google Scholar] [CrossRef]
  81. Knezevic, M.; McCabe, R.J.; Lebensohn, R.A.; Tomé, C.N.; Liu, C.; Lovato, M.L.; Mihaila, B. Integration of self-consistent polycrystal plasticity with dislocation density based hardening laws within an implicit finite element framework: Application to low-symmetry metals. J. Mech. Phys. Solids 2013, 61, 2034–2046. [Google Scholar] [CrossRef]
  82. Prakash, A.; Nöhring, W.G.; Lebensohn, R.A.; Höppel, H.W.; Bitzek, E. A multiscale simulation framework of the accumulative roll bonding process accounting for texture evolution. Mater. Sci. Eng. A 2015, 631, 104–119. [Google Scholar] [CrossRef]
  83. Ardeljan, M.; Beyerlein, I.J.; McWilliams, B.A.; Knezevic, M. Strain rate and temperature sensitive multi-level crystal plasticity model for large plastic deformation behavior: Application to AZ31 magnesium alloy. Int. J. Plast. 2016, 83, 90–109. [Google Scholar] [CrossRef]
  84. Feather, W.G.; Ghorbanpour, S.; Savage, D.J.; Ardeljan, M.; Jahedi, M.; McWilliams, B.A.; Gupta, N.; Xiang, C.; Vogel, S.C.; Knezevic, M. Mechanical response, twinning, and texture evolution of WE43 magnesium-rare earth alloy as a function of strain rate: Experiments and multi-level crystal plasticity modeling. Int. J. Plast. 2019, 120, 180–204. [Google Scholar] [CrossRef]
  85. Kondo, R.; Tadano, Y.; Shizawa, K. A phase-field model of twinning and detwinning coupled with dislocation-based crystal plasticity for HCP metals. Comput. Mater. Sci. 2014, 95, 672–683. [Google Scholar] [CrossRef]
  86. Liu, C.; Shanthraj, P.; Diehl, M.; Roters, F.; Dong, S.; Dong, J.; Ding, W.; Raabe, D. An integrated crystal plasticity–phase field model for spatially resolved twin nucleation, propagation, and growth in hexagonal materials. Int. J. Plast. 2018, 106, 203–227. [Google Scholar] [CrossRef]
  87. Proust, G.; Tomé, C.; Kaschner, G. Modeling texture, twinning and hardening evolution during deformation of hexagonal materials. Acta Mater. 2007, 55, 2137–2148. [Google Scholar] [CrossRef]
  88. Proust, G.; Tomé, C.N.; Jain, A.; Agnew, S.R. Modeling the effect of twinning and detwinning during strain-path changes of magnesium alloy AZ31. Int. J. Plast. 2009, 25, 861–880. [Google Scholar] [CrossRef]
  89. Guillemer, C.; Clavel, M.; Cailletaud, G. Cyclic behavior of extruded magnesium: Experimental, microstructural and numerical approach. Int. J. Plast. 2011, 27, 2068–2084. [Google Scholar] [CrossRef]
  90. Wang, H.; Wu, P.; Tomé, C.; Wang, J. A constitutive model of twinning and detwinning for hexagonal close packed polycrystals. Mater. Sci. Eng. A 2012, 555, 93–98. [Google Scholar] [CrossRef]
  91. Wang, H.; Wu, P.; Wang, J. Modeling inelastic behavior of magnesium alloys during cyclic loading–unloading. Int. J. Plast. 2013, 47, 49–64. [Google Scholar] [CrossRef]
  92. Wang, H.; Wu, P.D.; Wang, J.; Tomé, C.N. A crystal plasticity model for hexagonal close packed (HCP) crystals including twinning and de-twinning mechanisms. Int. J. Plast. 2013, 49, 36–52. [Google Scholar] [CrossRef]
  93. Qiao, H.; Agnew, S.; Wu, P. Modeling twinning and detwinning behavior of Mg alloy ZK60A during monotonic and cyclic loading. Int. J. Plast. 2015, 65, 61–84. [Google Scholar] [CrossRef]
  94. Hama, T.; Takuda, H. Crystal plasticity finite-element simulation of deformation behavior in a magnesium alloy sheet considering detwinning. Steel Res. Int. 2012, 1115–1118. [Google Scholar]
  95. Hama, T.; Kitamura, N.; Takuda, H. Effect of twinning and detwinning on inelastic behavior during unloading in a magnesium alloy sheet. Mater. Sci. Eng. A 2013, 583, 232–241. [Google Scholar] [CrossRef] [Green Version]
  96. Hama, T.; Kobuki, A.; Takuda, H. Crystal-plasticity finite-element analysis of anisotropic deformation behavior in a commercially pure titanium Grade 1 sheet. Int. J. Plast. 2017, 91, 77–108. [Google Scholar] [CrossRef] [Green Version]
  97. Briffod, F.; Shiraiwa, T.; Enoki, M. Numerical investigation of the influence of twinning/detwinning on fatigue crack initiation in AZ31 magnesium alloy. Mater. Sci. Eng. A 2019, 753, 79–90. [Google Scholar] [CrossRef]
  98. Andani, M.T.; Lakshmanan, A.; Karamooz-Ravari, M.; Sundararaghavan, V.; Allison, J.; Misra, A. A quantitative study of stress fields ahead of a slip band blocked by a grain boundary in unalloyed magnesium. Sci. Rep. 2020, 10, 1–8. [Google Scholar] [CrossRef] [PubMed] [Green Version]
  99. Armstrong, R.; Codd, I.; Douthwaite, R.M.; Petch, N.J. The plastic deformation of polycrystalline aggregates. Philos. Mag. 1962, 7, 45–58. [Google Scholar] [CrossRef]
  100. Weng, G. A micromechanical theory of grain-size dependence in metal plasticity. J. Mech. Phys. Solids 1983, 31, 193–203. [Google Scholar] [CrossRef]
  101. Sun, S.; Sundararaghavan, V. A probabilistic crystal plasticity model for modeling grain shape effects based on slip geometry. Acta Mater. 2012, 60, 5233–5244. [Google Scholar] [CrossRef]
  102. Andani, M.T.; Lakshmanan, A.; Sundararaghavan, V.; Allison, J.; Misra, A. Quantitative study of the effect of grain boundary parameters on the slip system level Hall-Petch slope for basal slip system in Mg-4Al. Acta Mater. 2020, 200, 148–161. [Google Scholar] [CrossRef]
  103. Yaghoobi, M.; Ganesan, S.; Sundar, S.; Lakshmanan, A.; Rudraraju, S.; Allison, J.E.; Sundararaghavan, V. PRISMS-Plasticity: An open-source crystal plasticity finite element software. Comput. Mater. Sci. 2019, 169, 109078. [Google Scholar] [CrossRef]
  104. Christian, J.; Mahajan, S. Deformation twinning. Prog. Mater. Sci. 1995, 39, 1–157. [Google Scholar] [CrossRef]
  105. Wu, P.D.; Guo, X.Q.; Qiao, H.; Lloyd, D.J. A constitutive model of twin nucleation, propagation and growth in magnesium crystals. Mater. Sci. Eng. A 2015, 625, 140–145. [Google Scholar] [CrossRef]
  106. Lou, X.; Li, M.; Boger, R.; Agnew, S.; Wagoner, R. Hardening evolution of AZ31B Mg sheet. Int. J. Plast. 2007, 23, 44–86. [Google Scholar] [CrossRef]
  107. Wu, L. Mechanical Behavior and the Role of Deformation Twinning in Wrought Magnesium Alloys Investigated Using Neutron and Synchrotron X-ray Diffraction. Ph.D. Thesis, University of Tennessee, Knoxville, TN, USA, 2009. [Google Scholar]
  108. Aagesen, L.K.; Adams, J.F.; Allison, J.E.; Andrews, W.B.; Araullo-Peters, V.; Berman, T.; Chen, Z.; Daly, S.; Das, S.; de Wittet, S.; et al. PRISMS: An Integrated, Open-Source Framework for Accelerating Predictive Structural Materials Science. JOM 2018, 70, 2298–2314. [Google Scholar] [CrossRef] [Green Version]
  109. Yaghoobi, M.; Stopka, K.S.; Lakshmanan, A.; Sundararaghavan, V.; Allison, J.E.; McDowell, D.L. PRISMS-Fatigue computational framework for fatigue analysis in polycrystalline metals and alloys. Npj Comput. Mater. 2021, 7, 1–12. [Google Scholar] [CrossRef]
Figure 1. The schematics of the transformation of the untwinned parent unit cell (blue segments and red and blue atoms) into the twinned children unit cell (cyan segments and magenta and cyan atoms for the first two layers close to the twin boundary) during ( 10 1 ¯ 2 ) [ 1 ¯ 011 ] twinning (After Namakian and Voyiadjis [40]).
Crystals 11 00435 g001
Figure 2. Minimum energy paths of four deformation mechanisms associated with π_1 plane, i.e., homogeneous CTW nucleation, heterogeneous nucleation mechanism of pyramidal-I 〈c + a〉 slip, i.e., 1 / 3 [ 1 1 ¯ 2 ¯ 3 ] ( 101 1 ¯ ) slip to CTW [ 1 0 ¯ 12 ] ( 101 1 ¯ ) , heterogeneous nucleation mechanism of pyramidal-I 〈a〉 slip 1 / 3 [ 1 2 ¯ 1 0 ¯ ] ( 101 1 ¯ ) to CTW [ 101 2 ¯    ¯ ]   ( 101 1 ¯ ) _(π1_D), and pyramidal-I 〈c + a〉 slip 1 / 3 [ 1 1 ¯ 2 ¯ 3 ] ( 101 1 ¯ ) (a) Liu et al. [42] EAM potential (b)Wu et al. [43] MEAM potential (After Namakian et al. [41]).
Crystals 11 00435 g002
Figure 3. Different configurations of the body in finite strain framework (After Yaghoobi et al. [103]).
Crystals 11 00435 g003
Figure 4. (a) The crystallography of the extension twinning { 10 1 ¯ 2 } 1 ¯ 011 in Mg and its alloys. (b) Description of deformation systems in the orthonormal system { e i c | i = 1 , 2 , 3 } (After Staroselsky and Anand [64]).
Crystals 11 00435 g004
Figure 5. The deformation modes kinematics in finite strain framework (After Yaghoobi et al. [103]).
Crystals 11 00435 g005
Figure 6. The crystallographic description of extension twinning (After Yaghoobi et al. [103]).
Crystals 11 00435 g006
Figure 7. Extension twinning in Mg and its alloys. (a) The schematics of extension twin nucleation, propagation, and growth, (b) variation of slip resistance for extension twinning system α at different stages of deformation twinning (After Wu et al. [105]).
Crystals 11 00435 g007
Figure 8. Comparison of the experimental and simulated response of the AZ31B Mg alloy during uniaxial loadings along the rolling direction. (a) Stress-strain curves of uniaxial tension and compression, (b) twin volume fraction of uniaxial compression (After Wu et al. [105]).
Crystals 11 00435 g008
Figure 9. Deformation twinning and detwinning operations: (a) Initial twin-free parent grain (b) Operation A: As soon as the twin volume reaches a threshold of f 0 , twin nucleation occurs. This nucleated twin can grow according to the reduction in the volume of parent grain. (c) Operation B: The growth of the twin region can occur according to the child propagation. (d) Operation C: As the parent region grows, the twin volume reduces. (e) Operation D: Detwinning inside the twinned child leads to the twin volume reduction (After Yaghoobi et al. [9]).
Crystals 11 00435 g009
Figure 10. Comparison of predicted cyclic response of AZ31B Mg alloy versus the experimental data subjected to different loading paths of: (a) Uniaxial compression-tension-compression, (b) uniaxial tension-compression- tension. The twin volume is predicted by simulation and demonstrated at different strains (After H. Wang et al. [90]).
Crystals 11 00435 g010
Figure 11. Comparison of predicted stress versus the absolute value of the accumulated strain in AZ31B Mg alloy versus the experimental data subjected to in-plane compression followed by compression loading through the thickness along the RD. The twin volume is predicted by simulation and demonstrated at different strains (After H. Wang et al. [90]).
Crystals 11 00435 g011
Figure 12. A partially twinned material point in the CPFE framework (After Yaghoobi et al. [9]).
Crystals 11 00435 g012
Figure 13. The comparison of the simulated stress-strain response responses of ZK60A Mg alloy subjected to the uniaxial loading along the extrusion direction versus the experimental data of Wu [107] (Yaghoobi et al. [9]).
Crystals 11 00435 g013
Figure 14. Comparison of the predicted stress-strain curve versus the experimental results of Wu et al. [17] and Wu [107] during the cyclic loading along the extrusion direction in ZK60A Mg alloy (After Yaghoobi et al. [9]).
Crystals 11 00435 g014
Figure 15. The variation of predicted twin volume versus the strain compared to the experimentally measured change in the normalized intensity of the { 0002 } diffraction peak along the longitudinal direction obtained by Wu et al. [35] and Wu [107] in ZK60A Mg alloy during the cyclic loading along the extrusion direction (After Yaghoobi et al. [9]).
Crystals 11 00435 g015
Figure 16. The evolution of basal ( 0001 ) pole figures predicted by CPFE simulation at different strains: (a) Initial texture, (b) first maximum compression ( ε = 1.2 % ) in cycle 1, (c) first maximum tension ( ε = 1.2 % ) in cycle 1, (d) second maximum compression ( ε = 1.2 % ) in cycle 2, (e) second maximum tension ( ε = 1.2 % ) in cycle 2 (After Yaghoobi et al. [9]).
Crystals 11 00435 g016
Figure 17. Using SEM-DIC technique to investigate the underlying deformation mechanisms in WE43-T5 Mg alloy during tensile loading along the rolling direction: (a) The map of normalized maximum principal strain maps at ε = 1.23 % , (b) the map of normalized maximum principal strain maps at ε = 4.86 % , (c) the inverse pole figure map, (d) a probability distribution of the strain at different applied tensile strains of ε = 1.23 % ,   2.91 % ,   and   4.86 % (After Githens et al. [25]).
Crystals 11 00435 g017
Figure 18. Identification of active deformation mode using SEM-DIC experiment and CPFE simulation at a tensile strain of ε = 2.91 %   (a) SEM-DIC strain map, (b) slip traces for different deformation mode along with the basal Schmid factor map, (c) CPFE simulation strain map, (d) the activity of basal slip system obtained from CPFE simulation (After Githens et al. [25]).
Crystals 11 00435 g018
Figure 19. Comparison of active deformation modes versus corresponding Schmid factor at a uniaxial tensile strain of ε = 4.86 % (a) SEM-DIC experimental data, (b) CPFE simulation results (After Githens et al. [25]).
Crystals 11 00435 g019
Figure 20. Active deformation modes versus corresponding Schmid factor at uniaxial compression strain of ε = 4.2 % obtained using the SEM-DIC experiment (After Githens et al. [25]).
Crystals 11 00435 g020
Figure 21. The stress-strain response of Mg alloy WE43 with different heat treatment conditions during uniaxial tension along the rolling direction (After Ganesan et al. [8]).
Crystals 11 00435 g021
Figure 22. The effect of heat treatment condition on normalized maximum principal strain map subjected to a uniaxial tension along the rolling direction at a strain of ε = 3.23 % for different heat treatment conditions of: (a) Solution treated, (b) 15 min aged, (c) 2 h aged, (d) 4 h aged, (e) 16 h aged (T6 condition) (After Ganesan et al. [8]).
Crystals 11 00435 g022
Figure 23. The probability distribution of normalized maximum principal strain ε 1 / ε 1 for WE43 Mg alloy subjected to different heat treatment conditions after solution treatment at the uniaxial tensile strain of ε = 3.23 % along the rolling direction (After Ganesan et al. [8]).
Crystals 11 00435 g023
Figure 24. Comparison of the stress-strain curves of WE43 with different heat treatment conditions of ST, T5, and T6 subjected to uniaxial tension along the rolling direction: CPFE simulation versus the experimental results (After Ganesan et al. [8]).
Crystals 11 00435 g024
Figure 25. The strain maps obtained by the SEM-DIC experiment compared to the CPFE prediction in WE-43 T6 sample during uniaxial tension at different strain values: (a) ε = 0.76 % (SEM-DIC), (b) ε = 0.76 % (Simulation), (c) ε = 4.83 % (SEM-DIC), (d) ε = 4.83 % (Simulation), (e) ε = 8.15 % (SEM-DIC), (f) ε = 8.15 % (Simulation) (After Ganesan et al. [8]).
Crystals 11 00435 g025aCrystals 11 00435 g025b
Figure 26. The comparison of deformation modes relative activity in T5 and T6 heat treatment conditions of WE43 Mg alloy during uniaxial loadings along the rolling direction obtained by the CPFE simulation: (a) Uniaxial tension, (b) uniaxial compression (After Ganesan et al. [8]).
Crystals 11 00435 g026aCrystals 11 00435 g026b
Figure 27. Stress-strain curves for AZ31B Mg alloy during uniaxial tension along normal direction obtained by continuous deformation, in-situ 3DXRD experiment, and CPFE simulation. The steps of 1 to 4 correspond to the strain values of ε = 0 % , 0.2 % ,   0.4 % ,   and   1.4 % at which the measurements of diffraction were performed. (b) is a magnified version of (a) in the strain range of ε = 0 % 2 % (After Abdolvand et al. [27]).
Crystals 11 00435 g027
Figure 28. Effect of twinning on texture: (a) The { 0002 } pole figures at a tensile strain of ε = 0 % (Step-1), (b) the { 0002 } pole figures at a tensile strain of ε = 0.4 % (Step-3), (c) twin volume computed by CPFE versus the measured twin fraction, (d) variation of predicted twin volume versus misorientation between normal to the basal plane of the grain and loading direction predicted by CPFE at a tensile strain of ε = 0.4 % (After Abdolvand et al. [27]).
Crystals 11 00435 g028
Figure 29. Stress evolution inside the untwinned parent and twinned children grains: The results for 15 parent grains and 20 twinned children nucleated within those parent grains (a) σ 33 , (b) σ c p , (c) σ n , (d) τ r s . The results for a single untwinned parent grain and two twin variants nucleated from that grain (e) σ 33 , (f) σ c p , (g) σ n , (h) τ r s . (i) The schematics of the stress components presented in (ah) (After Abdolvand et al. [27]).
Crystals 11 00435 g029
Figure 30. The cyclic response of pure Mg samples during the cyclic loading with a strain amplitude of 0.75% along the extrusion direction, including the stress-strain loops and variations of basal { 0   0   0   2 } peak intensity along with loading and normal directions during the cyclic loading (ac) Cycle 1 (df) Cycle 2, (gi) Cycle 200 (jl) Cycle 500 (After Murphy-Leonard et al. [7]).
Crystals 11 00435 g030
Figure 31. The variation of (a) twin initiation stress and (b) detwinning exhaustion stress versus the number of cycles in the case of cyclic loadings with the strain amplitude of 0.75% and 0.52% (After Murphy-Leonard et al. [7]).
Crystals 11 00435 g031
Figure 32. The variation of twin intensity at maximum tensile strain versus the number of cycles in the case of cyclic loadings with the strain amplitude of 0.75% and 0.52% (After Murphy-Leonard et al. [7]).
Crystals 11 00435 g032
Figure 33. The stress-strain response of pure Mg sample during cyclic loading along the extrusion direction: CPFE simulation results for cycle 2 (Δ symbol) are compared versus the experimental results (After Aagesen et al. [108]).
Crystals 11 00435 g033
Figure 34. The stress-strain responses of AZ31B Mg alloy during thorough-thickness compression (TTC) and in-plane compression (IPC). The circles on IPC curve represent the strains at which the in-situ neutron diffraction measurements were conducted. The VPSC results are also presented as the dashed line for the IPC loading (After Brown et al. [34]).
Crystals 11 00435 g034
Figure 35. The diffraction pattern of the AZ31B Mg alloy subjected to in-plane compression loading in parallel and perpendicular detector banks at different stress values (After Brown et al. [34]).
Crystals 11 00435 g035
Figure 36. The variation of lattice strain parallel and perpendicular to the loading axis versus the applied load: (a) Untwinned Parent grains, (b) daughter twinned grains (After Brown et al. [34]). The dashed line represents the theoretical linear elastic relation. Closed markers denote the loading path, while the open markers represent the unloading path.
Crystals 11 00435 g036
Publisher’s Note: MDPI stays neutral with regard to jurisdictional claims in published maps and institutional affiliations.