Article

Comparison of the Effect of the Amino Acids on Spontaneous Formation and Transformation of Calcium Phosphates

by
Ina Erceg
1,
Nadica Maltar-Strmečki
2,
Darija Domazet Jurašin
1,
Vida Strasser
1,
Marija Ćurlin
3,
Daniel Mark Lyons
4,
Borna Radatović
5,
Nives Matijaković Mlinarić
6,
Damir Kralj
6 and
Maja Dutour Sikirić
1,*
1
Laboratory for Biocolloids and Surface Chemistry, Division of Physical Chemistry, Ruđer Bošković Institute, Bijenička cesta 54, 10000 Zagreb, Croatia
2
Laboratory for Magnetic Resonances, Division of Physical Chemistry, Ruđer Bošković Institute, Bijenička cesta 54, 10000 Zagreb, Croatia
3
Department of Histology and Embryology, School of Medicine, University of Zagreb, Šalata 3, 10000 Zagreb, Croatia
4
Center for Marine Research, Ruđer Bošković Institute, Giordano Paliaga 5, 52210 Rovinj, Croatia
5
Institute for Physics, Bijenička cesta 46, 10000 Zagreb, Croatia
6
Laboratory for Precipitation Processes, Division of Materials Chemistry, Ruđer Bošković Institute, Bijenička cesta 54, 10000 Zagreb, Croatia
*
Author to whom correspondence should be addressed.
Crystals 2021, 11(7), 792; https://doi.org/10.3390/cryst11070792
Submission received: 14 June 2021 / Revised: 1 July 2021 / Accepted: 4 July 2021 / Published: 7 July 2021
(This article belongs to the Special Issue Green Approach in Synthesis of Bio-Inspired Materials)

Abstract

:
Understanding the effect that specific amino acids (AA) exert on calcium phosphate (CaPs) formation is proposed as a way of providing deeper insight into CaPs’ biomineralization and enabling the design of tailored-made additives for the synthesis of functional materials. Despite a number of investigations, the role of specific AA is still unclear, mostly because markedly different experimental conditions have been employed in different studies. The aim of this paper was to compare the influence of different classes of amino acids, charged (aspartic acid, Asp and lysine, Lys), polar (asparagine, Asn and serine, Ser) and non-polar (phenylalanine, Phe) on CaPs formation and transformation in conditions similar to physiological conditions. The precipitation process was followed potentiometrically, while Fourier transform infrared spectroscopy, powder X-ray diffraction, electron paramagnetic spectroscopy (EPR), scanning and transmission electron microscopy were used for the characterization of precipitates. Except for Phe, all investigated AAs inhibited amorphous calcium phosphate (ACP) transformation, with Ser being the most efficient inhibitor. In all systems, ACP transformed in calcium-deficient hydroxyapatite (CaDHA). However, the size of crystalline domains was affected, as well as CaDHA morphology. In EPR spectra, the contribution of different radical species with different proportions in diverse surroundings, depending on the type of AA present, was observed. The obtained results are of interest for the preparation of functionalized CaPs’, as well as for the understanding of their formation in vivo.

Graphical Abstract

1. Introduction

The biomimetic approach in the development and synthesis of novel materials, especially hard tissue regeneration biomaterials, is constantly gaining in importance due to the superior properties of natural biomaterials, which have not been achieved by any engineered material to date [1,2,3,4]. In addition, it enables a more environmentally friendly approach to advanced material production [5].
The key feature of the biomineralization, the process of hard tissue formation in organisms, is the strict control that the organic matrix exerts over precipitation of the inorganic component of the hard tissue in question [6,7,8]. In vitro investigations of the role that specific components of the organic matrix and/or their building blocks play in the formation of inorganic biominerals have been utilized as a successful tool in the elucidation of biomineralization and as a promising way of designing tailored additives for different applications in biomedicine and biotechnology [9,10,11,12,13].
Among the 60 different types of biominerals, the most interesting to humans are calcium phosphates (CaPs), the main inorganic component of vertebrate skeletons, which are also prominent in pathological biomineralization [8,14]. Although CaPs are less common than calcium carbonates (CaCO3) or silicon dioxide (SiO2), their role in vertebrates makes them particularly important in biomedicine and materials science [1]. Fourteen chemically different calcium phosphate compounds are known [14]. The main inorganic component of vertebrates’ hard tissue is poorly crystallized, nonstoichiometric hydroxyapatite (HA, Ca10(PO4)6(OH)2) or calcium-deficient hydroxyapatite (CaDHA, Ca10−x(HPO4)x(PO4)6−x(OH)2−x, 0 < x < 1), substituted with sodium, magnesium or carbonate ions, which is often called “biological apatite”. The similarity with the bone mineral makes other CaPs interesting for potential application as bone regeneration materials [14], e.g., octacalcium phosphate (OCP, Ca8(HPO4)2(PO4)4·5H2O), calcium hydrogen phosphate dihydrate (DCPD, CaHPO4·2H2O) and β – tricalcium phosphate (β-TCP, Ca3(PO4)2) [15].
The inclusion of additives, organic molecules, macromolecules and surfactants in the precipitation system affects the rate and mechanism of CaP formation, as well as the properties of the formed solid phase(s) [15,16]. In vivo, proteins play a key role in controlling CaP formation. Although more than 200 proteins can be found in the bone, about 90% of bone protein content consists of collagen type I [4]. Investigating the influence of amino acids (AAs), the building blocks of proteins, is considered an important approach to understanding protein’s role in CaP formation in vivo. However, despite numerous investigations, the role that individual AAs exert on CaPs formation is still not completely clarified [17]. One of the key reasons for this is the diverse range of experimental conditions, which prevent a straightforward comparison of the results obtained in different studies [16,18]. In addition, AAs can modulate the growing crystalline through different types of interaction [18,19].
Constant composition experiments have shown that different classes of AAs, with polar, hydrophobic, acidic or basic side groups, inhibit the crystal growth of HA by adsorption at crystal growth sites [20,21,22,23,24,25]. However, in spontaneous precipitation, inhibition [26] and promotion [27,28,29] of, as well as no effect [30] on, the rate of CaP precipitation and/or transformation were observed. Similarly, contradictory results regarding AAs’ influence on crystal morphology were obtained [17,31,32].
In order to contribute to the elucidation of effects that specific AAs exert on the formation of CaPs at conditions similar to physiological conditions, the influence of different classes of AAs, i.e., charged (Asp, Lys) polar (Ser, Asn) and non-polar (Phe) (Figure S1), on the spontaneous precipitation of CaPs and properties of the formed solid phases was investigated in this work.

2. Materials and Methods

Analytical grade chemicals, calcium chloride dihydrate (CaCl2·2H2O), sodium hydrogenphosphate (Na2HPO4), sodium chloride (NaCl), L−lysine and L−asparagine were obtained from Sigma Aldrich (Darmstadt, Germany), hydrochloric acid (HCl) was obtained from Kemika (Zagreb, Croatia), while L−serine, L−phenylalanine and L−aspartic acid were purchased from Alfa Aesar (Tewksbury, MA, USA). Milli-Q water (Millipore, 0.05 µS cm−1) was used in all experiments.
CaCl2·2H2O, Na2HPO4, NaCl and amino acid stock solutions were prepared from the corresponding chemicals, which were dried overnight in a vacuum desiccator. The pH of sodium hydrogenphosphate stock solution was adjusted to 7.4 using HCl.

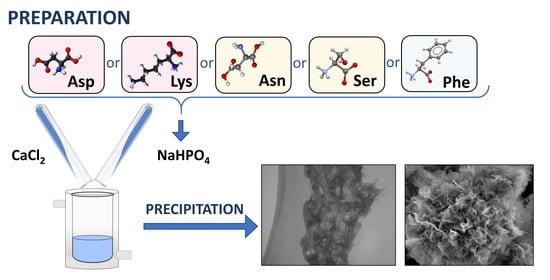
2.1. Preparation of Precipitation Systems

Cationic and anionic reactant solutions were prepared by diluting the respective CaCl2·2H2O and Na2HPO4 stock solutions to a concentration of c(CaCl2·2H2O) = c(Na2HPO4) = 0.1 mol dm−3. Both reactant solutions contained 0.15 mol dm−3 NaCl to maintain the ionic strength of the precipitation system constant. The pH of the anionic solution was adjusted to 7.4 using 0.1 mol dm−3 HCl. Amino acids were added to the anionic reactant solution, and the pH was readjusted if needed.
The precipitation systems were prepared by the fast mixing of equal volumes (20 mL) of equimolar cationic and anionic reactant solutions. The initial reactant concentrations in precipitation systems were c(CaCl2·2H2O) = c(Na2HPO4) = 5 mmol dm−3, c(NaCl) = 0.15 mol dm−3, c(AA) = 1, 2.5 and 5 mmol dm−3 at pH = 7.4. The control precipitation system (CS) contained no amino acids. The scheme of the experimental set-up is shown in Figure S2, and the initial experimental conditions for precipitation experiments are given in Table S1.
All experiments were performed at (25 ± 0.1) °C in a thermostated double-walled vessel, with a total volume of 50 mL. The systems were magnetically stirred and the precipitation process was followed by constantly monitoring pH changes (Metrohm 701 pH/ion meter). Based on pH vs. time curves, induction times for ACP transformation were determined. The different rates of pH change in the stages in which ACP and crystalline CaP form enable the determination of the induction time for secondary precipitation (ti), as the time at the intersection of the tangents drawn on the first two sections of the pH vs. time curve [33] (Figure S3). Samples for further analysis were taken after 10 and 60 min, except for the precipitation system containing Ser, for which samples were taken after 60 and 150 min. The chosen periods enabled the characterization of precipitates formed in different precipitation stages. Precipitates were filtered through a 0.45 μm Millipore filter paper, washed three times with Milli-Q water and once with ethanol, and dried in a stream of nitrogen. The samples were kept at 4 °C until further analysis.

2.2. Fourier Transform Infrared Spectroscopy (FTIR)

The FTIR spectra of formed precipitates were recorded on an FTIR spectrometer equipped with an attenuated total reflection module (Tensor II, Brucker, Ettlingen, Germany) in the range from 4000 to 400 cm−1 with a resolution of 4 cm−1. The recorded spectra are the average of 16 scans.

2.3. Powder X-ray Diffraction (PXRD)

Powder XRD patterns were obtained using a Rigaku Ultima IV diffractometer (Tokyo, Japan), operating at a voltage and current of 40 kV and 40 mA, respectively, in Bragg-Bretano geometry using CuKα radiation and 5° Soller slits. XRD patterns were scanned in 0.02° steps (2θ) in the 2θ range from 3.25° to 60.00°, with a scan speed of 1° (2θ) min−1. The baselines of powder XRD patterns were corrected and patterns smoothed using a 15-point Savitzky–Golay algorithm. The size of CaDHA crystalline domains along the [002] direction was calculated using the Scherrer Equation (1) [26,34]
crystallite   size = k λ FWHM   cos ( θ )
where k is the shape factor (k = 0.9), λ is the wavelength of Cu Kα radiation (λ = 0.154056 nm), FWHM is full width at half maximum of the peak at 2θ 25.9° and θ is diffraction angle.

2.4. Scanning Electron Microscopy (SEM)

For SEM analysis, a small amount of dried sample was placed on double-sided carbon tape. The morphology was observed by FE-SEM (JEOL JSM-7000F microscope, Tokyo, Japan) and by a tungsten filament electron microscope (SEM; TESCAN VEGA 3 microscope, Fuveau, France).

2.5. Transmission Electron Microscopy (TEM)

For TEM analysis, a drop of the suspension was placed on a copper grid covered with a Formvar membrane. The excess solution was removed by filter paper and the precipitate was washed three times with a drop of Milli-Q Water. After removing the excess water, the samples were dried in a stream of nitrogen and kept at 4 °C until further analysis. Transmission electron microscopy images were obtained using a Zeiss TEM 902A (Oberkochen, Germany), operated at 80 kV. Particle sizes from the TEM micrograph were determined by means of the image analysis program ImageJ 1.48v (freely available at https://imagej.nih.gov/ij/index.html). At least 20 particles were measured for each sample.

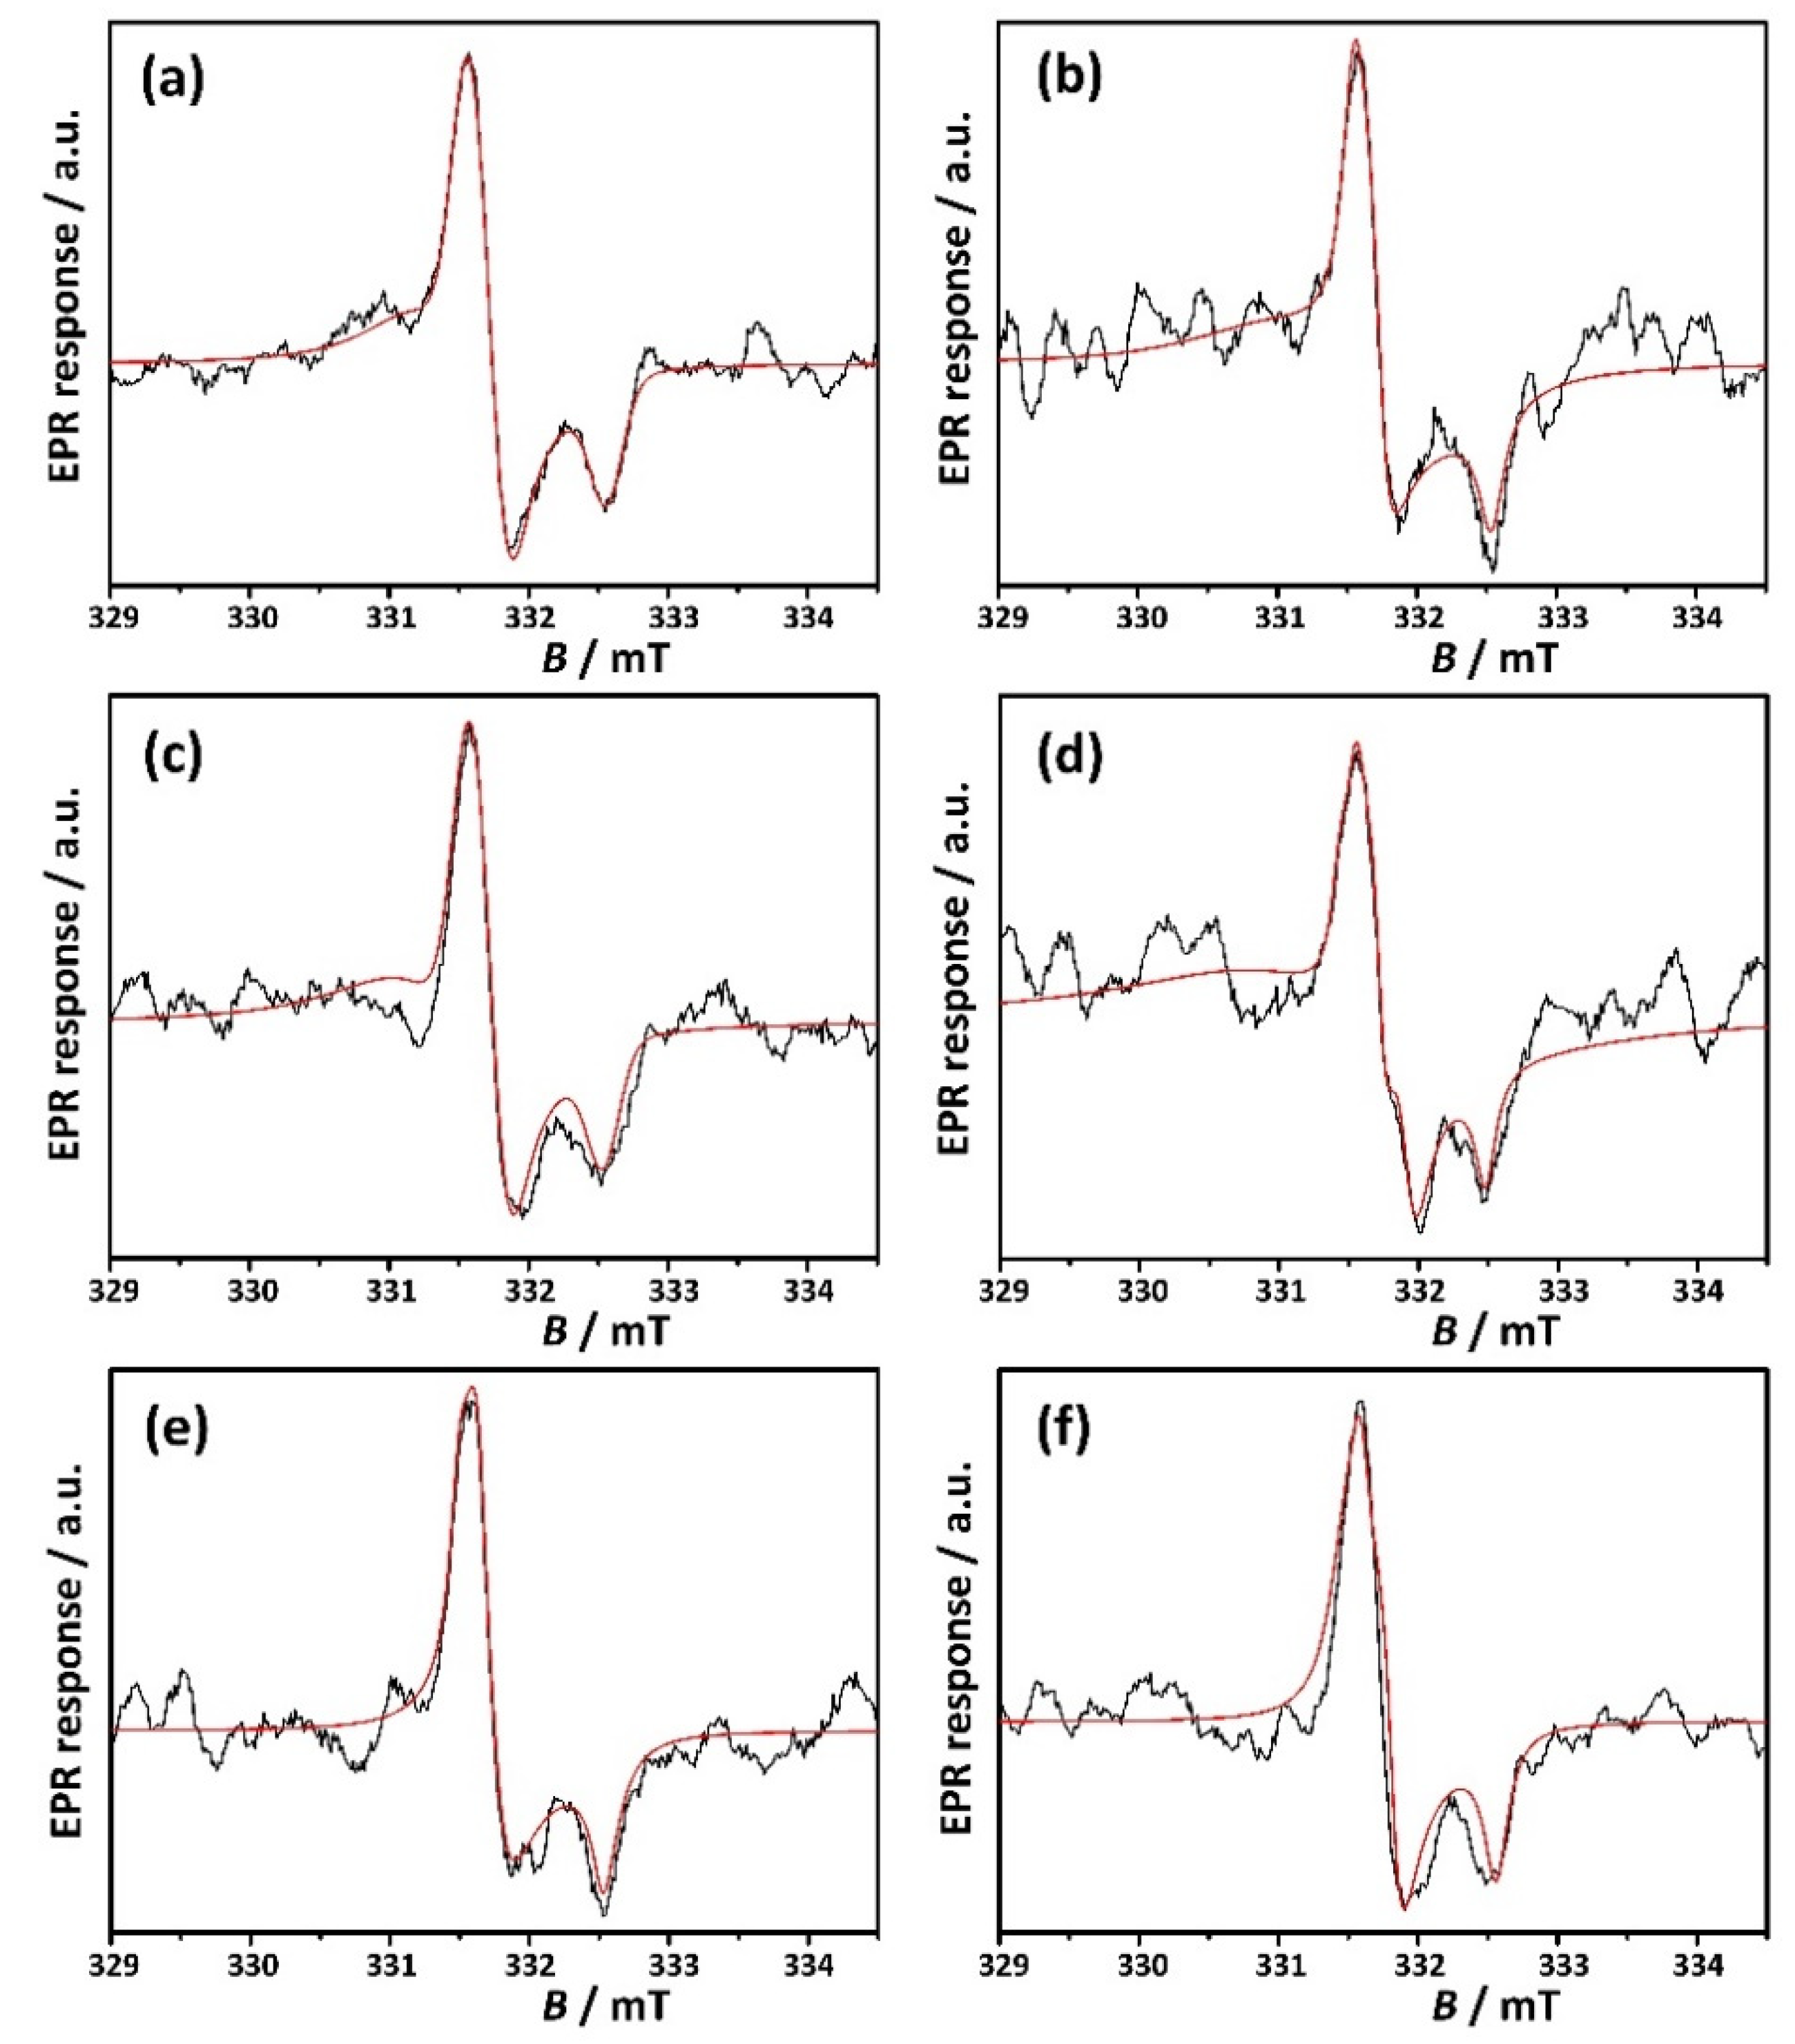
2.6. Electron Paramagnetic Resonance Spectroscopy (EPR)

The EPR spectra were collected by a house-modified Varian E-109 spectrometer (Santa Clara, CA, USA) using a Bruker ER 041 XG microwave bridge working at X-band (i.e., a microwave frequency of 9.3 GHz) at room temperature (25 °C). The temperature in the EPR cavity was controlled by a Bruker ER 4111 temperature controller (Billerica, MA, USA) using a nitrogen gas flow with an accuracy of 0.2 °C. A Mn2+/MgO standard reference was used to calibrate the magnetic field of the EPR spectrometer. Radicals induced by gamma irradiation in the presence of air in all investigated samples, using a 60Co gamma ray source of the Ruđer Bošković Institute [35], to a cumulative dose of 25 kGy, have been used to facilitate detection by EPR spectroscopy. No EPR signal could be detected for the empty sample tube or non-irradiated samples. The EPR spectra were simulated with a custom-built program in MATLAB (T he MathWorks Inc., Natick, MA, USA) using the EasySpin program package [36] to obtain the spectral parameters.

3. Results

3.1. Influence of Amino Acids on the Rate of CaP Transformation

In vitro, at conditions close to physiological (neutral or slightly basic solutions), CaPs usually precipitate in two steps [15,37,38,39]. The first step is the formation of amorphous calcium phosphate (CaxHy(PO4)z·n H2O (3 < n < 4.5), ACP). Depending on experimental conditions, ACP can be further transformed into OCP, CaDHA or HA [33,38,40]. Recent studies provided evidence that amorphous and metastable CaP phases have similar precursor roles in hard tissue formation [41,42].
During CaP precipitation, pH changes reflect different stages of the precipitation and transformation processes. Therefore the reaction progress can be followed by monitoring the pH changes in the system of interest [33,43,44,45,46]. Typically, sigmoidal pH vs. time curves are obtained, in which [33,43,44,45,46,47]:
In the initial precipitation stage (stage I), slight or negligible pH changes are observed, which correspond to the formation of ACP;
A subsequent rapid decrease in pH (stage II) is associated with secondary precipitation of crystalline phase upon the formation of ACP;
A final slight pH change (stage III) corresponds to the solution-mediated crystal growth and phase transformation of the crystalline phase formed in stage II.
In the pH vs. time curve of the control system (Figure 1) the three stages of the precipitation process can be clearly distinguished. However, in the presence of AAs, a difference in the shape of the stage I can be observed. Indeed, the pH changes in these systems are no longer continuous, as two regions of somewhat different rates of pH decrease can be observed. The difference from the behavior of the control system becomes more pronounced with an increase in the AAs concentration. Such behavior is usually ascribed to the difference in the pathway of ACP to crystalline phase transformation, caused by the change in the experimental conditions, e.g., the presence of additives [43,48,49].
The stability of ACP is reflected in the length of stage I, i.e., in the time elapsed from the initiation of the precipitation to the beginning of secondary precipitation, the so-called induction time. A longer induction time points to the greater stability of ACP, as its transformation to the crystalline phase is delayed [33]. The induction times obtained in the control system and in the presence of different AAs concentrations are given in Table 1. Although no straightforward correlation between induction times and AAs concentration is observed, it can be concluded that the dominant effect of the investigated AAs on ACP transformation at the highest concentrations applied is inhibition. Thus, the most pronounced inhibition was observed in the presence of 5 mmol dm−3 Ser. However, the promotion of ACP transformation was also observed, i.e., in the presence of 1.0 mmol dm−3 Lys, 2.5 mmol dm−3 Asp, and 5 mmol dm−3 Phe and Asn. The most effective promotor was nonpolar Phe.
Despite the generally recognized importance of revealing the specific amino acids’ influence on understanding proteins’ role in precipitation processes, there is still no clear conclusion regarding their inhibiting or promoting mechanism. AAs can either decrease the solution supersaturation through the complexation of calcium or phosphate ions or they can interact with the solid phase by non-specific adsorption at surfaces or at growing sites [20,21,22,23,24,25], which both intuitively lead to inhibition [18]. It should be noted that the AAs affinity towards the solid phases, which appear in biomineralization, is influenced by the overall charge and the charge of specific AAs segments, their ability to form chemical bonds, and their stereochemical or geometrical properties [18,20,21,31,50,51,52]. In addition to the complexity in the mechanism of action, the reason for contradictory results also lies in the fact that the employed experimental conditions (reactant concentration, temperature, mode of mixing) and experimental setup (seeded growth, constant composition, spontaneous precipitation) vary considerably between different studies. In a pH free-drift experimental setup, similar to the one employed in this study, Yang et al. [27] have shown that Asp, glycine (Gly) and Lys at a 1.0 mmol dm−3 concentration additionally reduce the induction and transformation times, even in the presence of known inhibitors, such as Mg2+ ions. The most efficient promotor was Lys. Contrary to this, Tavafoghi Jahormi et al. [26] have determined that positively charged arginine (Arg) more effectively inhibits HA nucleation than negatively charged glutamic acid (Glu), using a 10 times higher AAs concentration. The observed effect, determined by the change in turbidity, was attributed to the ability of Arg to interact more strongly with both calcium and phosphate ions than Glu. On the other hand, Ser present at low concentrations (up to 0.07 mmol dm−3) did not influence induction time [30]. In our recent study, we investigated the influence of different classes of amino acids on CaPs’ seeded growth [52]. In the case of OCP-seeded crystals, Ser was the most efficient inhibitor, while Phe was the most efficient promotor of CaP formation, similar to the behavior observed in this study. The effect of Phe could be ascribed to its molecular structure, i.e., the presence of an aromatic ring in the side group, which can act as an electron donor [20,21].

3.2. Influence of Amino Acids on the Properties of Formed CaPs

In order to gain additional insight into the observed behaviour of AAs, the precipitates formed in the presence of the highest AA concentration investigated in this study were analysed after 10 and 60 min (60 and 150 min in the case of Ser) reaction time.
PXRD patterns of the precipitates formed in the control system and systems containing 5 mmol dm−3 AAs (Figure 2a) contained only broad amorphous diffraction maxima in the 8–18° and 20–36° 2θ region, thus indicating that, in all systems, in the initial stage of the precipitation process, ACP was formed [53,54].
FTIR spectra (Figure 2b) confirmed the PXRD results. In the spectrum of the precipitate formed in the control system phosphate, the water bands characteristic of calcium phosphates [55,56] were observed: bands at 1283 cm−1 and 859 cm−1 characteristic of the HPO 4 2 group, ν3c triply degenerate asymmetric stretching mode of PO 4 3 at 1059 cm−1, ν4b triply degenerate bending mode of PO 4 3 at 572 cm−1, and a broad band between 3704 and 2797 cm−1 and a band at 1644 cm−1, characteristic of water. The formation of the ACP was confirmed by the absence of phosphate bands’ splitting, corresponding to asymmetric stretching and bending mode [53,57]. In the spectra of the precipitates formed in the presence of AAs, changes in the wavenumbers of ν3c triply degenerate asymmetric stretching mode of PO 4 3 and the lower wavenumber of the HPO 4 2 group were observed. In addition, in the case of Lys and Phe, low-intensity broad bands characteristic of COO asymmetric stretching [32] were noted at around 1555 cm−1 and 1444 cm−1 (the latter observed only in the presence of Lysine). Additionally, in the FTIR spectra of the precipitate formed in the presence of Ser, the intensity of the water band at 1643 cm−1 decreased, while the band at around 1283 cm−1 was not observed.
In addition to changes in FTIR spectra, changes in the morphology of ACP particles were observed by TEM (Figure 3). In the control system, after 10 min reaction time (Figure 3a), chain-like aggregates of spherical particles typical of ACP were observed [33,40,54]. The average diameter of these particles was 143.5 ± 24.8 nm. A similar ACP morphology was observed in the presence of Ser (Figure 3e) as, after 60 min, the precipitation process was still at the beginning of the initial precipitation stage (Figure 1d). The average size of particles was 64.5 ± 9.9 nm. In the presence of other investigated AAs, more profound morphological changes were observed. In the presence of Asp, a denser precipitate with a still-visible, chain-like structure was observed (Figure 3b), while, in the presence of Lys and Asn, a denser precipitate in which needle-like crystals had begun to form was observed (Figure 3c,d). In the presence of Phe, a granular gel-like phase was formed (Figure 3f). The observed difference in the morphology of ACP formed in the presence of AAs confirms the results of potentiometric measurements, which indicated a change in transformation mechanism compared to the control system, i.e., the possible formation of another amorphous phase, ACP2 [48].
After 60 min (150 min in the case of Ser) reaction time, in all investigated precipitation systems, ACP transformed to CaDHA, as indicated by PXRD diffractograms and FTIR spectra (Figure 2c,d). In the diffractogram of the control system (Figure 2c), prominent reflections at 2θ 25.97° and 32.10° were observed, as well as low-intensity reflections at 2θ 28.52°, 39.53°, 46.62°, 49.51° and 53.25°, characteristic of CaDHA [32,53,58]. In the FTIR spectra, in comparison to the spectra of ACP, formed after 10 min, two new bands were observed: the ν3a triply degenerate asymmetric stretching mode of PO 4 3 at 1119 cm−1 and ν4a triply degenerate bending mode of PO 4 3 at 606 cm−1. In addition, splitting of the phosphate band at 1034 cm−1, corresponding to the stretching mode of PO 4 3 , and at 606 cm−1, corresponding to the bending mode of PO 4 3 , can be observed, confirming the formation of CaDHA.
In the presence of AAs, precipitates of lower crystallinity than seen in the CS were obtained. The most crystalline were the precipitates formed in the presence of Asn and Phe. Their diffractograms contained all reflections, as in the CS, except for the one at 2θ 39.53°. The diffractogram of precipitate formed in the presence of Ser contained only the most prominent reflections at 2θ 25.83° and 31.99°, indicating that poorly crystalline CaDHA had formed in this system. In order to additionally investigate the influence of AAs on the structure of CaDHA, the size of crystalline domains along the [002] direction was determined (Table 2). Asp was the most effective in reducing the size of the crystalline domain. Such a strong Asp effect was observed in previous studies [17,32,59]. The crystalline domain size was also reduced in the presence of Ser, which is consistent with some other investigations [17,59]. On the contrary, in the presence of Phe, the size of the crystalline domain increased, while in the presence of Lys and Asn, it was not significantly different from that of the control system. The behavior of Asn is in contrast to that observed in the study of Gonzalez-McQuire et al. [17], where much higher reactant concentrations were used. Previous studies showed that AAs are able to inhibit HAP particle and crystal growth, with charged AAs being more effective than non-charged AAs [18].
In the FTIR spectra of precipitates formed in the presence of AAs after 60 min reaction time (150 min in the case of Ser, Figure 2d), the changes in wavenumbers of ν3c triply degenerate asymmetric stretching mode of PO 4 3 and lower wavenumber band of the HPO 4 2 group observed after 10 min reaction time are still present. A band characteristic of the ν1 nondegenerate symmetric stretching mode of PO 4 3 at around 960 cm−1 was detected. In contrast, this band was not present in the spectrum of the CS and the spectra of the precipitates formed in the presence of AAs after 10 min reaction time. No bands characteristic of AAs were observed, probably due to the greater amount of formed CaP.
To gain more insight into the influence of AAs on local ordering in the CaDHA, crystal lattice EPR spectroscopy was performed. No signal was detected in EPR spectra, before precipitate irradiation, confirming the purity of the applied preparation pathway, with no traces of metal or other impurities. Thus, radiation-induced radicals were used to monitor structural changes within different samples. In Figure 4. the experimental and simulated EPR spectra of irradiated CS and precipitates formed in the presence of AAs are shown. For irradiated samples, the main stable component can be assigned to CO 2 . In previous studies [60,61,62,63,64,65,66,67], it was shown that the EPR spectra of biological, as well as synthetic carbonated calcium apatites, exhibit a complex EPR signal at around g = 2, which comprises several powder spectrum contributions arising from different paramagnetic species ( CO 3 ,   CO 3 3 , CO 2 , O 3 , O ) stabilized in different locations (at hydroxyl, phosphate or surface sites) or from the same species, recognized by the difference in g anisotropy. However, as the EPR spectra of apatite are strongly dependent on the conditions of sample preparation (CO2 flow, drying temperature, annealing procedure, etc.) [60,63,68], a further analysis was performed.
In our study, the total intensities in terms of the area of EPR absorption normalized to mass (i.e., proportional to radiation-induced radical concentration) were not different regarding the range of measurement error in the presence of AAs. However, by using phenomenological parameters, such as R-value [61,62], line-shape deviations due to the CO 3 3 centre, caused by the presence of different AAs during precipitation, can be observed, confirming that AAs indeed influence the local ordering. The definition of the R-value is given in Figure S4. The differences in obtained R-value are shown in Table 3. It should be noted that the R-value of the sample obtained in the presence of Asp is 55.03% higher than the R-value obtained for the CS. A similar increase was obtained for the system containing Ser, which was 17.85% higher than CS, in line with the decrease in the size of crystalline domains along [002]. On the contrary, in the presence of Phe, the obtained R-value is slightly smaller. The observed effect can be ascribed to the two   CO 3 3 -radicals present in different proportions in diverse surroundings, depending on the type of AA present. A simulation of the experimentally recorded EPR spectra confirms these results, as the weight fraction of each spectral component depends on the environmental surroundings, i.e., the presence of different AA types, as shown in Table 4. The spectra are mainly composed of a CO 2 and axial CO 3 3 radical contributions. Furthermore, the EPR spectra of irradiated samples of Asp, Lys and Ser consist of two axial CO 2 radical components, while Asn contains one axial and one isotropic contribution, which indicates that the CO 2 radical is located in the crystal lattice in several slightly different environments, depending on the AA present [60]. At least one of the corresponding radicals is formed in the interior of the precipitate, while the other is created near the surface. Only Asn can be represented by two axial CO 3 3 radical contributions. One component can be assigned to CO 3 3 at a phosphate site, while the other can be assigned to the CO 3 3 on the surface or occupy a hydroxyl site [63].
SEM micrographs (Figure 5) show that AAs only slightly influence CaDHA morphology. Thus, in CS, after 60 min reaction time, irregular aggregates of large, thin, plate-like crystals are obtained. A precipitate of similar morphology was obtained in the presence of Phe. However, in the presence of the other amino acids applied, spherical aggregates of smaller and less-developed, thin, plate-like crystals were obtained.
Several studies have investigated the effect of AAs on HA morphology or transformation. Matsumoto et al. [59] reported that, in the presence of AAs such as Gly, Ser, Asp and Glu flake-like particles consisting of nano-sized platelets are formed. The flake-like morphology was also observed in their control sample. However, the platelets in this sample were much larger and thicker than those observed in the presence of AAs, which is consistent with our results. These AAs also reduce the degree of crystallinity in the HA [59]. The flake-like HA morphology was also reported by Eiden -Abmann et al. in the presence of AAs such as Asp, Glu or Ser [69].

4. Conclusions

The influence of different classes of AAs, namely, charged (Asp, Lys), polar (Asn, Ser) and non-polar (Phe), was investigated at conditions similar to physiological conditions. In the range of applied concentrations, AAs influence the ACP transformation mechanism, stability and morphology. All AAs except Phe inhibited the ACP transformation at higher concentrations, with Ser and Asp being the most efficient. Nevertheless, except for Ser, the investigated AAs influenced ACP morphology.
None of the investigated AAs influenced the composition of the CaDHA, which is formed in the later precipitation stage. However, the size of crystalline domains along the [002] direction decreased in the presence of Asp and Ser and increased in the presence of Phe. The observed changes were corroborated by EPR results, which indicate that the presence of diverse AAs differently affects the local microstructure of CaDHA. In addition, spherical aggregates of smaller, less-developed, thin, plate-like crystals, as compared to the control system, were obtained in the presence of Asp, Lys, Asn and Ser.
The observed differences in the effects that AAs exert on CaP precipitation, as well as the difference in the behavior of AAs of the same class, indicates that classification based on charge and polarity is not satisfactory to explain the different effects. Rather, these relatively simple molecules should be studied as specific entities.
The obtained results point to the likely complex role of AAs in biological mineralization, but also to a rather simple method of controlling CaPs properties, which are of importance in the preparation of multifunctional bone regeneration materials.

Supplementary Materials

The following are available online at https://www.mdpi.com/article/10.3390/cryst11070792/s1, Figure S1: Schematic representation of the structure of investigated amino acids: (a) aspartic acid (Asp), (b) lysine (Lys), (c) asparagine (Asn), (d) serine (Ser) and (e) phenylalanine (Phe), Figure S2: Schematic illustration of precipitation experiments, Figure S3: Determination of the induction time (ti) as the intercept between two tangents drawn on the first two parts of the pH vs time curve, Figure S4: Definition of R-value: R=I2/I1, Table S1: Experimental conditions for precipitation experiments.

Author Contributions

Conceptualization, M.D.S.; methodology, M.D.S. and N.M.-S.; formal analysis, I.E. and M.D.S.; investigation, I.E., N.M.-S., D.D.J., V.S., M.Ć., D.M.L., B.R., N.M.M. and D.K.; resources, D.K.; data curation, I.E. and M.D.S.; writing—original draft preparation, I.E. and M.D.S.; writing—review and editing, I.E. and M.D.S.; visualization, I.E. and V.S.; funding acquisition, D.K. and M.D.S. All authors have read and agreed to the published version of the manuscript.

Funding

This work has been financially supported by the Croatian Science Foundation under project IP-2013-11-5055.

Acknowledgments

B.R. gratefully acknowledges financial support from the European Regional Development Fund for the “Center of Excellence for Advanced Materials and Sensing Devices” (Grant No. KK.01.1.1.01.0001).

Conflicts of Interest

The authors declare no conflict of interest. The funders had no role in the design of the study; in the collection, analyses, or interpretation of data; in the writing of the manuscript, or in the decision to publish the results.

References

  1. Nudelman, F.; Sommerdijk, N.A.J.M. Biomineralization as an Inspiration for Materials Chemistry. Angew. Chem. Int. Ed. 2012, 51, 6582–6596. [Google Scholar] [CrossRef] [PubMed]
  2. Addadi, L.; Joester, D.; Nudelman, F.; Weiner, S. Mollusk Shell Formation: A Source of New Concepts for Understanding Biomineralization Processes. Chem. A Eur. J. 2006, 12, 980–987. [Google Scholar] [CrossRef]
  3. Dickerson, M.B.; Sandhage, K.H.; Naik, R.R. Protein- and Peptide-Directed Syntheses of Inorganic Materials. Chem. Rev. 2008, 108, 4935–4978. [Google Scholar] [CrossRef]
  4. Weiner, S.; Wagner, H.D. THE MATERIAL BONE: Structure-Mechanical Function Relations. Annu. Rev. Mater. Sci. 1998, 28, 271–298. [Google Scholar] [CrossRef]
  5. Falini, G.; Fermani, S. The Strategic Role of Adsorption Phenomena in Biomineralization. Cryst. Res. Technol. 2013, 48, 864–876. [Google Scholar] [CrossRef]
  6. Lowenstam, H.A.; Weiner, S. On Biomineralization; Oxford University Press: New York, NY, USA, 1989; ISBN 978-0-19-504977-0. [Google Scholar]
  7. Crichton, R. Biomineralization. In Biological Inorganic Chemistry; Elsevier: Amsterdam, The Netherlands, 2019; pp. 517–544. ISBN 978-0-12-811741-5. [Google Scholar]
  8. Mann, S. Biomineralization: Principles and Concepts in Bioinorganic Materials Chemistry; Oxford chemistry masters; Oxford University Press: New York, NY, USA, 2001; ISBN 978-0-19-850882-3. [Google Scholar]
  9. De, M.; Gosh, P.S.; Rotello, V.M. Applications of Nanoparticles in Biology. Adv. Mater. 2008, 20, 4225–4241. [Google Scholar] [CrossRef] [Green Version]
  10. Gray, J.J. The Interaction of Proteins with Solid Surfaces. Curr. Opin. Struct. Biol. 2004, 14, 110–115. [Google Scholar] [CrossRef]
  11. Hudson, S.P.; Cooney, J.; Magner, E. Proteins in Mesoporous Silicates. Angew. Chem. 2008, 47, 8582–8594. [Google Scholar] [CrossRef] [PubMed]
  12. Vallet-Regí, M.; Balas, F.; Arcos, D. Mesoporous Materials for Drug Delivery. Angew. Chem.-Int. Ed. 2007, 46, 7548–7558. [Google Scholar] [CrossRef] [PubMed]
  13. Fadeeva, I.V.; Fomin, A.S.; Sinel’nikov, A.A.; Kolyagin, Y.G.; Barinov, S.M. Effect of an Amino Acid on the Formation of Calcium Phosphate Particles on Chitosan Macromolecules. Inorg. Mater. 2015, 51, 1017–1024. [Google Scholar] [CrossRef]
  14. Dorozhkin, S.V. Calcium Orthophosphates. Application in Nature, Biology and Medicine; Pan Stanford Publishing: Singapore, 2012. [Google Scholar]
  15. Sikirić, M.D.; Füredi-Milhofer, H. The Influence of Surface Active Molecules on the Crystallization of Biominerals in Solution. Adv. Colloid Interface Sci. 2006, 128–130, 135–158. [Google Scholar] [CrossRef]
  16. Bleek, K.; Taubert, A. New Developments in Polymer-Controlled, Bioinspired Calcium Phosphate Mineralization from Aqueous Solution. Acta Biomater. 2013, 9, 6283–6321. [Google Scholar] [CrossRef]
  17. Gonzalez-McQuire, R.; Chane-Ching, J.-Y.; Vignaud, E.; Lebugle, A.; Mann, S. Synthesis and Characterization of Amino Acid-Functionalized Hydroxyapatite Nanorods. J. Mater. Chem. 2004, 14, 2277. [Google Scholar] [CrossRef]
  18. Tavafoghi, M.; Cerruti, M. The Role of Amino Acids in Hydroxyapatite Mineralization. J. R. Soc. Interface 2016, 13, 20160462. [Google Scholar] [CrossRef] [PubMed] [Green Version]
  19. Solonenko, A.P.; Belskaya, L.V.; Golovanova, O.A. Features of Calcium Phosphate Crystallization in the Presence of Amino Acids. Chem. Sustain. Dev. 2010, 1, 69–76. [Google Scholar]
  20. Koutsopoulos, S.; Dalas, E. Inhibition of Hydroxyapatite Formation in Aqueous Solutions by Amino Acids with Hydrophobic Side Groups. Langmuir 2000, 16, 6739–6744. [Google Scholar] [CrossRef]
  21. Koutsopoulos, S.; Dalas, E. Hydroxyapatite Crystallization in the Presence of Serine, Tyrosine and Hydroxyproline Amino Acids with Polar Side Groups. J. Cryst. Growth 2000, 216, 443–449. [Google Scholar] [CrossRef]
  22. Spanos, N.; Klepetsanis, P.G.; Koutsoukos, P.G. Model Studies on the Interaction of Amino Acids with Biominerals: The Effect of L-Serine at the Hydroxyapatite–Water Interface. J. Colloid Interface Sci. 2001, 236, 260–265. [Google Scholar] [CrossRef] [PubMed]
  23. Koutsopoulos, S.; Dalas, E. Hydroxyapatite Crystallization in the Presence of Amino Acids with Uncharged Polar Side Groups: Glycine, Cysteine, Cystine, and Glutamine. Langmuir 2001, 17, 1074–1079. [Google Scholar] [CrossRef]
  24. Koutsopoulos, S.; Dalas, E. The Effect of Acidic Amino Acids on Hydroxyapatite Crystallization. J. Cryst. Growth 2000, 217, 410–415. [Google Scholar] [CrossRef]
  25. Koutsopoulos, S.; Dalas, E. The Crystallization of Hydroxyapatite in the Presence of Lysine. J. Colloid Interface Sci. 2000, 231, 207–212. [Google Scholar] [CrossRef] [PubMed]
  26. Jahromi, M.T.; Yao, G.; Cerruti, M. The Importance of Amino Acid Interactions in the Crystallization of Hydroxyapatite. J. R. Soc. Interface 2012, 10, 20120906. [Google Scholar] [CrossRef]
  27. Yang, X.; Xie, B.; Wang, L.; Qin, Y.; Henneman, Z.J.; Nancollas, G.H. Influence of Magnesium Ions and Amino Acids on the Nucleation and Growth of Hydroxyapatite. CrystEngComm 2011, 13, 1153–1158. [Google Scholar] [CrossRef]
  28. Tsai, T.W.T.; Chen, W.-Y.; Tseng, Y.-H.; Chan, J.C.C. Phase Transformation of Calcium Phosphates in the Presence of Glutamic Acid. Can. J. Chem. 2011, 89, 885–891. [Google Scholar] [CrossRef]
  29. Ikawa, N.; Kimura, T.; Oumi, Y.; Sano, T. Amino Acid Containing Amorphous Calcium Phosphates and the Rapid Transformation into Apatite. J. Mater. Chem. 2009, 19, 4906. [Google Scholar] [CrossRef]
  30. Shimbayashi, S.; Tanizawa, Y. Formation of Hydroxyapatite in the Presence of Phosphorylated Polyvinylalcohol as a Simplified Compound for Mineralization Regulator Phosphoproteins. Chem. Pharm. Bull. 1990, 38, 1810. [Google Scholar] [CrossRef] [Green Version]
  31. Jack, K.S.; Vizcarra, T.G.; Trau, M. Characterization and Surface Properties of Amino-Acid-Modified Carbonate-Containing Hydroxyapatite Particles. Langmuir 2007, 23, 12233–12242. [Google Scholar] [CrossRef]
  32. Palazzo, B.; Walsh, D.; Iafisco, M.; Foresti, E.; Bertinetti, L.; Martra, G.; Bianchi, C.L.; Cappelletti, G.; Roveri, N. Amino Acid Synergetic Effect on Structure, Morphology and Surface Properties of Biomimetic Apatite Nanocrystals. Acta Biomater. 2009, 5, 1241–1252. [Google Scholar] [CrossRef]
  33. Bar-Yosef Ofir, P.; Govrin-Lippman, R.; Garti, N.; Füredi-Milhofer, H. The Influence of Polyelectrolytes on the Formation and Phase Transformation of Amorphous Calcium Phosphate. Cryst. Growth Des. 2004, 4, 177–183. [Google Scholar] [CrossRef]
  34. Venkateswarlu, K.; Chandra Bose, A.; Rameshbabu, N. X-Ray Peak Broadening Studies of Nanocrystalline Hydroxyapatite by Williamson–Hall Analysis. Phys. B Condens. Matter 2010, 405, 4256–4261. [Google Scholar] [CrossRef]
  35. Majer, M.; Roguljić, M.; Knežević, Ž.; Starodumov, A.; Ferenček, D.; Brigljević, V.; Mihaljević, B. Dose Mapping of the Panoramic 60Co Gamma Irradiation Facility at the Ruđer Bošković Institute–Geant4 Simulation and Measurements. Appl. Radiat. Isot. 2019, 154, 108824. [Google Scholar] [CrossRef]
  36. Stoll, S.; Schweiger, A. EasySpin, a Comprehensive Software Package for Spectral Simulation and Analysis in EPR. J. Magn. Reson. 2006, 178, 42–55. [Google Scholar] [CrossRef] [PubMed]
  37. Brečević, L.; Füredi-Milhofer, H. Precipitation of Calcium Phosphates from Electrolyte Solutions: II. The Formation and Transformation of the Precipitates. Calcif. Tissue Res. 1972, 10, 82–90. [Google Scholar] [CrossRef] [PubMed]
  38. Despotović, R.; Filipović-Vinceković, N.; Füredi-Milhofer, H. Precipitation of Calcium Phosphates from Electrolyte Solutions. Calcif. Tissue Res. 1975, 18, 13–26. [Google Scholar] [CrossRef] [PubMed]
  39. Eans, E.D.; Gillessen, I.H.; Posner, A.S. Intermediate States in the Precipitation of Hydroxyapatite. Nature 1965, 208, 365–367. [Google Scholar] [CrossRef] [PubMed]
  40. Brečević, L.; Hlady, V.; Füredi-Milhofer, H. Influence of Gelatin on the Precipitation of Amorphous Calcium Phosphate. Colloids Surf. 1987, 28, 301–313. [Google Scholar] [CrossRef]
  41. Beniash, E.; Metzler, R.A.; Lam, R.S.K.; Gilbert, P.U.P.A. Transient Amorphous Calcium Phosphate in Forming Enamel. J. Struct. Biol. 2009, 166, 133–143. [Google Scholar] [CrossRef] [PubMed] [Green Version]
  42. Mahamid, J.; Sharir, A.; Addadi, L.; Weiner, S. Amorphous Calcium Phosphate Is a Major Component of the Forming Fin Bones of Zebrafish: Indications for an Amorphous Precursor Phase. Proc. Natl. Acad. Sci. USA 2008, 105, 12748–12753. [Google Scholar] [CrossRef] [Green Version]
  43. Selmani, A.; Coha, I.; Magdić, K.; Čolović, B.; Jokanović, V.; Šegota, S.; Gajović, S.; Gajović, A.; Jurašin, D.; Dutour Sikirić, M. Multiscale Study of the Influence of Cationic Surfactants on Amorphous Calcium Phosphate Precipitation. CrystEngComm 2015, 17, 8529–8548. [Google Scholar] [CrossRef] [Green Version]
  44. Ding, H.; Pan, H.; Xu, X.; Tang, R. Toward a Detailed Understanding of Magnesium Ions on Hydroxyapatite Crystallization Inhibition. Cryst. Growth Des. 2014, 14, 763–769. [Google Scholar] [CrossRef]
  45. Wang, C.-G.; Liao, J.-W.; Gou, B.-D.; Huang, J.; Tang, R.-K.; Tao, J.-H.; Zhang, T.-L.; Wang, K. Crystallization at Multiple Sites inside Particles of Amorphous Calcium Phosphate. Cryst. Growth Des. 2009, 9, 2620–2626. [Google Scholar] [CrossRef]
  46. Li, S.; Wang, L. Phosphorylated Osteopontin Peptides Inhibit Crystallization by Resisting the Aggregation of Calcium Phosphate Nanoparticles. CrystEngComm 2012, 14, 8037. [Google Scholar] [CrossRef]
  47. Čadež, V.; Erceg, I.; Selmani, A.; Domazet Jurašin, D.; Šegota, S.; Lyons, D.; Kralj, D.; Sikirić, M. Amorphous Calcium Phosphate Formation and Aggregation Process Revealed by Light Scattering Techniques. Crystals 2018, 8, 254. [Google Scholar] [CrossRef] [Green Version]
  48. Christoffersen, J.; Christoffersen, M.R.; Kibalczyc, W.; Andersen, F.A. A Contribution to the Understanding of the Formation of Calcium Phosphates. J. Cryst. Growth 1989, 94, 767–777. [Google Scholar] [CrossRef]
  49. Habraken, W.J.E.M.; Tao, J.; Brylka, L.J.; Friedrich, H.; Bertinetti, L.; Schenk, A.S.; Verch, A.; Dmitrovic, V.; Bomans, P.H.H.; Frederik, P.M.; et al. Ion-Association Complexes Unite Classical and Non-Classical Theories for the Biomimetic Nucleation of Calcium Phosphate. Nat. Commun. 2013, 4, 1507. [Google Scholar] [CrossRef] [PubMed] [Green Version]
  50. Stepić, R.; Jurković, L.; Klementyeva, K.; Ukrainczyk, M.; Gredičak, M.; Smith, D.M.; Kralj, D.; Smith, A.-S. Adsorption of Aspartate Derivatives to Calcite Surfaces in Aqueous Environment. Cryst. Growth Des. 2020, 20, 2853–2859. [Google Scholar] [CrossRef]
  51. Štajner, L.; Kontrec, J.; Njegić Džakula, B.; Maltar-Strmečki, N.; Plodinec, M.; Lyons, D.M.; Kralj, D. The Effect of Different Amino Acids on Spontaneous Precipitation of Calcium Carbonate Polymorphs. J. Cryst. Growth 2018, 486, 71–81. [Google Scholar] [CrossRef] [Green Version]
  52. Mihelj Josipović, T.; Kovačević, M.; Mateša, S.; Kostešić, M.; Matijaković, N.; Radatović, B.; Lyons, D.M.; Kralj, D.; Dutour Sikirić, M. The Influence of Different Classes of Amino Acids on Calcium Phosphates Seeded Growth. Materials 2020, 13, 4798. [Google Scholar] [CrossRef] [PubMed]
  53. Dorozhkin, S.V. Amorphous Calcium (Ortho)Phosphates. Acta Biomater. 2010, 6, 4457–4475. [Google Scholar] [CrossRef]
  54. Buljan Meić, I.; Kontrec, J.; Domazet Jurašin, D.; Selmani, A.; Njegić Džakula, B.; Maltar-Strmečki, N.; Lyons, D.M.; Plodinec, M.; Čeh, M.; Gajović, A.; et al. How Similar Are Amorphous Calcium Carbonate and Calcium Phosphate? A Comparative Study of Amorphous Phase Formation Conditions. CrystEngComm 2018, 20, 35–50. [Google Scholar] [CrossRef]
  55. Koutsopoulos, S. Synthesis and Characterization of Hydroxyapatite Crystals: A Review Study on the Analytical Methods. J. Biomed. Mater. Res. 2002, 62, 600–612. [Google Scholar] [CrossRef] [PubMed]
  56. Mochales, C.; Wilson, R.M.; Dowker, S.E.P.; Ginebra, M.-P. Dry Mechanosynthesis of Nanocrystalline Calcium Deficient Hydroxyapatite: Structural Characterisation. J. Alloy. Compd. 2011, 509, 7389–7394. [Google Scholar] [CrossRef]
  57. Combes, C.; Rey, C. Amorphous Calcium Phosphates: Synthesis, Properties and Uses in Biomaterials. Acta Biomater. 2010, 6, 3362–3378. [Google Scholar] [CrossRef] [PubMed] [Green Version]
  58. Liou, S.-C.; Chen, S.-Y.; Lee, H.-Y.; Bow, J.-S. Structural Characterization of Nano-Sized Calcium Deficient Apatite Powders. Biomaterials 2004, 25, 189–196. [Google Scholar] [CrossRef]
  59. Matsumoto, T.; Okazaki, M.; Inoue, M.; Hamada, Y.; Taira, M.; Takahashi, J. Crystallinity and Solubility Characteristics of Hydroxyapatite Adsorbed Amino Acid. Biomaterials 2002, 23, 2241–2247. [Google Scholar] [CrossRef]
  60. Schramm, D.U.; Rossi, A.M. Electron Spin Resonance (ESR) Studies of CO2 Radicals in Irradiated A and B-Type Carbonate-Containing Apatites. Appl. Radiat. Isot. 2000, 52, 1085–1091. [Google Scholar] [CrossRef]
  61. Cevc, P.; Schara, M.; Ravnik, Č.; Ravnik, C. Electron Paramagnetic Resonance Study of Irradiated Tooth Enamel. Radiat. Res. 1972, 51, 581. [Google Scholar] [CrossRef]
  62. Callens, F.J.; Verbeeck, R.M.H.; Matthys, P.F.A.; Martens, L.C.; Boesman, E.R. The Contribution of CO3 3− and CO2 to the ESR Spectrum near G=2 of Powdered Human Tooth Enamel. Calcif. Tissue Int. 1987, 41, 124–129. [Google Scholar] [CrossRef]
  63. Callens, F.J.; Verbeeck, R.M.H.; Naessens, D.E.; Matthys, P.F.A.; Boesman, E.R. The Effect of Carbonate Content and Drying Temperature on the ESR-Spectrum near G=2 of Carbonated Calciumapatites Synthesized from Aqueous Media. Calcif. Tissue Int. 1991, 48, 249–259. [Google Scholar] [CrossRef]
  64. Callens, F.J.; Verbeeck, R.M.H.; Matthys, P.F.A.; Martens, L.C.; Boesman, E.R.; Driessens, F.C.M. The ESR Spectrum Near G=2 of Carbonated Calciumapatites Synthesized at High Temperature. Bull. Soc. Chim. Belg. 2010, 95, 589–596. [Google Scholar] [CrossRef]
  65. Ikeya, M. New Applications of Electron Spin Resonance: Dating, Dosimetry and Microscopy; WORLD SCIENTIFIC: Singapore, 1993; ISBN 978-981-02-1199-8. [Google Scholar]
  66. Sadlo, J.; Strzelczak, G.; Lewandowska-Szumiel, M.; Sterniczuk, M.; Pajchel, L.; Michalik, J. Carbon-Centered Radicals in γ-Irradiated Bone Substituting Biomaterials Based on Hydroxyapatite. J. Mater. Sci. Mater. Med. 2012, 23, 2061–2068. [Google Scholar] [CrossRef]
  67. Strzelczak, G.; Sadło, J.; Danilczuk, M.; Stachowicz, W.; Callens, F.; Vanhaelewyn, G.; Goovaerts, E.; Michalik, J. Multifrequency Electron Paramagnetic Resonance Study on Deproteinized Human Bone. Spectrochim. Acta Part A Mol. Biomol. Spectrosc. 2007, 67, 1206–1209. [Google Scholar] [CrossRef]
  68. Biktagirov, T.; Gafurov, M.; Mamin, G.; Klimashina, E.; Putlayev, V.; Orlinskii, S. Combination of EPR Measurements and DFT Calculations To Study Nitrate Impurities in the Carbonated Nanohydroxyapatite. J. Phys. Chem. A 2014, 118, 1519–1526. [Google Scholar] [CrossRef]
  69. Eiden-Aßmann, S.; Viertelhaus, M.; Heiß, A.; Hoetzer, K.A.; Felsche, J. The Influence of Amino Acids on the Biomineralization of Hydroxyapatite in Gelatin. J. Inorg. Biochem. 2002, 91, 481–486. [Google Scholar] [CrossRef]
Figure 1. Representative pH vs. time curves obtained in the control system and systems containing amino acids: (a) aspartic acid (Asp), (b) lysine (Lys), (c) asparagine (Asn), (d) serine (Ser) and (e) phenylalanine (Phe). c(CaCl2·2H2O) = c(Na2HPO4) = 5 mmol dm−3, c(NaCl) = 0.15 mol dm−3, pHinitial = 7.4, ϑ = (25.0 ± 0.1) °C, magnetic stirring.
Crystals 11 00792 g001
Figure 2. PXRD diffractograms (a,c) and FTIR spectra (b,d) of the precipitates obtained in the control system (CS) and systems containing 5 mmol dm−3 AAs after (a,b) 10 min and (c,d) 60 min reaction time (60 and 150 min in the case of Ser). c(CaCl2·2H2O) = c(Na2HPO4) = 5 mmol dm−3, c(NaCl) = 0.15 mol dm−3, pHinitial = 7.4, ϑ = (25.0 ± 0.1) °C, magnetic stirring. Asp—aspartic acid, Lys—lysine, Asn—asparagine, Ser—serine, Phe—phenylalanine.
Crystals 11 00792 g002
Figure 3. TEM micrographs of the precipitates formed after 10 min reaction time (60 min in case of Ser) in (a) control system and in the presence of 5 mmol dm−3 (b) aspartic acid (Asp), (c) lysine (Lys), (d) asparagine (Asn) (e) serine (Ser) and (f) phenylalanine (Phe). c(CaCl2·2H2O) = c(Na2HPO4) = 5 mmol dm−3, c(NaCl) = 0.15 mol dm−3, c(AA) 5 mmol dm−3, pHinitial = 7.4, ϑ = (25.0 ± 0.1) °C, magnetic stirring.
Crystals 11 00792 g003
Figure 4. Experimental and simulated EPR spectra of the precipitates formed after 60 min reaction time (150 min in the case of Ser) in (a) control system and in the presence of 5 mmol dm−3 (b) aspartic acid (Asp), (c) lysine (Lys), (d) asparagine (Asn), (e) serine (Ser) and (f) phenylalanine (Phe). c(CaCl2·2H2O) = c(Na2HPO4) = 5 mmol dm−3, c(NaCl) = 0.15 mol dm−3, c(AAs) 5 mmol dm−3, pHinitial = 7.4, ϑ = (25.0 ± 0.1) °C, magnetic stirring.
Crystals 11 00792 g004
Figure 5. SEM micrographs of the precipitates formed after 60 min reaction time (150 min in the case of Ser) in (a) control system and in the presence of 5 mmol dm−3 (b) aspartic acid (Asp), (c) lysine (Lys), (d) asparagine (Asn) (e) serine (Ser) and (f) phenylalanine (Phe). c(CaCl2·2H2O) = c(Na2HPO4) = 5 mmol dm−3, c(NaCl) = 0.15 mol dm−3, c(AAs) 5 mmol dm−3, pHinitial = 7.4, ϑ = (25.0 ± 0.1) °C, magnetic stirring.
Crystals 11 00792 g005
Table 1. Average induction times (ti) and corresponding standard deviations obtained from pH vs. time curves from 3 measurements in the control system (CS) and systems containing amino acids. c(CaCl2·2H2O) = c(Na2HPO4) = 5 mmol dm−3, c(NaCl) = 0.15 mol dm−3, pHinitial = 7.4, ϑ = (25.0 ± 0.1) °C, magnetic stirring. Asp—aspartic acid, Lys—lysine, Asn—asparagine, Ser—serine, Phe—phenylalanine.
 (ti ± SD)/min
c(AA)/mmol dm−3AspLysAsnSerPhe
0 (CS)18.2 ± 0.5
1.021.4 ± 1.517.4 ± 1.121.5 ± 0.720.3 ± 1.018.8 ± 1.1
2.516.4 ± 0.519.7 ± 0.322.2 ± 0.218.8 ± 1.620.8 ± 0.5
5.023.1 ± 0.219.3 ± 0.116.7 ± 0.9113.7 ± 6.315.9 ± 0.1
Table 2. Size of crystalline domains along the [002] direction of CaDHA formed after 60 min reaction time (150 min in the case of Ser) in the control system (CS) and in the presence of 5 mmol dm−3 aspartic acid (Asp), asparagine (Asn), serine (Ser), lysine (Lys), and phenylalanine (Phe). c(CaCl2·2H2O) = c(Na2HPO4) = 5 mmol dm−3, c(NaCl) = 0.15 mol dm−3, c(AAs) 5 mmol dm−3, pHinitial = 7.4, ϑ = (25.0 ± 0.1) °C, magnetic stirring.
D002/nm
CS17.40
Asp14.10
Lys17.50
Asn17.50
Ser16.10
Phe19.60
Table 3. R-values of the powdered irradiated precipitates formed after 60 min reaction time (150 min in case of Ser) in control system (CS) and in the presence of 5 mmol dm−3 aspartic acid (Asp), lysine (Lys), asparagine (Asn), serine (Ser) and phenylalanine (Phe). c(CaCl2·2H2O) = c(Na2HPO4) = 5 mmol dm−3, c(NaCl) = 0.15 mol dm−3, c(AAs) 5 mmol dm−3, pHinitial = 7.4, ϑ = (25.0 ± 0.1) °C, magnetic stirring.
R-Value
CS0.5505
Asp0.8535
Lys0.5821
Asn0.5714
Ser0.6487
Phe0.5477
Table 4. Radical species identified in the EPR spectra of samples with extracted EPR parameters and weight based on spectra simulation. Asp—aspartic acid, Lys—lysine, Asn—asparagine, Ser—serine, Phe—phenylalanine.
SampleCSAspLysAsnSerPhe
Species
orth. C O 2
gx=2.0022
gy=1.9973
gz=2.0034
53.46%44.63%35.11%13.82%70.64%75.51%
orth. C O 2
gx=2.0034
gy=1.9973
gz=2.0017
--28.50%9.79%-21.40%--
iso. C O 2
go=2.0008
------2.48%--11.35%
axial C O 3 3  
gx=2.0039
gy=2.0039
gz=2.0014
----55.10%45.52%----
axial C O 3 3
gx=2.0044
gy=2.0044
gz=2.0020
46.54%26.87%--38.18%7.96%13.14%
Publisher’s Note: MDPI stays neutral with regard to jurisdictional claims in published maps and institutional affiliations.

