Article

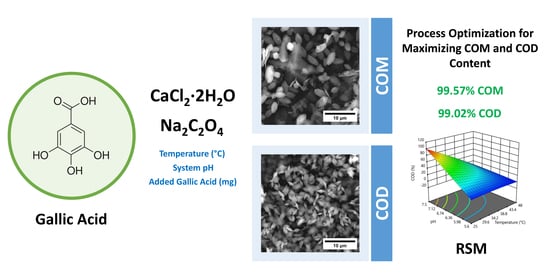
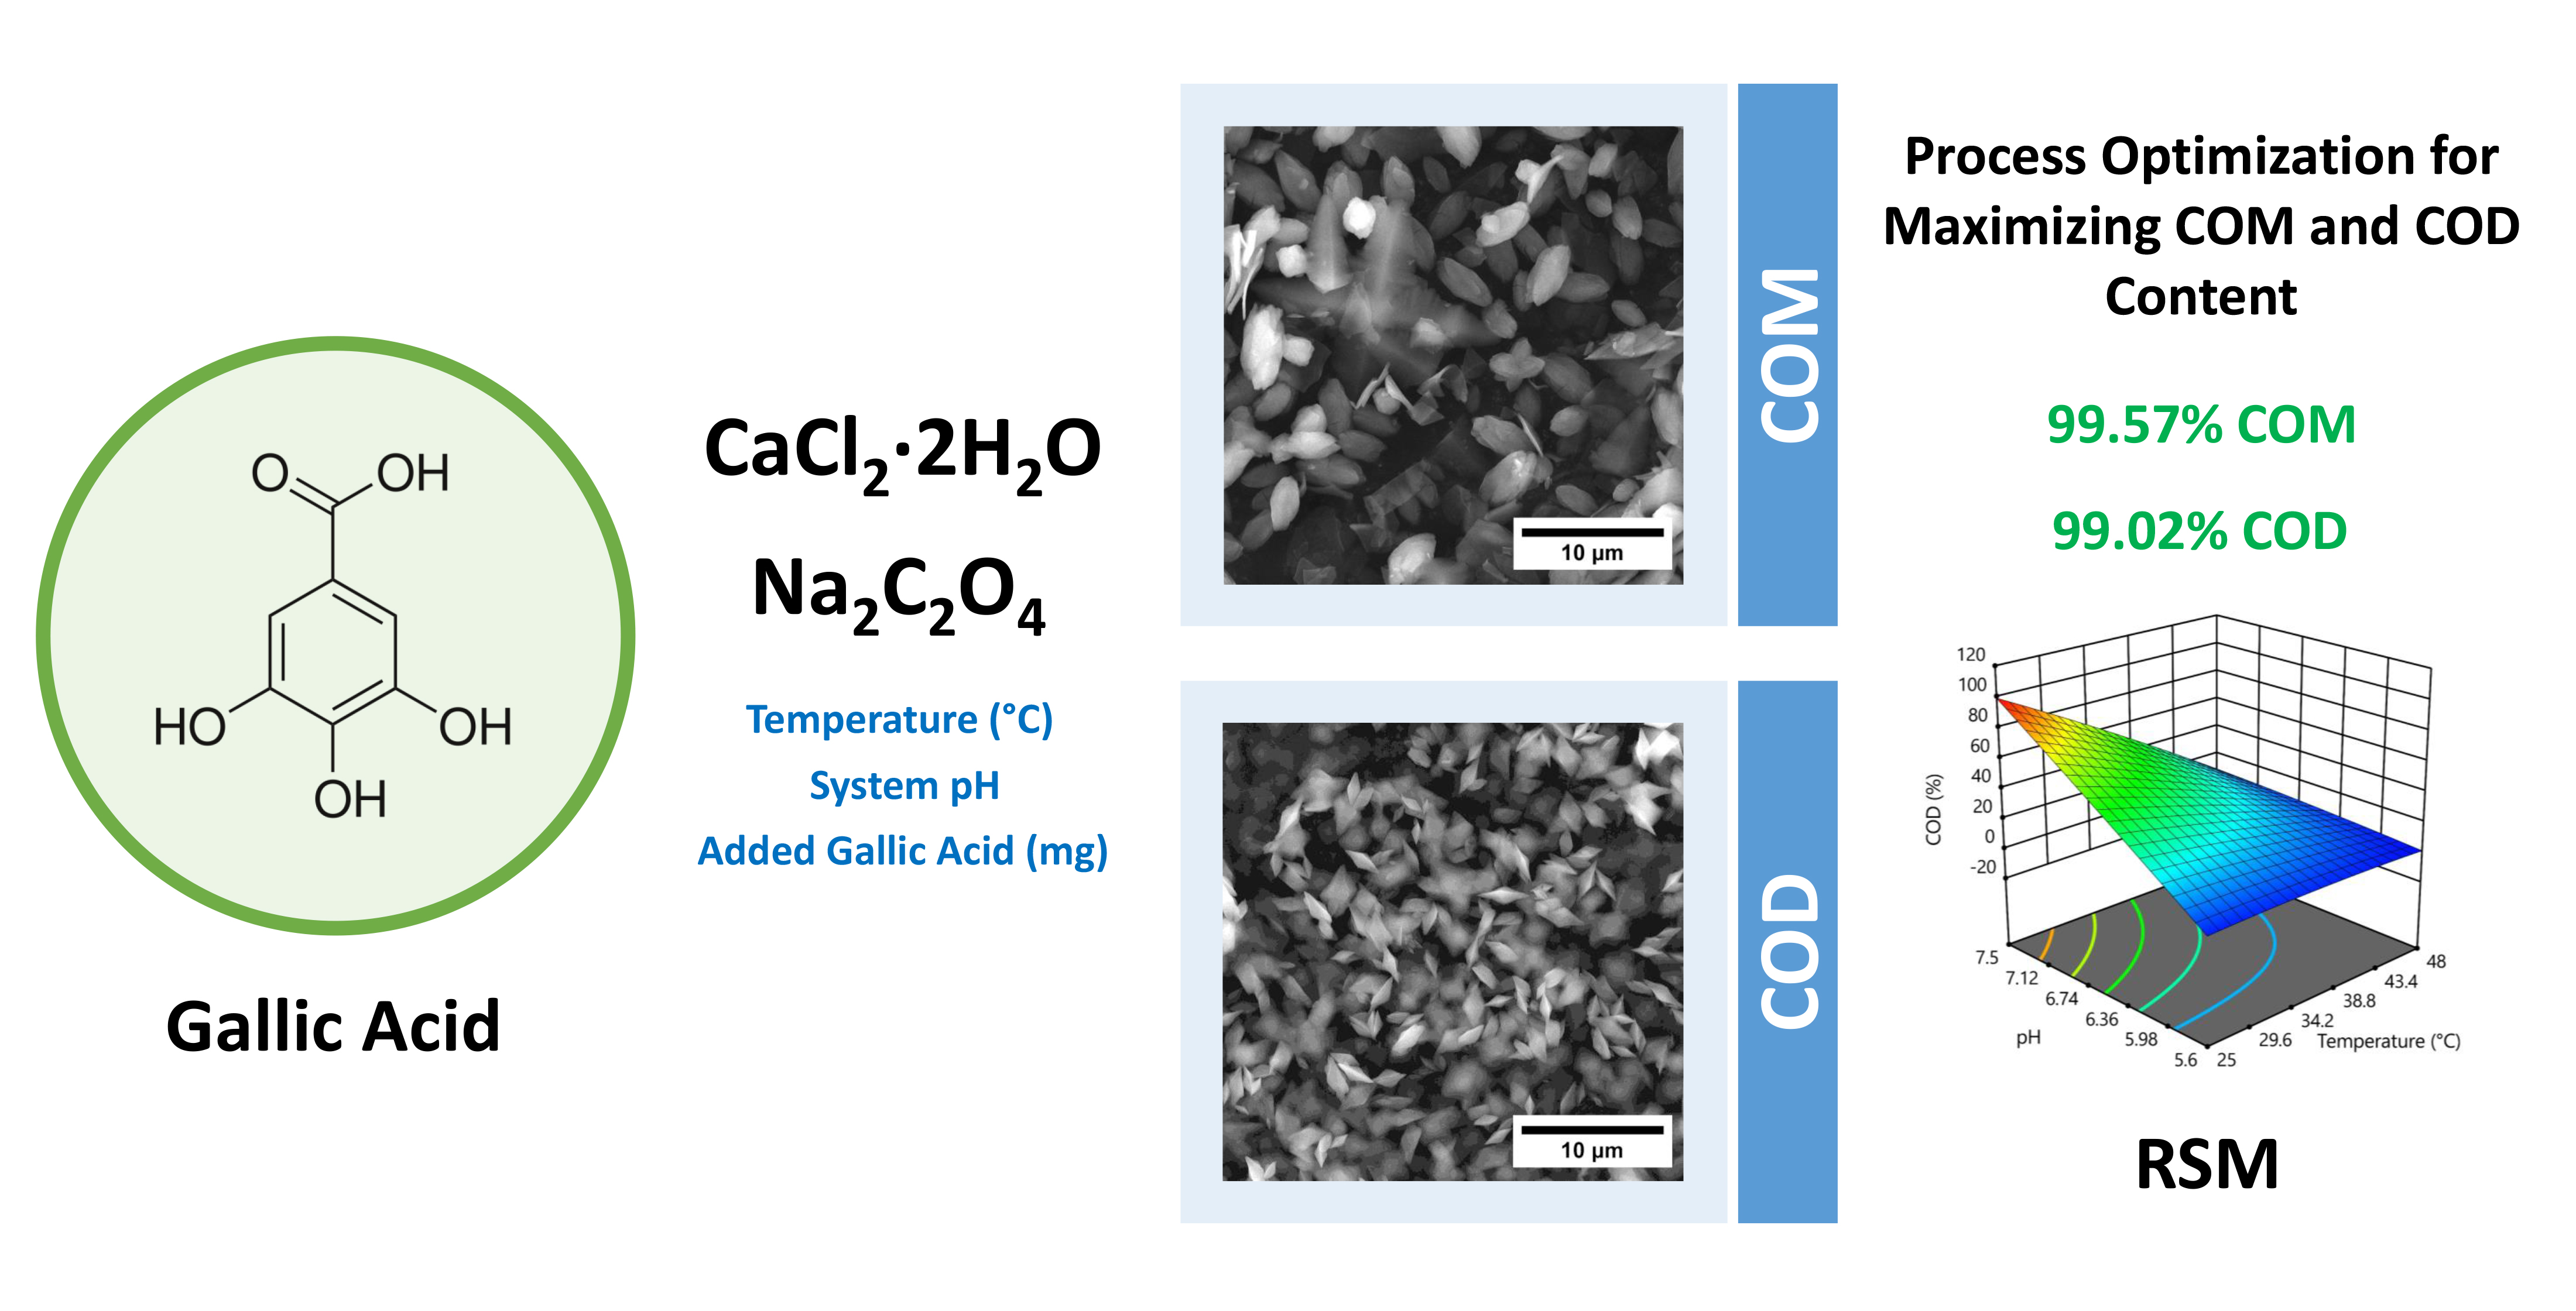
Calcium Oxalate and Gallic Acid: Structural Characterization and Process Optimization toward Obtaining High Contents of Calcium Oxalate Monohydrate and Dihydrate

by
Silvija Šafranko
1,
Sara Goman
2,
Dominik Goman
2,
Stela Jokić
1,
Ida Delač Marion
3,
Nives Matijaković Mlinarić
4,
Atiđa Selmani
5,
Martina Medvidović-Kosanović
2,* and
Anamarija Stanković
2,*
1
Faculty of Food Technology Osijek, Josip Juraj Strossmayer University of Osijek, Franje Kuhača 18, 31000 Osijek, Croatia
2
Department of Chemistry, Josip Juraj Strossmayer University of Osijek, Cara Hadrijana 8/A, 31000 Osijek, Croatia
3
Center of Excellence for Advanced Materials and Sensing Devices, Institute of Physics, Bijenička Cesta 46,10000 Zagreb, Croatia
4
Laboratory for Precipitation Processes, Division of Materials Chemistry, Ruđer Bošković Institute, Bijenička Cesta 54, 10000 Zagreb, Croatia
5
Laboratory for Biocolloids and Surface Chemistry, Ruđer Bošković Institute, Bijenička Cesta 54, 10000 Zagreb, Croatia
*
Authors to whom correspondence should be addressed.
Crystals 2021, 11(8), 954; https://doi.org/10.3390/cryst11080954
Submission received: 30 July 2021 / Revised: 13 August 2021 / Accepted: 14 August 2021 / Published: 15 August 2021
(This article belongs to the Special Issue Green Approach in Synthesis of Bio-Inspired Materials)

Abstract

:
The search for an efficient drug or inhibitor in the formation process of kidney stones has been a promising research topic towards reducing the risks of the formation of disease. However, several challenges have been faced in investigating the most common constituents of kidney stones, calcium oxalate and its hydrate forms (COM, COD and COT). This study focuses on the preparation and structural characterization (TG, XRD, FTIR, SEM) of calcium oxalate hydrates in the presence of gallic acid (GA) and by varying operating parameters such as temperature (25 °C, 36.5 °C and 48 °C), pH (5.6, 6.5 and 7.5) and amount of added GA (ranging from 100 mg to 1000 mg). Response surface methodology was applied in order to evaluate the effects of operating parameters in the formation of COM and COD, and for the process optimization towards maximizing their content in samples. The results indicated that GA inhibited the formation of COM (0–100%) and promoted the formation of COD (0 ≤ 99%), while a medium pH and the amount of added GA showed a significant effect in the process of COD formation. In order to investigate the interactions established in the formation process and the possible adsorption between GA and the formed crystals, electrochemical measurements were performed.

Graphical Abstract

1. Introduction

More than 70% of kidney stone patients suffer from urolithiasis induced by calcium oxalate stone formation, with calcium oxalate dihydrate (COD) as the most dominant crystal phase in healthy human urine, and calcium oxalate monohydrate (COM) as the most common present phase in diseased humans. In the absence of an adequate medical treatment, nephrolithiasis will surely be a remittent disease, with a recurrence rate of 70–80% in men and 47–60% in women over the next few years [1,2]. Due to the increase in the number of patients in the last few decades, urolithiasis is one of the most frequent and significant health problems nowadays. The number of affected people varies depending on the geographical location, ranging from 3–14% of the total population [3].
This disease is manifested through the accumulation of crystals and kidney stones in which only one or both kidneys can be affected. In fact, it is a pathological biomineralization as a consequence of physicochemical mechanisms. Among other things, these mechanisms include processes such as nucleation, crystal growth and aggregation and, finally, the binding and retention of calculi in the kidneys [4]. There are multiple reasons for the formation of urinary stones. According to recent scientific research, the most prominent causes of urolithiasis are genetic predispositions and environmental factors [5]. Increasingly, inappropriate living standards, as well as unhealthy eating habits, are among the reasons why the percentage of people suffering from this disease is gradually increasing over time. It has also been confirmed that urine contains many minerals that tend to form stones, and increased crystal aggregation will depend on urinary parameters such as pH, ionic strength or the presence of a substance with an activating or inhibitory effect [3,6]. Within the composition of kidney stones, the most prominent compound is calcium oxalate, which is an increasingly common subject of study in laboratory and clinical trials, in order to better understand the reasons for its occurrence in urolithiasis and the inhibition of this mechanism [6]. Oxalate stones can be caused by inherited or subsequent metabolic disorders, such as hypercalciuria, hypocitraturia, hyperoxaluria and changes in urine acidity, which are also considered to be the most common factors in the formation of stones in the body [7].
There are three crystalline forms in which calcium oxalate occurs. Monohydrate (CaC2O4·H2O, COM), mostly with rectangular morphology, is the form that binds most easily to the epithelial cells of the renal tubules, and, therefore, COM is the most common form in the composition of kidney stones [8]. As such, it has a great tendency to bind to other urinary macromolecules, leading to aggregation and stone formation. The second form that occurs is dihydrate (CaC2O4·2H2O, COD) [9]. It is the most commonly found bipyramidal crystal morphology in the urine of healthy patients [10]. When trihydrate (CaC2O4·3H2O, COT) crystals are formed, they have a rod-shaped morphology, but they are rarely found in the urine of patients because it is considered that these crystals are very unstable and rapidly convert to other types of crystals [11]. The main strategy aimed at inhibiting the formation of kidney stones is based on directing the process of crystallization of calcium oxalate into forms of dihydrate or trihydrate. Dihydrates and trihydrates are less bound to urine macromolecules and, therefore, their excretion is possible by excreting urine from the body. This prevents the formation of larger kidney stones and the occurrence of all the discomfort they could cause [12]. Despite progress made in urolithiasis treatments [13,14], the problem has still to be solved, and the use of phototherapy and medicinal plants are to be considered as a valuable support [15,16,17,18] in providing some therapies against the formation process of kidney stones. Phenolic acids are an important and abundant subgroup of phenolic compounds with the basic chemical structure C6–C1 (Hydroxybenzoic acids), consisting of a phenolic ring and a carboxyl substituent. Gallic acid or 3,4,5-trihydroxybenzoic acid is one of the most abundant phenolic acids, which is widely distributed throughout the plant kingdom where it is present either in free form or, more commonly, as a constituent of tannins [19]. Regarding its biological activity, gallic acid exerts antibacterial, antiviral, anti-inflammatory and antioxidant effects [20,21]. The effect of gallic acid on the formation of kidney stones, and especially calcium oxalate, has not been fully investigated. Li et al. [22] revealed in their work that gallic acid can alter the nucleation pathways of calcium oxalate, which eventually leads to the formation of three different hydrate structures. The investigation of the influence of individual physiological parameters on calcium oxalate formation is especially welcomed as it could contribute to the elucidation of crystal growth and nucleation mechanisms in urolithiasis. Furthermore, studies carried out on the formation of the specific hydrate phase of calcium oxalate, especially on the COM and COD, could also offer a valuable contribution towards understanding the effects of additives, and hydrodynamic and thermodynamic parameters in antilithiatic action.
In this work, studies were conducted in which the focus was primarily placed on the influence of the process parameters such as temperature, system pH and the addition of gallic acid as an additive on the formation of different calcium oxalate hydrates. Based on the collected data and knowledge of the specific system under different conditions, the modes of action of individual parameters and their interactions on the changes of calcium oxalate composition and morphology were determined. The optimal conditions toward obtaining the maximum content of the two most dominant hydrate phases were determined using response surface methodology (RSM). The research also provided more understandable insights into the nucleation mechanism and incorporation of gallic acid under different process conditions to better understand the reasons for the formation of stones. An evaluation of crystal morphology and their chemical composition allows us to understand what type of crystal is formed and what influence the additive has on the size and morphology of these crystals.

2. Materials and Methods

2.1. Materials

Precipitation stock solutions were prepared from analytically pure (grade) chemicals, HCl (Gram-mol), NaOH (Gram-mol), Na2C2O4 (BDH Prolabo), CaCl2·2H2O (BDH Prolabo) and NaOCl (Kemika). Proper volume of Na2C2O4 and CaCl2 stock solutions, were diluted in ultrapure deionized water (conductivity < 0.055 mS cm−1) for reactant solutions preparation, respectively. Adjustment of pH value of the system was carried out by adding stock solution of NaOH or HCl. Using classical analytical methods, all stock solutions were standardized (CaCl2 by complexometric titration with EDTA, NaOH by volumetric titration with standard HCl, Na2C2O4 by titration with permanganate and HCl by volumetric titration with standard NaOH).

2.2. Precipitation Experiments

Synthesis of calcium oxalate seeds during spontaneous precipitation process was described in detail in previous papers [23,24,25]. In this report, slightly remodelled experimental protocol has been used with addition of gallic acid in reaction solution. The same concentrations of Ca2+ (ci = 7.5 × 10⁻³ mol dm−3) and C2O42− (ci = 4.0 × 10⁻³ mol dm−3) were adjusted in every reaction mixture. Besides, quantity of gallic acid varied from 100 mg to 1000 mg, pH value was in the range from 5.6 to 7.5 and the system was thermostated at three different temperatures: θ = 25 °C, 36.5 °C and 48 °C.
Double-walled glass, thermostated reactor was used for precipitation experiments. At first, calcium and oxalate solutions were adjusted to corresponding pH, after which solutions were thermostated at previously defined temperatures. The process started after rapidly mixing the equivalent volumes (V = 200 cm3) of reactant solutions. The synthesis of precipitate in reactor was monitored with combined glass electrode. During the precipitation process, data from electrode were presented on pH meter (HANNA HI 5522) in form of graph (pH vs. time). Suspensions were stirred with Teflon-coated magnetic stirring bar, continuously for 20 min. At the end of experiment, the content of the reactor was filtered through a 0.22 µm Millipore filter paper, after which precipitates were washed with small increments of pure water and dried in a vacuum desiccator. All precipitation reactions were repeated three times and the mean values are presented in results section.

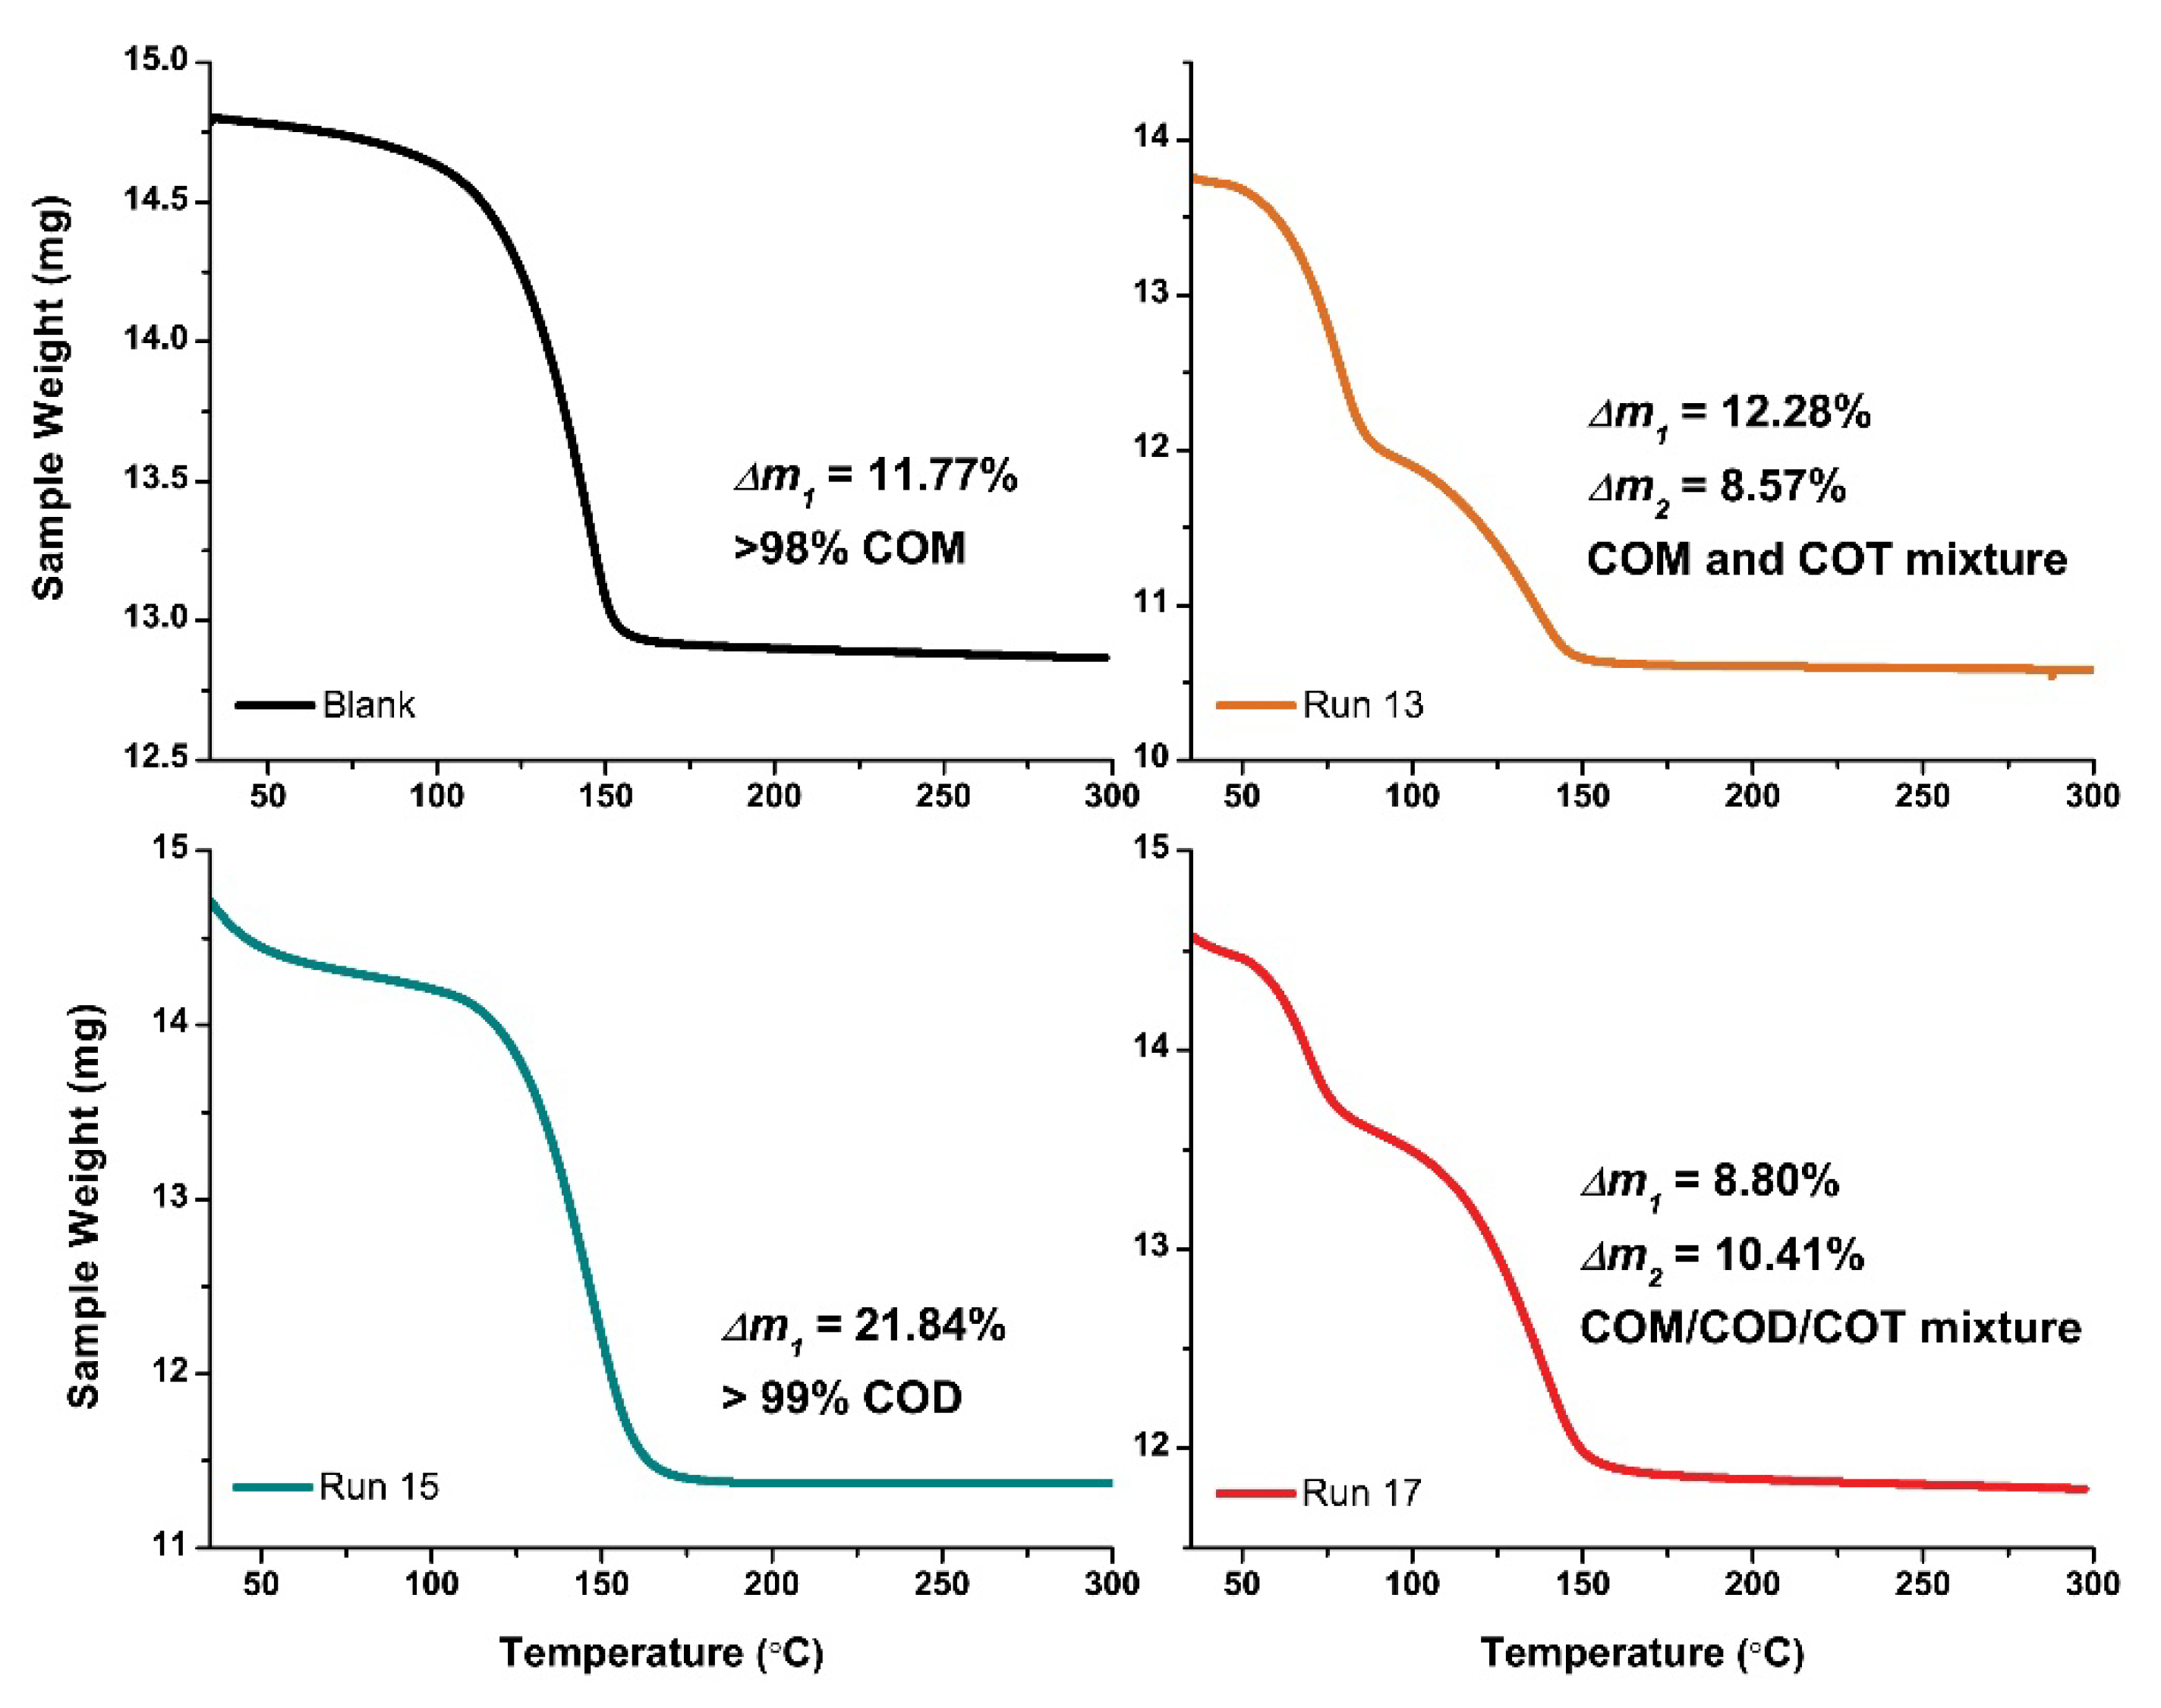
2.3. Sample Characterization of Calcium Oxalate Hydrate

In order to determine hydrate phase and mineralogical composition of calcium oxalate crystals, several analytical methods, such as powder X-ray diffraction (XRD), thermogravimetric analysis (TGA) and infrared spectroscopy (FTIR) were applied. Furthermore, for resolving the question as to whether gallic acid is adsorbed on seed surface or if it is captured between calcium oxalate clusters, cyclic voltammetry (CV) was employed.
For infrared spectroscopy, 1–2 mg of dried samples were mixed with KBr (IR grade) and recorded on FTIR 8400S spectrophotometer (Shimadzu, Kyoto, Japan) in spectral range from 400 cm−1 to 4000 cm−1. The recorded spectra are the average of 20 scans. The device was equipped with DRS 8000 attachment at a spectral resolution of 4 cm−1. Analysis of collected data was processed using software package IR solution 1.30.
Weights of (each) hydrate phase in dried samples were investigated by thermogravimetric analysis (TGA) using a simultaneous TGA–DSC analyser (Mettler Toledo TGA/DSC1, Greifensee, Switzerland). Up to 15 mg of samples were placed into aluminium pan (100 µL) and heated up to maximum 300 °C with a heating rate of 2 °C min−1 in the oxygen atmosphere. Collected data were analysed by means of STARe Software 10.0. package.
Powder X-ray diffraction (XRD) was performed in order to explore composition and crystallinity of precipitates. A small amount of samples were put on silicon zero-background sample holder and gently pressed to obtain a flat surface. The date were obtained with Bragg–Brentano geometry in the 2θ range 5°–60° and step size 0.02° on Aeris Panalytical diffractometer with Ni-filtered copper radiation (Aeris Research, Malvern Panalytical, Malvern, UK). The analyses of recorded diffractograms were performed by means of Panalytical High Score Plus Software.
Microscopy studying was conducted by a light microscope (Motic B1 (Barcelona, Spain) equipped with digital camera Moticam 2) and scanning electron microscope, SEM (Tescan Vega3 LMU (Fuveau, France) with tungsten filament at 10 mm working distance, 5–30 kV acceleration voltage). The main purpose was to determine approximate crystal size and morphological characteristics of calcium oxalate precipitates. Small amount of samples, for SEM imaging, were placed on sample holder with carbon tape. The excess powder was removed by nitrogen gas flow.
Electrochemical investigations were run on PalmSens potentiostat/galvanostat (PalmSens BV, Utrecht, The Netherland) joined with PSTrace 4.2 software. Measurements were carried out in voltametric cell (15 mL) in a phosphate buffer at three pH values (pH 5.8, 6.5 and 7.5) with a three-electrode setup made of Ag/AgCl (inner electrolyte solution, c (NaCl) = 3 mol dm−3) as a reference electrode, platinum wire as a counter electrode and glassy carbon electrode as a working electrode (geometrical area 0.018 cm2). Inert atmosphere in electrochemical cell was achieved with (1 min) flow of high purity argon (ϕAr = 99.999%) before each experiment. For study of interactions between gallic acid and calcium oxalate precipitates formed in calcium oxalate system with addition of gallic acid, 5 mg of seed sample was diluted in phosphate buffer (pH 5.8, 6.5 and 7.5) and cyclic voltammograms were recorded. Cyclic voltammetry scan rate was set at 100 mV s−1.
In order to remove the adsorbed gallic acid from surface of precipitates, the samples were treated with 13% w/v sodium hypochlorite solution. Overall, 15 mg of samples were put in beaker with 10 mL of sodium hypochlorite. After 24 h, suspensions were continuously stirred for 1 h with Teflon-coated magnetic stirring bar and stored for next 24 h. Finally, after 48 h, suspensions were centrifuged on 5037 RCF (relative centrifugal force) for 5 min in automatic centrifuge (Hettich, Rotina 380R), and obtained precipitates were also washed with ultrapure water three times. Dried precipitates were dissolved in 200 µL of concentrated HCl and were analysed by means of cyclic voltammetry.

2.4. Response Surface Methodology and Process Optimization in Calcium Oxalate Formation

Response surface methodology (RSM) and experimental data generated by Box–Behnken design were used in order to derive optimal process parameters for obtaining maximum content of individual hydrate phase of calcium oxalate (COM and COD). By using commercial software Design-Expert® (ver. 9, Stat-Ease Inc., Minneapolis, MN, USA), statistical analysis was performed, while the quality of fitted mathematical models was assessed by the analysis of variance (ANOVA). The obtained models were employed to investigate the influence of each individual parameter (independent variables or inputs) or their interactions, such as temperature (X1), system pH (X2), and amount of added gallic acid (X3), on the precipitation of calcium oxalate. Both obtained models for COM and COD investigation were fitted with a second order (quadratic) response model without applying any transformations, and the models are described by the following Equation (1)
y = β 0 + i = 1 k β i X i + i = 1 k β i i X i 2 + i = 1 i < j k 1 j = 2 k β i j X i X j
where y designates investigated responses (content of COM and COD), β0, βi, βii, βij parameters represent constant coefficients of intercept, linear, quadratic and interaction terms, respectively, while Xi and Xj coefficients represent (−1, 0, +1) inputs or independent variables (Table 1). Therefore, process optimization and model evaluation were performed towards maximizing the content of individual COM and COD in the prepared samples.

3. Results and Discussion

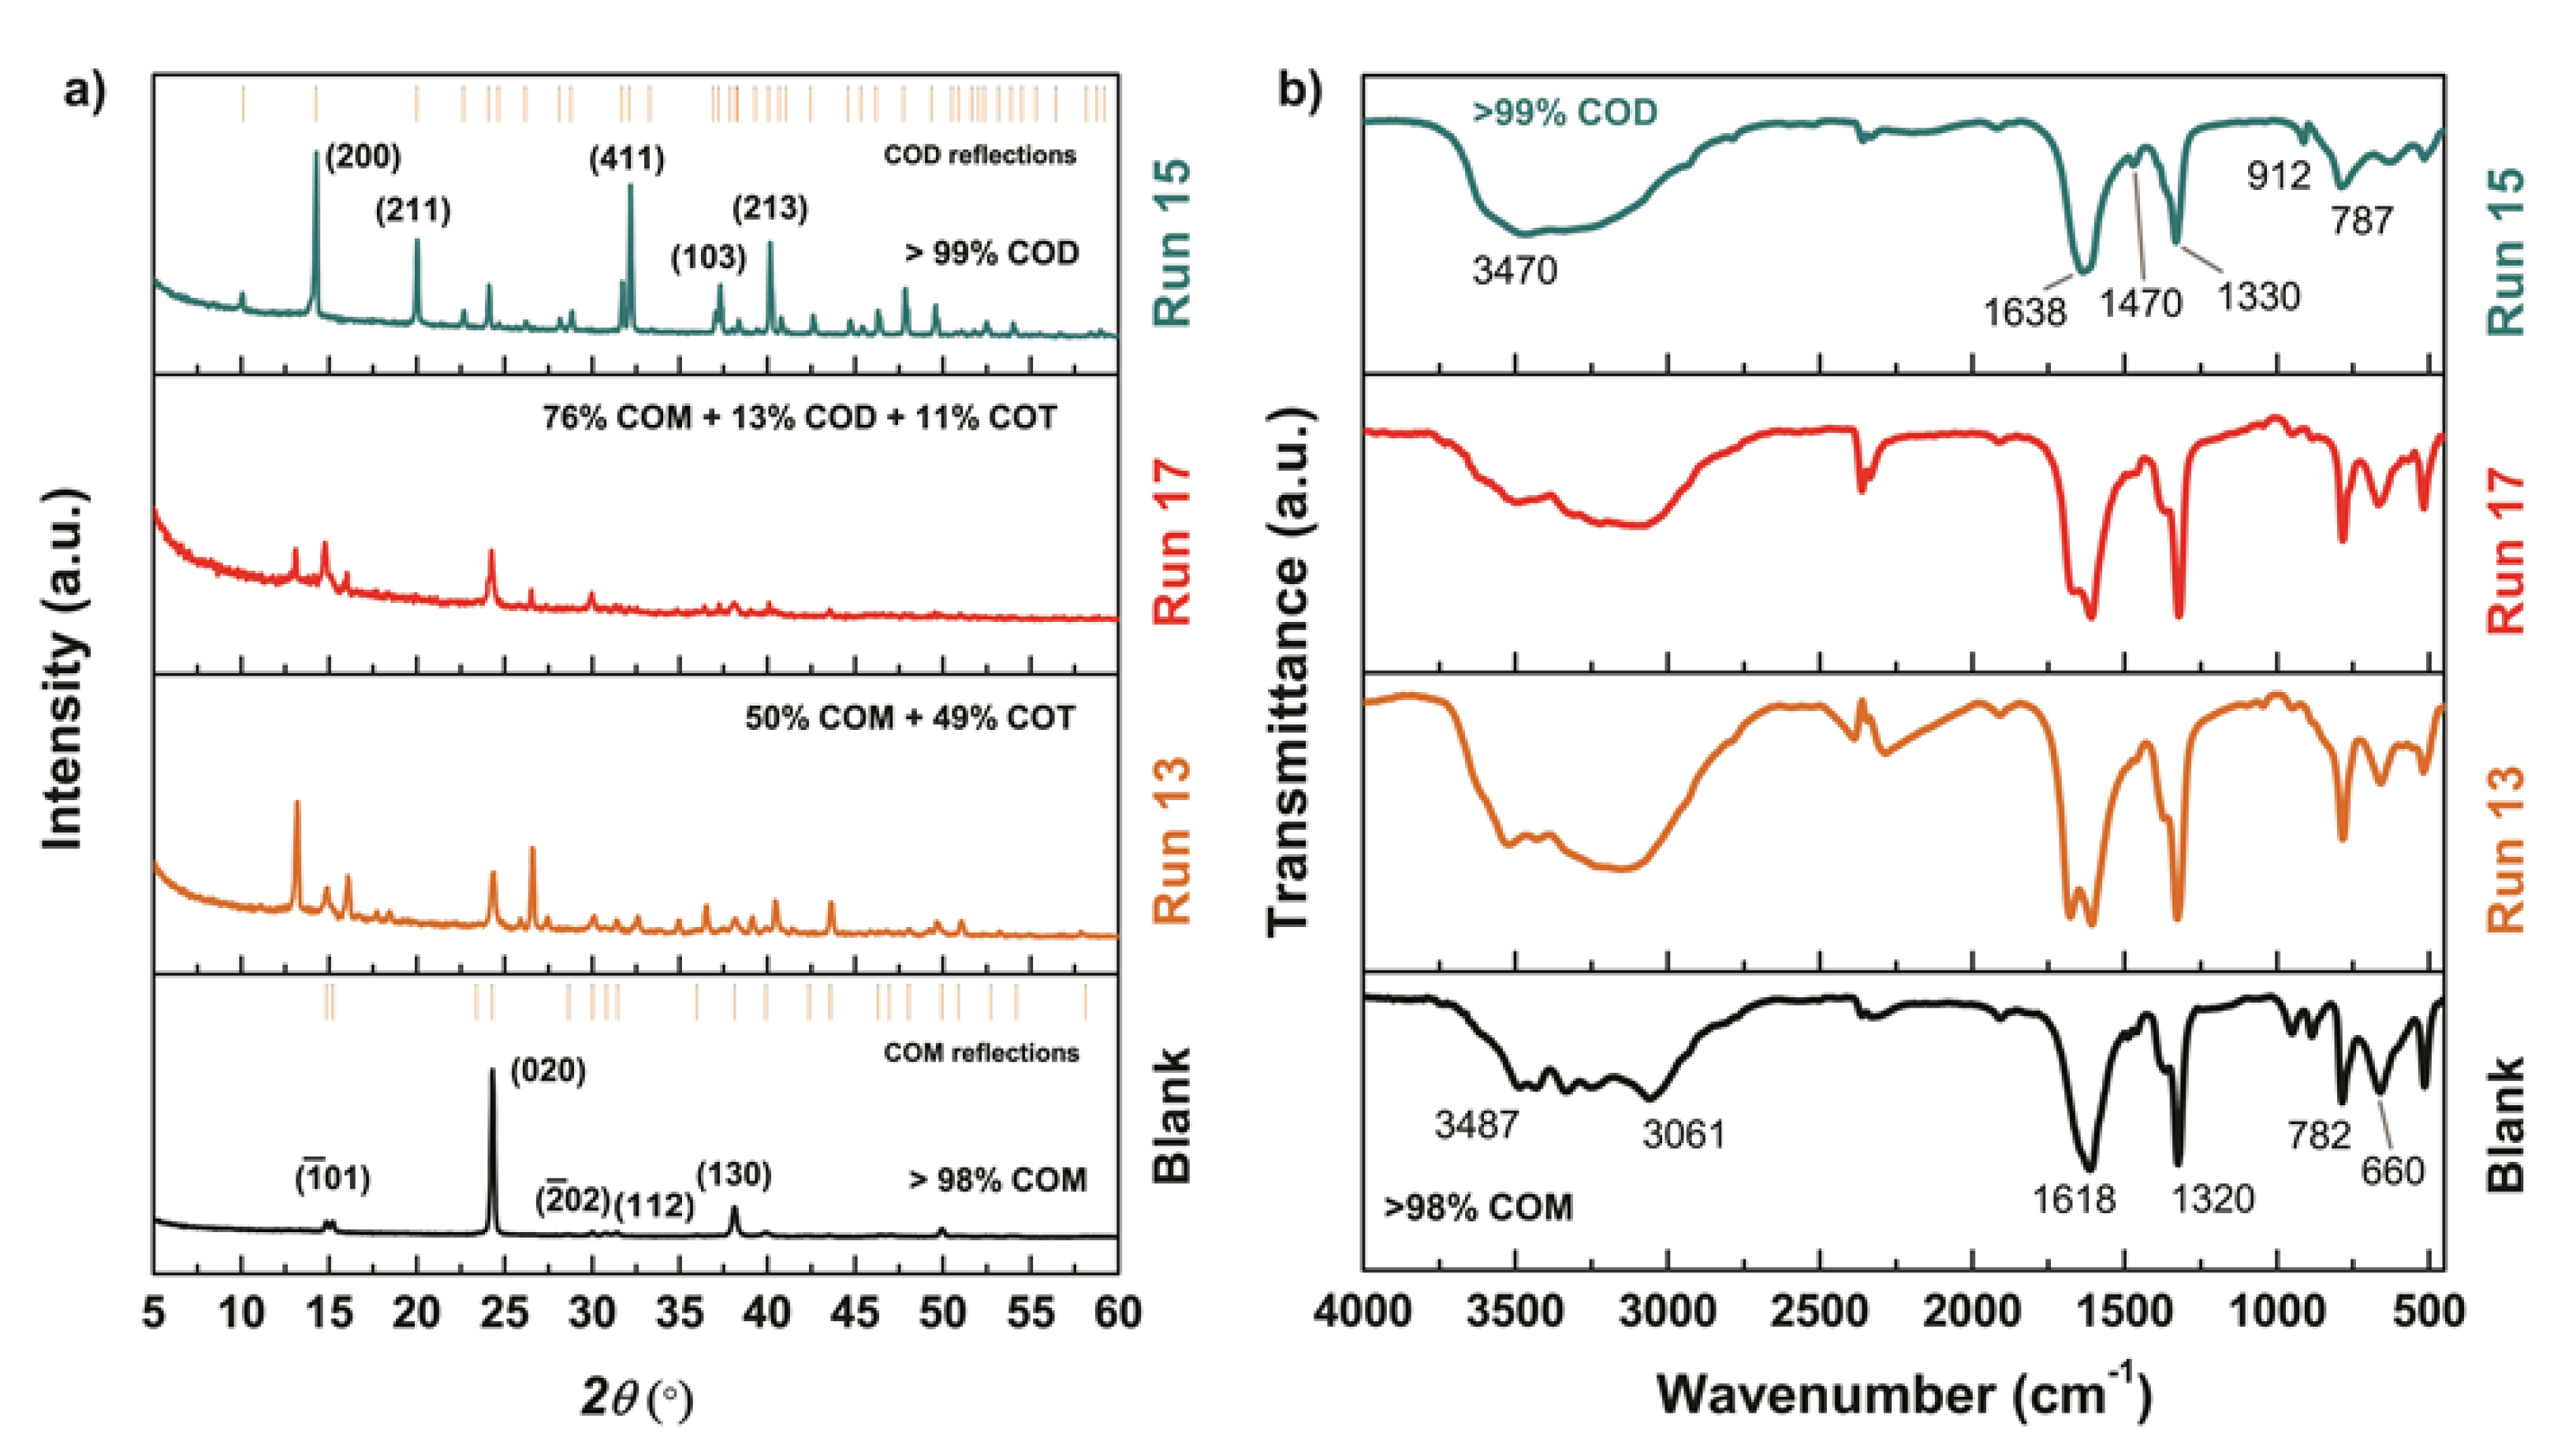
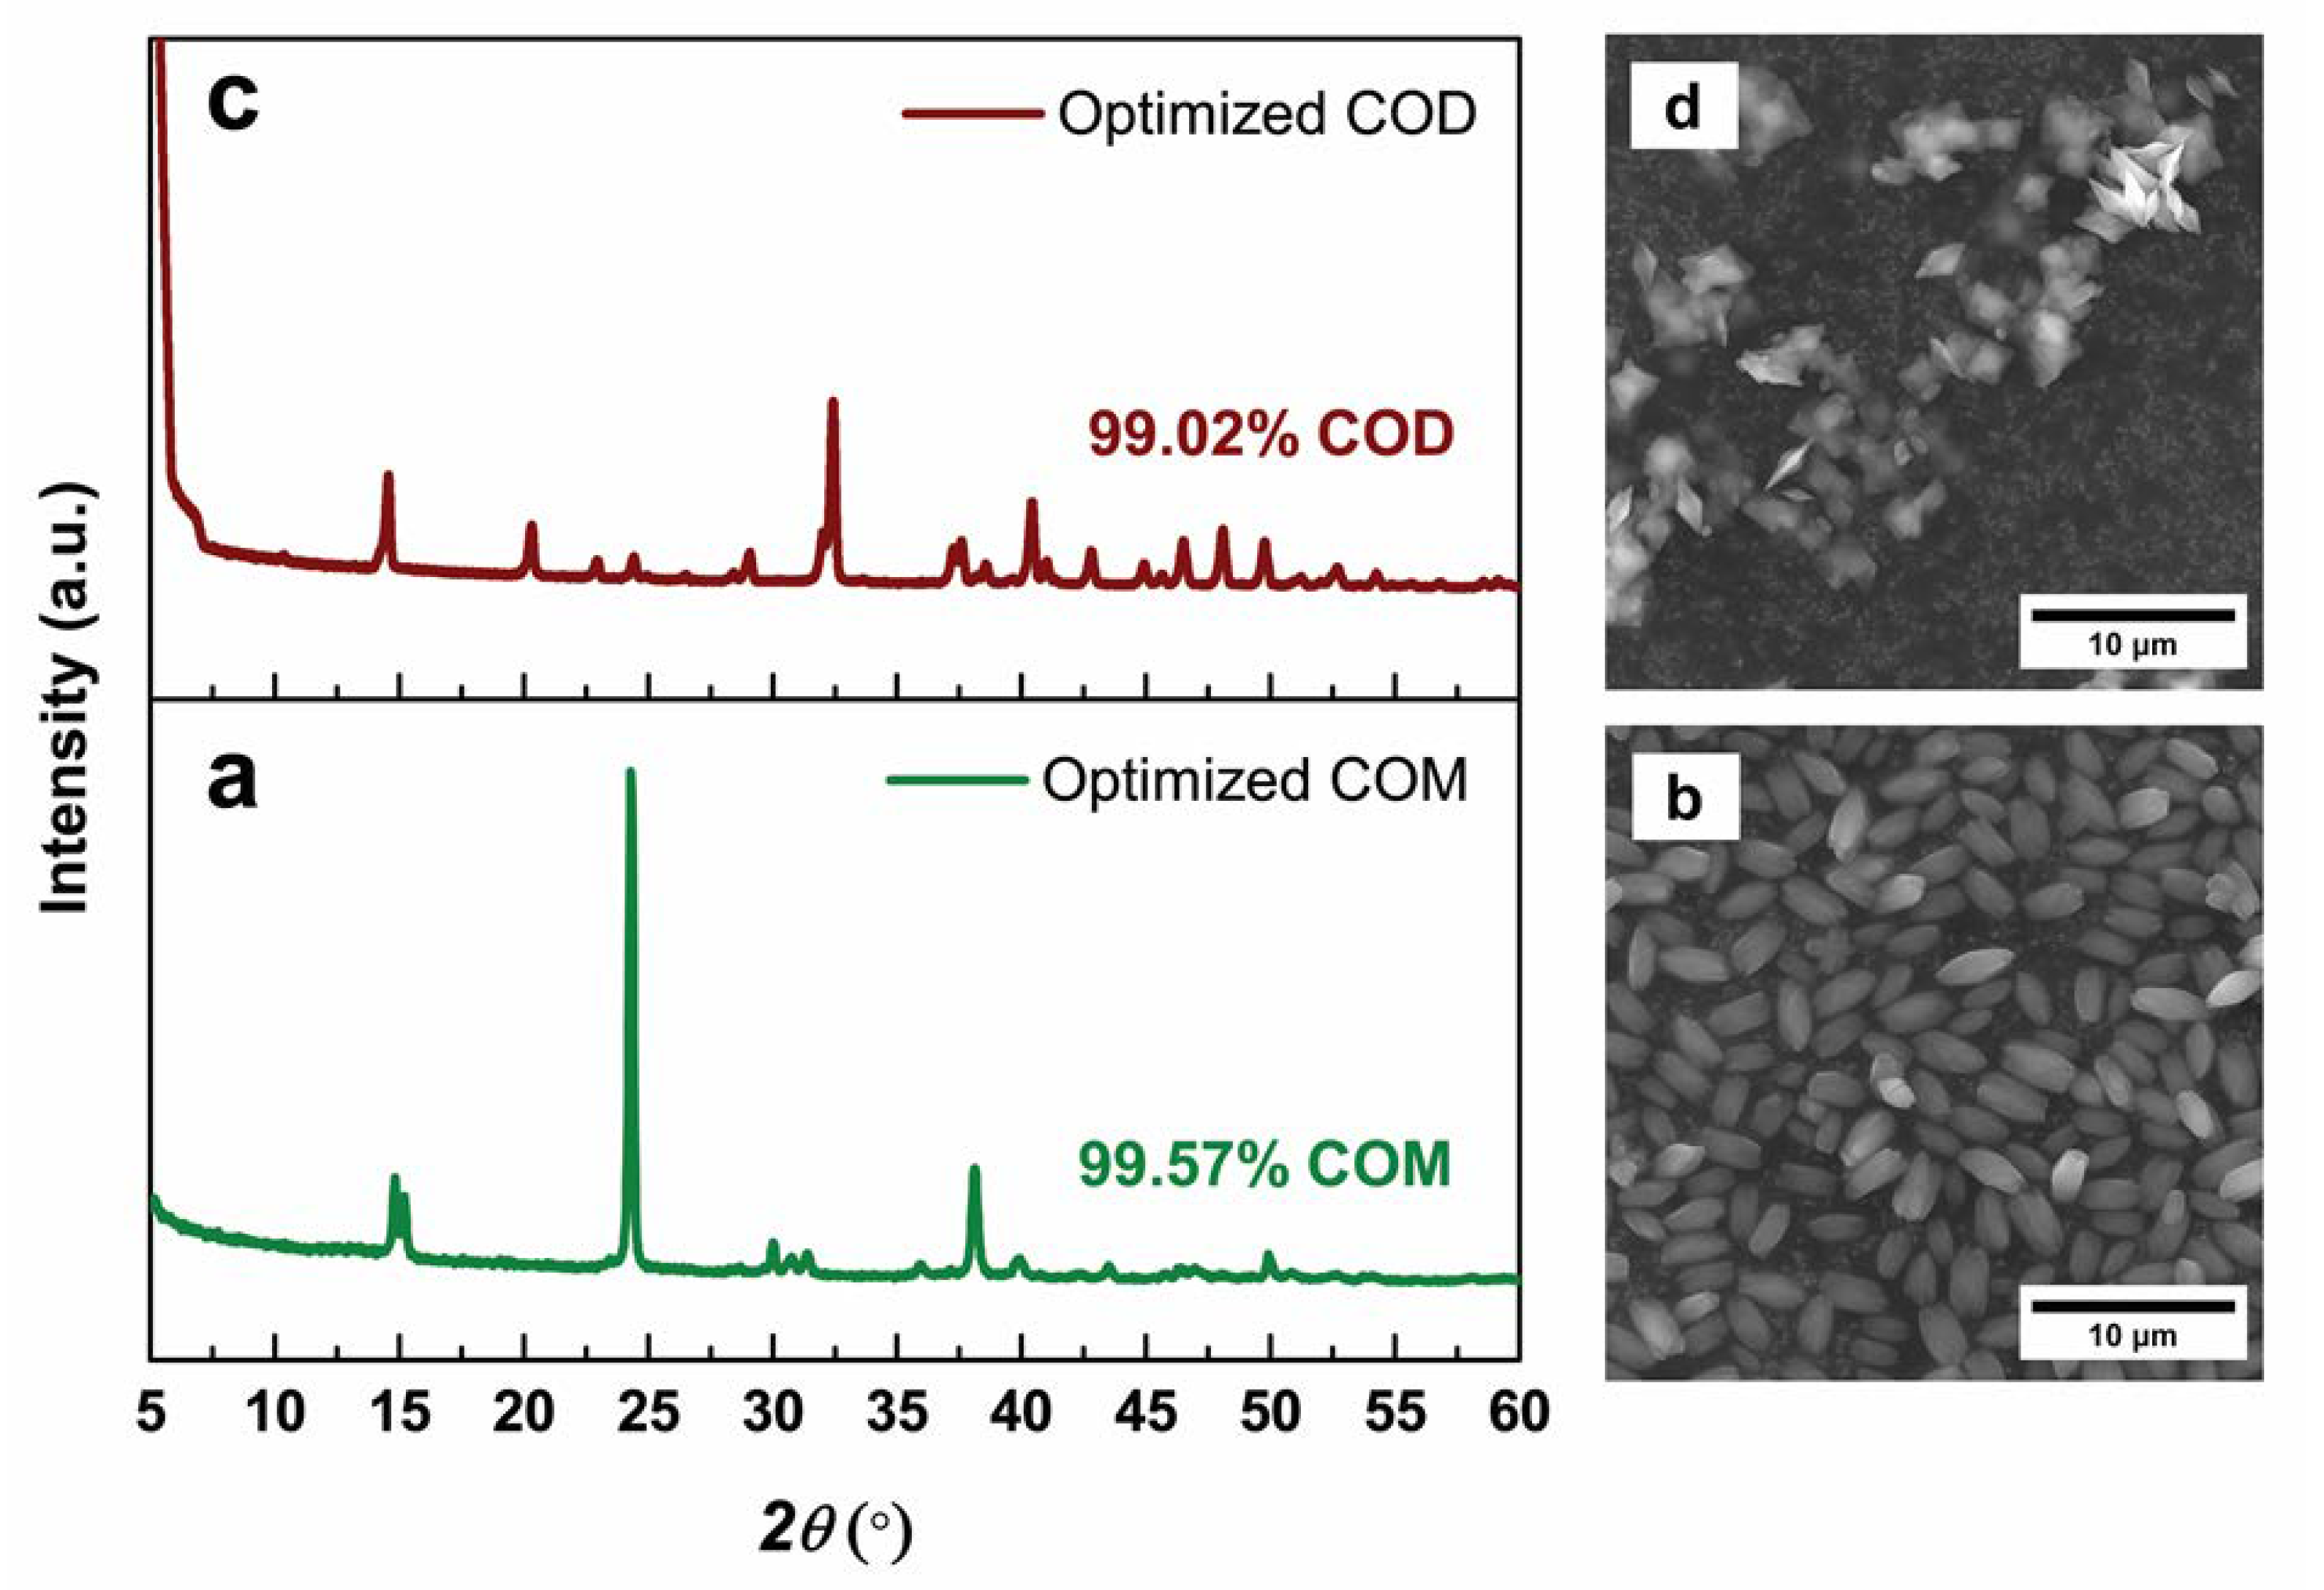
3.1. The Structural Analysis

Weight percentages of oxalate hydrates in the samples were determined using thermogravimetric analysis of dried samples (Table S1 in Supplementary Material). By comparing the obtained results with theoretical values for pure COM (12.33%), COD (21.96%) and COT (29.67%), it was indicated that, in some samples, mixtures of COM, COD and COT precipitated at given experimental conditions [26,27]. Table 2 presents the details of each experimental condition designated as “Run”. For simplicity and better visibility of the results, certain runs were chosen and then described in detail. Blank samples (precipitated experiment without gallic acid) and runs 13, 15 and 17 are shown in Figure 1. Thermograms of the blank sample indicate that weight loss occurred during one step and started at approximately 66.58 ± 2.71 °C (inflection point at 144.08 ± 1.42 °C). Total weight loss of the sample, occurring after heating up the sample to 300 °C, was found to be approximately 11.77 ± 0.62%, corresponding to approximately one crystalline water molecule in COM [26,27]. The thermogram of run 15 also demonstrated weight loss during just one step but this started sooner at 60.56 °C. Total weight loss of the sample after heating up to 300 °C was 21.84% demonstrating the presence of two crystalline water molecules in COD. From Figure 1, in run 13 it can be seen that the weight loss in the first step was 12.28%. The sample containing pure COT in the first step lost approximately 19.2% of weight loss [26], and it was evident that in run 13, in addition to the COM hydrate phase, COT also precipitated. The total weight loss in run 13 was 20.85% and the process took place in a two-step process, which is an indication that COT is present. In run 17, the weight loss in the first step was 8.80% and, in the second, was 10.41%, which was a total weight loss of 19.21%. However, because the process took place in a two-step process, a possible presence of COT is indicated, while the presence of COM and COD is demonstrated in the one-step process [23,24,25]. Moreover, in run 17, only after a detailed XRD quantitative analysis was it possible to determine which hydrate phase was present in the samples.
The FTIR method in our work presented qualitative analysis for determination of the presence of different oxalate hydrates in the samples. The obtained IR results, shown in Figure 2b, were compared with the vibration bands of oxalate standards (COM, COD and COT) given in Table S2 in Supplementary Material [28,29]. It can be seen from Figure 2b and Table S2 that the blank sample, precipitated without gallic acid, had only COM vibration bands, while run 15 had only COD vibration bands. The blank sample showed five peaks above 3000 cm−1, near 3487, 3428, 3339, 3259 and 3061 cm−1, assigned to stretching vibrations of the coordinated water molecules [30]. In other samples, the appearance of an elongated band due to an increase in the water content was observed. For run 15, a weak vibration band was observed at about 3470 cm−1, while for run 13 and run 17, depending on the increase in the trihydrate content, the visibility of vibration bands decreased. The blank sample also provided vibration bands at 782 cm−1 and 520 cm−1, which are assigned to the bending of water that differ only by their shape and intensity [30]. Characteristic bands for carbonyl vibrations were obtained in the region from 1200–1800 cm−1. It can also be observed, that differences were visible in the region from 1600 to 1650 cm−1 as well. The blank sample, which was pure COM, had one very sharp band at 1618 cm−1, while for run 15, a shift to 1638 cm−1 was observed. In runs 13 and 17, the division of this peak into two peaks was observed, while the COT content increased. The specific absorption band of COD at 912 cm−1 in run 15 was very useful to attest the presence of higher COD content in the samples [31]. Run 17 had vibration bands of all three hydrate forms, which indicate that a mixture of COM, COD and COT was formed. In run 13, vibration bands for COM and COT were present.
Results of the FTIR spectroscopy indicate that all three oxalate hydrates precipitated in the observed experiments. However, it should be noted that the FTIR method in our work is semi-quantitative for the determination of oxalate. Other authors stated that if small amounts of different oxalate hydrates in the samples were present (≤10%) it is difficult to quantify the proportion of an individual hydrate [28].
XRD measurements (Figure 2a and Table 2) revealed the crystallization of different types (COM, COD and COT) and amounts of calcium oxalate crystals produced in the presence and absence of gallic acid. In all experimental conditions where gallic acid was not present in the system, COM precipitate was exclusively formed (data not shown). Quantitative XRD analysis are shown in Table 2. It can be seen that all three observed parameters (pH, temperature and mass of gallic acid) affected the formation of the desired, unstable calcium hydrate COD.
The main reflections of calcium oxalate crystals in the absence of gallic acid, the blank sample, had only COM diffraction peaks at d = 0.593, 0.365, 0.296, 0.249, 0.235, 0.227, 0.207 and 0.197 nm, which were assigned to ( 1 ¯ 01), (020), ( 2 ¯ 02), (112), (130), (202), (321) and (303) planes of COM crystals, while run 15 had only diffraction peaks at d = 0.618, 0.442, 0.277, 0.241, 0.224, 0.212, 0.196 and 0.190 nm, which were assigned to (200), (211), (411), (103), (213), (530), (611) and (413) planes of COD crystals [32,33]. It is evident from Figure 2a, that runs 13 and 17 had diffraction peak characteristics for all three hydrate forms. Quantitative estimations using relative peak heights/area proportions indicate that run 13 had 50% COM and 49% COT, while run 17 had 76% COM, 13% COD and 11% COT.

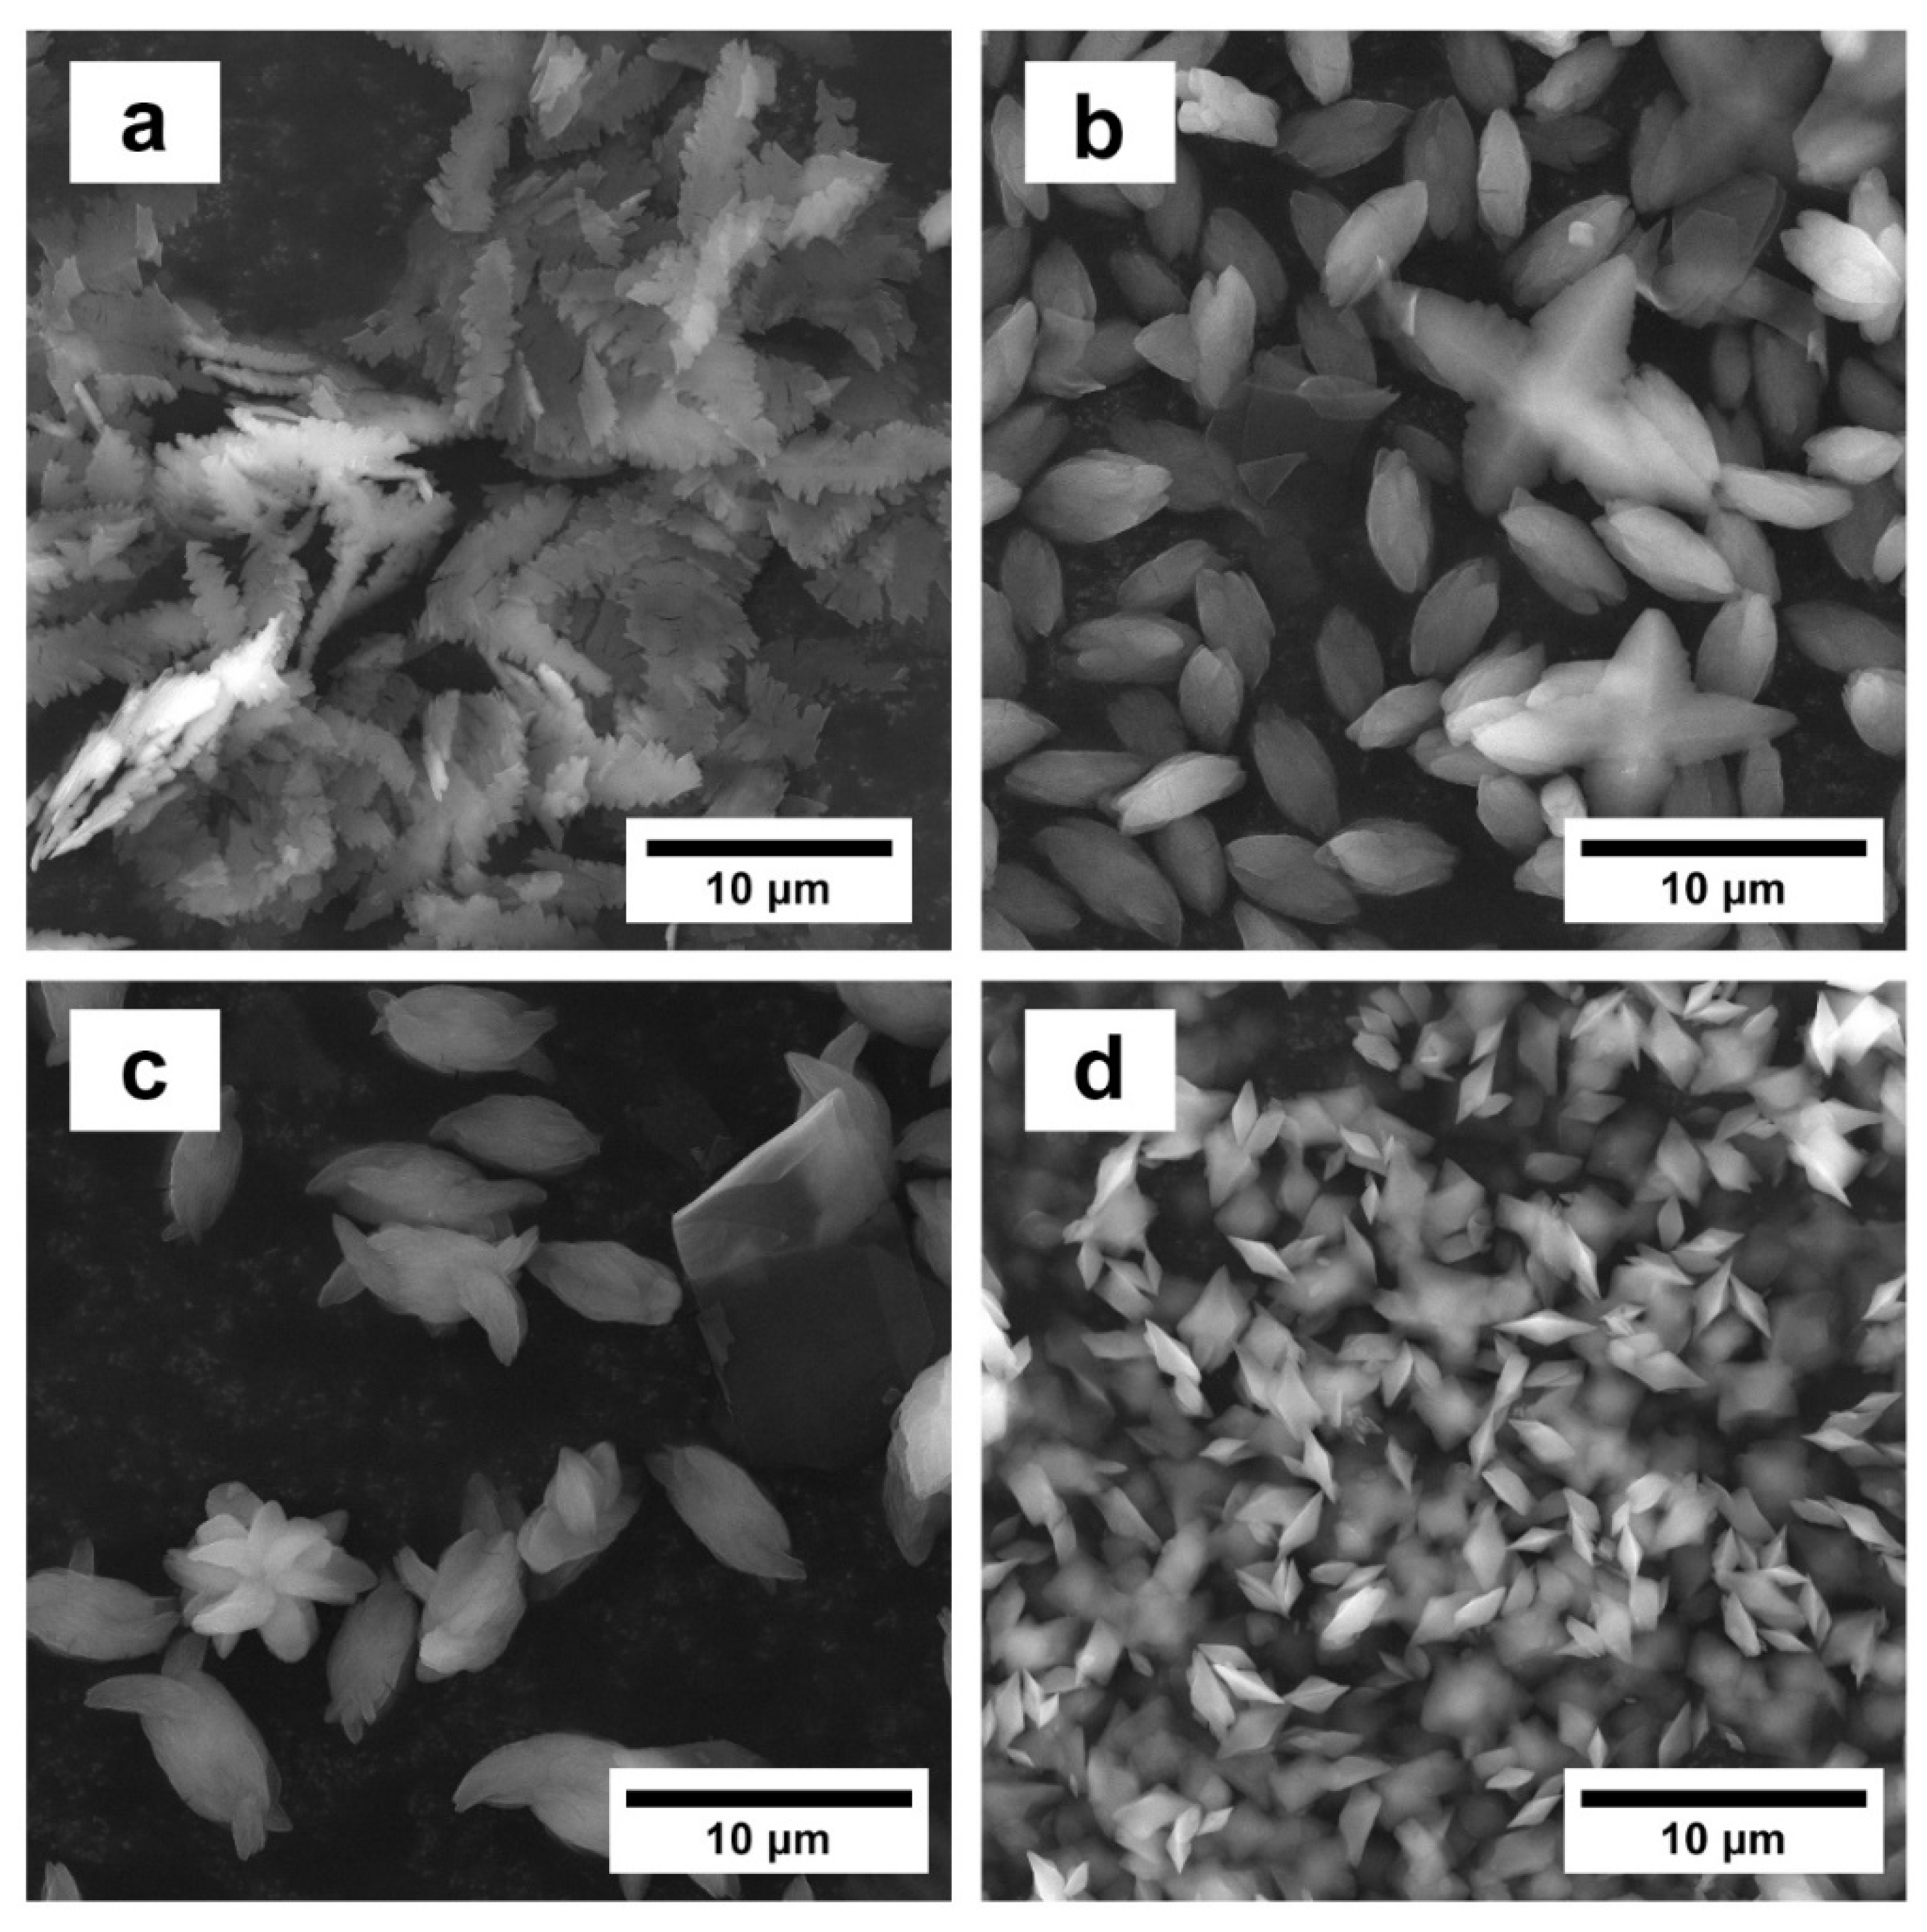
3.2. Morphology of Calcium Oxalate Crystals

Previously described synthesis conditions revealed different morphologies of COM, COD and COT crystals (Figure S2). Figure 3 shows the SEM micrographs of the crystals precipitated in the experiments blank (a) without gallic acid and experiments run 17 (b), run 13 (c) and run 15 (d) with added gallic acid.
According to the SEM observations (Figure 3a), crystals precipitated in the absence of gallic acid were calcium oxalate monohydrate (COM), having a dendritic structure with very rough edges and tips. From Figure 3b, the flower-like crystals, which are characteristic for COD, can be seen. COM crystals become more numerous, smaller, thinner and more regularly shaped, sometimes dumbbell-shaped or twined. At first, COT crystals are more difficult to notice and differentiate, as it is more likely that COT are aggregated with COM crystals. In Figure 3c, differences in the morphology of precipitated crystals can be observed. The edges of the crystals are more twisted, and it is assumed that the COM and COT crystals are aggregated. Very irregular aggregates are also detected. Figure 3d represents the bipyramidal shape of the COD. Most often COD morphology reported in the literature is bipyramidal and/or flower-like [23,34,35,36]. Micrographs of all prepared samples are presented in Supplementary Materials in Figure S1. The obtained morphologies agree with the results of other methods.

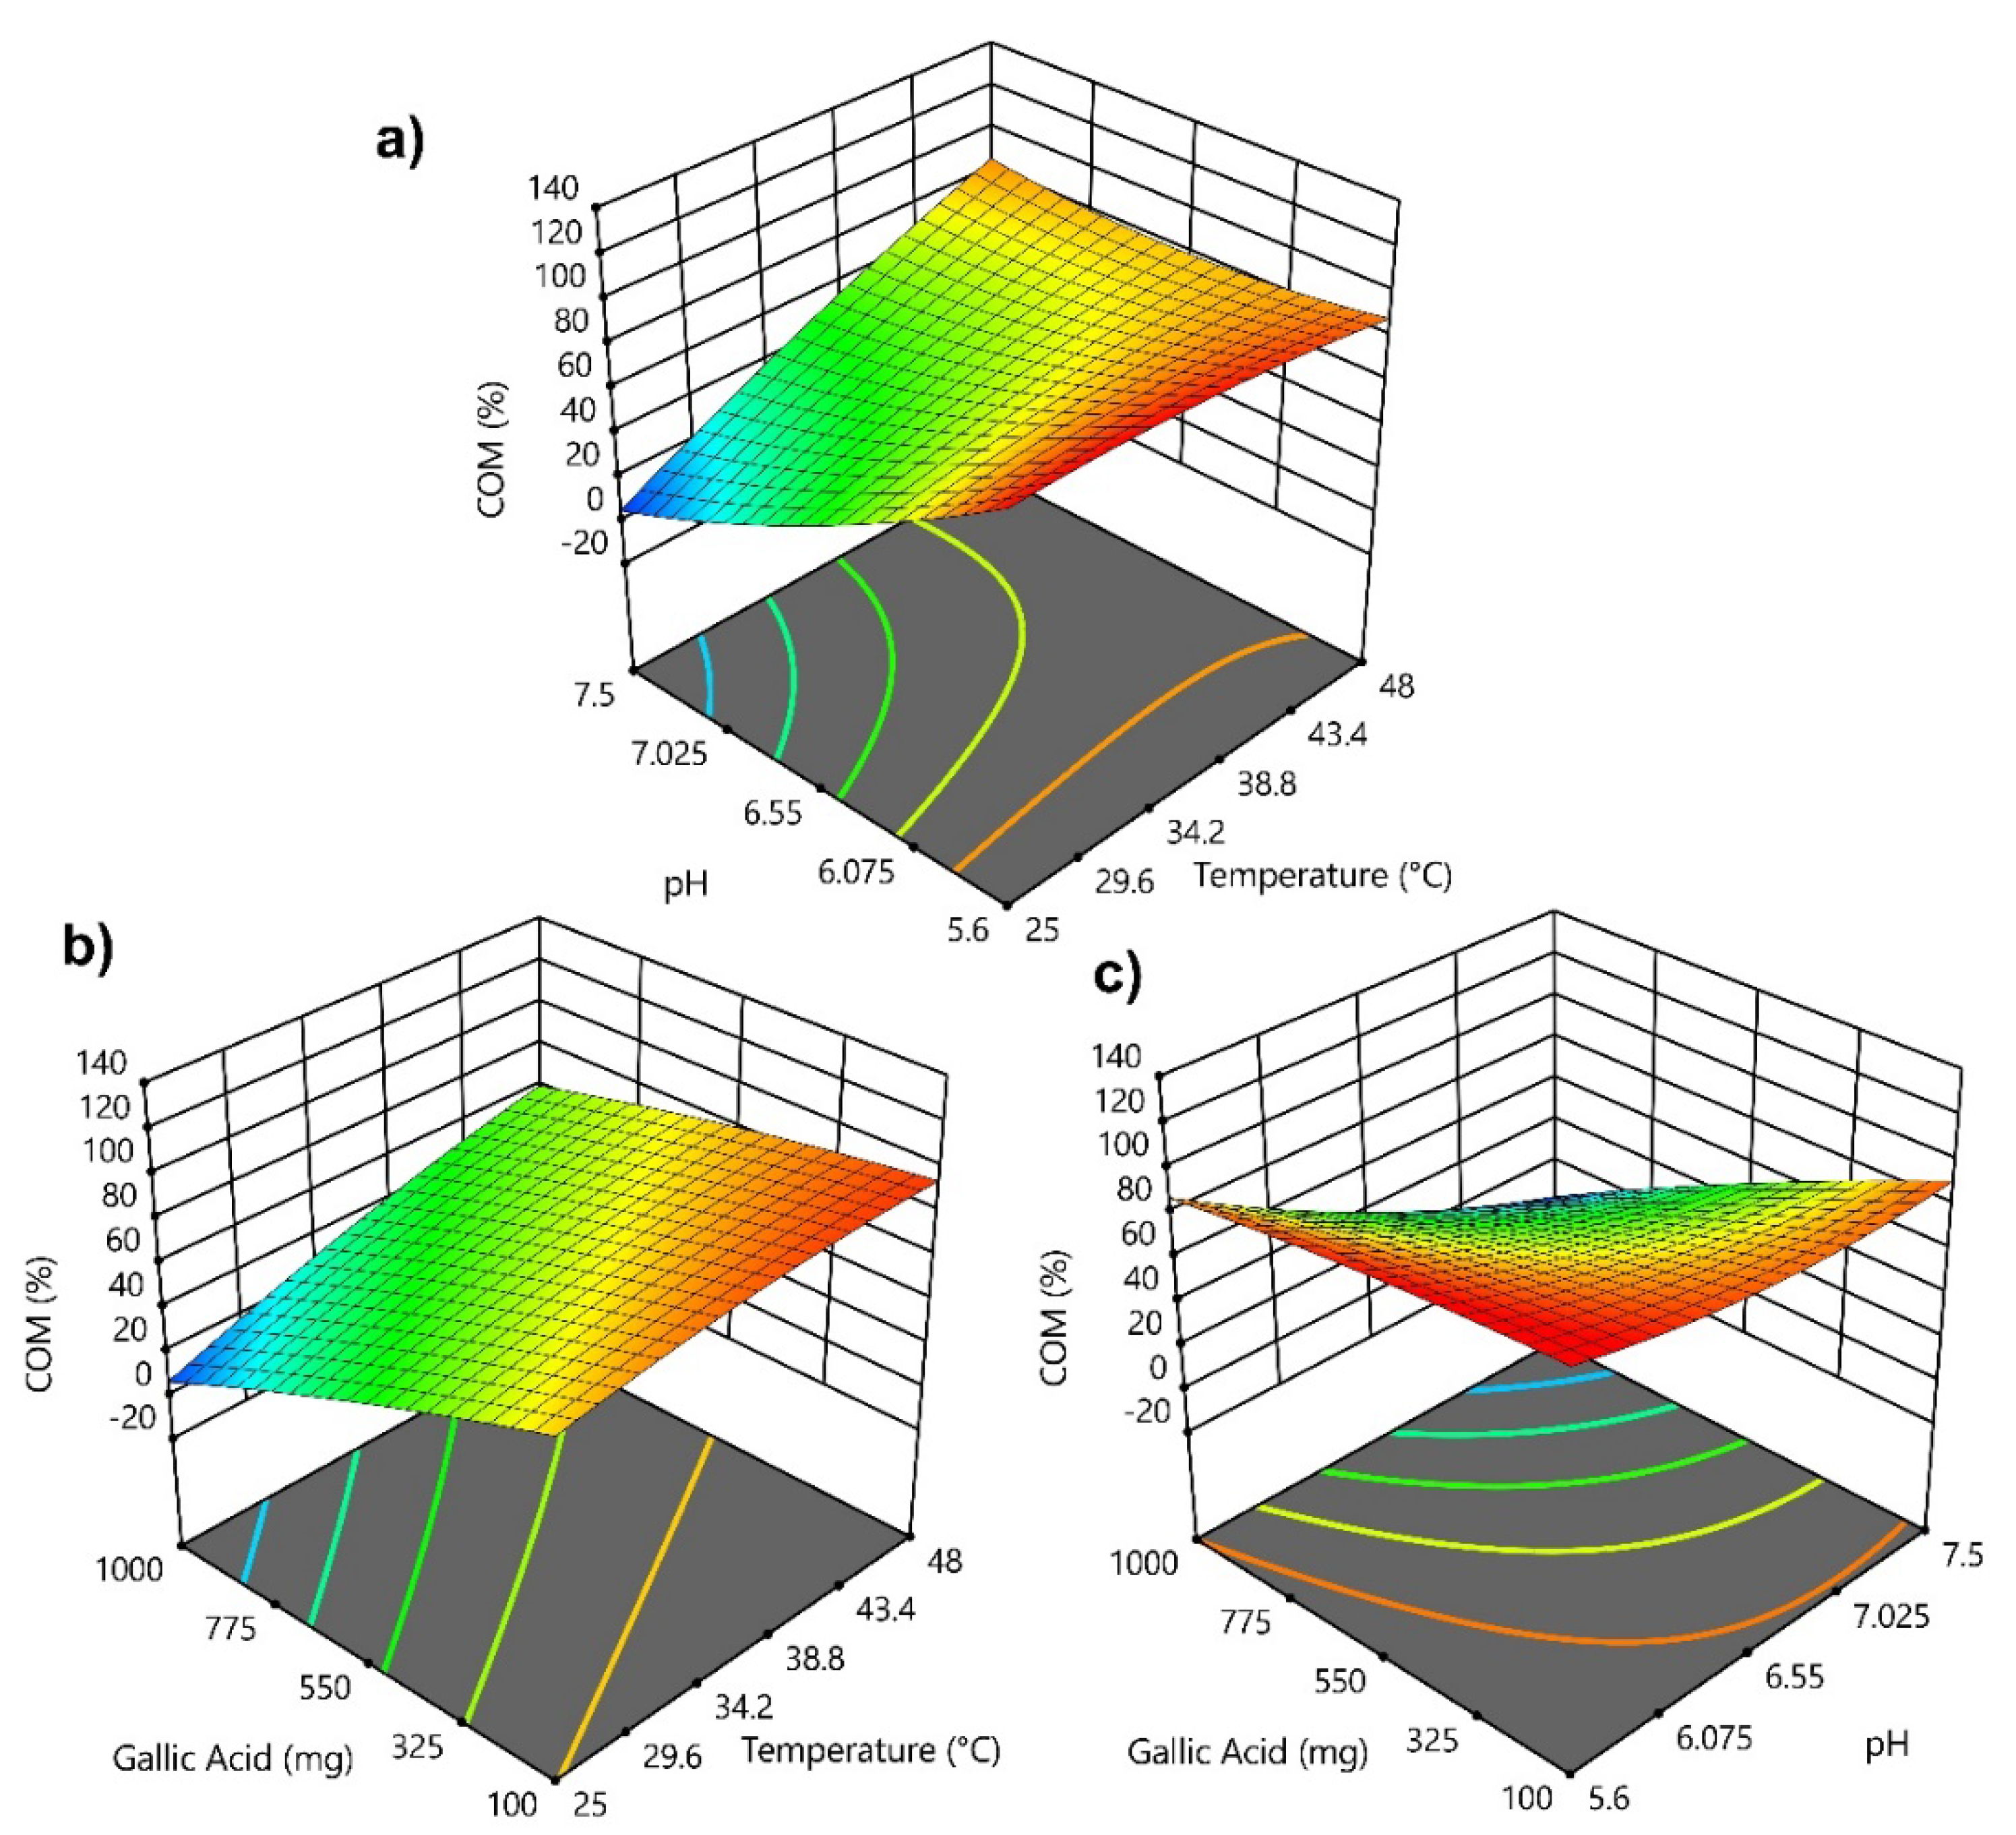
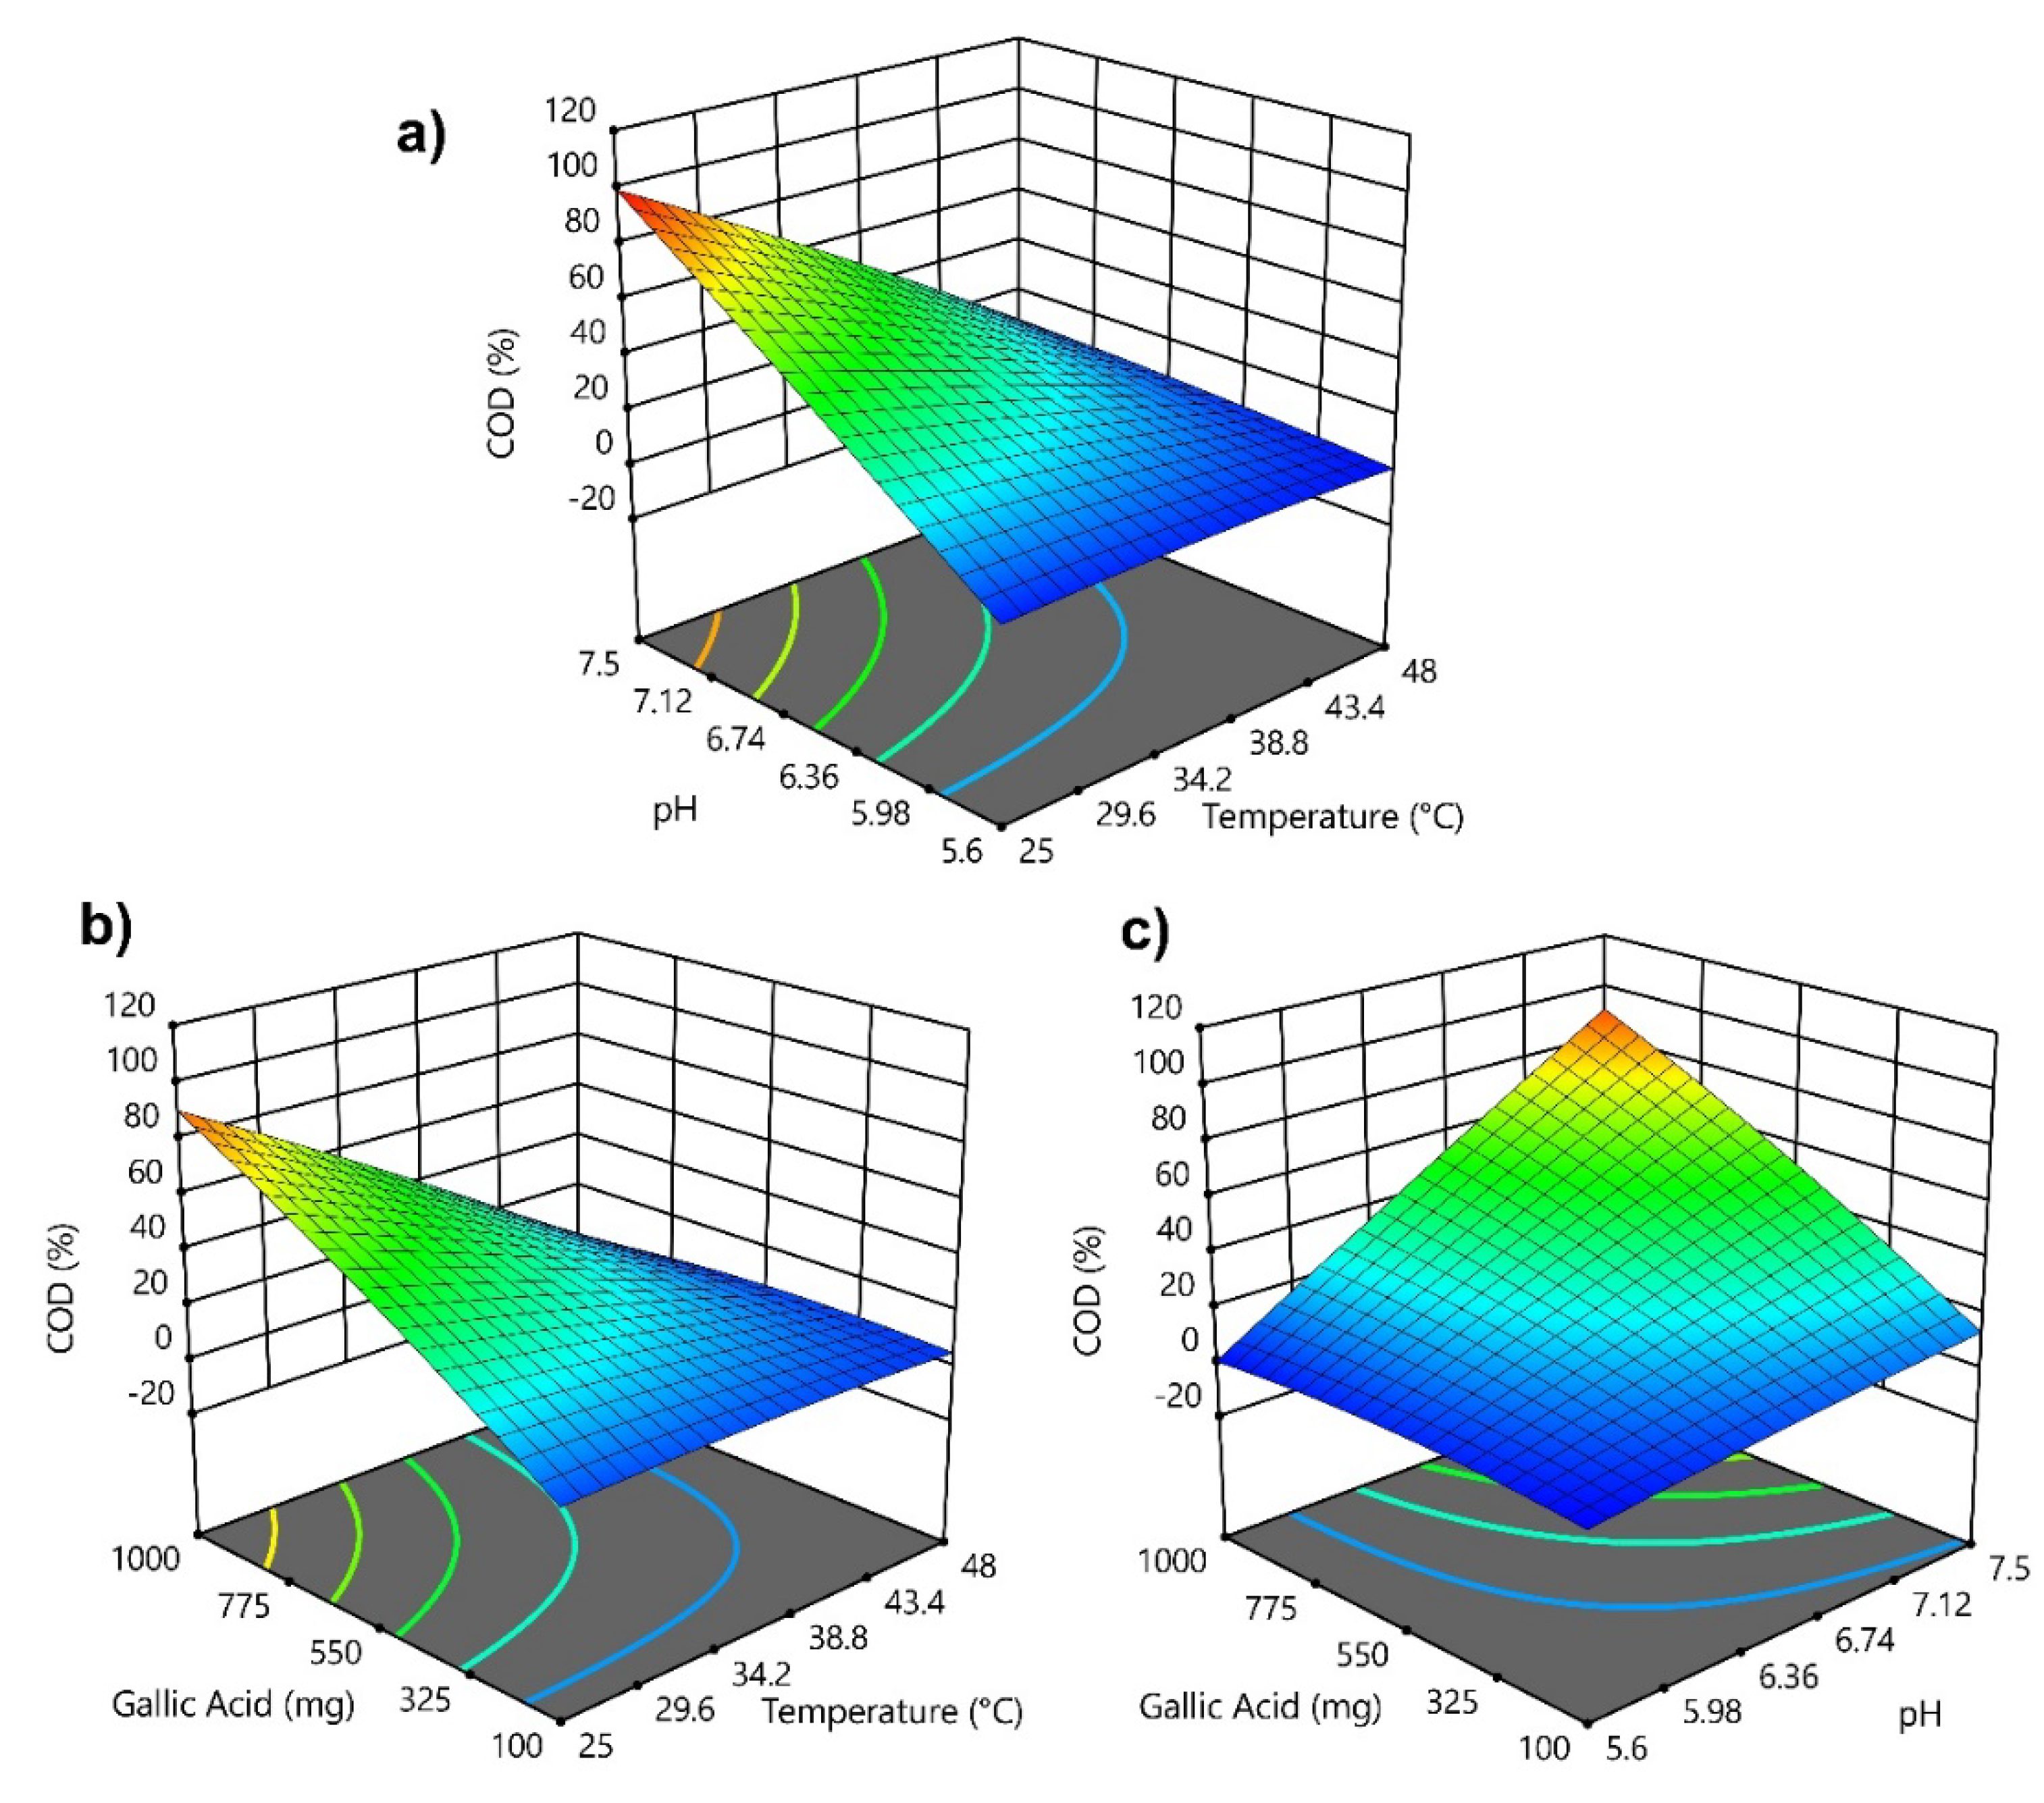
3.3. The Influence of the Process Parameters on the Obtained Calcium Oxalate Hydrate Phases

Prior to the process optimization towards obtaining the maximum content of COM and COD, it is essential to investigate an individual parameter or parameter’s influence on each investigated response (y). In this study, mathematical modelling and process optimization were carried out according to the Box–Behnken experimental design through 17 experiments and using the following independent variables: temperature (X1), system pH (X2) and the amount of added gallic acid (X3). Interestingly, all investigated variables or inputs for the obtained COM were statistically significant (p-value < 0.05), with significant model and non-significant Lack of Fit (Table S3). The obtained coefficient of determination was calculated to be R2 = 0.9645. Similarly, the model adequacy for obtaining the COD content was evaluated by the p-value < 0.05, showing the statistical significance and non-significant Lack of Fit (p-value > 0.05) (Table S4). In addition, all of the inputs were significant, with obtained R2 = 0.9736.
The adequacy of the obtained fitted models was assessed by the ANOVA analysis shown in Table S3 and Table S4. The obtained results fit the quadratic function described by the following coded equation for COM (2) and COD (3) as follows
C O M = 67.25 + 17.22 X 1 24.69 X 2 26.61 X 3 4.16 X 1 2 + 7.27 X 2 2 2.60 X 3 2 + 23.21 X 1 X 2 + 9.72 X 1 X 3 17.91 X 2 X 3
C O D = 30.68 22.98 X 1 + 26.15 X 2 + 19.66 X 3 1.75 X 1 2 0.9068 X 2 2 3.36 X 3 2 22.28 X 1 X 2 22.19 X 1 X 3 + 19.39 X 2 X 3
Analysis of the individual parameters of temperature (X1) in obtaining COM and COD indicates that an increase in the system temperature favours the formation of the COM hydrate phase. This observation is in accordance with a study by Ouyang et al. [37], which involved the investigation of the effects of additives and different parameters on the growth mechanism of calcium oxalates [37]. They concluded that phase composition and crystal morphology is highly affected by the system temperature, and that an increase in the crystallization temperature promotes the formation of COM, while a decrease in the temperature increases the content of COD. Moreover, it is well-known that lower temperatures of the crystallization system favours the formation of COD [38]. Furthermore, the different trends are also observed regarding the influence of the system pH (X2) on the formation of the individual hydrate phase of calcium oxalate. According to the analysis, a higher pH (5.6 ≤ pH ≥ 7.5) favours the formation of COD, while a slightly acidic medium promotes the formation of COM. Although the role of the pH medium in the calcium oxalate formation is still highly controversial [39] and possible mechanism is still not completely elucidated, a few studies have reported that a higher pH could promote the formation of COD [40,41]. Recently, the systematic investigation of the effects of the pH on the calcium oxalate precipitation was reported by Manissorn et al. [41] with given conclusions that COM crystallized more efficiently at lower pH (pH = 4.0), while the formation of COD was promoted at a highly basic media (pH = 8.0). From the medical aspect, the acidic medium (for example acidic urine) could contribute to cellular injury and facilitate the COM crystal-cell adhesion leading to crystal retention, and, here, alkalization could represent one of the potential solutions towards crystal formation inhibition [41].
This work also includes the investigation of the gallic acid addition (X3) and its effect on the individual calcium oxalate hydrate phase formation (y). As expected, the hydrate phase composition was affected by the gradual increase in the mass concentration of additive (gallic acid). With the increase in the added amount of gallic acid, a decrease in COM content was observed. However, with the increase in the mass of gallic acid, an increase in the COD content was denoted. In the investigated pH range, gallic acid in the systems was present in the monovalent form (designated as GA), which undoubtedly altered the hydrate composition and crystal morphology (compared to the blank system). The gallic acid in the GA form promoted the formation of COD with typical bipyramidal crystal morphology, inhibiting the formation of smaller, thinner and twined COM crystals. In the nucleation process (the systems involving Ca2+/C2O42−/H2O/GA species), Ca2+ ions possibly interact with C2O42− and GA leading to the formation of calcium oxalate clusters by specific interactions [22]. This could potentially indicate that gallic acid could be an efficient inhibitor or modulator towards obtaining specific hydrate modifications of calcium oxalate.
Finally, the interactions between the temperature (X1) and the system pH (X2), and also between the system pH (X2) and added amounts of gallic acid (X3) were observed to be significant for the obtaining of COM content. The simultaneous effect of temperature and system pH is shown in Figure 4. It is evident that an increase in the temperature (X1; θ = 25–48 °C) and at a lower pH (X2; pH = 5.6), meant the maximum content of COM was obtained. The same trend was observed with parameters X2 and X3 (Figure 4b,c) showing that a decrease in gallic acid content (X3; 100 mg) at lower pH (X2; pH= 5.6), saw the highest content of COM (100%) obtained. In contrast, by analysing the model for COD formation, all interactive terms were statistically significant. Exclusively, a lower temperature (X1; θ = 25 °C) and higher pH (X2; pH = 7.5) of the system gave the highest content of COD (99.32%) (Figure 5). Similarly, with a lower temperature (X1; θ = 25 °C) and the highest amount of gallic acid (X3; 1000 mg), a high content of COD (90.51%) was observed. Furthermore, at a higher pH (X2; pH 7.5) and with the highest amount of gallic acid (X3; 1000 mg), a higher content of COD (91.61%) was detected.
According to the statistical analysis (ANOVA), the obtained models are adequate for the COM and COD investigation. Therefore, the optimal conditions of temperature, system pH and amount of added gallic acid were determined in order to attain the highest content of COM and COD based on the desirability function approach. The optimal conditions for the maximal content of COM are estimated to be: a temperature of θ = 48 °C, pH = 6.84 and an added amount of gallic acid of 114.09 mg to obtain 99.57% of COM in the sample. Furthermore, to obtain the maximal content of COD in the sample, the predicted parameters are: a temperature of θ = 25 °C, pH = 6.81 and an added amount of gallic acid of 890.91 mg to obtain the content of COD of 99.02%. In order to verify the obtained data, the experiments were performed in triplicates under the predicted and optimum RSM conditions. The experimental data show good agreement with the predicted data with suitable deviations of ±5% (Figure 6). As shown in Figure 6, typical morphological characteristics of calcium oxalate were obtained, with dumbbell-shaped or twined COM (Figure 6b) and bipyramidal COD (Figure 6d) morphologies detected.

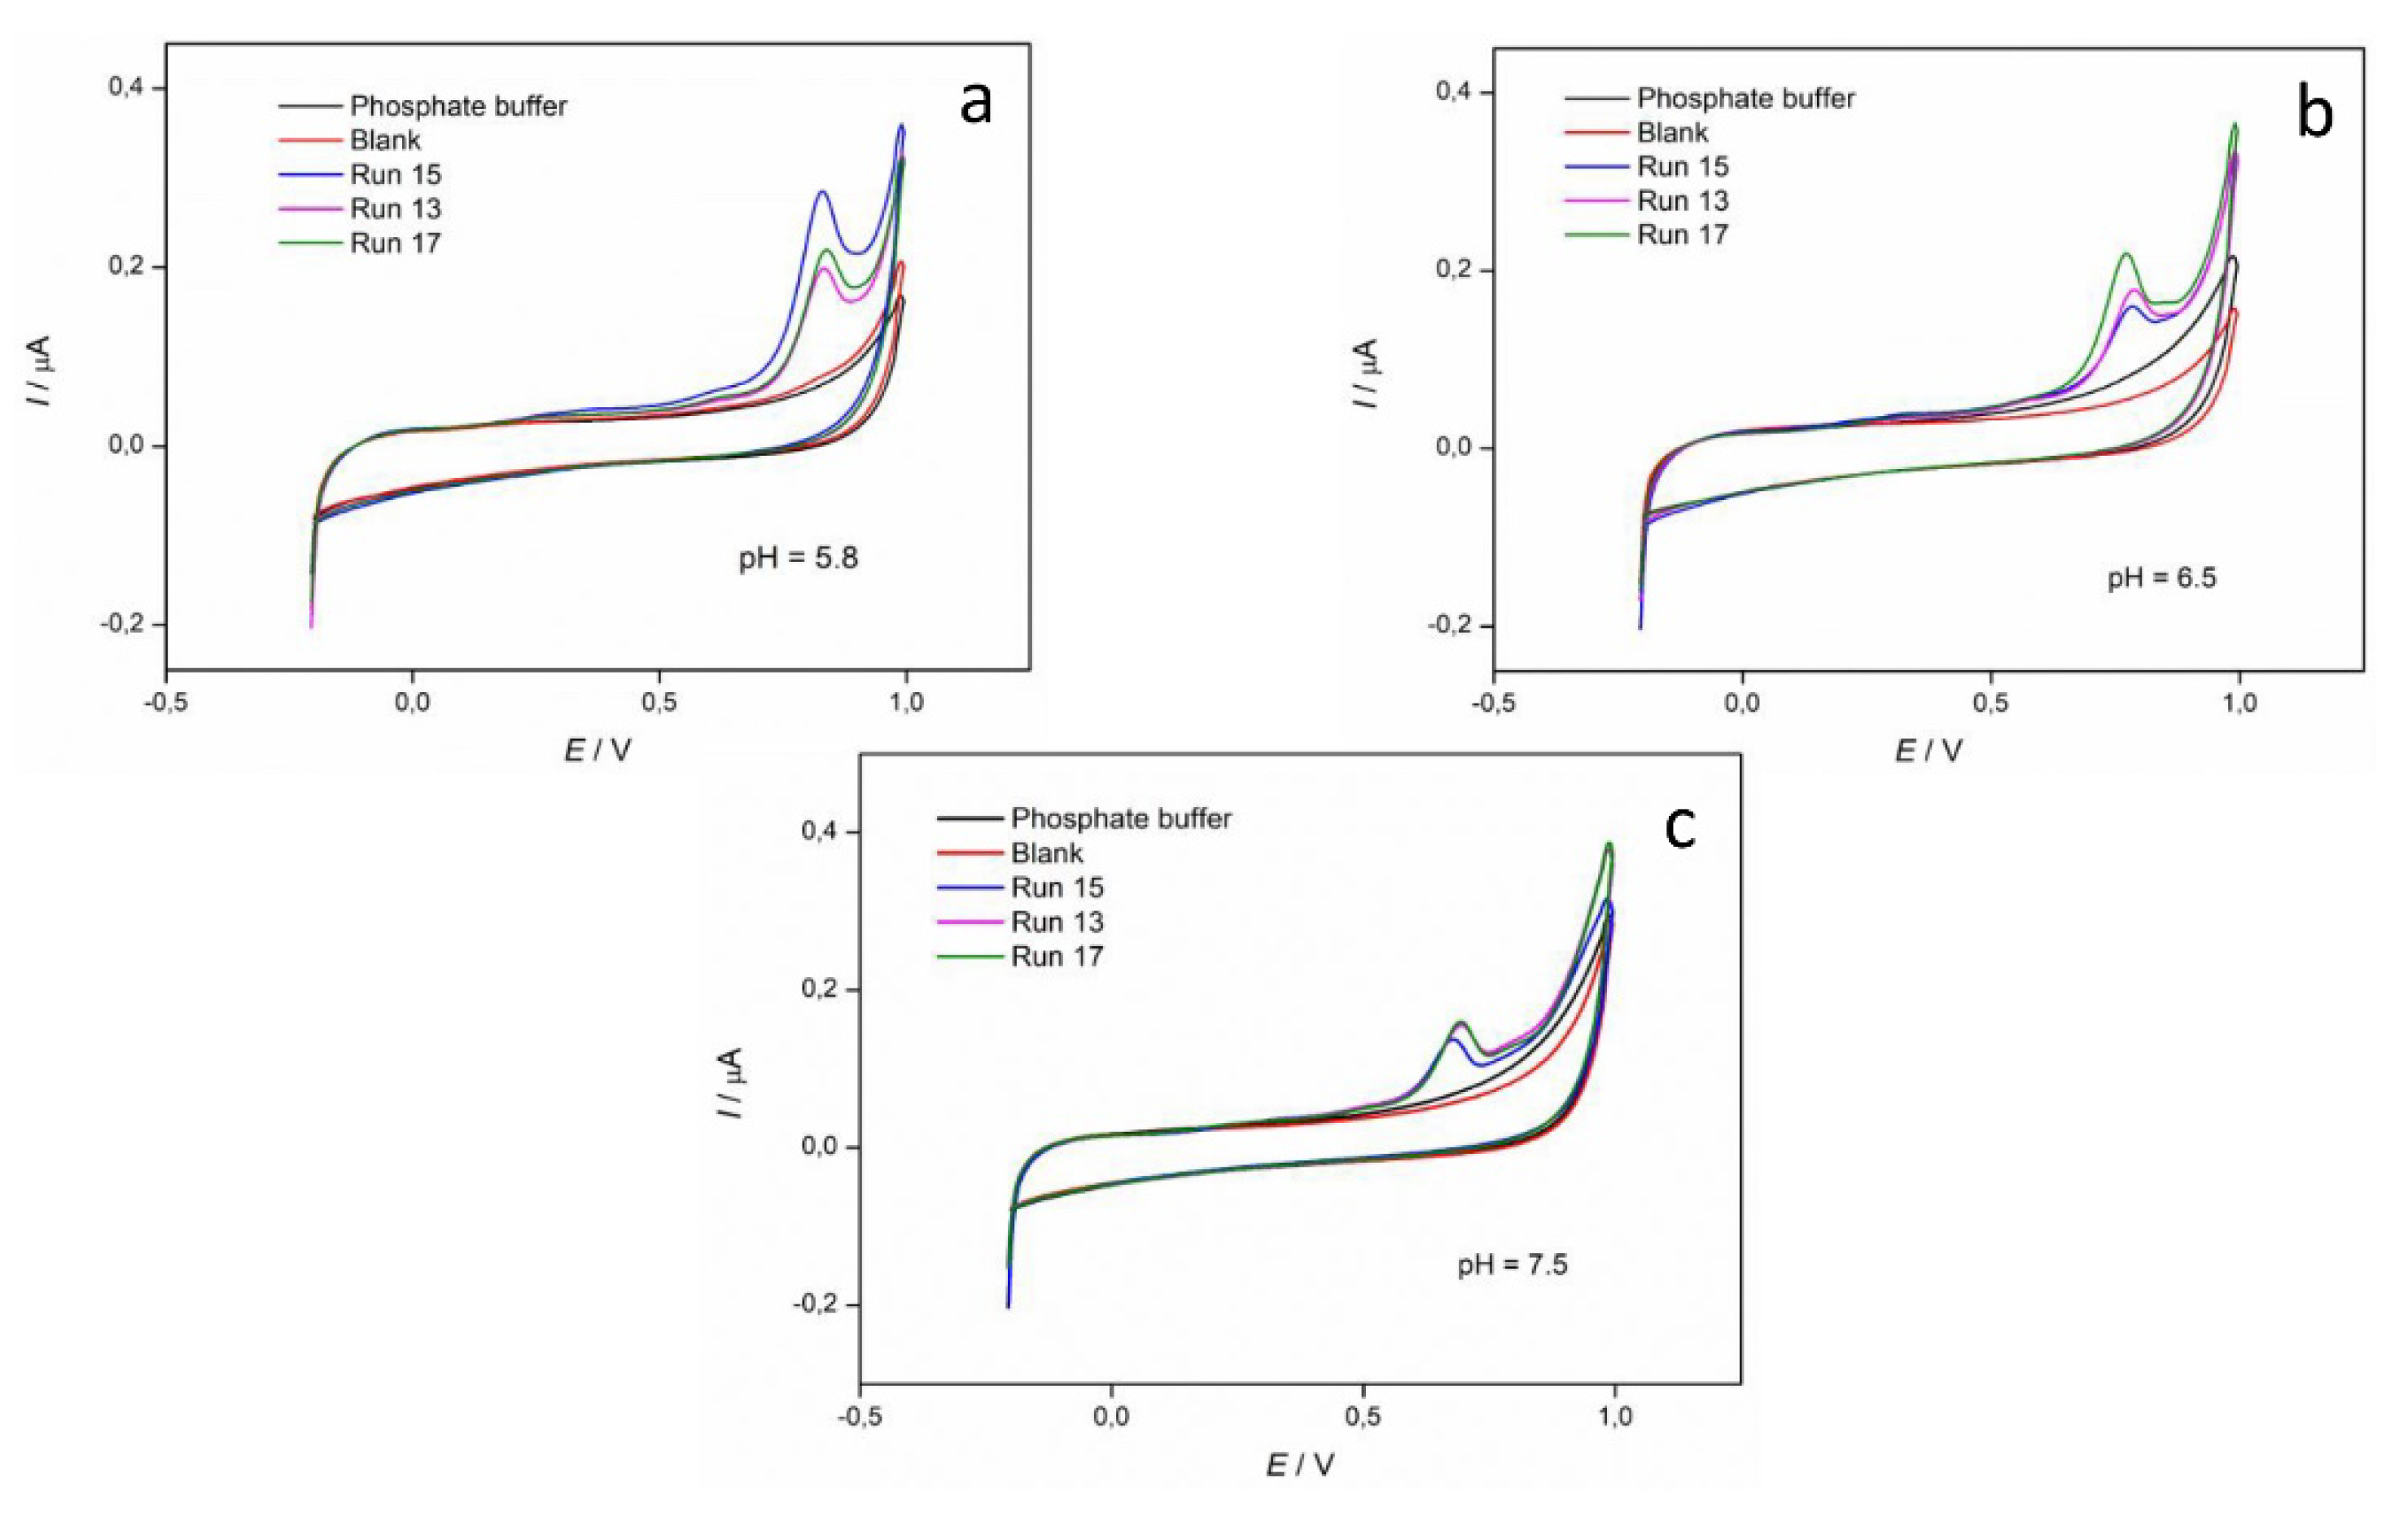
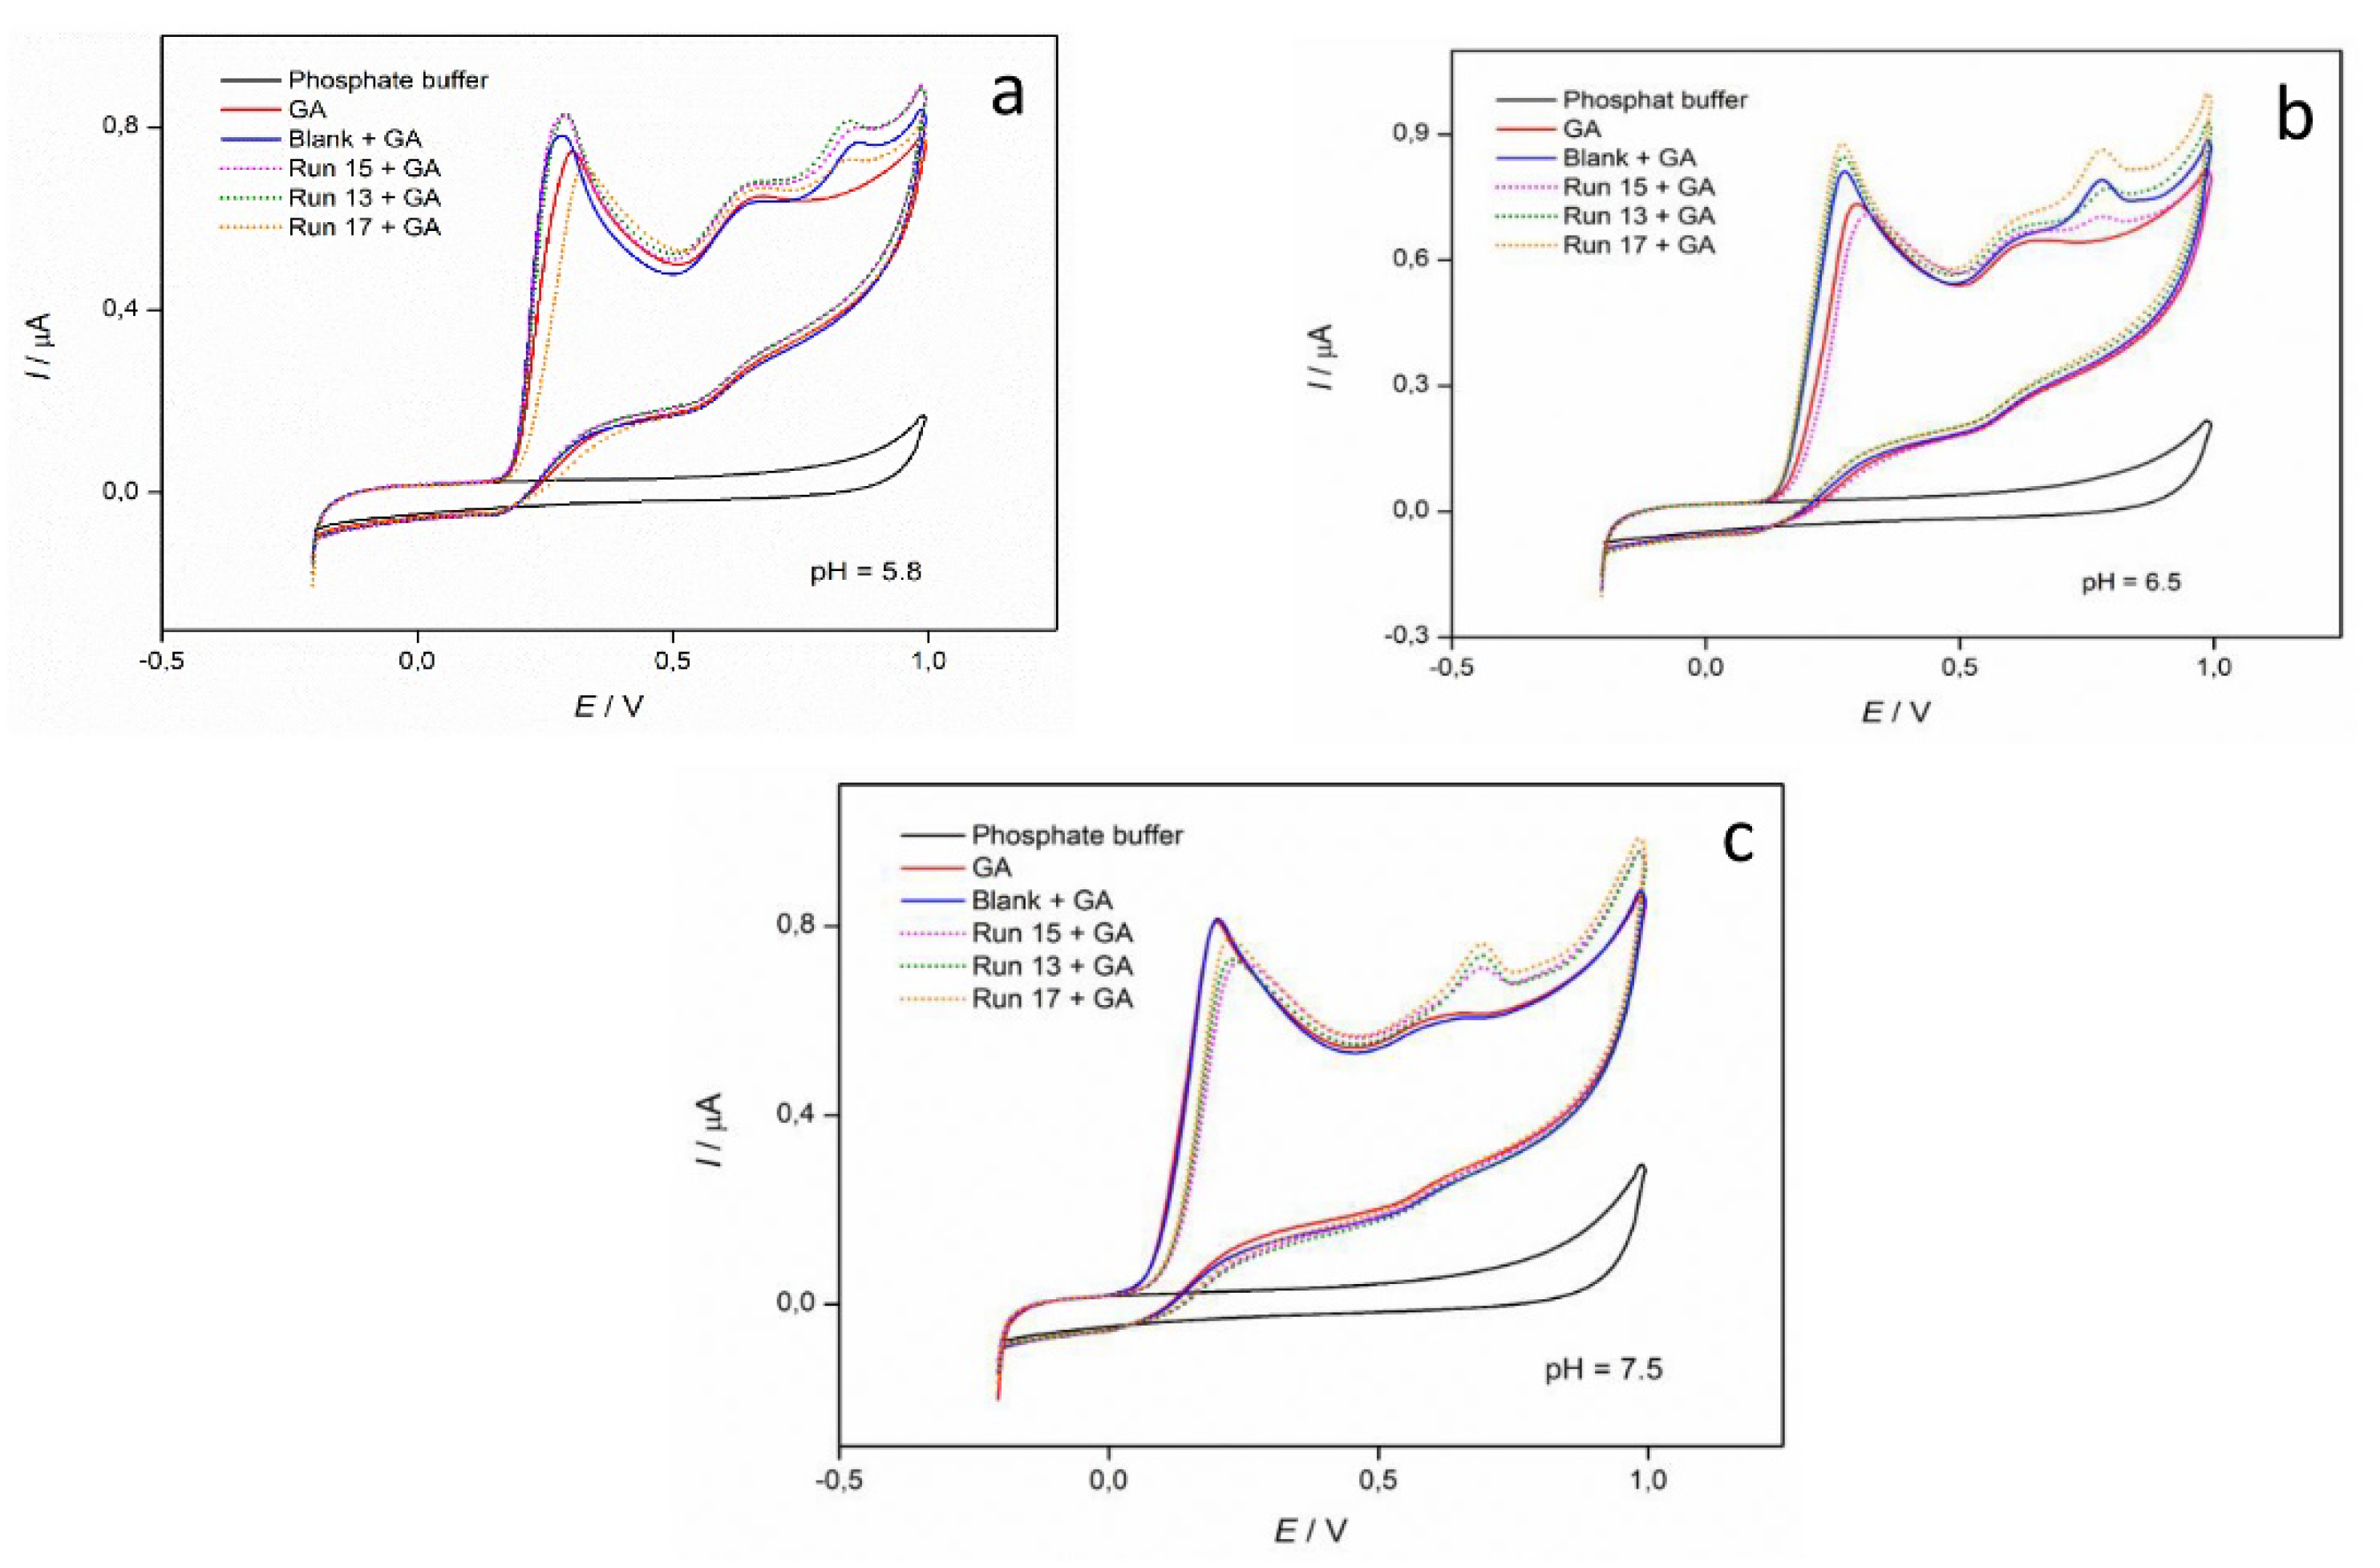
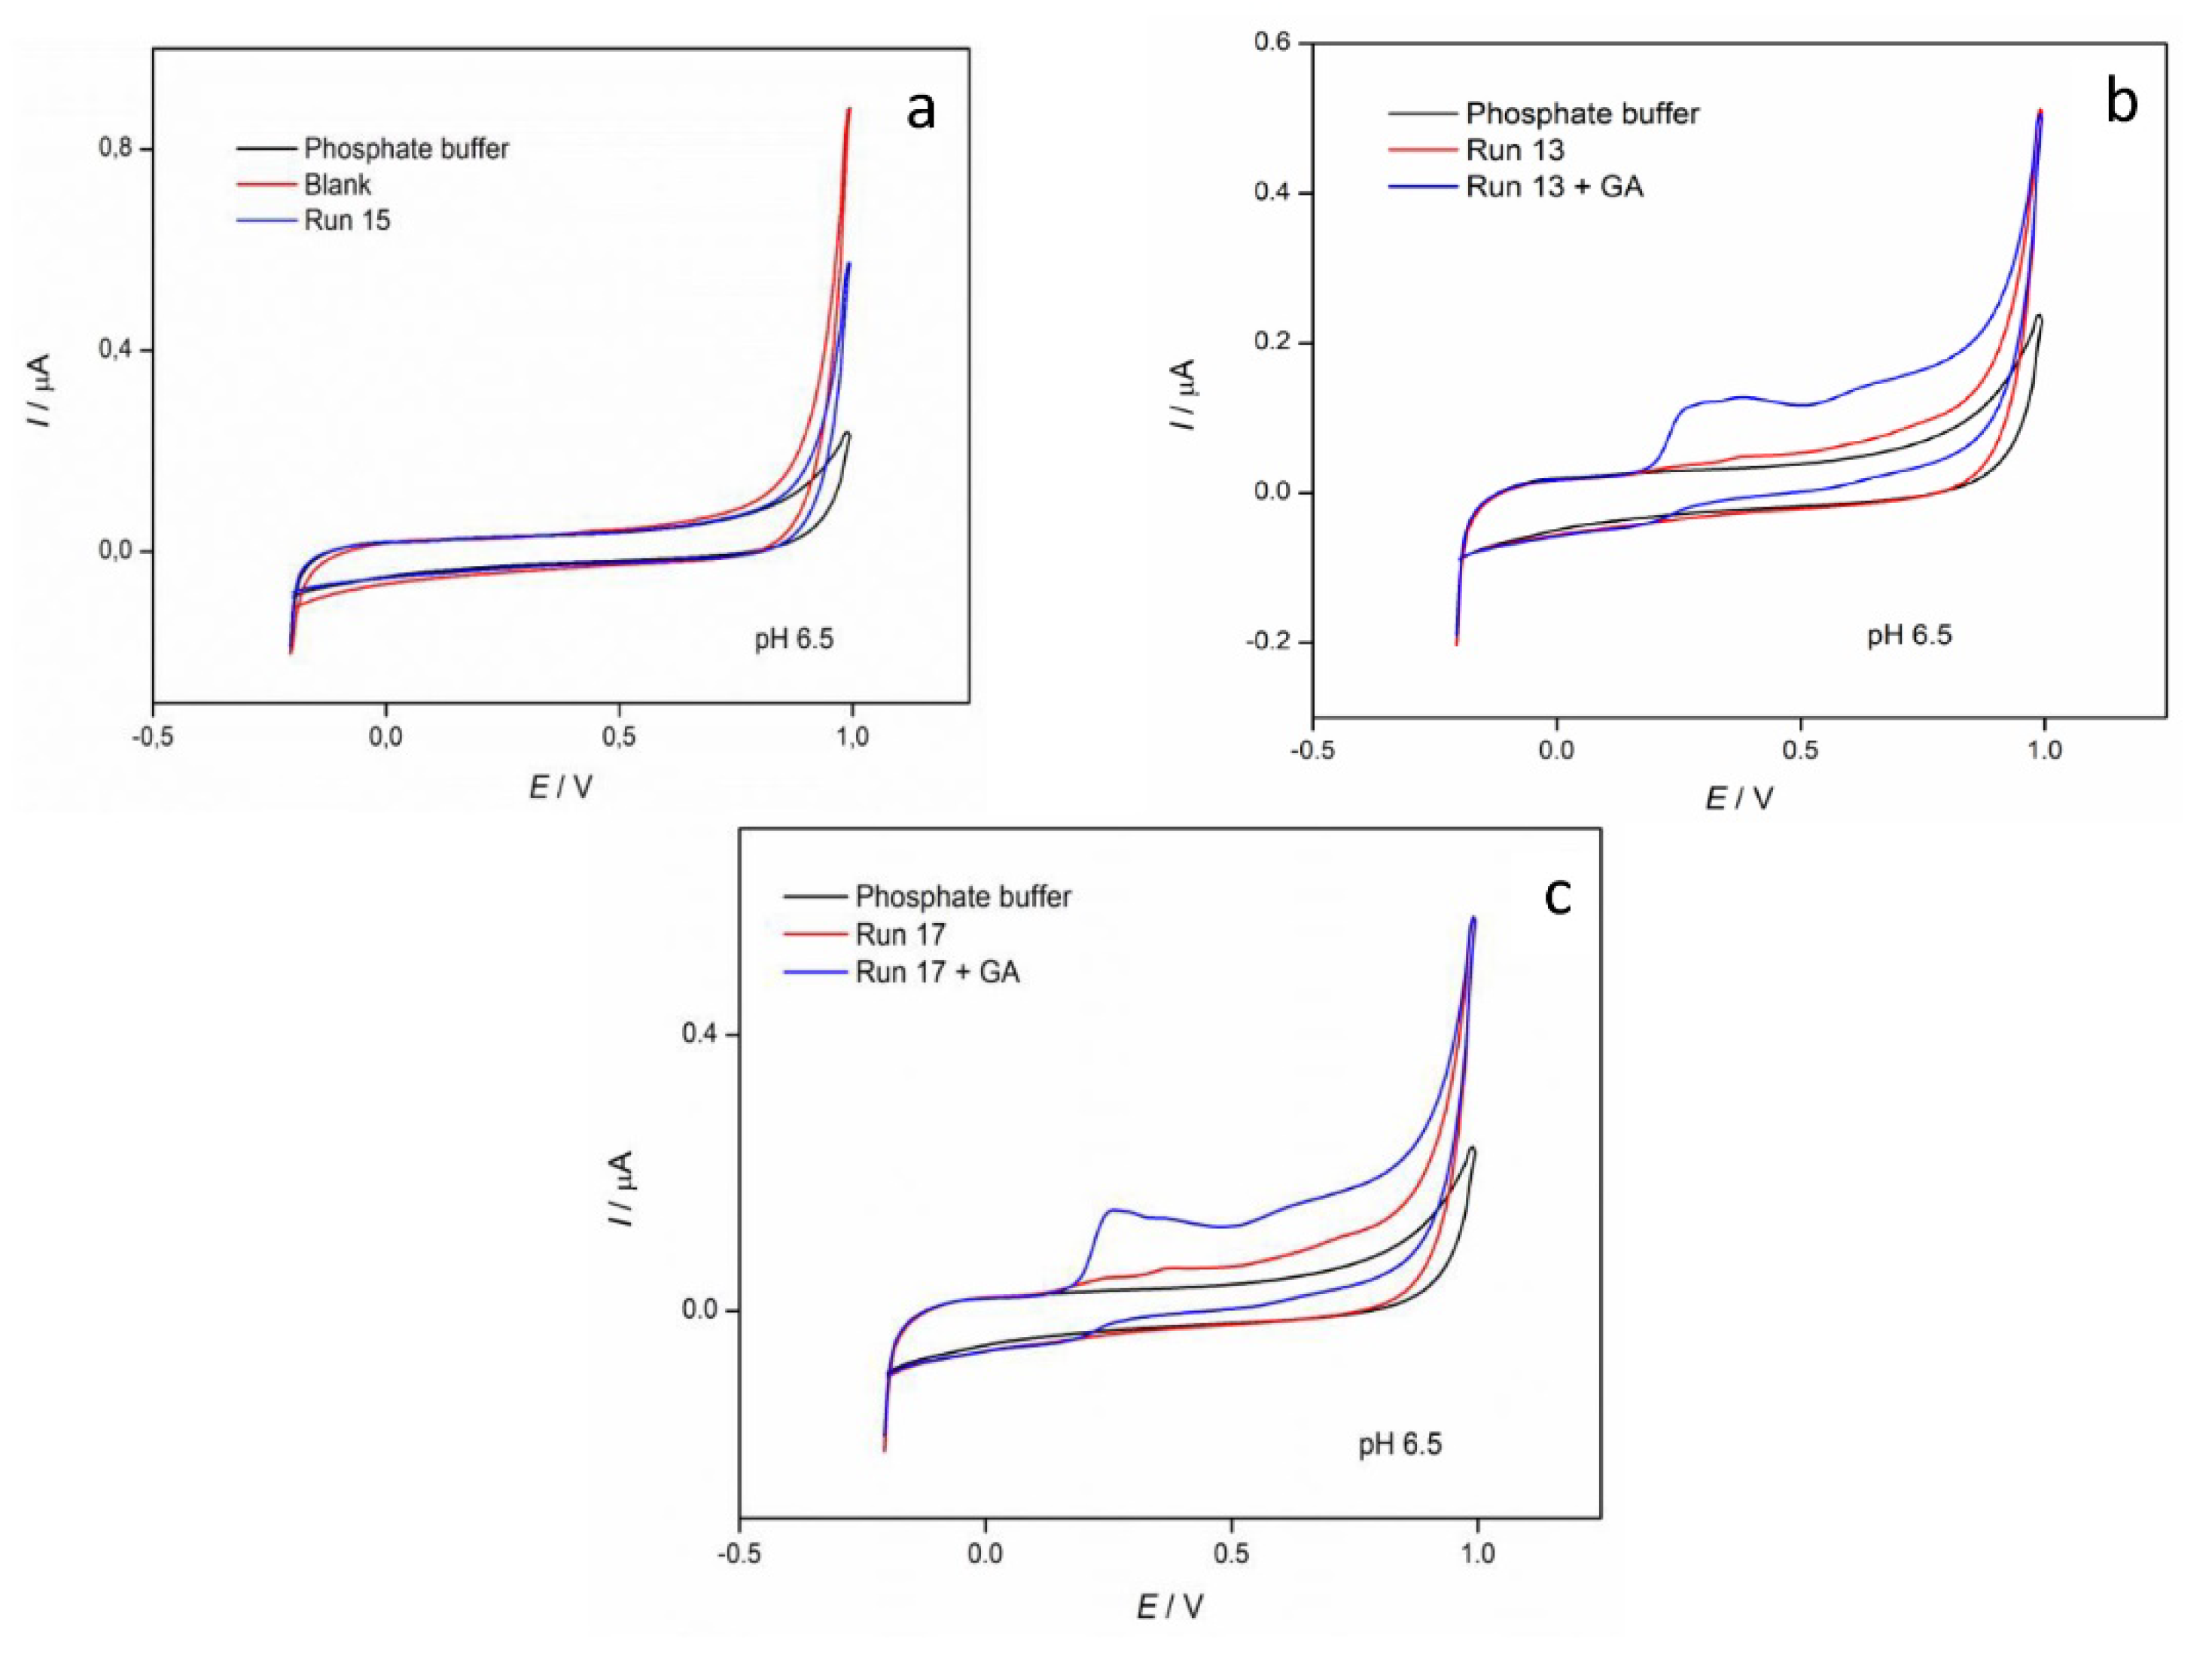
3.4. Cyclic Voltammetry

Cyclic voltammetry was used to detect interactions between gallic acid and calcium oxalate precipitates formed in the calcium oxalate system with the addition of gallic acid. In Figure 7, cyclic voltammograms of calcium oxalate precipitates in three buffer solutions, pH = 5.8 (Figure 7a), 6.5 (Figure 7b) and 7.5 (Figure 7c) are shown. It can be seen that one oxidation peak at the potential, Ep,a = 0.83 V (pH = 5.8), 0.80 V (pH = 6.5) and 0.69 V (pH = 7.5) was detected at all three pH values, which shows that gallic acid (GA) was adsorbed on the calcium oxalate precipitate. The oxidation peak of run 15 was the most pronounced at pH = 5.8, while at higher pH values the oxidation peaks of runs 13 and 17 were more pronounced.
In Figure 8, cyclic voltammograms of gallic acid (c = 1.5 mM) in three buffer solutions and calcium oxalate precipitate (blank sample, runs 13, 15 and 17) with added GA (c = 1.5 mM) in three buffer solutions, pH = 5.8 (Figure 8a), 6.5 (Figure 8b) and 7.5 (Figure 8c) are shown. It can be seen that GA showed two oxidation peaks. The first oxidation peak, Ep,a1, = 0.33 V (pH = 5.8), 0.31 V (pH = 6.5) and 0.21 V (pH = 7.5), which correspond to the oxidation of hydroxyl group in para position and the second oxidation peak, Ep,a2 = 0.63 V (pH = 5.8), 0.62 V (pH = 6.5) and 0.60 V (pH = 7.5), which correspond to the oxidation of hydroxyl group in meta position to carboxyl group [42]. Cyclic voltammograms of calcium oxalate precipitate (blank, runs 13, 15 and 17) showed two oxidation peaks which correspond to the oxidation of GA and a new oxidation peak at the potential Ep,a3 = 0.83 V (pH = 5.8), 0.80 V (pH = 6.5) and 0.69 V (pH = 7.5), which correspond to interactions between GA and the calcium oxalate precipitate [24]. The third oxidation peak of run 13 was the most pronounced at pH = 5.8, while at higher pH values the oxidation peak of run 17 showed a higher oxidation peak.
Cyclic voltammetry was also used to determine whether the GA was adsorbed on the surface of the calcium oxalate precipitate (seeds) or incorporated in the seed. In order to remove the adsorbed GA from the surface of seeds, samples were treated with 13% w/v sodium hypochlorite solution [43]. The precipitates were left to stay for 48 h, centrifuged and the obtained precipitates were washed several times with ultrapure water. Dried precipitates were dissolved in concentrated HCl and analysed in phosphate buffer pH = 6.5. In Figure 9a, cyclic voltammograms of the blank and run 15 samples are shown. Compared to Figure 7b, the oxidation peak of GA at 0.80 V was not visible, which confirms that GA was adsorbed on the surface of the seed in run 15. In Figure 9b, the cyclic voltammogram of run 13, and in Figure 9c of run 17, are shown. One broad shoulder at the 0.34 V is visible in both voltammograms, which can be explained with the capturing of GA in calcium oxalate clusters that was observed in both seed samples. The oxidation peak of GA was confirmed with the addition of GA in both samples (c = 0.02 mM) where a more pronounced broad shoulder was observed at the same potential (E = 0.34 V) in both samples, which confirms that GA was captured in calcium oxalate clusters. The obtained data agree with the literature, since, in pure hydrate form (run 15), the adsorption of GA did not occur, while in the other two runs (runs 15 and 17), where the presence of GA resulted in a mixture of three hydrate forms, gallic acid was captured in the calcium oxalate clusters [22]. It was also observed that, if the proportion of individual hydrates is less than 10%, GA will not be visible in the cyclic voltammogram (Figure S2).

4. Conclusions

Calcium oxalates, as major constituents of kidney stone composition, are still attracting scientific attention as actual mechanisms, and the influence of different chemical substances on the crystal formation are not yet clearly understood. In this study, the influence of temperature, system pH and the presence of gallic acid on the individual hydrate phase of calcium oxalate formation was investigated. By performing the statistical analysis, it was observed that a higher temperature, lower system pH and lower amounts of added gallic acid promoted the formation of the COM hydrate phase of calcium oxalate. However, a lower temperature, higher system pH and higher amounts of added gallic acid favoured the formation of COD. According to the desirability function approach, the optimal conditions for obtaining the maximum content of COM and COD were determined and experimentally verified showing good agreement with the predicted data with suitable deviations of ±5%. The possible interactions and the behaviour of the added gallic acid in the presence of COM and COD were studied by cyclic voltammetry. The results of cyclic voltammetry showed that gallic acid is adsorbed on the surface of the seed in run 15, while in run 13 and run 17, where a mixture of three hydrate forms with more than 10% occurred, gallic acid was captured in the calcium oxalate clusters. Interactions between the blank sample COM and run 15, run 13 and run 17 were confirmed since a new oxidation peak was detected in all investigated samples suspended in phosphate buffer when the cyclic voltammogram of calcium oxalate precipitates with added gallic acid was recorded. This research could represent the first such example of combining the precipitation experiments based on the experimental design and mathematical modelling, and performing the process optimization toward maximizing the content of the two most dominant hydrate phase of calcium oxalate (COM and COD). These findings could contribute to the efficient process optimization towards obtaining specific hydrate phases of calcium oxalate, while elucidating the possible effects of the operating conditions on the crystal formation in the pathological biomineralization of kidney stones.

Supplementary Materials

The following are available online at https://www.mdpi.com/article/10.3390/cryst11080954/s1, Table S1: Thermogravimetric analysis results of the precipitates in systems from runs 1 to 17 and model systems (t0—initial degradation temperature, tmax—temperature of maximum degradation rate, te—end of degradation temperature); Table S2: IR vibration bands (in cm−1) of calcium oxalate standards (calcium oxalate monohydrate (COM), dihydrate (COD) and trihydrate (COT)) [28,29]; Figure S1: SEM images of calcium oxalate hydrates; Figure S2: Cyclic voltammograms of phosphate buffer pH = 6.5 () (a) Run 16 () and Run 16 with added gallic acid (c = 0.02 mM) () (b) calcium oxalate precipitate Blank sample () and Run 4 (). Scan rate 100 mV/s.

Author Contributions

Conceptualization, S.Š., A.S. (Anamarija Stanković) and M.M.-K.; methodology, S.Š., A.S. (Anamarija Stanković) and M.M.-K.; software, S.Š. and S.J.; validation, S.Š., I.D.M. and S.J.; formal analysis, S.Š., A.S. (Anamarija Stanković) and M.M.-K.; investigation, S.G., D.G., N.M.M. and A.S. (Atiđa Selmani); writing—original draft preparation, S.Š., N.M.M., A.S. (Anamarija Stanković) and M.M.-K.; writing—review and editing, S.Š., A.S. (Anamarija Stanković) and M.M.-K.; visualization, S.Š., A.S. (Anamarija Stanković) and M.M.-K.; supervision, A.S. (Anamarija Stanković) and M.M.-K. All authors have read and agreed to the published version of the manuscript.

Funding

M.M.K., A.S. (Anamarija Stanković), D.G. and S.G. acknowledge the financial support of the Department of Chemistry (PPUZN_MMK). I.D.M. acknowledges financial support of the Center of Excellence for Advanced Materials and Sensing Devices (ERDF Grant No. KK.01.1.1.01.0001).

Data Availability Statement

Data are contained within the article.

Conflicts of Interest

The authors declare no conflict of interest.

References

  1. Ivanovski, O.; Drüeke, T.B. A new era in the treatment of calcium oxalate stones? Kidney Int. 2013, 83, 998–1000. [Google Scholar] [CrossRef] [PubMed] [Green Version]
  2. López, M.; Hoppe, B. History, epidemiology and regional diversities of urolithiasis. Pediatr. Nephrol. 2010, 25, 49–59. [Google Scholar] [CrossRef] [PubMed] [Green Version]
  3. Ouyang, J.M.; Duan, L.; Tieke, B. Effects of carboxylic acids on the crystal growth of calcium oxalate nanoparticles in lecithin−water liposome systems. Langmuir 2003, 19, 8980–8985. [Google Scholar] [CrossRef]
  4. Tiselius, H.G.; Hallin, A.; Lindbäck, B. Crystallisation properties in stone forming and normal subjects' urine diluted using a standardised procedure to match the composition of urine in the distal part of the distal tubule and the middle part of the collecting duct. Urol. Res. 2001, 29, 75–82. [Google Scholar] [CrossRef] [PubMed]
  5. Ouyang, J.M. Effects of temperature on growth and aggregation of calcium oxalate in presence of various carboxylic acids in silica gel systems. Mater. Sci. Eng. C 2006, 26, 679–682. [Google Scholar] [CrossRef]
  6. De Bellis, R.; Piacentini, M.P.; Meli, M.A.; Mattioli, M.; Menotta, M.; Mari, M.; Valentini, L.; Palomba, L.; Desideri, D.; Chiarantini, L. In vitro effects on calcium oxalate crystallization kinetics and crystal morphology of an aqueous extract from Ceterach officinarum: Analysis of a potential antilithiatic mechanism. PLoS ONE 2019, 14, e0218734. [Google Scholar] [CrossRef] [Green Version]
  7. Yu, K.; Wen, X.L.; Ding, Y.M.; Ouyang, J.M. Adsorption differences of acidic, neutral and alkaline amino acids onto nano/micron COM and COD crystals. Adv. Mater. Technol. 2017, 175–180. [Google Scholar] [CrossRef]
  8. Qiu, S.R.; Wierzbicki, A.; Orme, C.A.; Cody, A.M.; Hoyer, J.R.; Nancollas, G.H.; Zepeda, S.; De Yoreo, J.J. Molecular modulation of calcium oxalate crystallization by osteopontin and citrate. Proc. Natl. Acad. Sci. USA 2004, 101, 1811–1815. [Google Scholar] [CrossRef] [Green Version]
  9. Brown, P.; Ackermann, D.; Finlayson, B. Calcium oxalate dihydrate (weddellite) precipitation. J. Cryst. Growth 1989, 98, 285–292. [Google Scholar] [CrossRef]
  10. Ou, Y.; Xue, J.F.; Tan, C.Y.; Gui, B.S.; Sun, X.Y.; Ouyang, J.M. Inhibition of urinary macromolecule heparin on aggregation of nano-COM and nano-COD crystals. Molecules 2015, 20, 1626–1642. [Google Scholar] [CrossRef] [PubMed] [Green Version]
  11. Ouyang, J.M.; Zheng, H.; Deng, S.P. Simultaneous formation of calcium oxalate (mono-, di-, and trihydrate) induced by potassium tartrate in gelatinous system. J. Cryst. Growth 2006, 293, 118–123. [Google Scholar] [CrossRef]
  12. Basavaraj, D.R.; Biyani, C.S.; Browning, A.J.; Cartledge, J.J. The role of urinary kidney stone inhibitors and promoters in the pathogenesis of calcium containing renal stones. EAU-EBU Update Ser. 2007, 5, 126–136. [Google Scholar] [CrossRef]
  13. Bouatia, M.; Benzeid, H.; Idrissi, M.O.B.; Benramdane, L.; Draoui, M. In vitro effect of acetylsalicylic acid on calcium oxalate crystallization: An approach to antilithiasis. Int. J. Pharm. Pharmaceut. Sci. 2015, 7, 329–331. [Google Scholar]
  14. Spivacow, F.R.; Negri, A.L.; Polonsky, A.; Del Valle, E.E. Long-term treatment of renal lithiasis with potassium citrate. Urology 2010, 76, 1346–1349. [Google Scholar] [CrossRef] [PubMed]
  15. Kvsrg, P.; Sujatha, D.; Bharathi, K. Herbal drugs in urolithiasis—A review. Pharmacog. Rev. 2007, 1, 175–178. [Google Scholar]
  16. Choubey, A.; Parasar, A.; Choubey, A.; Iyer, D.; Pawar, R.S.; Patil, U.K. Potential of medicinal plants in kidney, gall and urinary stones. Int. J. Drug. Dev. Res. 2010, 2, 431–447. [Google Scholar]
  17. Tiwari, A.H.; Soni, V.B.; Londhe, V.; Bhandarkar, A.; Bandawane, D.; Nipate, S. An overview on potent indigenous herbs for urinary tract infirmity: Urolithiasis. Asian J. Pharm. Clin. Res. 2012, 5, 7–12. [Google Scholar]
  18. Chitme, H.R.; Alok, S.; Jain, S.K.; Sabharwal, M. Herbal treatment for urinary stones. Int. J Pharm. Sci. Res. 2010, 1, 24–31. [Google Scholar] [CrossRef]
  19. Chu, Y.F.; Sun, J.I.E.; Wu, X.; Liu, R.H. Antioxidant and antiproliferative activities of common vegetables. J. Agric. Food Chem. 2002, 50, 6910–6916. [Google Scholar] [CrossRef] [PubMed]
  20. Kratz, J.M.; Andrighetti-Fröhner, C.R.; Leal, P.C.; Nunes, R.J.; Yunes, R.A.; Trybala, E.; Bergström, T.; Barardi, C.R.M.; Simões, C.M.O. Evaluation of anti-HSV-2 activity of gallic acid and pentyl gallate. Biol. Pharm. Bull. 2008, 31, 903–907. [Google Scholar] [CrossRef] [Green Version]
  21. Kang, M.S.; Oh, J.S.; Kang, I.C.; Hong, S.J.; Choi, C.H. Inhibitory effect of methyl gallate and gallic acid on oral bacteria. J. Microbiol. 2008, 46, 744–750. [Google Scholar] [CrossRef] [PubMed]
  22. Li, S.; Tang, W.; Shi, P.; Li, M.; Sun, J.; Gong, J. A New Perspective of Gallic Acid on Calcium Oxalate Nucleation. Cryst. Growth Des. 2020, 20, 3173–3181. [Google Scholar] [CrossRef]
  23. Šter, A.; Šafranko, S.; Bilić, K.; Marković, B.; Kralj, D. The effect of hydrodynamic and thermodynamic factors and the addition of citric acid on the precipitation of calcium oxalate dihydrate. Urolithiasis 2018, 46, 243–256. [Google Scholar] [CrossRef] [PubMed]
  24. Stanković, A.; Šafranko, S.; Jurišić, K.; Balić, I.; Bijelić, J.; Jokić, S.; Medvidović-Kosanović, M. Investigation of system complexity and addition of vitamin C on calcium oxalate precipitation. Chem. Pap. 2020, 74, 3279–3291. [Google Scholar] [CrossRef]
  25. Stanković, A.; Šafranko, S.; Kontrec, J.; Njegić Džakula, B.; Lyons, D.M.; Marković, B.; Kralj, D. Calcium oxalate precipitation in model systems mimicking the conditions of hyperoxaluria. Cryst. Res. Technol. 2019, 54, 1800210. [Google Scholar] [CrossRef]
  26. Echigo, T.; Kimata, M.; Kyono, A.; Shimizu, M.; Hatta, T. Re-investigation of the crystal structure of whewellite [Ca(C2O4)· H2O] and the dehydration mechanism of caoxite [Ca(C2O4)·3H2O]. Mineral. Mag. 2005, 69, 77–88. [Google Scholar] [CrossRef]
  27. Kaloustian, J.; El-Moselhy, T.F.; Portugal, H. Determination of calcium oxalate (mono-and dihydrate) in mixtures with magnesium ammonium phosphate or uric acid: The use of simultaneous thermal analysis in urinary calculi. Clin. Chim. Acta 2003, 334, 117–129. [Google Scholar] [CrossRef]
  28. Maurice-Estepa, L.; Levillain, P.; Lacour, B.; Daudon, M. Advantage of zero-crossing-point first-derivative spectrophotometry for the quantification of calcium oxalate crystalline phases by infrared spectrophotometry. Clin. Chim. Acta 2000, 298, 1–11. [Google Scholar] [CrossRef]
  29. Conti, C.; Casati, M.; Colombo, C.; Realini, M.; Brambilla, L.; Zerbi, G. Phase transformation of calcium oxalate dihydrate–monohydrate: Effects of relative humidity and new spectroscopic data. Spectrochim. Acta Part A Mol. Biomol. Spectrosc. 2014, 128, 413–419. [Google Scholar] [CrossRef]
  30. Girija, E.K.; Latha, S.C.; Kalkura, S.N.; Subramanian, C.; Ramasamy, P. Crystallization and microhardness of calcium oxalate monohydrate. Mater. Chem. Phys. 1998, 52, 253–257. [Google Scholar] [CrossRef]
  31. Petit, I.; Belletti, G.D.; Debroise, T.; Llansola-Portoles, M.J.; Lucas, I.T.; Leroy, C.; Bonhomme, C.; Bonhomme-Coury, L.; Bazin, D.; Daudon, M.; et al. Vibrational signatures of calcium oxalate polyhydrates. ChemistrySelect 2018, 3, 8801–8812. [Google Scholar] [CrossRef]
  32. King, M.; McClure, W.F.; Andrews, L.C.; Holomery, M.A. Powder Diffraction File Alphabetic Index, Inorganic Phases/Organic Phases; International Center for Diffraction Data: Newtown Square, PA, USA, 1992. [Google Scholar]
  33. Izatulina, A.R.; Gurzhiy, V.V.; Krzhizhanovskaya, M.G.; Kuz’mina, M.A.; Leoni, M.; Frank-Kamenetskaya, O.V. Hydrated calcium oxalates: Crystal structures, thermal stability, and phase evolution. Cryst. Growth Des. 2018, 18, 5465–5478. [Google Scholar] [CrossRef]
  34. Chen, Z.; Wang, C.; Zhou, H.; Sang, L.; Li, X. Modulation of calcium oxalate crystallization by commonly consumed green tea. CrystEngComm 2010, 12, 845–852. [Google Scholar] [CrossRef]
  35. East, C.P.; Wallace, A.D.; Al-Hamzah, A.; Doherty, W.O.; Fellows, C.M. Effect of poly (acrylic acid) molecular mass and end-group functionality on calcium oxalate crystal morphology and growth. J. Appl. Polym. Sci. 2010, 115, 2127–2135. [Google Scholar] [CrossRef]
  36. Stanković, A.; Kontrec, J.; Džakula, B.N.; Kovačević, D.; Marković, B.; Kralj, D. Preparation and characterization of calcium oxalate dihydrate seeds suitable for crystal growth kinetic analyses. J. Cryst. Growth 2018, 500, 91–97. [Google Scholar] [CrossRef]
  37. Ouyang, J.; Deng, S.; Li, X.; Tan, Y.; Bernd, T. Effects of temperature and sodium carboxylate additives on mineralization of calcium oxalate in silica gel systems. Sci. China Ser. B Chem. 2004, 47, 311–319. [Google Scholar] [CrossRef]
  38. Yuzawa, M.; Tozuka, K.; Tokue, A. Effect of citrate and pyrophosphate on the stability of calcium oxalate dihydrate. Urol. Res. 1998, 26, 83–88. [Google Scholar] [CrossRef]
  39. Carvalho, M. Urinary pH in calcium oxalate stone formers: Does it matter? J. Bras. Nefrol. 2018, 40, 6–7. [Google Scholar] [CrossRef] [Green Version]
  40. Grases, F.; Costa-Bauza, A.; Prieto, R.M. Renal lithiasis and nutrition. Nutr. J. 2006, 5, 1–7. [Google Scholar] [CrossRef] [Green Version]
  41. Manissorn, J.; Fong-Ngern, K.; Peerapen, P.; Thongboonkerd, V. Systematic evaluation for effects of urine pH on calcium oxalate crystallization, crystal-cell adhesion and internalization into renal tubular cells. Sci. Rep. 2017, 7, 1–11. [Google Scholar] [CrossRef]
  42. Su, Y.L.; Cheng, S.H. Sensitive and selective determination of gallic acid in green tea samples based on an electrochemical platform of poly (melamine) film. Anal. Chim. Acta 2015, 901, 41–50. [Google Scholar] [CrossRef] [PubMed]
  43. Kim, Y.Y.; Carloni, J.D.; Demarchi, B.; Sparks, D.; Reid, D.G.; Kunitake, M.E.; Tang, C.C.; Duer, M.J.; Freeman, C.L.; Pokroy, B.; et al. Tuning hardness in calcite by incorporation of amino acids. Nat. Mater. 2016, 15, 903–910. [Google Scholar] [CrossRef] [PubMed] [Green Version]
Figure 1. Thermal curves of calcium oxalate samples.
Crystals 11 00954 g001
Figure 2. (a) XRD diffraction diagrams and (b) FTIR spectra of precipitated systems; Blank, Run 13, Run 17 and Run 15. The standard diffraction spectra and the main reflections of COD (up) and COM (down) are shown for comparison. The standard vibrations bands for COD (up) and COM (down) are also shown.
Crystals 11 00954 g002
Figure 3. SEM of various morphological types of calcium oxalate.(a) Blank, (b) Run 17, (c) Run 13 and (d) Run 15.
Crystals 11 00954 g003
Figure 4. 3D plots of the influence of individual parameters and their interactions: (a) temperature (X1) and system pH (X2), (b) temperature (X1) and added gallic acid (X3), (c) system pH (X2) and added gallic acid (X3) on the COM content response (y).
Crystals 11 00954 g004
Figure 5. 3D diagrams of the effects of individual parameters and their interactions: (a) temperature (X1) and system pH (X2), (b) temperature (X1) and added gallic acid (X3), (c) system pH (X2) and added gallic acid (X3) on the COD content response (y).
Crystals 11 00954 g005
Figure 6. XRD diffractograms of the samples (a) COM, and (c) COD obtained under optimal conditions; SEM images of (b) COM obtained under optimal conditions, and (d) COD obtained under optimal conditions.
Crystals 11 00954 g006
Figure 7. Cyclic voltammograms of calcium oxalate precipitate (Blank (), Run 15 (), Run 13 (), Run 17 ()) in phosphate buffer solutions pH = 5.8 (a), 6.5 (b) and 7.5 (c). Scan rate 100 mV/s.
Crystals 11 00954 g007
Figure 8. Cyclic voltammograms of GA (c = 1.5 mM) (―) and calcium oxalate precipitate (Blank (), Run 15 (), Run 13 (), Run 17 ()) with added GA (c = 1.5 mM) in phosphate buffer solutions pH = 5.8 (a), 6.5 (b) and 7.5 (c). Scan rate 100 mV/s.
Crystals 11 00954 g008
Figure 9. Cyclic voltammograms of phosphate buffer pH = 6.5 (―) and (a) calcium oxalate precipitate (Blank () and Run 15 (), (b) Run 13 () and Run 13 with added gallic acid (GA) (c = 0.02 mM) (), (c) Run 17 () and Run 17 with added gallic acid (GA) (c = 0.02 mM) (). Scan rate 100 mV/s.
Crystals 11 00954 g009
Table 1. RSM design using the uncoded and coded levels of independent variables for the preparation of individual calcium oxalate hydrate phase (dependent variable; y).
Independent VariableSymbolLevel
Low (−1)Center (0)High (+1)
Temperature (°C)X12536.548
System pHX25.66.557.5
Added Gallic Acid (mg)X31005501000
Table 2. Experimental Box–Behnken design and identification of each individual calcium oxalate hydrate phase by XRD technique, presented as response or dependent variable (y).
Operating ParametersResponse
RunTemperatureSystem pHAdded Gallic AcidCOMCODCOT
°C mg%
136.55.60100093.680.026.30
248.06.5510094.995.000.01
348.05.6055093.951.284.77
425.06.5510006.5390.512.96
525.05.6055095.662.941.40
648.07.5055091.478.530.01
736.55.6010096.733.030.24
825.06.5510090.286.303.42
936.56.5555071.2515.6113.15
1036.56.5555074.0811.7514.17
1136.56.5555077.3212.4110.27
1236.56.5555075.3612.9711.67
1348.06.55100050.130.4549.42
1436.57.5010008.0091.610.39
1525.07.505500.3499.320.34
1636.57.5010085.9714.020.02
1736.56.5555076.0812.5511.37
Publisher’s Note: MDPI stays neutral with regard to jurisdictional claims in published maps and institutional affiliations.

